
 Open Access Article
 This Open Access Article is licensed under a Creative Commons Attribution-Non Commercial 3.0 Unported Licence
Enhanced penetrative siRNA delivery by a nanodiamond drug delivery platform against hepatocellular carcinoma 3D models†
Jingru
Xu
ab,
Mengjie
Gu
ab,
Lissa
Hooi
b,
Tan Boon
Toh
c,
Dexter Kai Hao
Thng
b,
Jhin Jieh
Lim
b and
Edward Kai-Hua
Chow
 *abcdef
aCancer Science Institute of Singapore, National University of Singapore, 117599, Singapore. E-mail: csikce@nus.edu.sg
bDepartment of Pharmacology, Yong Loo Lin School of Medicine, National University of Singapore, 117600, Singapore
cThe N.1 Institute for Health, National University of Singapore, 117456, Singapore
dDepartment of Biomedical Engineering, National University of Singapore, 117583, Singapore
eNUS Center for Cancer Research (N2CR), Yong Loo Lin School of Medicine, National University Singapore, Singapore
fThe Institute for Digital Medicine (WisDM), Yong Loo Lin School of Medicine, National University of Singapore, 117456, Singapore
First published on 20th September 2021
Abstract
Small interfering RNA (siRNA) can cause specific gene silencing and is considered promising for treating a variety of cancers, including hepatocellular carcinoma (HCC). However, siRNA has many undesirable physicochemical properties that limit its application. Additionally, conventional methods for delivering siRNA are limited in their ability to penetrate solid tumors. In this study, nanodiamonds (NDs) were evaluated as a nanoparticle drug delivery platform for improved siRNA delivery into tumor cells. Our results demonstrated that ND-siRNA complexes could effectively be formed through electrostatic interactions. The ND-siRNA complexes allowed for efficient cellular uptake and endosomal escape that protects siRNA from degradation. Moreover, ND delivery of siRNA was more effective at penetrating tumor spheroids compared to liposomal formulations. This enhanced penetration capacity makes NDs ideal vehicles to deliver siRNA against solid tumor masses as efficient gene knockdown and decreased tumor cell proliferation were observed in tumor spheroids. Evaluation of ND-siRNA complexes within the context of a 3D cancer disease model demonstrates the potential of NDs as a promising gene delivery platform against solid tumors, such as HCC.
Introduction
Liver cancer is the sixth most common cancer and the third leading cause of cancer-related deaths worldwide in 2020.1 Hepatocellular carcinoma (HCC) is the most common type of primary liver cancer with limited treatment options.2 Based on the tumor stage as well as the degree of liver function impairment, different treatment strategies are applied. Early stage HCC patients with preserved liver function are able to receive treatment including surgical resection, liver transplantation and ablation, with proven survival benefits.3 Unfortunately, most cases of HCC are diagnosed at more advanced stages where treatment options are limited to drugs, such as sorafenib and regorafenib, and the prognosis continues to remain poor.4 While immune checkpoint inhibitors, including anti-PD-1 (programmed cell death protein 1) antibodies, anti-PD-L1 (programmed cell death 1 ligand 1) antibodies and anti-CTLA-4 (cytotoxic T-lymphocyte-associated protein 4) antibodies, have been recently explored for use in HCC, these continue to be limited in clinical application to specific second-line therapies and require further development.5 Though diverse oncogenes are involved in HCC development, many of them are considered as undruggable due to their disordered structure lacking binding sites or having an essential physiological function in normal cells, for example, Myc.6,7 Different strategies are applied to overcome the challenges, such as synthetic lethality that counts on gene pairs.8 Alternatively, gene therapy has attracted increasing attention due to the capability of specifically controlling the expression of disease-related proteins.Spalt-like transcription factor 4 (SALL4) is a key factor for self-renewal and pluripotency maintenance in embryonic stem cells. The expression level of SALL4 normally decreases during human development and silences in mature tissue. The aberrant re-expression of SALL4 has been reported to be involved in various types of cancers.9,10 In adult liver, SALL4 is silenced but in HCC it is often reactivated and has been considered as a biomarker and potential therapeutic target in HCC.11 However, there is currently no approved drug to target SALL4.
Small interfering RNA (siRNA) is a short double-stranded RNA molecule, which has been widely used as a tool for gene inhibition by targeting specific complementary mRNA strands and then inducing mRNA degradation.12–14 However, poor physicochemical and pharmacological properties, such as instability, innate immune responses, and anionic and hydrophilic properties, currently limit its clinical applications.15 Therefore, several delivery systems have been developed to solve the challenges of nucleic acid delivery, such as lipid-based systems,16–18 polymer-based systems,19–24 aptamer-based systems25–29 and inorganic systems.30–34 Many of these systems have proven useful, particularly in targeting cells and tissues readily accessible by the circulatory system. Among them, lipid nanoparticles, especially lipoplexes (LPX), which are cationic lipid/nucleic acid complexes, are the most widely used formulation-based delivery systems. Nevertheless, poor penetrance in solid disease tissue, such as solid tumors, limits their applications. Although the first approved siRNA drugs are formulated by lipid nanoparticles, in clinical studies, their knockdown efficiency in solid tumors is relatively low (<10% knockdown efficiency in mRNA levels, 0.7 to 1 mg kg−1).35,36
Besides lipid-based nanoparticles, inorganic nanoparticles have also been widely exploited. Gold nanorods (GNRs) possess strong near-infrared (NIR) absorption and high photothermal conversion efficiency, giving them unique advantages in gene delivery. For example, the GNR delivery platform can control the release of nucleic acid through light triggering or thermal induction.37 Also, GNRs can induce endosomal disruption when NIR irradiation was applied,38,39 which is essential for nucleic acid delivery. In addition, GNRs are a multi-functional platform that can combine photothermal therapy and drug delivery in one nanomaterial.
Carbon nanomaterials have been successfully used as siRNA vectors as well,40–42 such as nanodiamonds. A single nanodiamond (ND) is a truncated octahedron carbon nanoparticle with a diameter of approximately 5 nm,43,44 but it tends to aggregate tightly in the diameter range of 100–200 nm with a desirable aqueous dispersion.45 This aggregate size, however, meets the particle size requirements of nanoscale drug delivery systems and is of importance for enhanced tumor targeting.46 With various functional groups on the surface, NDs can link with drug molecules through chemical conjugation. They can also bind with certain drugs through noncovalent interactions because they possess high surface area-to-volume ratios and unique surface electrostatic fields, consisting of eight square facets with a positive charge, three hexagonal facets with a negative charge, and three hexagonal facets with an intermediate charge.47,48 Moreover, the preparation process of ND–drug complexes is facile, readily reproducible, and inexpensive, making them more suitable than other nanomaterials for scale-up production and further translation to the clinic. Furthermore, they are highly biocompatible with low toxicity, having been shown to be well tolerated in various biological systems.49,50 These properties have been leveraged towards the use of NDs as a platform to deliver a wide range of therapeutic and diagnostic reagents, including chemotherapy drugs,51–57 peptides,58–61 imaging agents62–64 and genetic materials.65–72 In cancer, ND-drugs have shown enhanced therapeutic efficacy in a wide range of in vitro and in vivo cancer models, including liver cancer,53,58,73 pancreatic cancer,55,57 breast cancer74 and Ewing sarcoma.75 Polyglycerol-functionalized nanodiamonds (ND-PG) conjugated with Cy7 and showed preferential accumulation in the tumors rather than the organs when the nanoparticles were systemically administered into tumor-bearing mice.76
Given the potential advantages of ND drug delivery against solid cancer, such as HCC, we evaluated NDs as an siRNA therapy delivery platform within the context of 3D cancer disease modelling. ND-siRNA complexes showed enhanced cellular uptake and retention compared to liposomal formulations and were able to escape from endosomes to avoid intracellular degradation. Most importantly, ND-siRNA complexes were able to more deeply penetrate into tumor spheroids, resulting in enhanced knockdown efficiency and in vitro therapeutic efficacy. Three-dimensional (3D) disease modelling analysis of ND-siRNA demonstrates the potential of NDs as a promising gene delivery platform in solid tumors.
Results and discussion
Preparation, physicochemical characterization, and in vitro release profile of ND-siRNA complexes
As illustrated in Fig. 1A, negatively charged Cy3-siRNA was bound with a positively charged ND through electrostatic interactions. Of note, different weight ratios of ND to siRNA (100![[thin space (1/6-em)]](https://www.rsc.org/images/entities/char_2009.gif) :1, 50:1, 20:1, 10:1, 5:1) were used to identify the optimal preparation condition. Loading efficiency and surface loading capacity were determined by fluorescence spectroscopy analysis. In general, as the weight ratio of ND:siRNA decreased, which means more siRNA was added onto NDs, the loading efficiency of siRNA decreased while the surface loading capacity of NDs increased (Fig. 1C). DLS analysis revealed that, when the zeta potential of complexes was close to neutral, the size of complexes became dramatically large due to the lack of charge repulsion, which led to aggregation (Fig. 1B). When more siRNA was added, the zeta potential of complexes became negative and the size decreased due to repulsion force. A weight ratio of 50:1 was selected for subsequent experiments due to positive zeta potential, relatively small size and high loading efficiency. It is also worth noting that the optimal weight ratio of ND:siRNA for different siRNA sequences may differ, likely because of variable surface charges and affinity to NDs amongst different siRNA sequences. For the SALL4 siRNA used in later experiments, the optimal weight ratio is 20:1 (according to Table S1†). Transmission electron microscopy (TEM) images of NDs before and after binding with siRNA showed the surface structure of particles. As displayed in Fig. 2A, ND and ND-siRNA particles both showed a small and uniform size with a clear lattice structure on the surface. TEM images at low magnification are also shown in Fig. S2(C) and (D)† to observe the aggregation state of NDs and ND-siRNA, which corresponded to the particle size distribution by DLS measurement.
:1, 50:1, 20:1, 10:1, 5:1) were used to identify the optimal preparation condition. Loading efficiency and surface loading capacity were determined by fluorescence spectroscopy analysis. In general, as the weight ratio of ND:siRNA decreased, which means more siRNA was added onto NDs, the loading efficiency of siRNA decreased while the surface loading capacity of NDs increased (Fig. 1C). DLS analysis revealed that, when the zeta potential of complexes was close to neutral, the size of complexes became dramatically large due to the lack of charge repulsion, which led to aggregation (Fig. 1B). When more siRNA was added, the zeta potential of complexes became negative and the size decreased due to repulsion force. A weight ratio of 50:1 was selected for subsequent experiments due to positive zeta potential, relatively small size and high loading efficiency. It is also worth noting that the optimal weight ratio of ND:siRNA for different siRNA sequences may differ, likely because of variable surface charges and affinity to NDs amongst different siRNA sequences. For the SALL4 siRNA used in later experiments, the optimal weight ratio is 20:1 (according to Table S1†). Transmission electron microscopy (TEM) images of NDs before and after binding with siRNA showed the surface structure of particles. As displayed in Fig. 2A, ND and ND-siRNA particles both showed a small and uniform size with a clear lattice structure on the surface. TEM images at low magnification are also shown in Fig. S2(C) and (D)† to observe the aggregation state of NDs and ND-siRNA, which corresponded to the particle size distribution by DLS measurement.
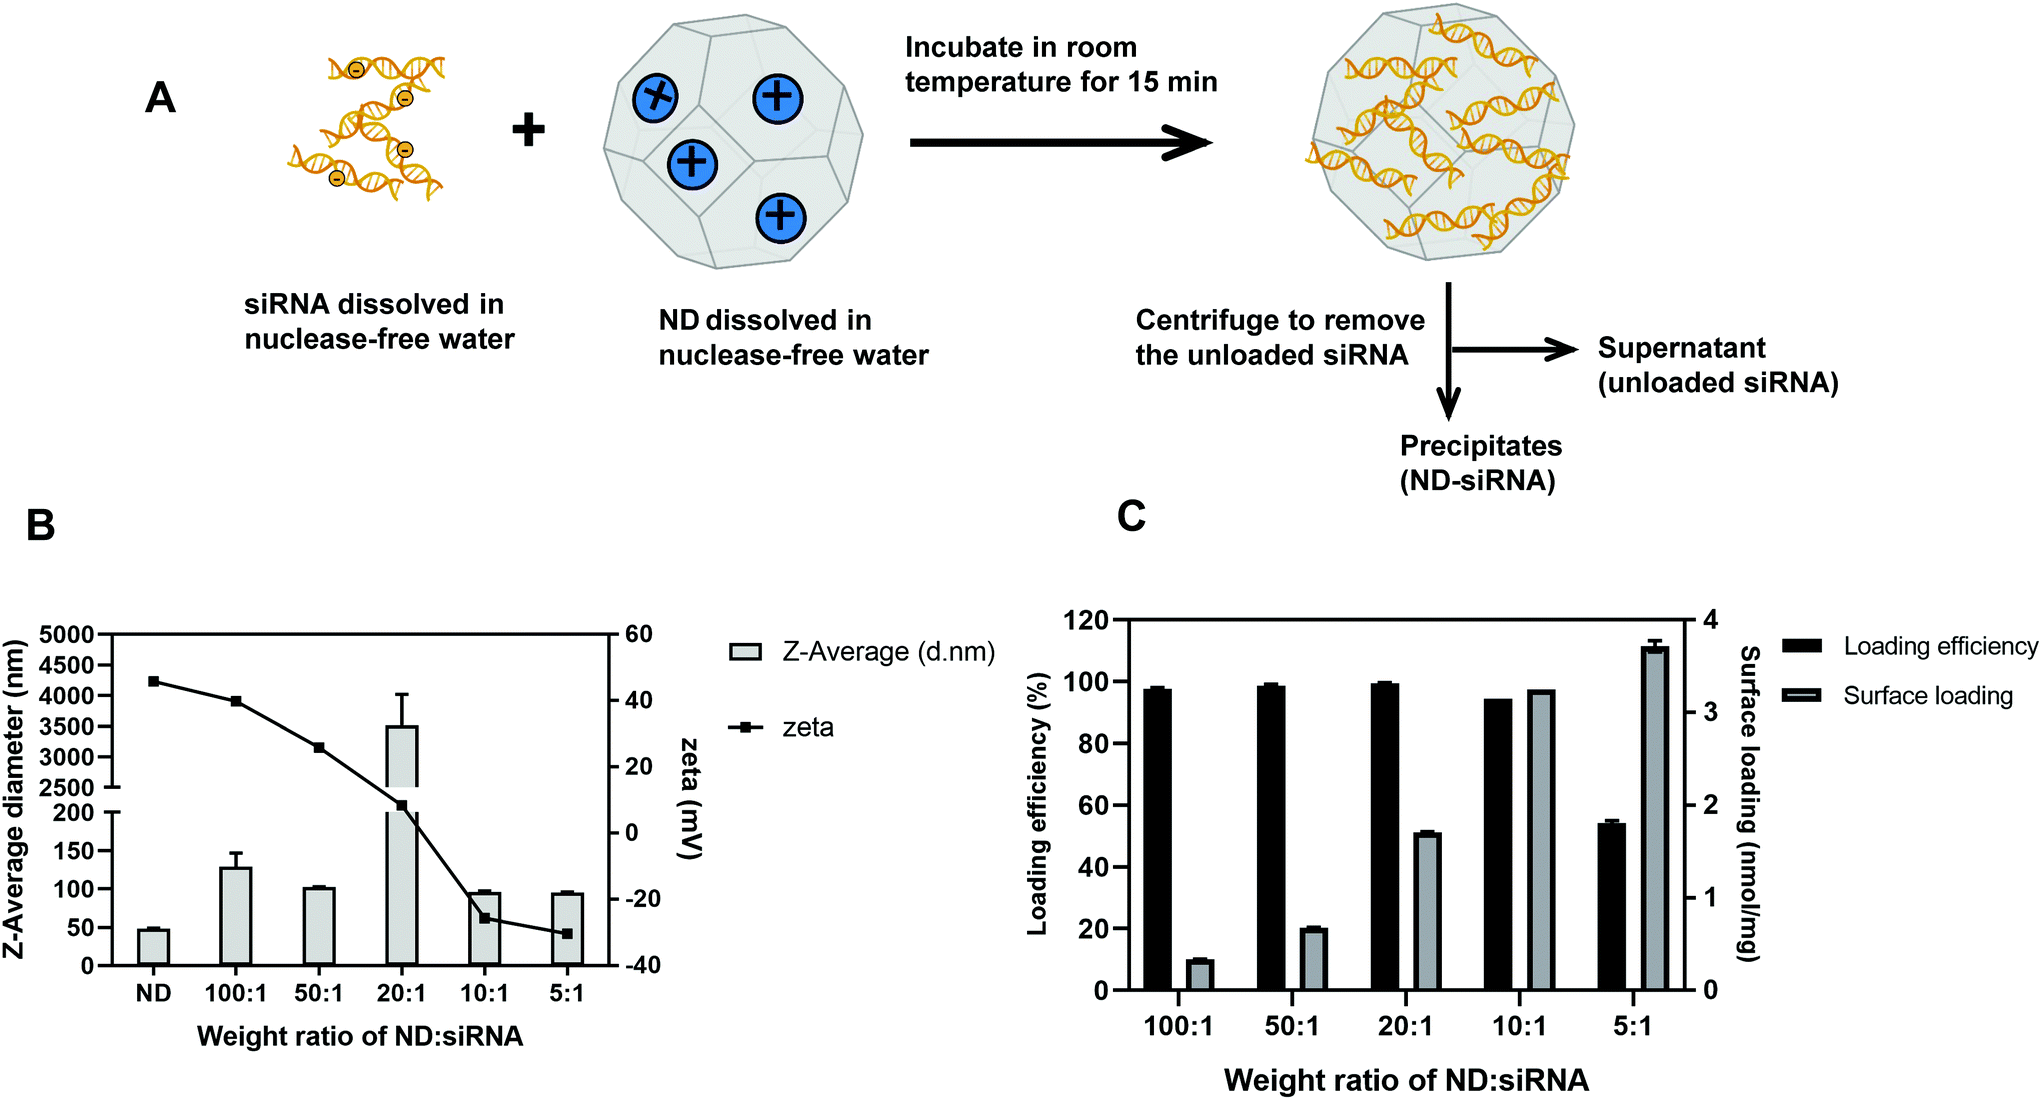 | ||
| Fig. 1 Preparation and characterization of ND-siRNA (Cy3-labelled siRNA) complexes. (A) Schematic diagram of preparing ND-siRNA complexes through electrostatic interactions. (B) Particle size and zeta potential of ND-siRNA complexes in different weight ratios of ND:siRNA. (C) Loading efficiency (%) and surface loading capacity (nmol siRNA per mg ND) of ND-siRNA complexes in different weight ratios of ND:siRNA. | ||
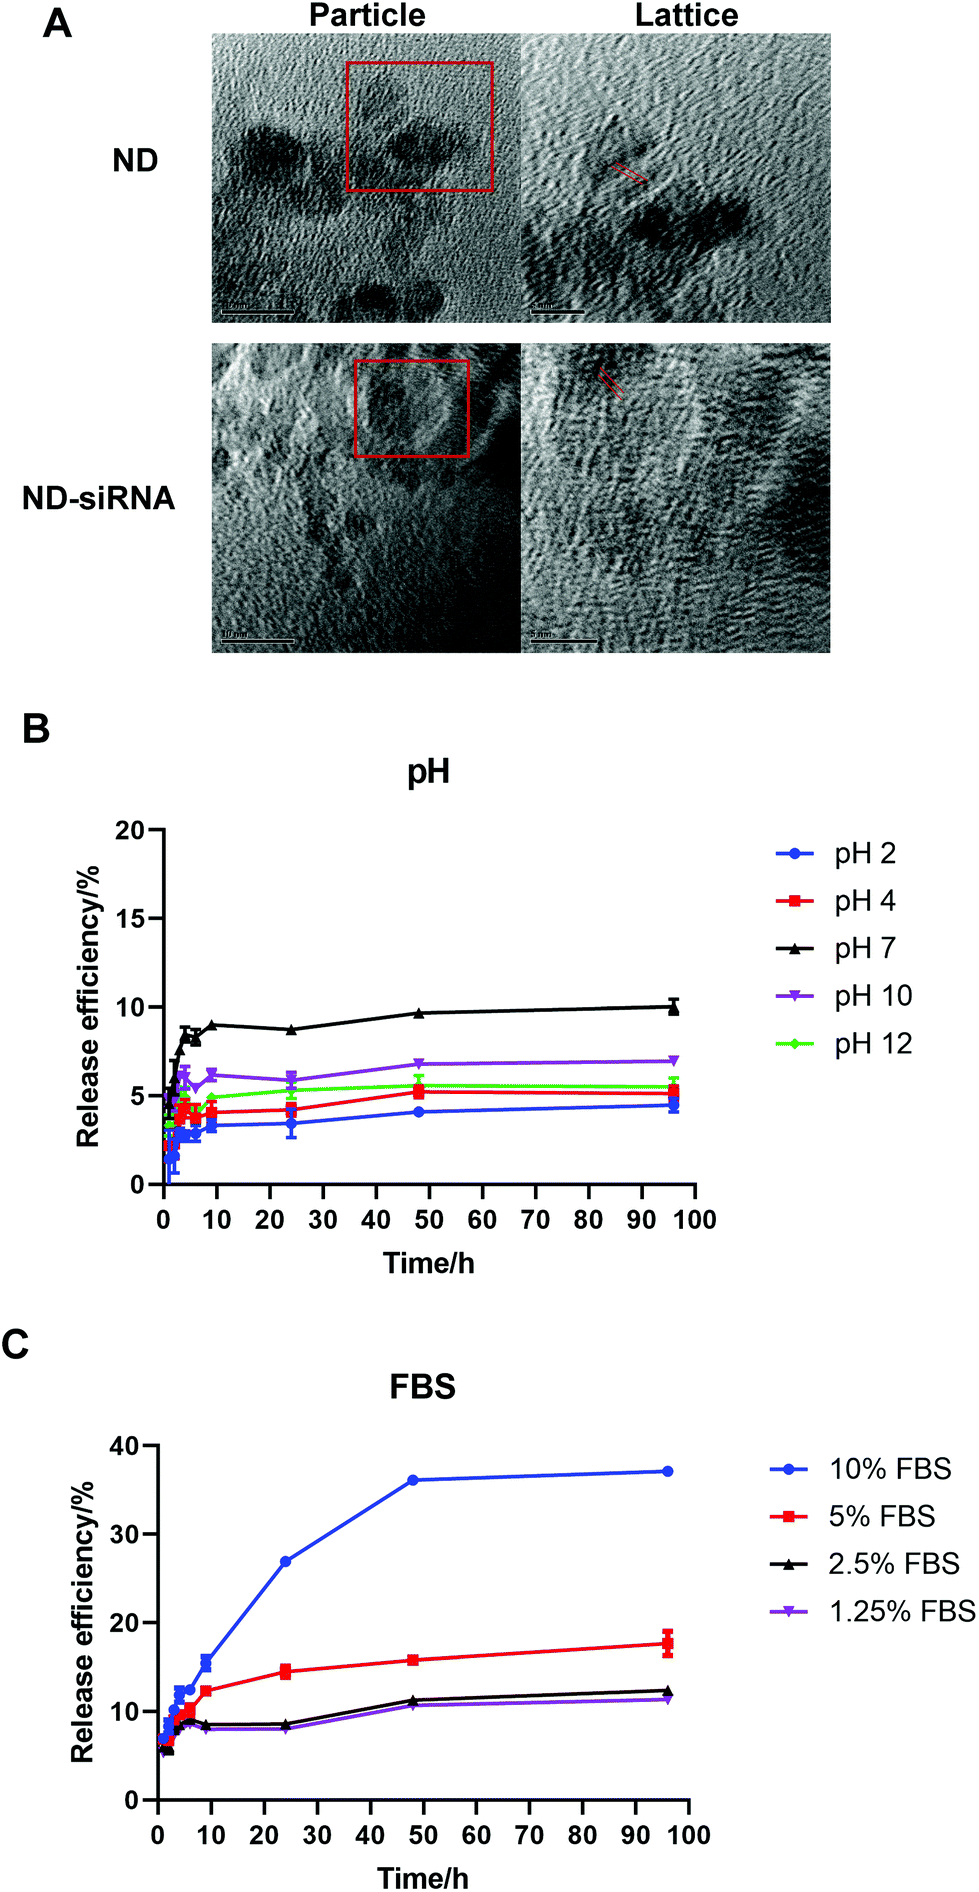 | ||
| Fig. 2 Physicochemical characterization and in vitro release profile of ND-siRNA (Cy3-labelled siRNA) complexes. (A) Representative images of TEM scanning of NDs and ND-siRNA. Red lines in the right images denote the lattice structure on the particle surface. Scale bar in particle images, 10 nm; in lattice images, 5 nm. (B) In vitro release profile of siRNA from ND-siRNA complexes under various pH conditions. (C) In vitro release profile of siRNA from ND-siRNA complexes in DMEM with different FBS concentrations. | ||
Following the successful formation of ND-siRNA complexes, the effect of pH and biological matter on the release of siRNA from NDs was investigated. The release profile of ND-siRNA was evaluated in a range of pH values (pH 2, 4, 7, 10, and 12) as well as at different protein concentrations (DMEM with 1.25%, 2.5%, 5%, and 10% FBS), respectively. siRNA was bound with NDs strongly and siRNA had difficulty escaping from the complexes under both alkaline and acidic conditions (Fig. 2B). Meanwhile, approximately 10% of siRNA was released from ND-siRNA complexes under neutral pH. To better mimic a physiological environment, the effect of protein on siRNA release was also investigated. Interestingly, the siRNA release was elevated in the presence of FBS, as in DMEM with 10% FBS, 40% of siRNA was sustainedly released from the complexes after 4 days (Fig. 2C). Negatively charged proteins have been reported to competitively bind to NDs and enhance drug release.51,77 In the intracellular environment, there are various biological polyanions that can competitively replace the nucleic acids on nanoparticles.78 Therefore, siRNA release from NDs may increase in the intracellular environment.
The stability of ND-siRNA was also tested under different temperature conditions. The particle size of ND-siRNA was stable for at least 7 days at 4 °C, 25 °C and 37 °C (Fig. S3A†). Meanwhile we also tested the biological activity stability of ND-siRNA by evaluating the knockdown efficiency of SALL4 siRNA samples placed at 4 °C or 37 °C for 24 h, with or without packaged in NDs (Fig. S3B†). When packaged in NDs, siRNA was more stable and can maintain its biological activity at 37 °C for at least 24 h.
Cellular uptake and retention of ND-siRNA complexes in 2D HCC cell lines
The cellular uptake and retention efficiency of ND-siRNA complexes were evaluated and compared with those of bare siRNA as the negative vehicle control and as well as Lipofectamine 3000 (lipo)-siRNA as the positive vehicle control. The internalization efficiency was quantified and fluorescence intensity was normalized to the cell number. As shown in Fig. S4,† in both HCC cell lines, LM3 and SNU398, ND-siRNA showed more cellular uptake after incubation for 4 hours, especially at a weight ratio of 50:1. More interestingly, after incubation for 24 hours and 48 hours, the Cy3 fluorescence signal in the bare siRNA group and lipo-siRNA group was noticeably weakened. In contrast, both ND-siRNA groups (100:1, 50:1) showed a strong Cy3 signal, indicating enhanced cellular retention.
Endosomal/lysosomal escape of ND-siRNA complexes
Besides efficient cellular uptake, successful endosomal and lysosomal escape is also essential to ensure desirable transfection for siRNA-mediated gene regulation. Dynamic intracellular distributions of siRNA after endocytosis were investigated. As illustrated in Fig. 3B, ND-siRNA complexes were trapped in endosomes for 0.5 hours and then translocated to the cytoplasm shortly afterwards (1 hour and 2 hours), which was also determined by colocalization quantification (Fig. 3C). Pearson's correlation coefficient (PCC) was used for quantifying colocalization. PCC ranges from −1 to +1. The value closer to 1 indicates better correlation while 0 indicates no correlation. As such, minor portions of ND-siRNA colocalized with lysosomes (Fig. 3E and F). These results suggested that ND-siRNA could successfully escape from endosomes as well as from lysosomes. Lipo-siRNA also achieved partial endosomal and lysosomal escape but did not outperform ND-siRNA (Fig. 3A, C, D and F).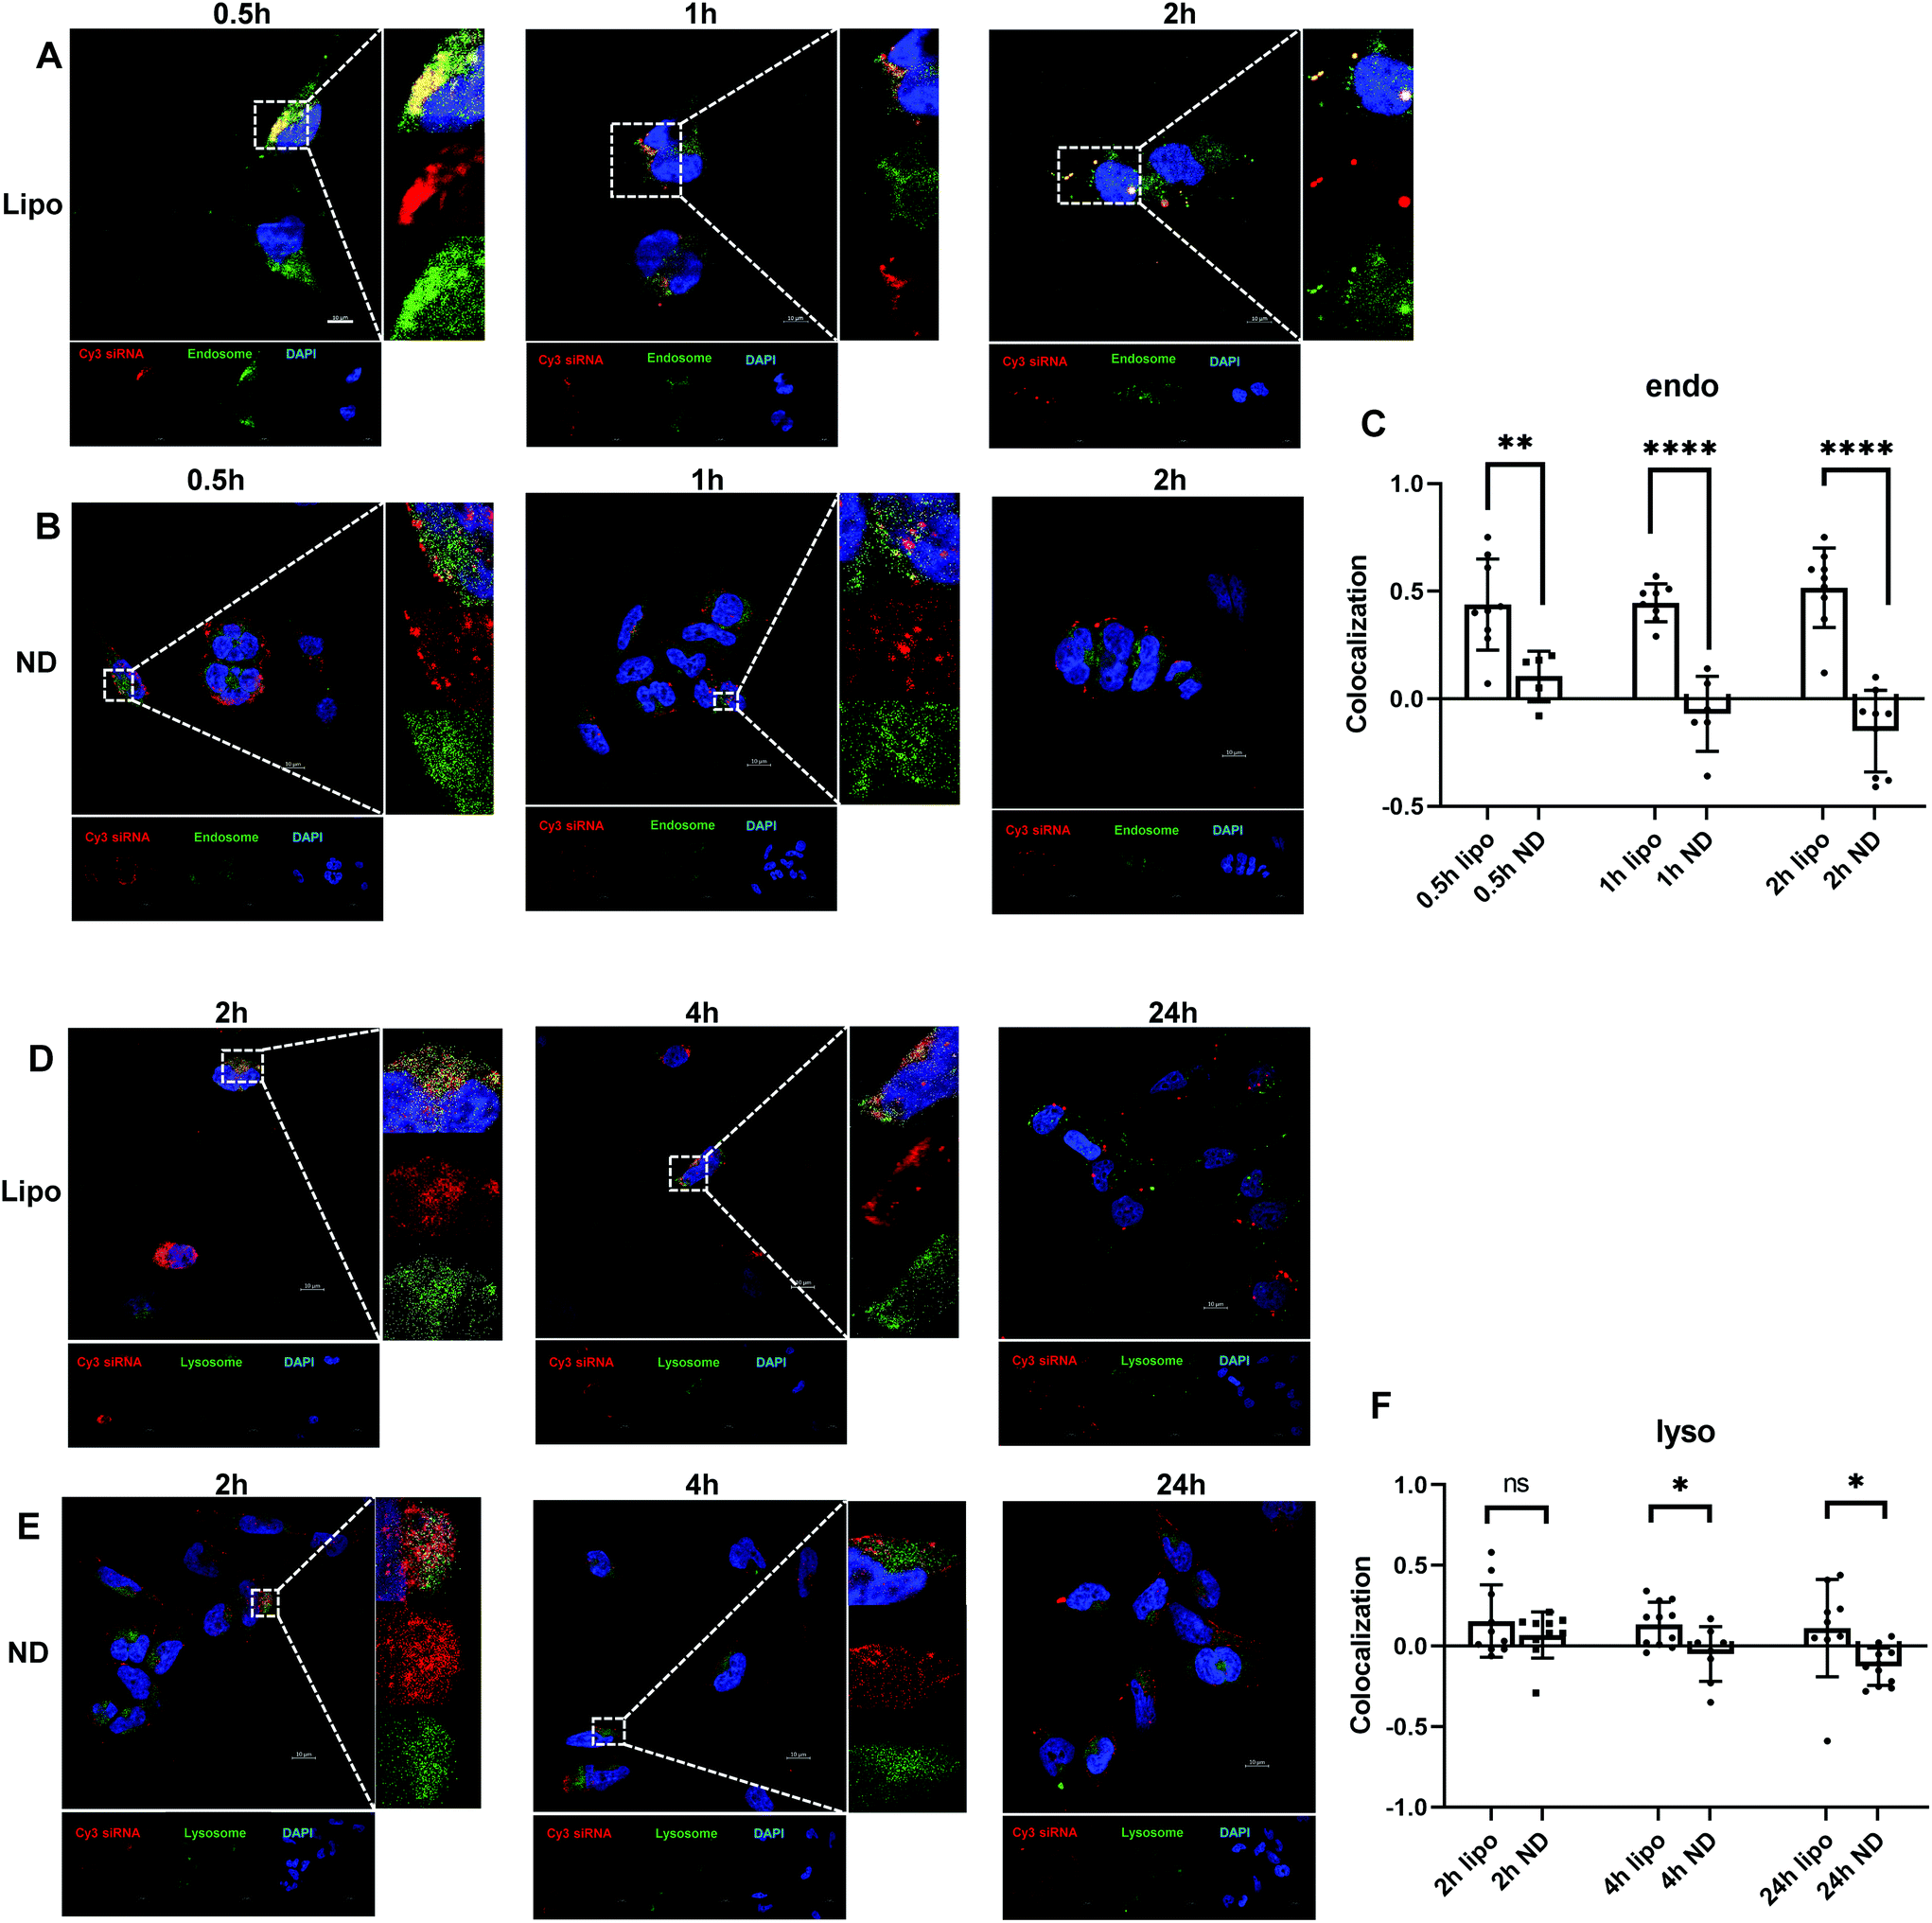 | ||
| Fig. 3 (A to C) Fluorescence images showing less colocalization of ND-siRNA with endosomes, indicating enhanced endosomal escape. A time-dependent intracellular trafficking (0.5 hours, 1 hour, 2 hours) of lipo-siRNA (A) and ND-siRNA (B) was examined and colocalization coefficients of endosomes and Cy3-labelled siRNA were quantified by Fiji using the Coloc 2 plugin (C). (D to F) Fluorescence images showing less colocalization of ND-siRNA with lysosomes indicating enhanced lysosomal escape. A time-dependent intracellular trafficking (2 hours, 4 hours, 24 hours) of lipo-siRNA (D) and ND-siRNA (E) was examined and colocalization coefficients of lysosomes and Cy3-labelled siRNA were quantified by Fiji using the Coloc 2 plugin (F). Colocalization experiments were conducted in SNU398 cell lines. The blue signal denotes the nucleus; the green signal denotes endosomes/lysosomes; the red signal denotes Cy3-labelled siRNA. Images were taken under 100× magnification; scale bars, 10 μm. *p < 0.05, **p < 0.01, ***p < 0.001, ****p < 0.0001. | ||
Considering the importance of endosomal escape in efficient cellular delivery, different strategies have been developed, including osmotic rupture through the proton sponge effect, destabilizing endosomes by polymers or peptides, and piercing and destroying the bilayer membrane of endosomes to release the content.79–82 Among them, the most popular method is the proton sponge effect that causes osmotic swelling of endosomes and eventually disrupts the endosome membrane. The defining features of those nanoparticles that enable escaping from endosomes are pKa values in the physiological range and high buffering capacity.83 Previous studies have shown that the ND surface is decorated with phenols and pyrones, with predicted pKa ≥ 7.3.84 These properties of NDs may help particles to escape from endosomes by binding with the protons inside the endosomes. Besides, Chu et al. observed that NDs caused rapid endosomal membrane rupturing after endocytosis, leading to the endosomal escape of NDs to the cytoplasm.82 However, the study used a different kind of ND (HPHT ND) from ours (DND). More detailed studies need to be performed before the mechanisms involved can be confirmed.
ND-siRNA showed enhanced penetration capacity in 3D HCC spheroids
3D disease models, including 3D tumor spheroids, are more clinically relevant in vitro models of cancer biology as they more realistically recapitulate cell–cell interactions and tumor structure than 2D cancer cell lines. As such, 3D HCC spheroids were used to evaluate the effect of ND-siRNAs on solid tumour structures. The penetration capacity of ND-siRNA complexes was investigated in two HCC spheroid models, SNU398 and LM3 (Fig. 4). HCC spheroids were incubated with ND-Cy3 siRNA or lipo-Cy3 siRNA in culture medium with growth factors. At each time point, spheroids were stained with Hoechst and imaged using a confocal microscope. To better show the Cy3 fluorescence intensity, the Cy3 channel was displayed in LUT fire (Fig. 4B and E). Images were then analyzed by Fiji using the radial profile plot plugin to show the radial distribution of Cy3 fluorescence intensity. Results showed that Cy3 siRNA gradually penetrates inside the spheroids over time. ND-siRNA showed relatively higher penetration capacity compared to lipo-siRNA as a higher intensity of the Cy3 signal was observed inside the HCC spheroids. After 24 to 48 hours, ND-siRNA was able to penetrate inside the whole spheroids, whereas the lipo-siRNA group showed a much lower Cy3 signal and complexes were mainly stuck in the outer cells.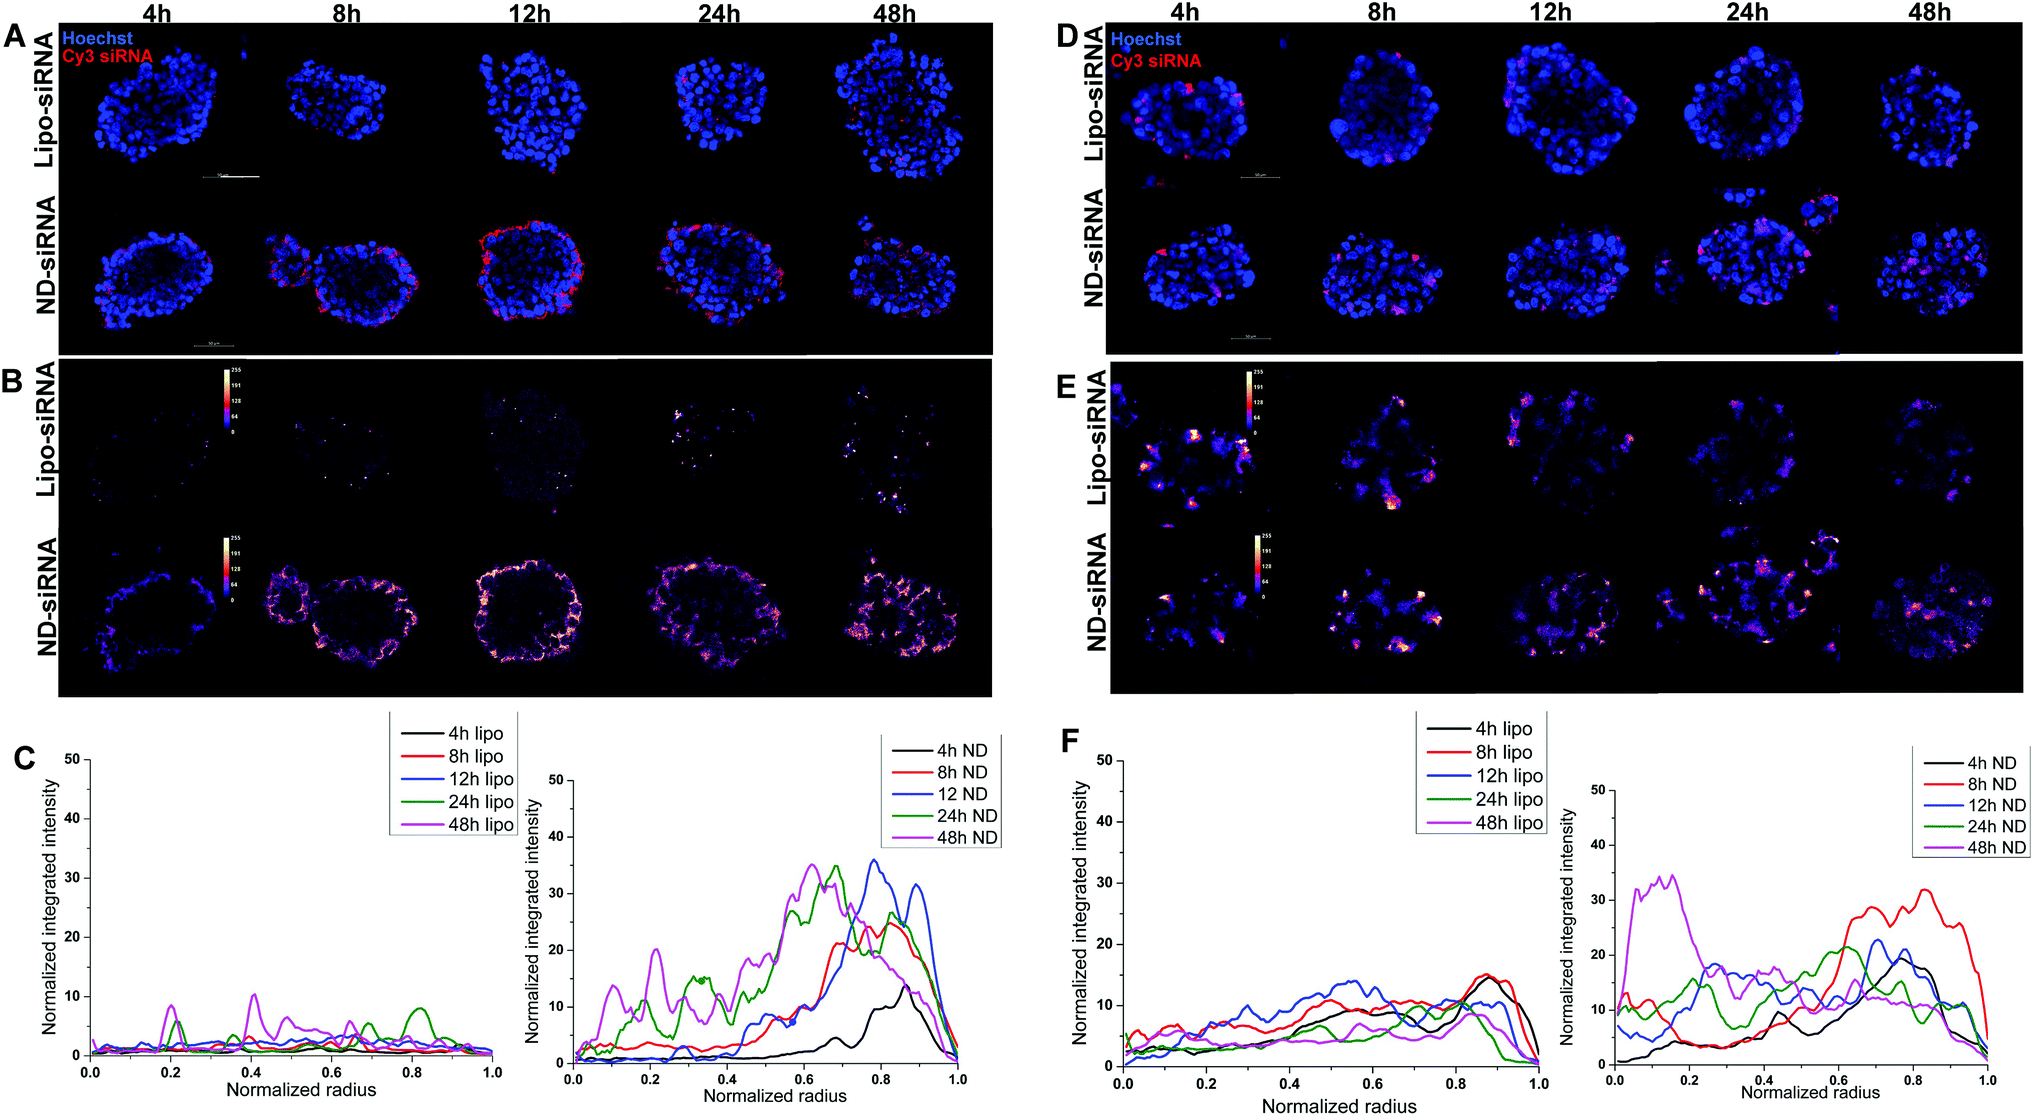 | ||
| Fig. 4 Enhanced penetration capacity of ND-siRNA complexes was observed in SNU398 (A) and LM3 (D) 3D spheroids, compared to the lipo-siRNA group. The red signal represents the Cy3-labelled siRNA; the blue signal represents the DAPI staining. Scale bars: 50 μm. Cy3 siRNA fluorescence intensity in SNU398 spheroids (B) and LM3 spheroids (E) was normalized and displayed in LUT fire using the Fiji software. Quantification of Cy3 intensity in SNU398 spheroids (C) and LM3 spheroids (F) shown in (A) and (D) using the radial profile plot plugin in Fiji. | ||
To better evaluate and quantify the penetration capacity of ND-siRNA, we adopted a FACS analysis method previously described by Tchoryk et al. that took advantage of gradient staining when incubating spheroids with Hoechst.85 When incubating a spheroid with low concentrations of Hoechst, the spheroid showed a gradient staining with a stronger Hoechst signal detected in the outer layer of the spheroid and a comparatively lower signal observed in the middle of the spheroid, while the inner core of the spheroid showed low or even no Hoechst signal (Fig. S5†). Therefore, the degree of Hoechst staining represents the location of the cells within the spheroid, which can be manually divided into three segments: the core that had the lowest Hoechst signal, the rim that had the highest Hoechst signal, and the middle layer that is in between the core and rim. Thus, we quantified the penetration of nanoparticles in spheroids by treating spheroids with ND-Cy3 siRNA or lipo-Cy3 siRNA and Hoechst, followed by FACS analysis. As shown in Fig. 5, the percentage of Cy3 positive cells increased over time. Additionally, in accordance with the confocal result, the percentage of Cy3 positive cells decreased from the rim towards the core of the spheroids. Most importantly, in both SNU398 and LM3 spheroids, ND-siRNA showed superior penetration capacity over lipo-siRNA, which was consistent with confocal results. By precisely studying the spheroid penetration with both confocal and FACS analyses, we quantified and confirmed the enhanced penetration capacity of ND-siRNA in spheroids. Due to more complex pathophysiological gradients and more biologically relevant multicellular organisation compared to conventional 2D cell lines, 3D tumor spheroids can better recapitulate the tumor response in vivo.86,87 Thus, in depth 3D disease modelling analysis of ND-siRNA complexes in spheroids provides strong evidence that NDs could be a more effective delivery platform of siRNAs towards solid tumors.
 | ||
| Fig. 5 siRNA penetration and distribution in HCC spheroids using FACS analysis. (A) SNU398 spheroids and (B) LM3 spheroids. | ||
Improved knockdown efficacy and therapeutic effect of ND-siRNA complexes in tumor spheroids
Our next step was to investigate the gene knockdown efficiency of siRNA delivered by ND. We chose an siRNA sequence that specifically targets SALL4 and evaluated it against SNU398 spheroids where SALL4 overexpression is known to contribute to SNU398 cancer properties.11,88 The knockdown efficiency was evaluated for both the mRNA level by qRT-PCR and protein level by western blotting (Fig. 6). qRT-PCR results showed that ND-siSALL4 can significantly knock down the SALL4 mRNA level while lipo-siSALL4 had a limited effect on SALL4 expression in the spheroids. Western blot data further showed a strong knockdown effect of ND-siSALL4 as significant decreases in SALL4 expression and its downstream gene, AKT, pAKT and Cyclin D2 expression levels were observed. It is worth noting that in 2D cells, lipo-siSALL4 was able to knock down the SALL4 mRNA level significantly (more than 30% mRNA reduction) in the presence of serum (Fig. S6†). | ||
| Fig. 6 Knockdown efficiency of SALL4 siRNA packaged in lipo or ND in SNU398 spheroids, with NTC (non-targeting control) siRNA as the negative control. (A) SALL4 mRNA level after siRNA treatment in SNU398 spheroids. (B) Western blot of SALL4 and downstream genes, AKT, phosphorylated AKT (pAKT) and Cyclin D2 expression level after knockdown. The blots were cropped and full length blots are presented in the ESI (Fig. S8†). (C) Quantification of western blot results. *p < 0.05, **p < 0.01; n = 3. | ||
We also compared NDs with two additional commercial transfection reagents: Lipofectamine® RNAiMAX (lipid-based transfection reagent) and X-tremeGENE HP (polymer-based transfection reagent). While both RNAiMAX-siSALL4 and X-tremeGENE-siSALL4 were able to significantly knock down the SALL4 mRNA level in 2D cells in Opti-MEM medium, they showed poor knockdown efficiency in SNU398 spheroids (Fig. S7A and B†). FACS analysis was also performed to further compare the spheroid penetration capacity among RNAiMAX, X-tremeGENE and ND (Fig. S7C†). NDs showed better penetration capacity over RNAiMAX and X-tremeGENE as a higher percentage of Cy3 positive cells in the core part of spheroids was observed in the ND group.
Previous studies have shown that SALL4 can be a key contributor to cell proliferation in HCC.89,90 Knocking down SALL4 led to inhibition of cell proliferation.90 Thus, we investigated cancer cell proliferation in spheroids following SALL4 knockdown by Click-iT EdU assay. 5-Ethynyl-2′-deoxyuridine (EdU) is a nucleoside analogue of thymidine. It can replace thymidine and be incorporated into DNA during DNA synthesis. After adding the EdU detecting reagent, only DNA in proliferative daughter cells would contain EdU and show a fluorescence signal, indicating proliferation activity. Spheroids were treated with lipo-siSALL4 or ND-siSALL4, with NTC (non-targeting control) siRNA as the negative control, followed by the Click-iT EdU assay. Then spheroids were imaged by confocal microscopy and a 3D image stack was obtained. Images were reconstructed using the Imaris software and the DAPI channel was surface rendered and given a transparent pseudo color effect (Fig. 7B 3D image analysis showed that proliferation activity was significantly decreased following treatment with ND-siSALL4 compared to the NTC group (Fig. 6). Furthermore, liposomal siSALL4 treatment showed a minimal effect, potentially due to the deficient penetrative ability in spheroids (Fig. 4 and 5). These results suggest that the increased penetrative capabilities of ND-siRNA allow for the improved therapeutic effect of siSALL4 delivery by ND.
 | ||
| Fig. 7 Proliferation in SNU398 spheroids following SALL4 knockdown by Click-iT EdU assay. (A) Representative 3D images of SNU398 spheroids with different treatments. The blue signal denotes DAPI staining; the red signal denotes the EdU positive cell, indicating the proliferating cells. (B) Images were reconstructed and surface rendered using the Imaris software. The EdU channel stayed the same while the DAPI channel was surface rendered and given a transparent pseudo color for better display. Scale bars, 50 μm. (C) Percentage of EdU positive cells was quantified using the Imaris software. ****p < 0.0001, n = 3. | ||
In cell culture medium with growth factors that contain proteins, positively charged particles would absorb the negatively charged proteins and form a protein corona on the surface, leading to the change of zeta potential from positive to negative (Table S1†). How the zeta potential of nanoparticles affects the cellular uptake and spheroid penetration is disputed. Positively charged nanoparticles have been shown to have better uptake into cells, converting surface charge to negative would greatly reduce the cellular uptake efficiency of nanoparticles. However, as some studies pointed out, reduced uptake by the surface cells of spheroids may provide higher chances for nanoparticles to penetrate deeper into spheroids instead of being entrapped by the outer cells.91–93 A study by Huang et al. proposed that, since the binding of nanoparticles with proteins was relatively weak and reversible, the protein corona might collapse when the particles penetrated inside the spheroids.93 In our case, we hypothesized that in a medium containing the serum environment, ND-siRNA complexes were covered by a layer of protein corona and it helped nanoparticles penetrate inside the spheroids. While penetrating inside the spheroids, the protein corona on the surface gradually vanished. After that, the interactions with cells were mainly dependent on the nanoparticles themselves.
NDs have been reported to induce the loss of junction interconnection of cells and cytoskeleton network remodeling.94 This effect was mainly caused by the elevated intracellular level of ROS and Ca+. These changes activated the downstream signalling pathway, leading to the loss of VE-cadherin interconnection and cytoskeleton remodelling. Although the study was performed in the endothelial cells, we hypothesized that NDs can also induce the extracellular substrate defects and gap formation in spheroids since there are an intact cytoskeleton and cell–cell junctions within the spheroids.95 Therefore, with this special property, NDs were able to penetrate inside the spheroids, making NDs an appropriate vehicle to deliver siRNA and other therapeutics into solid tumors.
The heterogeneity of the EPR effect as well as the physiological barriers of the solid tumor hinders the homogeneous distribution and deep penetration of the nanoparticles throughout the tumor.96 Solid tumors feature abnormal tumor vasculature and a high density of the tumor extracellular matrix (ECM), which greatly retard the diffusion of nanoparticles in the tumor interstitium.97–99 For instance, it has been proved that liposomes with diameters of around 90 nm are predominantly located near the vasculature area and can only be delivered to peripheral cells of the tumor mass.100 Therefore, particular attention should be paid to develop nanoparticles with improved tumor penetration capability.
Several studies have shown that the physicochemical characteristics of nanoparticles such as size, particle shape, and rigidity also have a profound effect on the transport of nanomedicines within tumors. Nanoparticles with smaller sizes are demonstrated to have better tumor penetration than bigger-sized ones.101–104 However, the balance must be found since ultrasmall nanoparticles (<5.5 nm) are eliminated more quickly by kidneys, compromising their blood circulation time. Besides the particle size, particle shape and charge can also affect tumor penetration. In terms of the particle shape, a study conducted by Jain et al. showed that the penetration of nanorods was 1.7 times the volume of that of nanospheres with the same hydrodynamic diameter in mice bearing orthotopic E0771 mammary tumors.105,106 Another study performed by Black and coworkers indicated the same trend that nanorods penetrated into the cores of the tumors, whereas nanospheres were retained mostly at the rim of the tumors.107 Unlike traditional nanospheres, NDs possess sharp edge structures. Fluorescence imaging studies indicated that FNDs capable of escaping from endosomes were homogeneously distributed inside the cytosol. The endosomal membrane penetration was attributed to the sharp edge structures of the FNDs.108,109 In addition, increased rigidity (18–211 kPa) tends to enhance margination and uptake by relevant tissue cells, including endothelial and cancer cells.110
These factors can also explain why LPX used in our study showed deficient penetrative behavior. Niora et al. compared the penetration efficiency of lipid-based nanoparticles into tumor spheroids and found that LPX showed relatively low penetration efficiency among all the tested lipid-based nanoparticles, likely due to its positive surface charge.91 Another study conducted by Carver et al. also observed significantly reduced delivery of LPX in 3D spheroids compared to 2D monolayer culture, potentially because of their large size.111 However, their versatile structure provided great potential for further functionalization and modification to enhance the penetration capacity, tumor targeting, stability and so on. Strategies include combination of cell-penetrating peptides and designed size-tunable liposomes were investigated for better tumor penetration.112,113
Similarly, the ND platform also can be further decorated to improve its efficacy. For example, since the binding of NDs with siRNA was through electrostatic interactions, it is hard to control the release of siRNA from NDs. Binding affinity must be strong enough to retain siRNA before being internalized by tumor cells, while larger affinity between NDs and siRNA may cause incomplete siRNA release, leading to reduced knockdown efficiency. During our testing, some siRNA sequences worked quite well but some siRNA had difficulty in knockdown target genes when delivered by NDs, possibly because of the affinity difference among different siRNA sequences with NDs. Therefore, controllable siRNA release can be designed in further studies. Other strategies can also be employed in future studies to further optimize ND-siRNA therapy. For example, linkage with tumor-targeting peptides may further facilitate the specific solid tumor targeting and penetration of NDs. Additionally, optimization analytics platforms, including machine learning and complex system analytics, may be used to refine nanoparticle siRNA design and delivery. Supervised machine learning has been used to guide the design and optimization of spherical nucleic acids in immuno-stimulatory applications.114 Similar approaches can also be performed to determine appropriate nucleic acid features for optimal binding and release of nucleic acid payloads from NDs and other nanomaterials. For complex diseases, such as cancer, combinatorial delivery of siRNAs and/or drugs may be optimised to further improve efficacy. Complex system analytics approaches, such as quadratic response surface mapping-related approaches, have been shown to be able to optimize therapeutic combinations, even in the context of ND-based drug delivery.115–117 These approaches have also been used clinically to optimize drug dosing. Both may be useful in future studies to determine the appropriate combination of siRNAs as well as the optimized dosing for maximised therapeutic efficacy.
Experimental
Preparation of ND-siRNA complexes
ND gel (NanoAmando® Soft Hydrogel) was obtained from NanoCarbon Research Institute, Ltd, Nagano, Japan. ND gel was diluted to the desired concentration with nuclease-free water and then sonicated for 2 hours. Cy3 siRNA and non-targeting control siRNA were obtained from Integrated DNA Technologies (Cy® 3 Transfection Control DsiRNA, 51-01-03-08; Negative Control DsiRNA, 51-01-14-04), and anti-human SALL4 siRNA was obtained from Horizon Discovery Ltd (siGENOME Human SALL4 siRNA, D-007033-05-0005). All of the siRNAs were resuspended according to the manufacturer's instructions. To prepare ND-siRNA complexes, ND solution was mixed with different amounts of siRNA (depending on the weight ratio of ND:siRNA). After 15 minutes of incubation at room temperature, siRNA was loaded to NDs through electrostatic interactions. The complexes were centrifuged at 15000 rpm for 45 minutes, and the supernatant was collected to determine the unloaded amount of siRNA using fluorescence spectroscope analysis. The fluorescence intensity of the supernatant was measured (excitation wavelength of 470 nm and emission wavelength of 565 nm for Cy3 siRNA) and the amount of siRNA was calculated through the standard curve, which was established by serial dilution of Cy3-siRNA in nuclease-free water. Loading efficiency and surface loading were calculated using the following equivalent:| \eqalign{\tab Loading efficiency (%) = (total amount of siRNA-unloaded \cr \tab \quad amount of siRNA in the supernatant)/\cr \tab \quad total amount of siRNA × 100% |
| \eqalign{\tab Surface loading (nmol mg−1) =(total amount of \cr \tab \quad siRNA-unloaded amount of siRNA in the supernatant)/\cr \tab \quad total amount of nanoparticles |
The precipitates were resuspended in nuclease-free water.
Characterization of ND-siRNA complexes
The size and zeta potential of ND and ND-siRNA were measured by the dynamic light scattering (DLS) method using a Malvern Zetasizer Nano ZS system (Malvern Instruments, Malvern, UK). ND and different weight ratios of ND-siRNA complexes were suspended or diluted in nuclease-free water to a final concentration of 0.1 mg mL−1 (ND concentration). Size measurements were performed at 25 °C at a 173° backscattering angle after an equilibration period of 120 seconds. The refractive index of the dispersant (water) is 1.33 and viscosity is 0.8872 cP. Each experiment was performed in triplicate. For each measurement, the number of runs is 11, and the run duration is 10 seconds. General purpose (normal resolution) of the analysis model was used. The hydrodynamic size was determined by cumulant analysis and analyzed under the 3rd order of fit. The zeta potential was determined based on electrophoretic mobility in aqueous suspension with a measured pH of 6.5 without any adjustment. Disposable folded capillary cells (DTS1070) were used for zeta potential measurements. The automatic measurement duration was used with minimum runs of 10. Measurements were carried out at 25 °C after an equilibration time of 120 seconds and each experiment was performed in triplicate. The automatic mode was used for analysis.Transmission electronic microscopy (TEM) was performed using a JEOL JEM-2010 transmission electron microscope (JEOL, Tokyo, Japan). Briefly, ND and ND-siRNA were suspended or diluted in nuclease-free water at a final concentration of 0.05 mg mL−1 (ND concentration), followed by sonication. After that, the solution was added dropwise onto copper mesh (coated with a carbon film) and dried overnight at room temperature before imaging.
siRNA release profile
siRNA release from ND-siRNA complexes was evaluated under different pH conditions (2, 4, 7, 10 and 12) and various protein concentrations (10%, 5%, 2.5%, and 1.25% (v/v) of fetal bovine serum) over a period of 4 days. For different pH solutions, the pH value was adjusted with HCl or NaOH using a pH meter (Biofrontier Technology). For different protein concentration solutions, certain volumes of FBS were added into Dulbecco's Modified Eagle's Medium (DMEM) (Biowest). ND-siRNA solution was incubated in a shaker at 37 °C and 100 rpm. At each time point (1, 2, 3, 4, 6, 9, 24, 48 and 96 h), ND-siRNA was centrifuged at 15000 rpm for 30 minutes, and then the supernatant was collected to determine the amount of released siRNA.
Cell culture
Human HCC cell lines, SNU398 and LM3, were obtained from American Type Culture Collection (Manassas, VA, USA). SNU398 cells were cultured in RPMI-1640 medium (Biowest). LM3 cells were cultured in DMEM (Biowest). All the media were supplemented with 10% (v/v) FBS (Gibco, USA) and 1% penicillin/streptomycin (Gibco, USA). All the cells were cultured in a 5% CO2-humidified incubator at 37 °C.Cellular uptake and retention evaluation of ND-siRNA complexes
Three thousand LM3 or SNU398 cells per well were seeded into 96-well plates and incubated overnight. After 24 hours, cells were washed with phosphate buffered saline (PBS) and treated with bare siRNA, lipo-siRNA or ND-siRNA (with weight ratios of 100:1 or 50:1). The treatment concentration of siRNA was 50 nM and Cy3-labelled siRNA was used for fluorescence imaging. Lipo-siRNA complexes were used as a positive control and were prepared according to the manufacturer's protocol. Cellular uptake of ND-siRNA was evaluated after 4 h of incubation and cellular retention of ND-siRNA was evaluated at 24 h and 48 h time points. At each time point, the medium was aspirated and cells were washed with PBS to wash away the excess extracellular siRNA and then stained with Hoechst 33342 (2′-[4-ethoxyphenyl]-5-[4-methyl-1-piperazinyl]-2,5′-bi-1H-benzimidazole trihydrochloride trihydrate) (Catalog number: 62249, Thermo Fisher Scientific) for 10 minutes. After replacing with fresh medium containing 10% of FBS, cells were imaged and Cy3 fluorescence intensity was quantified using an Operetta High-Content Imaging System (PerkinElmer).
Endosomal/lysosomal escape evaluation of ND-siRNA complexes
Ten thousand SNU398 cells per chamber were seeded into 8-well chamber slides (SPL LIFE SCIENCES) one day before treatment. After incubation for one day, cells were treated with lipo-siRNA or ND-siRNA for 0.5, 1 or 2 hours for endosomal escape evaluation and endosomes were labelled using endosomal marker CellLight™ Early Endosomes-GFP (Catalog number: C10586, Thermo Fisher Scientific). For lysosomal escape evaluation, cells were treated with lipo-siRNA or ND-siRNA for 2, 4 or 24 hours and lysosomes were labelled with LysoTracker™ Deep Red (Catalog number: L12492, Thermo Fisher Scientific). Thereafter, cells were washed with PBS and fixed using 4% paraformaldehyde (PFA) for 15 minutes. Afterwards, chambers were removed and slides were mounted with ProLong™ Gold Antifade Mountant with DAPI (Catalog number: P36931, Thermo Fisher Scientific). Samples were visualized using a confocal laser scanning microscope (LSM 880 Airy Scan, Carl Zeiss). Images were analyzed by Fiji for co-localization quantification (Cy3 and GFP or Cy3 and Deep Red) using the Coloc2 plugin. Pearson's correlation coefficient (PCC) was used as a statistical tool for quantifying colocalization.Generation of HCC spheroids
LM3 and SNU398 spheroids were formed by seeding cells on ultra-low-attachment culture flasks (Corning, Corning, NY) in a serum-free spheroid medium. DMEM/F-12 serum-free medium (3:1, v/v) contained 1% (v/v) of penicillin/streptomycin, 1% (w/v) of minimum essential media nonessential amino acids, 1% (w/v) of sodium pyruvate, 2% (v/v) of B27, 1% (v/v) of insulin transferrin selenium, 4 μg mL−1 of heparin, 10 mM of nicotinamide, 20 ng mL−1 of epidermal growth factor, and 10 ng mL−1 of fibroblast growth factor 2.
Evaluation of the penetration capacity of ND-siRNA
Spheroids were treated with lipo-Cy3 siRNA or ND-Cy3 siRNA (with a weight ratio of 50:1 (ND:siRNA)). At each time point, spheroids were stained with Hoechst 33342 for 1 hour. Thereafter, spheroids were fixed with 4% PFA for 15 minutes and washed with PBS. Afterwards, spheroids were imaged with a confocal microscope using the Z-stack method. siRNA penetration was quantified by Fiji using the radial profile plot plugin.
Flow cytometry assay was also used to better assess the penetration capacity of ND-siRNA into spheroids. Spheroids were incubated with ND-siRNA or lipo-siRNA for 4, 16 or 24 hours and Hoechst 33342 (0.5 μM) for 4 hours then dissociated with Accutase (Gibco) to obtain the single cells and washed with PBS twice. Cells were resuspended in HBSS (Gibco) and 7-aminoactinomycin D (7-AAD) (STEMCELL Technologies, cat: #75001) was added to exclude dead cells. Samples were analyzed by flow cytometry (LSRII, BD Bioscience, USA).
Knockdown efficiency of ND-siRNA complexes in spheroids
The knockdown efficiency of SALL4 siRNA delivered by ND was evaluated in SNU398 spheroids with lipofectamine 3000 (Thermo Fisher Scientific) serving as a positive control. SNU398 spheroids were seeded into 6-well plates 24 hours before transfection. After 24-hour incubation, spheroids were treated with ND-siRNA complexes or lipo-siRNA complexes. The transfection concentration of siRNA was 50 nM. Cell pellets were collected at 48 hours for the real-time quantitative reverse transcription polymerase chain reaction (qPT-PCR) or 72 hours for western blot detection.For qRT-PCR analysis, RNA was extracted using an RNeasy Mini Kit (Qiagen, Hilden, Germany) according to the manufacturer's protocol, followed by reverse transcription using an iScript kit (Bio-Rad). Quantitative PCR was performed using iTaq™ Universal SYBR Green Supermix (Bio-Rad) on a QuantStudio 3 Real-Time PCR System (Thermo Fisher Scientific). All measurements were performed in triplicate. The sequences of primers used are listed as follows.
SALL4: F: 5′-GCGAGCTTTTACCACCAAAG-3′
R: 5′-CACAACAGGGTCCACATTCA-3′
SALL4A: F: 5′-TGATCCCAACGAATGTCTCA-3′
R: 5′-CCCAAGGTGTGTCTTCAGGT-3′
SALL4B: F: 5′-AAGCACAAGTGTCGGAGCA-3′
R: 5′-GTGCAGCCATGTTGCTTG-3′
GAPDH: F:5′-AAGGTGAAGGTCGGAGTCAA-3′
R:5′-AATGAAGGGGTCATTGATGG-3′
For the western blotting assay, the collected cell pellets were lysed using Pierce™ RIPA buffer (radioimmunoprecipitation assay buffer, Thermo Fisher Scientific, Waltham, MA) containing protease and phosphatase inhibitors (Roche, Basel, Switzerland) and the protein concentrations were determined using Bio-Rad Protein Assay (Bio-Rad Laboratories, Hercules, CA). Equal amounts of proteins from each lysate sample were resolved by sodium dodecyl sulfate polyacrylamide gel electrophoresis (SDS-PAGE) and transferred to polyvinylidene difluoride (PVDF) membranes, followed by standard immunoblotting procedures. The primary antibodies used are listed as follows. SALL4 (Santa Cruz #sc-101147), phosphor-AKT (Ser473) (Cell Signaling, #4060), AKT (Cell Signaling, #9272), Cyclin D2 (Cell Signaling, #3741), and β-actin (Cell Signaling, #4967). The blots were cropped to only show relevant slots. Fiji was also used to increase the graphic contrast. The original, full length bolts are presented in the ESI (Fig. S8†).
Cell proliferation
SNU398 spheroids were seeded 48 hours before transfection. The transfection steps were the same as those described above. After 72-hour transfection, the proliferation level of spheroids was detected using a Click-iT™ EdU Cell Proliferation Kit for Imaging, Alexa Fluor™ 555 dye (Catalog number: C10338, Thermo Fisher Scientific). EdU diluted in medium was incubated with spheroids for 1 hour before fixation and permeabilization. The Click-iT reaction was then performed using a Click-iT reaction cocktail, followed by nuclear staining using DAPI solution (Catalog number: 62248, Thermo Fisher Scientific). Spheroids were imaged with a confocal microscope using the Z-stack method. Three-dimensional reconstruction and quantification were performed using the Imaris software.Statistical analysis
All experimental data were at least performed in triplicate. All data are shown as mean ± standard deviation (SD). Unpaired Student's t test was used for statistical comparison of 2 independent groups. A p value of <0.05 was considered as statistically significant. The GraphPad Prism 8 software was used for data analysis.Conclusions
Our study provides strong evidence that NDs can serve as a promising gene delivery platform in tumour spheroids. Through electrostatic interactions, NDs were able to load siRNA with a suitable size and surface potential as a nanoscale drug delivery system. siRNA was able to sustainedly release from ND-siRNA complexes and the presence of protein can help the siRNA release. Moreover, we demonstrated that ND-siRNA complexes were capable of efficient cellular uptake and retention as well as endosomal escape, allowing for effective intracellular delivery and siRNA-mediated gene regulation. The further investigation highlighted the penetration capacity of ND-siRNA complexes into HCC tumor spheroids, which is of great significance to the clinical application of siRNA therapy in solid tumor treatment. The enhanced gene knockdown efficiency and proliferation inhibition in spheroids mediated by ND-siSALL4 further demonstrated the superiority of NDs as a delivery platform.Author contributions
J. R. Xu performed characterization, cell and spheroid imaging, and efficacy evaluation experiments and analyzed the data. J. R. Xu and M. J. Gu performed the DLS measurements. J. R. Xu and L. Hooi performed the FACS analysis. J. R. Xu, T. B. Toh, D. K. H. Thng and J. J. Lim generated the spheroids. J. R. Xu and M. J. Gu wrote the manuscript. E. K-H. Chow supervised the study. All authors revised the manuscript and approved the final manuscript.Conflicts of interest
There are no conflicts to declare.Acknowledgements
The authors thank Dr Chiu (Department of Pharmacy, NUS) and Dr Shao (Department of Biomedical Engineering, NUS) for their kind help with DLS measurements. The authors also thank Dr Kol Jia Yong from Prof. Daniel G. Tenen's lab (Cancer Science Institute of Singapore) for her kind help with SALL4-related work. This work was supported by grants from the National Research Foundation Cancer Science Institute of Singapore RCE Main Grant, the Ministry of Education Academic Research Fund (MOE AcRF Tier 2 [MOE2019-T2-1-115]), the NRF Competitive Research Programme (NRF-CRP-2017-05) and the Singapore Ministry of Health's National Medical Research Council under its Open Fund-Large Collaborative Grant (‘OF-LCG’) (MOH-OFLCG18May-0003 and MOH-OFLCG18May-0028).Notes and references
- H. Sung, J. Ferlay, R. L. Siegel, M. Laversanne, I. Soerjomataram, A. Jemal and F. Bray, CA Cancer J. Clin., 2021, 71, 209–249 CrossRef PubMed.
- F. X. Bosch, J. Ribes, M. Diaz and R. Cleries, Gastroenterology, 2004, 127, S5–S16 CrossRef PubMed.
- A. Forner, M. Reig and J. Bruix, Lancet, 2018, 391, 1301–1314 CrossRef.
- M. Kudo, Oncology, 2017, 93(Suppl 1), 135–146 CrossRef PubMed.
- M. Hilmi, C. Neuzillet, J. Calderaro, F. Lafdil, J.-M. Pawlotsky and B. Rousseau, J. Immunother. Cancer, 2019, 7, 1–13 CrossRef PubMed.
- J. R. Whitfield, M.-E. Beaulieu and L. Soucek, Front. Cell Dev. Biol., 2017, 5, 10 Search PubMed.
- C. V. Dang, E. P. Reddy, K. M. Shokat and L. Soucek, Nat. Rev. Cancer, 2017, 17, 502 CrossRef CAS PubMed.
- D. K. H. Thng, T. B. Toh and E. K. Chow, Trends Pharmacol. Sci., 2021, 42, 166–182 CrossRef CAS PubMed.
- W. Cui, N. R. Kong, Y. Ma, H. M. Amin, R. Lai and L. Chai, Mod. Pathol., 2006, 19, 1585–1592 CrossRef CAS PubMed.
- D. Kobayashi, K. Kuribayshi, M. Tanaka and N. Watanabe, Int. J. Oncol., 2011, 38, 933–939 CAS.
- K. J. Yong, C. Gao, J. S. Lim, B. Yan, H. Yang, T. Dimitrov, A. Kawasaki, C. W. Ong, K.-F. Wong and S. Lee, N. Engl. J. Med., 2013, 368, 2266–2276 CrossRef CAS PubMed.
- A. Fire, S. Xu, M. K. Montgomery, S. A. Kostas, S. E. Driver and C. C. Mello, Nature, 1998, 391, 806–811 CrossRef CAS PubMed.
- H. Dana, G. M. Chalbatani, H. Mahmoodzadeh, R. Karimloo, O. Rezaiean, A. Moradzadeh, N. Mehmandoost, F. Moazzen, A. Mazraeh, V. Marmari, M. Ebrahimi, M. M. Rashno, S. J. Abadi and E. Gharagouzlo, Int. J. Biomed. Sci., 2017, 13, 48–57 Search PubMed.
- R. C. Ryther, A. S. Flynt, J. A. Phillips 3rd and J. G. Patton, Gene Ther., 2005, 12, 5–11 CrossRef CAS PubMed.
- C. Chakraborty, A. R. Sharma, G. Sharma, C. G. P. Doss and S.-S. Lee, Mol. Ther.–Nucleic Acids, 2017, 8, 132–143 CrossRef CAS PubMed.
- A. D. Tagalakis, L. He, L. Saraiva, K. T. Gustafsson and S. L. Hart, Biomaterials, 2011, 32, 6302–6315 CrossRef CAS PubMed.
- R. Kedmi, N. Veiga, S. Ramishetti, M. Goldsmith, D. Rosenblum, N. Dammes, I. Hazan-Halevy, L. Nahary, S. Leviatan-Ben-Arye and M. Harlev, Nat. Nanotechnol., 2018, 13, 214–219 CrossRef CAS PubMed.
- Y. Dong, A. A. Eltoukhy, C. A. Alabi, O. F. Khan, O. Veiseh, J. R. Dorkin, S. Sirirungruang, H. Yin, B. C. Tang, J. M. Pelet, D. Chen, Z. Gu, Y. Xue, R. Langer and D. G. Anderson, Adv. Healthcare Mater., 2014, 3, 1392–1397 CrossRef CAS PubMed.
- M. Krohn-Grimberghe, M. J. Mitchell, M. J. Schloss, O. F. Khan, G. Courties, P. P. G. Guimaraes, D. Rohde, S. Cremer, P. S. Kowalski and Y. Sun, Nat. Biomed. Eng., 2020, 4, 1076–1089 CrossRef CAS PubMed.
- J. E. Dahlman, C. Barnes, O. F. Khan, A. Thiriot, S. Jhunjunwala, T. E. Shaw, Y. Xing, H. B. Sager, G. Sahay and L. Speciner, Nat. Nanotechnol., 2014, 9, 648 CrossRef CAS PubMed.
- P. E. Saw, H. Yao, C. Lin, W. Tao, O. C. Farokhzad and X. Xu, Nano Lett., 2019, 19, 5967–5974 CrossRef CAS PubMed.
- L. A. L. Fliervoet, H. Zhang, E. van Groesen, K. Fortuin, N. J. C. B. Duin, K. Remaut, R. M. Schiffelers, W. E. Hennink and T. Vermonden, Nanoscale, 2020, 12, 10347–10360 RSC.
- M. Qu, H. J. Kim, X. Zhou, C. Wang, X. Jiang, J. Zhu, Y. Xue, P. Tebon, S. A. Sarabi, S. Ahadian, M. R. Dokmeci, S. Zhu, Z. Gu, W. Sun and A. Khademhosseini, Nanoscale, 2020, 12, 16724–16729 RSC.
- D. D. Chin, C. Poon, J. Wang, J. Joo, V. Ong, Z. Jiang, K. Cheng, A. Plotkin, G. A. Magee and E. J. Chung, Biomaterials, 2021, 273, 120810 CrossRef CAS PubMed.
- M. Zheng, C. Wiraja, D. C. Yeo, H. Chang, D. C. S. Lio, W. Shi, K. Pu, A. S. Paller and C. Xu, Small, 2018, 14, 1802546 CrossRef PubMed.
- D. J. Foster, C. R. Brown, S. Shaikh, C. Trapp, M. K. Schlegel, K. Qian, A. Sehgal, K. G. Rajeev, V. Jadhav and M. Manoharan, Mol. Ther., 2018, 26, 708–717 CrossRef CAS PubMed.
- J. K. Nair, J. L. S. Willoughby, A. Chan, K. Charisse, M. R. Alam, Q. Wang, M. Hoekstra, P. Kandasamy, A. V. Kel'in and S. Milstein, J. Am. Chem. Soc., 2014, 136, 16958–16961 CrossRef CAS PubMed.
- W. Sun, W. Ji, J. M. Hall, Q. Hu, C. Wang, C. L. Beisel and Z. Gu, Angew. Chem., Int. Ed., 2015, 54, 12029–12033 CrossRef CAS PubMed.
- H. Cho, E. C. Yeh, R. Sinha, T. A. Laurence, J. P. Bearinger and L. P. Lee, ACS Nano, 2012, 6, 7607–7614 CrossRef CAS PubMed.
- M. Wang, Y. Han, X. Yu, L. Liang, H. Chang, D. C. Yeo, C. Wiraja, M. L. Wee, L. Liu and X. Liu, Adv. Healthcare Mater., 2020, 9, 1900635 CrossRef CAS PubMed.
- D. C. S. Lio, C. Liu, M. M. S. Oo, C. Wiraja, M. H. Y. Teo, M. Zheng, S. W. T. Chew, X. Wang and C. Xu, Nanoscale, 2019, 11, 17041–17051 RSC.
- Y. Lei, L. Tang, Y. Xie, Y. Xianyu, L. Zhang, P. Wang, Y. Hamada, K. Jiang, W. Zheng and X. Jiang, Nat. Commun., 2017, 8, 1–15 CrossRef PubMed.
- J. Liu, Y. Zhang, Q. Zeng, H. Zeng, X. Liu, P. Wu, H. Xie, L. He, Z. Long and X. Lu, Sci. Adv., 2019, 5, eaaw6499 CrossRef CAS PubMed.
- Y. Chen, S. Aslanoglou, T. Murayama, G. Gervinskas, L. I. Fitzgerald, S. Sriram, J. Tian, A. P. R. Johnston, Y. Morikawa and K. Suu, Adv. Mater., 2020, 32, 2000036 CrossRef CAS PubMed.
- S. Y. Wu, G. Lopez-Berestein, G. A. Calin and A. K. Sood, Sci. Transl. Med., 2014, 6, 240ps247 Search PubMed.
- J. Tabernero, G. I. Shapiro, P. M. LoRusso, A. Cervantes, G. K. Schwartz, G. J. Weiss, L. Paz-Ares, D. C. Cho, J. R. Infante, M. Alsina, M. M. Gounder, R. Falzone, J. Harrop, A. C. White, I. Toudjarska, D. Bumcrot, R. E. Meyers, G. Hinkle, N. Svrzikapa, R. M. Hutabarat, V. A. Clausen, J. Cehelsky, S. V. Nochur, C. Gamba-Vitalo, A. K. Vaishnaw, D. W. Sah, J. A. Gollob and H. A. Burris 3rd, Cancer Discovery, 2013, 3, 406–417 CrossRef CAS PubMed.
- R. Huschka, J. Zuloaga, M. W. Knight, L. V. Brown, P. Nordlander and N. J. Halas, J. Am. Chem. Soc., 2011, 133, 12247–12255 CrossRef CAS PubMed.
- Z. Krpetić, P. Nativo, V. Sée, I. A. Prior, M. Brust and M. Volk, Nano Lett., 2010, 10, 4549–4554 CrossRef PubMed.
- S. Carregal-Romero, M. Ochs, P. Rivera-Gil, C. Ganas, A. M. Pavlov, G. B. Sukhorukov and W. J. Parak, J. Controlled Release, 2012, 159, 120–127 CrossRef CAS PubMed.
- G. M. Chalbatani, H. Dana, E. Gharagouzloo, S. Grijalvo, R. Eritja, C. D. Logsdon, F. Memari, S. R. Miri, M. R. Rad and V. Marmari, Int. J. Nanomed., 2019, 14, 3111 CrossRef CAS PubMed.
- E. Keles, Y. Song, D. Du, W. J. Dong and Y. Lin, Biomater. Sci., 2016, 4, 1291–1309 RSC.
- M. Mohajeri, B. Behnam and A. Sahebkar, J. Cell. Physiol., 2019, 234, 298–319 CrossRef CAS PubMed.
- V. N. Mochalin, O. Shenderova, D. Ho and Y. Gogotsi, Nat. Nanotechnol., 2012, 7, 11–23 CrossRef CAS PubMed.
- M. Ozawa, M. Inaguma, M. Takahashi, F. Kataoka, A. Krueger and E. Ōsawa, Adv. Mater., 2007, 19, 1201–1206 CrossRef CAS.
- A. Krüger, F. Kataoka, M. A. A. Ozawa, T. Fujino, Y. Suzuki, A. E. Aleksenskii, A. Y. Vul and E. Ōsawa, Carbon, 2005, 43, 1722–1730 CrossRef.
- D. Ho, C. H. Wang and E. K. Chow, Sci. Adv., 2015, 1, e1500439 CrossRef PubMed.
- A. M. Schrand, S. A. C. Hens and O. A. Shenderova, Crit. Rev. Solid State Mater. Sci., 2009, 34, 18–74 CrossRef CAS.
- A. S. Barnard and E. Ōsawa, Nanoscale, 2014, 6, 1188–1194 RSC.
- L. Moore, J. Yang, T. T. H. Lan, E. Osawa, D.-K. Lee, W. D. Johnson, J. Xi, E. K.-H. Chow and D. Ho, ACS Nano, 2016, 10, 7385–7400 CrossRef CAS PubMed.
- A. M. Schrand, H. Huang, C. Carlson, J. J. Schlager, E. Osawa, S. M. Hussain and L. Dai, J. Phys. Chem. B, 2007, 111, 2–7 CrossRef CAS PubMed.
- X. Wang, X. C. Low, W. Hou, L. N. Abdullah, T. B. Toh, M. Rashid, D. Ho and E. K. Chow, ACS Nano, 2014, 8, 12151–12166 CrossRef CAS PubMed.
- T.-B. Toh, D.-K. Lee, W. Hou, L. N. Abdullah, J. Nguyen, D. Ho and E. K.-H. Chow, Mol. Pharmaceutics, 2014, 11, 2683–2691 CrossRef CAS PubMed.
- M. Gu, T. B. Toh, L. Hooi, J. J. Lim, X. Zhang and E. K. Chow, ACS Appl. Mater. Interfaces, 2019, 11, 45427–45441 CrossRef CAS PubMed.
- V. N. Mochalin, A. Pentecost, X.-M. Li, I. Neitzel, M. Nelson, C. Wei, T. He, F. Guo and Y. Gogotsi, Mol. Pharm., 2013, 10, 3728–3735 CrossRef CAS PubMed.
- V. S. Madamsetty, A. Sharma, M. Toma, S. Samaniego, A. Gallud, E. Wang, K. Pal, D. Mukhopadhyay and B. Fadeel, Nanomedicine, 2019, 18, 112–121 CrossRef CAS PubMed.
- D. G. Lim, J. H. Jung, H. W. Ko, E. Kang and S. H. Jeong, ACS Appl. Mater. Interfaces, 2016, 8, 23558–23567 CrossRef CAS PubMed.
- V. S. Madamsetty, K. Pal, S. Keshavan, T. R. Caulfield, S. K. Dutta, E. Wang, B. Fadeel and D. Mukhopadhyay, Nanoscale, 2019, 11, 22006–22018 RSC.
- M. Gu, X. Wang, T. B. Toh, L. Hooi, D. G. Tenen and E. K. H. Chow, Adv. Ther., 2018, 1, 1800110 CrossRef.
- M. M. Schimke, R. Stigler, X. Wu, T. Waag, P. Buschmann, J. Kern, G. Untergasser, M. Rasse, D. Steinmüller-Nethl and A. Krueger, Nanomedicine, 2016, 12, 823–833 CrossRef CAS PubMed.
- M. D. Torelli, A. G. Rickard, M. V. Backer, D. S. Filonov, N. A. Nunn, A. V. Kinev, J. M. Backer, G. M. Palmer and O. A. Shenderova, Bioconjugate Chem., 2019, 30, 604–613 CrossRef CAS PubMed.
- A. M. Knapinska, D. Tokmina-Roszyk, S. Amar, M. Tokmina-Roszyk, V. N. Mochalin, Y. Gogotsi, P. Cosme, A. C. Terentis and G. B. Fields, J. Pept. Sci., 2015, 104, 186–195 CrossRef CAS PubMed.
- L.-J. Su, H.-H. Lin, M.-S. Wu, L. Pan, K. Yadav, H.-H. Hsu, T.-Y. Ling, Y.-T. Chen and H.-C. Chang, Bioconjugate Chem., 2019, 30, 2228–2237 CrossRef CAS PubMed.
- S.-J. Kuo, S.-W. Chang, Y. Y. Hui, O. Y. Chen, Y.-W. Chen, C.-C. Lin, D. Wan, H.-L. Chen and H.-C. Chang, J. Mater. Chem. C, 2019, 7, 15197–15207 RSC.
- L. K. Moore, M. A. Caldwell, T. R. Townsend, K. W. MacRenaris, G. Moyle-Heyrman, N. Rammohan, E. K. Schonher, J. E. Burdette, D. Ho and T. J. Meade, Bioconjugate Chem., 2019, 30, 2947–2957 CrossRef CAS PubMed.
- M. Chen, X.-Q. Zhang, H. B. Man, R. Lam, E. K. Chow and D. Ho, J. Phys. Chem. Lett., 2010, 1, 3167–3171 CrossRef CAS.
- M. Kindermann, J. Neburkova, E. Neuhoferova, J. Majer, M. Guricova, V. Benson and P. Cigler, 2021, ffhal-03199733f.
- S. Claveau, M. Kindermann, A. Papine, Z. V. Diaz-Riascos, X. Delen, P. Georges, R. López-Alemany, Ò. T. Martínez, J.-R. Bertrand and I. Abasolo, Nanoscale, 2021, 13, 9280–9292 RSC.
- R. Martin, M. Alvaro, J. R. Herance and H. García, ACS Nano, 2010, 4, 65–74 CrossRef CAS PubMed.
- A. Alhaddad, M. P. Adam, J. Botsoa, G. Dantelle, S. Perruchas, T. Gacoin, C. Mansuy, S. Lavielle, C. Malvy and F. Treussart, Small, 2011, 7, 3087–3095 CrossRef CAS PubMed.
- S. Claveau, E. Nehlig, S. Garcia-Argote, S. Feuillastre, G. Pieters, H. A. Girard, J.-C. Arnault, F. Treussart and J.-R. Bertrand, Nanomaterials, 2020, 10, 553 CrossRef CAS PubMed.
- D. G. Lim, N. Rajasekaran, D. Lee, N. A. Kim, H. S. Jung, S. Hong, Y. K. Shin, E. Kang and S. H. Jeong, ACS Appl. Mater. Interfaces, 2017, 9, 31543–31556 CrossRef CAS PubMed.
- V. Petrakova, V. Benson, M. Buncek, A. Fiserova, M. Ledvina, J. Stursa, P. Cigler and M. Nesladek, Nanoscale, 2016, 8, 12002–12012 RSC.
- E. K. Chow, X. Q. Zhang, M. Chen, R. Lam, E. Robinson, H. Huang, D. Schaffer, E. Osawa, A. Goga and D. Ho, Sci. Transl. Med., 2011, 3, 73ra21 Search PubMed.
- W. S. Liao, Y. Ho, Y. W. Lin, E. Naveen Raj, K. K. Liu, C. Chen, X. Z. Zhou, K. P. Lu and J. I. Chao, Acta Biomater., 2019, 86, 395–405 CrossRef CAS PubMed.
- S. Claveau, É. Nehlig, S. Garcia-Argote, S. Feuillastre, G. Pieters, H. A. Girard, J. C. Arnault, F. Treussart and J. R. Bertrand, Nanomaterials, 2020, 10, 553 CrossRef CAS PubMed.
- F. Yoshino, T. Amano, Y. Zou, J. Xu, F. Kimura, Y. Furusho, T. Chano, T. Murakami, L. Zhao and N. Komatsu, Small, 2019, 15, e1901930 CrossRef PubMed.
- H.-D. Wang, C. H. Niu, Q. Yang and I. Badea, Nanotechnology, 2011, 22, 145703 CrossRef PubMed.
- T. Okuda, T. Niidome and H. Aoyagi, J. Controlled Release, 2004, 98, 325–332 CrossRef CAS PubMed.
- L. I. Selby, C. M. Cortez-Jugo, G. K. Such and A. P. R. Johnston, Wiley Interdiscip. Rev.: Nanomed. Nanobiotechnol., 2017, 9, e1452 Search PubMed.
- A. M. Sauer, A. Schlossbauer, N. Ruthardt, V. Cauda, T. Bein and C. Brauchle, Nano Lett., 2010, 10, 3684–3691 CrossRef CAS PubMed.
- Z. Chu, S. Zhang, B. Zhang, C. Zhang, C. Y. Fang, I. Rehor, P. Cigler, H. C. Chang, G. Lin, R. Liu and Q. Li, Sci. Rep., 2014, 4, 4495 CrossRef PubMed.
- Z. Chu, K. Miu, P. Lung, S. Zhang, S. Zhao, H. C. Chang, G. Lin and Q. Li, Sci. Rep., 2015, 5, 11661 CrossRef PubMed.
- L. Du, C. Wang, L. Meng, Q. Cheng, J. Zhou, X. Wang, D. Zhao, J. Zhang, L. Deng and Z. Liang, Biomaterials, 2018, 176, 84–93 CrossRef CAS PubMed.
- J. T. Paci, H. B. Man, B. Saha, D. Ho and G. C. Schatz, J. Phys. Chem. C, 2013, 117, 17256–17267 CrossRef CAS.
- A. Tchoryk, V. Taresco, R. H. Argent, M. Ashford, P. R. Gellert, S. Stolnik, A. Grabowska and M. C. Garnett, Bioconjugate Chem., 2019, 30, 1371–1384 CrossRef CAS PubMed.
- X. Liu, E. M. Weaver and A. B. Hummon, Anal. Chem., 2013, 85, 6295–6302 CrossRef CAS PubMed.
- X. Liu and A. B. Hummon, Anal. Chem., 2015, 87, 9508–9519 CrossRef CAS PubMed.
- B. H. Liu, C. Jobichen, C. S. B. Chia, T. H. M. Chan, J. P. Tang, T. X. Y. Chung, J. Li, A. Poulsen, A. W. Hung and X. Koh-Stenta, Proc. Natl. Acad. Sci. U. S. A., 2018, 115, E7119–E7128 CrossRef CAS PubMed.
- Q. Tian, Y. Xiao, Y. Wu, Y. Liu, Z. Song, W. Gao, J. Zhang, J. Yang, Y. Zhang and T. Guo, Int. J. Mol. Med., 2016, 38, 1587–1595 CrossRef CAS PubMed.
- T. Oikawa, A. Kamiya, M. Zeniya, H. Chikada, A. D. Hyuck, Y. Yamazaki, E. Wauthier, H. Tajiri, L. D. Miller and X. W. Wang, Hepatology, 2013, 57, 1469–1483 CrossRef CAS PubMed.
- M. Niora, D. Pedersbæk, R. Münter, M. F. d. V. Weywadt, Y. Farhangibarooji, T. L. Andresen, J. B. Simonsen and L. Jauffred, ACS Omega, 2020, 5, 21162–21171 CrossRef CAS PubMed.
- P. T. Sujai, M. M. Joseph, G. Saranya, J. B. Nair, V. P. Murali and K. K. Maiti, Nanoscale, 2020, 12, 6971–6975 RSC.
- K. Huang, R. Boerhan, C. Liu and G. Jiang, Mol. Pharm., 2017, 14, 4618–4627 CrossRef CAS PubMed.
- M. I. Setyawati, V. N. Mochalin and D. T. Leong, ACS Nano, 2016, 10, 1170–1181 CrossRef CAS PubMed.
- T. Liu, I. Kempson, M. de Jonge, D. L. Howard and B. Thierry, Nanoscale, 2014, 6, 9774–9782 RSC.
- Y. R. Zhang, R. Lin, H. J. Li, W. L. He, J. Z. Du and J. Wang, Wiley Interdiscip. Rev.: Nanomed. Nanobiotechnol., 2019, 11, e1519 Search PubMed.
- A. J. Leu, D. A. Berk, A. Lymboussaki, K. Alitalo and R. K. Jain, Cancer Res., 2000, 60, 4324–4327 CAS.
- P. Lu, V. M. Weaver and Z. Werb, J. Cell Biol., 2012, 196, 395–406 CrossRef CAS PubMed.
- I. A. Khawar, J. H. Kim and H. J. Kuh, J. Controlled Release, 2015, 201, 78–89 CrossRef CAS PubMed.
- F. Yuan, M. Leunig, S. K. Huang, D. A. Berk, D. Papahadjopoulos and R. K. Jain, Cancer Res., 1994, 54, 3352–3356 CAS.
- J. Wang, J. D. Byrne, M. E. Napier and J. M. DeSimone, Small, 2011, 7, 1919–1931 CrossRef CAS PubMed.
- R. K. Jain and L. T. Baxter, Cancer Res., 1988, 48, 7022–7032 CAS.
- M. R. Dreher, W. Liu, C. R. Michelich, M. W. Dewhirst, F. Yuan and A. Chilkoti, J. Natl. Cancer Inst., 2006, 98, 335–344 CrossRef CAS PubMed.
- H. Cabral, Y. Matsumoto, K. Mizuno, Q. Chen, M. Murakami, M. Kimura, Y. Terada, M. R. Kano, K. Miyazono, M. Uesaka, N. Nishiyama and K. Kataoka, Nat. Nanotechnol., 2011, 6, 815–823 CrossRef CAS PubMed.
- R. K. Jain and T. Stylianopoulos, Nat. Rev. Clin. Oncol., 2010, 7, 653–664 CrossRef CAS PubMed.
- V. P. Chauhan, Z. Popović, O. Chen, J. Cui, D. Fukumura, M. G. Bawendi and R. K. Jain, Angew. Chem., Int. Ed., 2011, 50, 11417–11420 CrossRef CAS PubMed.
- K. C. Black, Y. Wang, H. P. Luehmann, X. Cai, W. Xing, B. Pang, Y. Zhao, C. S. Cutler, L. V. Wang, Y. Liu and Y. Xia, ACS Nano, 2014, 8, 4385–4394 CrossRef CAS PubMed.
- W. Liu, B. Naydenov, S. Chakrabortty, B. Wuensch, K. Hübner, S. Ritz, H. Cölfen, H. Barth, K. Koynov, H. Qi, R. Leiter, R. Reuter, J. Wrachtrup, F. Boldt, J. Scheuer, U. Kaiser, M. Sison, T. Lasser, P. Tinnefeld, F. Jelezko, P. Walther, Y. Wu and T. Weil, Nano Lett., 2016, 16, 6236–6244 CrossRef CAS PubMed.
- Z. Chu, S. Zhang, B. Zhang, C. Zhang, C. Y. Fang, I. Rehor, P. Cigler, H. C. Chang, G. Lin, R. Liu and Q. Li, Sci. Rep., 2014, 4, 4495 CrossRef PubMed.
- E. J. Chung, L. Leon and C. Rinaldi, Nanoparticles for Biomedical Applications: Fundamental Concepts, Biological Interactions and Clinical Applications, Elsevier, 2019 Search PubMed.
- K. Carver, X. Ming and R. L. Juliano, Mol. Ther.–Nucleic Acids, 2014, 3, e153 CrossRef CAS PubMed.
- X. Xiong, Z. Xu, H. Huang, Y. Wang, J. Zhao, X. Guo and S. Zhou, Biomaterials, 2020, 245, 119840 CrossRef CAS PubMed.
- K. Kardani, A. Milani, S. H. Shabani and A. Bolhassani, Expert Opin. Drug Delivery, 2019, 16, 1227–1258 CrossRef CAS PubMed.
- G. Yamankurt, E. J. Berns, A. Xue, A. Lee, N. Bagheri, M. Mrksich and C. A. Mirkin, Nat. Biomed. Eng., 2019, 3, 318–327 CrossRef CAS PubMed.
- M. Rashid, T. B. Toh, L. Hooi, A. Silva, Y. Zhang, P. F. Tan, A. L. Teh, N. Karnani, S. Jha, C. M. Ho, W. J. Chng, D. Ho and E. K. Chow, Sci. Transl. Med., 2018, 10, eaan0941 CrossRef PubMed.
- H. Wang, D. K. Lee, K. Y. Chen, J. Y. Chen, K. Zhang, A. Silva, C. M. Ho and D. Ho, ACS Nano, 2015, 9, 3332–3344 CrossRef CAS PubMed.
- A. Zarrinpar, D. K. Lee, A. Silva, N. Datta, T. Kee, C. Eriksen, K. Weigle, V. Agopian, F. Kaldas, D. Farmer, S. E. Wang, R. Busuttil, C. M. Ho and D. Ho, Sci. Transl. Med., 2016, 8, 333ra349 Search PubMed.
Footnote |
| † Electronic supplementary information (ESI) available. See DOI: 10.1039/d1nr03502a |
| This journal is © The Royal Society of Chemistry 2021 |