
 Open Access Article
 This Open Access Article is licensed under a Creative Commons Attribution-Non Commercial 3.0 Unported Licence
Mechanism of amorphous phase stabilization in ultrathin films of monoatomic phase change material†
Daniele
Dragoni
 a,
Jörg
Behler
b and
Marco
Bernasconi
*a
a,
Jörg
Behler
b and
Marco
Bernasconi
*a
aDipartimento di Scienza dei Materiali, Università di Milano-Bicocca, Via R. Cozzi 55, I-20125 Milano, Italy. E-mail: marco.bernasconi@unimib.it
bInstitut für Physikalische Chemie, Theoretische Chemie, Universität Göttingen, Tammannstr. 6, 37077 Göttingen, Germany
First published on 20th September 2021
Abstract
Elemental antimony has been recently proposed as a promising material for phase change memories with improved performances with respect to the most used ternary chalcogenide alloys. The compositional simplification prevents reliability problems due to demixing of the alloy during memory operation. This is made possible by the dramatic stabilization of the amorphous phase once Sb is confined in an ultrathin film 3–5 nm thick. In this work, we shed light on the microscopic origin of this effect by means of large scale molecular dynamics simulations based on an interatomic potential generated with a machine learning technique. The simulations suggest that the dramatic reduction of the crystal growth velocity in the film with respect to the bulk is due to the effect of nanoconfinement on the fast β relaxation dynamics while the slow α relaxation is essentially unaffected.
1. Introduction
Chalcogenide phase change materials are attracting an increasing interest for several technological applications ranging from electronic non-volatile memories1–3 and neuro-inspired computing4–6 to photonic devices.7 The prototypical materials for these applications are ternary GeSbTe alloys, mostly on the pseudobinary GeTe–Sb2Te3 tie-line.1 The devices exploit a fast and reversible switching between the crystalline and amorphous phases induced by heating either by electrical current pulses or by laser irradiation in electronic or optical devices. Amorphization of the material is obtained upon heating the crystal above the melting temperature, with subsequent rapid quenching, while recrystallization of the amorphous phase takes place at temperatures in between the glass transition and melting.The high electric fields and high temperature gradients that are present during device operations are responsible for atomic diffusion which, beside incongruent melting, can lead to demixing of the chalcogenide alloy with device failure.8,9 Moreover, scaling of the devices can exacerbate the cell-to-cell variability due to compositional variations which are unavoidable in multielement alloys.
Recently, it has been proposed that these reliability problems could be overcome by using pure antimony as a monoatomic phase change material.10 Although amorphous Sb crystallizes very rapidly or even explosively at normal conditions in the bulk,11 crystallization is hindered in ultrathin films 10–3 nm thick encapsulated by capping layers (a silica substrate plus a (ZnS)8-(SiO2)2 capping). Stabilization of the amorphous phase at 286 K for up to tens of hours has been shown indeed for the thinnest film of 3 nm.10 Confinement of antimony at the nanoscale also leads to a dramatic reduction of the structural relaxations responsible for the aging and the drift in time of the electrical conductivity in the amorphous phase10 which could be further exploited for precise neuromorphic computing.12 Switchable antimony films with thickness below 15 nm have also been proposed very recently for photonic applications.13
Molecular dynamics (MD) simulations based on Density Functional Theory (DFT) revealed that the protocol used to generate the amorphous phase has strong effects on the crystallization kinetics of Sb.10 An abrupt quenching from the melt to 300 K yielded indeed an amorphous model that did not crystallize by homogeneous nucleation over 0.8 ns, while a supercritical nucleus appeared within 100 ps at 300 K in a model quenched from 900 to 300 K in about 60 ps.10 It is, however, unclear whether the spatial confinement in the thin film in the experimental device of ref. 10 could also imply a sufficiently fast quenching.
Different other factors, either dynamical or thermodynamical, could in principle concur to raise the crystallization temperature Tx by decreasing thickness in thin films as reviewed for phase change materials in ref. 14. For instance, a higher interfacial energy with the capping layer for the crystal than for the amorphous phase could also raise Tx. A thickness dependence stress introduced by the interface could affect either the thermodynamics of the crystallization process or most probably the atomic mobility in the film. The presence themselves of thermally stable capping layers is also expected to affect the atomic mobility close to the interface and deeper in the film.15 In the presence of cooperative atomic motions, a change in mobility might also arise once the size of Cooperative Rearranging Region (CRR) in the supercooled liquid phase becomes comparable with the film thickness.15 The formation of strong bonds with the unpassivated surface of the capping layer has also been shown to hinder crystallization in a three-layers Sb2Te3 ultrathin film capped by amorphous silica.16
In this paper, we report on large scale MD simulations of antimony in nanoconfined geometries aiming at uncovering the mechanisms of stabilization of the amorphous phase in ultrathin films. To this end, we made use of an interatomic potential generated by fitting a large database of DFT energies and forces with the machine learning method based on a Neural Network (NN) scheme proposed in ref. 17 and 18. The same framework was exploited previously to generate an interatomic potential for the phase change compound GeTe19 which allowed us to address several properties ranging from dynamical heterogeneity20 and fast crystallization21–23 in the supercooled liquid to structural relaxations and thermal transport in the amorphous phase in the bulk24–26 and in nanowires.27,28
2. Computational details
Molecular dynamics simulations have been performed with an interatomic potential generated with NN scheme of ref. 17 and 18, implemented in the code RuNNer29 which is interfaced with the MD driver Lammps.30 We used a feed-forward neural network featuring 2 hidden layers, 20 nodes per layer, and hyperbolic tangent as activation functions. The input layer consists of a set of 11 radial plus 16 angular symmetry functions with hyper-parameters17,18 which are used to discriminate among inequivalent atomic environments within a distance cutoff of 6.5 Å which is sufficient to include the third coordination shell. In particular, the radial functions are constructed analytically as the sum of Gaussians (both shifted and unshifted), while the angular terms are constructed for all triplets of atoms by summing the cosine values of the bonding angles θijk = Rik·Rij/(RijRik) centered at atom i, where Rij = Ri − Rj is the vector distance between atoms i and j. The parameters of the symmetry functions are chosen as to effectively and uniformly span the region of the parameters space which is most relevant for representing the local atomic environments of the crystalline, amorphous and liquid states that we monitored from the pair correlation and bond angles distribution functions. The network contains about 1000 synaptic weights which are optimized over a large database of DFT total energies and forces of about 23![[thin space (1/6-em)]](https://www.rsc.org/images/entities/char_2009.gif) 000 configurations of crystalline, liquid and amorphous models containing from 54 to 144 atoms at different temperatures and densities. These configurations were generated by DFT molecular dynamics employing the Perdew–Burke–Ernzerhof (PBE) approximation to the exchange and correlation energy functional,31 norm conserving pseudopotentials and the CP2k code.32 Kohn–Sham orbitals were expanded in Triple-Zeta-Valence plus Polarization (TZVP) Gaussian-type basis and the charge density was expanded in a plane-wave basis set with a cutoff of 100 Ry to efficiently solve the Poisson equation within the Quickstep scheme.32 Brillouin Zone (BZ) integration was restricted to the supercell Γ point.
000 configurations of crystalline, liquid and amorphous models containing from 54 to 144 atoms at different temperatures and densities. These configurations were generated by DFT molecular dynamics employing the Perdew–Burke–Ernzerhof (PBE) approximation to the exchange and correlation energy functional,31 norm conserving pseudopotentials and the CP2k code.32 Kohn–Sham orbitals were expanded in Triple-Zeta-Valence plus Polarization (TZVP) Gaussian-type basis and the charge density was expanded in a plane-wave basis set with a cutoff of 100 Ry to efficiently solve the Poisson equation within the Quickstep scheme.32 Brillouin Zone (BZ) integration was restricted to the supercell Γ point.
The total energies and forces of configurations used to train the NN were then computed with the Quantum-Espresso code33 using the PBE functional, norm-conserving pseudopotentials and plane-waves expansion of Kohn–Sham orbitals up to an energy cutoff of 40 Ry. The BZ integration was performed over a uniform mesh by keeping approximatively the same k-point linear spacing of 0.13 Å−1 for all models. Mean square errors in the energy and forces for the training and test sets are given in Fig. S1 in the ESI.† The NN potential was validated by computing the structural properties of the crystalline, liquid and amorphous phases as shown in Fig. S2–S7 and in Table S1 in ESI.† There is evidence in literature that the inclusion of van der Waals (vdW) interactions is important to properly describe the structural properties of phase change materials such as GeTe and Ge2Sb2Te5.34,35 The NN potential was then used in MD simulations supplemented by the Grimme semiempirical vdW interaction potential D2.36 The NN + D2 potential is able to well reproduce the A7 crystalline structure of Sb37 with the alternation of short and long bonds (Table S1 in ESI†). The time step in MD simulations was set of 2 fs. A Nosé–Hoover thermostat (with 3 chains thermostats) was used as implemented in Lammps. The DFT benchmark calculations on liquid and amorphous Sb reported in ESI† were performed with the QE program, a 144-atom cubic supercell at the experimental density of the liquid at Tm and by restricting BZ integration to the supercell Γ point.
We estimated the theoretical NN + D2 melting temperature by means of a phase coexistence approach in constant pressure simulations. We prepared an orthorhombic 11664-atom cell elongated in one direction containing a single crystal slab and a liquid slab previously equilibrated at 850 K, which is our first estimate for the melting point. The single crystal slab was generated in turn from the recrystallization of a melt-quenched amorphous model. The supercell edges were free to adjust in order to maintain a zero hydrostatic pressure. For temperatures below Tm the crystalline slab grows, while for higher temperatures the crystalline slab shrinks. Therefore, by analyzing the movement of the crystal/liquid interface we estimated Tm = 845 K to be compared with the experimental value of Tm = 903 K.38 At 845 K the theoretical equilibrium density of the liquid of ρ = 0.0319 atom Å−3 is in very good agreement with the experimental value at melting of ρ = 0.0320 atom Å−3.39
3. Results and discussion
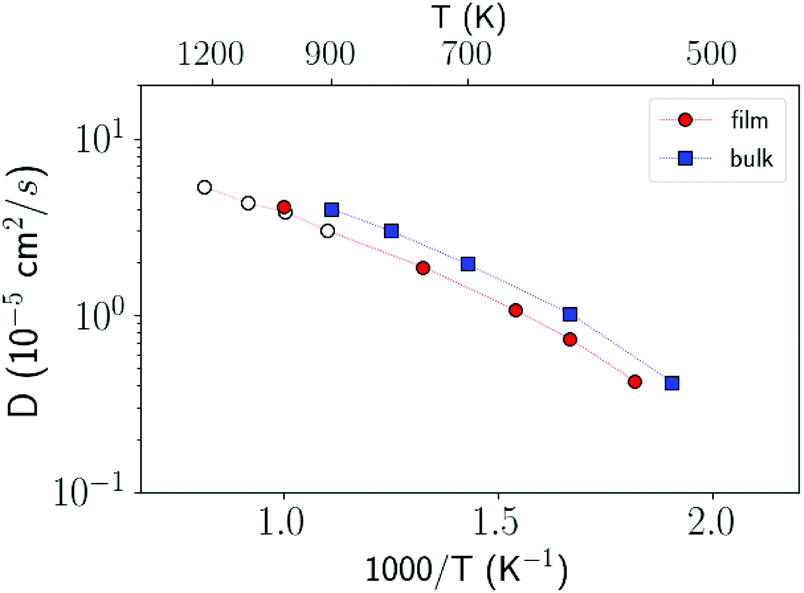
In order to investigate the crystallization process, we first studied the atomic mobility by computing the diffusion coefficient D(T) in the bulk as a function of temperature T. The results reported in Fig. 1 are fitted by an Arrhenius function D = D0exp(−Ea/kBT) with an activation energy Ea = 0.17 eV and a prefactor D0 = 34.4 × 10⁻⁵ cm2 s−1 which are close to the experimental values of Ea = 0.18 eV and D0 = 54.6 × 10⁻⁵ cm2 s−1 from ref. 40.
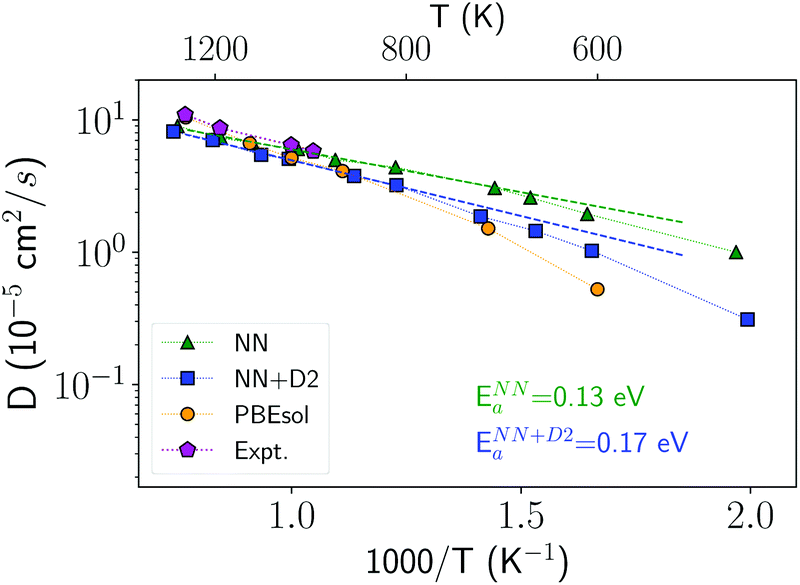 | ||
| Fig. 1 Diffusion coefficient of liquid antimony computed with the NN and NN + D2 potentials compared with the DFT-PBEsol results from ref. 41 and from experiments.40 Simulations are performed at the experimental density of the liquid at the melting point (0.0320 atom Å−3).39 The diffusion coefficient is obtained from the atomic mean square displacement over a simulation time of 100 ps at constant energy (NVE ensemble). | ||
To investigate confinement effects in the stabilization of the amorphous phase, we first considered the crystallization process in the bulk. Antimony is a growth dominated material in which crystallization mostly proceeds from the crystalline/liquid or crystalline/amorphous interface rather than from the homogeneous nucleation of crystallites, at least at the temperatures of maximal crystal growth. DFT molecular dynamics simulations have shown indeed that Sb crystallizes very fast in the presence of a crystalline Sb boundary with growth velocity of about 36 m s−1 at 600 K while no sign of crystal nucleation was detected on the time scale of half a ns at the same temperature.41 In fact, crystal nucleation does occur on the time span of a DFT-MD run, but only in the temperature range 300–500 K as reported in ref. 42 and 43.
In agreement with previous DFT results,41–44 homogeneous crystal nucleation in the supercooled liquid was not observed in NN-MD simulation on a ns time scale above 600 K. Supercritical nuclei appear instead on the time scale of 1–15 ns in the temperature range 300–450 K, but not below 300 K, as we discuss in more details later on. Therefore, in order to explore the crystallization speed in a wide temperature range, we consistently studied the crystal growth at a preformed crystal/amorphous interface which is also believed to be close to the experimental situation realized in the device of ref. 10. To this aim, we built an amorphous model by quenching a liquid model from 1000 K to 300 K in 80 ps with the density fixed at the experimental value for the liquid at the melting point (0.0320 atom Å−3).39 The model contains 11664 atoms in a supercell with edges 14.871 nm × 4.957 nm × 4.957 nm and 3D periodic boundary conditions (PBC).
Then a slice of the simulation cell was annealed at 400 K to promote the formation of a crystalline seed, while all the other atoms in the cell were kept frozen. At these conditions, we observed the formation of a crystalline nucleus that grows fast giving rise to a uniform single-crystal region that spans the entire slice with free atoms, as shown in Fig. 2. The model was then equilibrated at different temperatures in the range 200–800 K at which constant temperature simulations were performed with all atoms free to move. Snapshots of the growth on the crystalline front in the bulk at 300 K is given in Fig. 2. The number of crystalline atoms is obtained in turn by labeling an atom as crystalline or not depending on the value of the order parameter ![[Q with combining macron]](https://www.rsc.org/images/entities/i_char_0051_0304.gif) 4 defined in ref. 45 and in ESI (see Fig. S8†).
4 defined in ref. 45 and in ESI (see Fig. S8†).
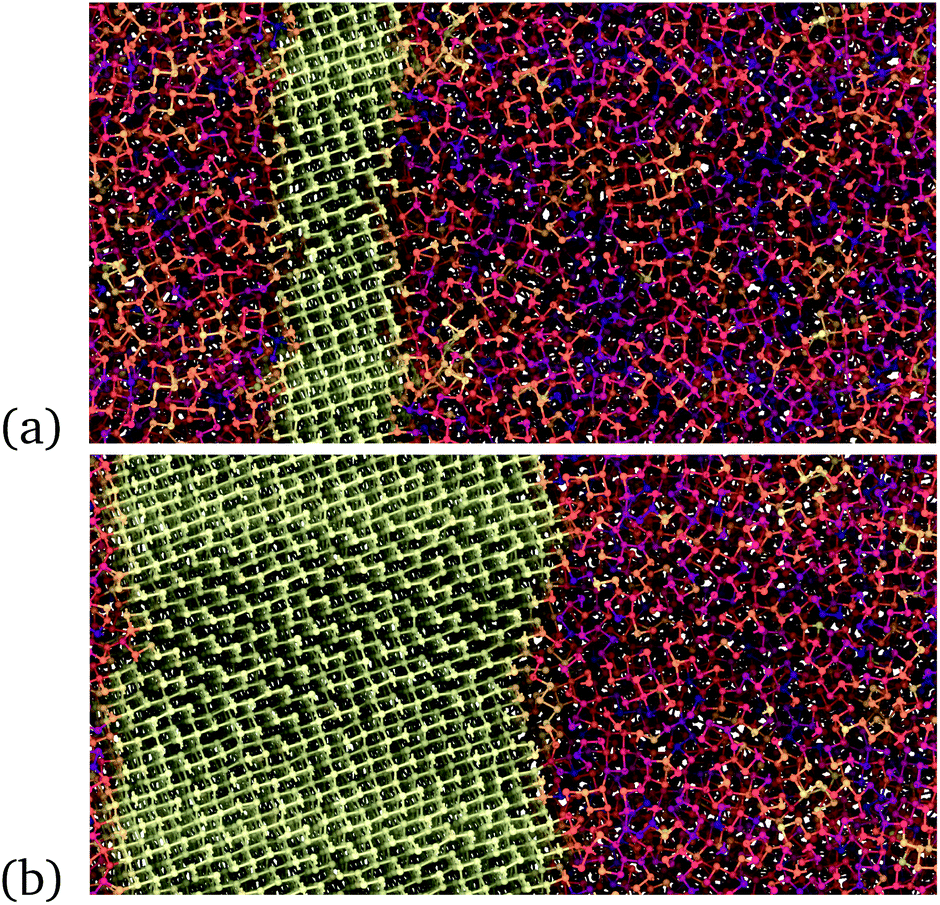 | ||
| Fig. 2 (a) Initial and (b) final configurations of the constant temperature simulation of crystal growth from a crystal/amorphous interface in the bulk at 300 K. The time lag between the initial and final snapshots is 1 ns. The color map reflects the value taken by the 4 parameter for crystallinity (see text, yellow for 4 = 1, dark violet for 4 ≤ 0). | ||
The evolution of the crystal/amorphous interface was then monitored to extract the crystal growth velocities u reported in Fig. 3. The crystal growth velocity is obtained by the time derivative of the effective thickness of the crystalline slab Lcr(t) = Ncr(t)/2Aρ where Ncr(t) is the number of crystalline atoms, ρ is the atomic density and A is the cross section of the simulation cell which corresponds to the area of the growing surface. This definition is justified by the linear growth with time observed for Lcr(t) (Fig. S9 in ESI†) and by the nearly uniform crystal growth over the whole cross section. The factor 1/2 accounts for the fact that two crystal fronts are growing simultaneously from the two sides of the crystalline slab. The crystal growth velocity at 600 K in Fig. 3 is comparable with the value of 36 m s−1 obtained by DFT-MD with the PBEsol functional in ref. 41. We remark that the crystal growth velocities should be weakly dependent on the orientation of the crystal/liquid interface. In fact, we observed a nearly isotropic growth of crystallites nucleated homogeneously as shown in Fig. S10 in ESI.†
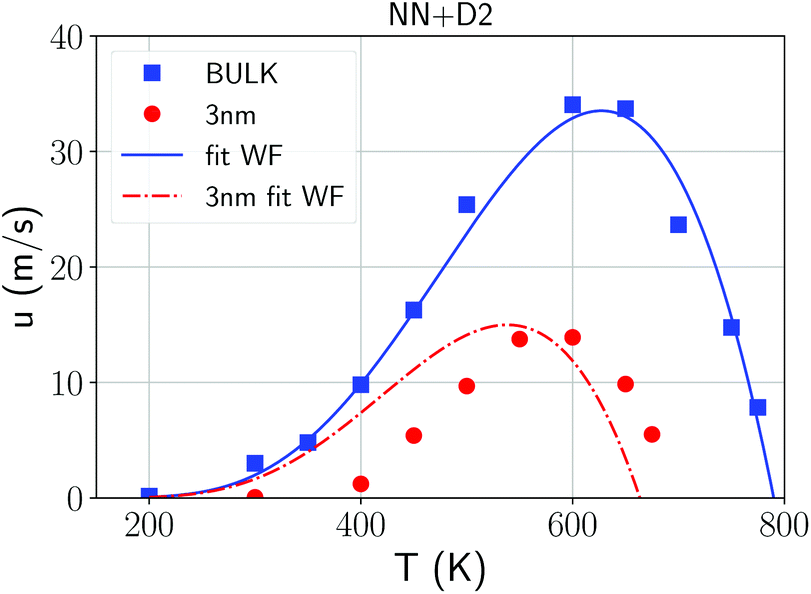 | ||
| Fig. 3 Crystal growth velocities from NN + D2 simulations in the bulk (blue squares) and in the 3 nm film (red dots) with the Wilson–Frenkel (WF) fitting using the Arrhenius-like diffusion coefficient obtained at high temperature for the bulk (blue line, see Fig. 1) and for the film (red curve, see Fig. 5). The crystal growth velocity in the film at 300 K is 0.06 m s−1. | ||
We remark that the alternation of short and long bonds typical of the A7 crystalline phase survives in the amorphous phase although in a disordered manner. On the other hand, the recrystallized amorphous phase also features several defective sites as shown by the angular-limited bond correlation function (ALTBC)46 shown in Fig. S11 in the ESI.†
We attempted to fit the data on the crystal growth velocity with the Wilson–Frenkel (WF) expression as u = ukin(1 − exp(−Δμ/kBT)), where Δμ is the difference in free energy between the crystalline and supercooled liquid phase which was computed according to Thomson and Spaepen47 as 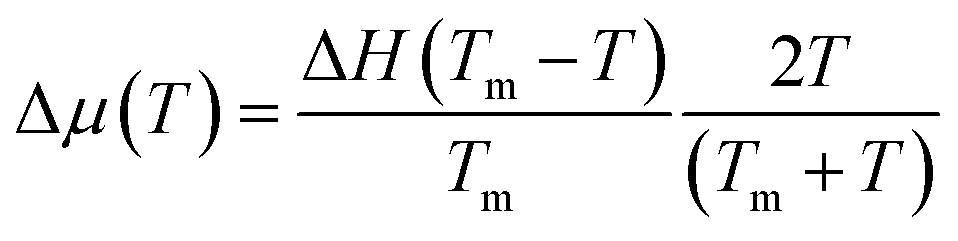 . The latent heat of fusion ΔH = 0.148 eV per atom was calculated at the theoretical (NN + D2) melting point Tm = 845 K, estimated from the phase-coexistence method (see section 2). The theoretical value is close to the experimental value of ΔH = 0.2 eV per atom.48 A better fit of the data on the crystal growth velocity is obtained, however, by setting Tm = 790 K in the Spaepen–Thomson formula (which actually corresponds to the fitting curve in Fig. 3) possibly because the simulations of crystallization are performed at constant volume while the theoretical Tm is correctly obtained from constant pressure simulations which account for variations on the volume per atom upon structural transition. In the approach used here, we consider that the free energy of the overheated amorphous phase is equal to the free energy of the supercooled liquid at the same temperature. In the original Wilson–Frenkel model, the kinetic prefactor ukin is expressed as 6D(T)/λ where D(T) is the temperature dependent diffusion coefficient and λ is a fitting parameter which should be of the order of the jump distance of the elementary diffusion process. The diffusion coefficient entering in ukin should, however, be read as an effective atomic mobility because the diffusion coefficient D(T) is obtained from long range and long time atomic displacements while only local atomic motions actually seem to control the crystal growth of Sb as well as of Sb-rich In AgSbTe alloys (AIST) as shown by DFT-MD simulations in ref. 41 and 49. Nevertheless, a very good fitting of the data in the whole temperature range 200–800 K is obtained by using the Arrhenius function for D(T) resulting in turn from the fitting of the diffusion coefficient at high temperatures (from Fig. 1). The fitting yields a value of λ = 1.2 Å which is close to the value of 1.7 Å obtained from the fitting with the Wilson–Frenkel formula of the DFT-MD data on the crystallization of AIST down to 455 K.50 Note, however, that in the fitting for AIST the crystal growth velocity from WF is 20 % higher than the value obtained from DFT-MD at 585 K while it is a factor two lower at 455 K.50
Although the good fitting with the WF formula seems reassuring on the validity of the simple classical nucleation and growth theory, we must notice that at 350 K and below a plateau appears in the mean square displacement (MSD) as a function of time, as shown in Fig. S12 in ESI.† This behavior is typical of a two steps relaxation dynamics with a faster β relaxation and a slower α relaxation that controls the long range atomic diffusivity after the plateau.51 The system at 300 K behaves as a supercooled liquid close to the glass transition. In fact, antimony in the bulk crystallizes explosively at 300 K. The glass transition is difficult to be measured experimentally in phase change materials because crystallization obscures the exothermic peak in differential scanning calorimetry expected by heating above Tg. Therefore, Tg is often identified with the crystallization temperature. Estimates of Tg are given in literature for Ge doped Sb, with Tg = 382 K for Ge8Sb92 and Tg = 466 K for Ge12Sb88.52 There is a strong suppression of the crystallization and a raise in Tg due to Ge doping. Therefore, one can expect to have Tg close or below 300 K in pure Sb. The MSD in Fig. S12 in ESI† is obtained from constant temperature simulations (NVT) for a better control of temperature; at high temperatures we checked that NVE and NVT simulations with our settings gave the same results for D(T). At 300 K the plateau at about a fraction of Å2 extends up to 1 ns (Fig. S12 in ESI†) while at the same temperature the crystalline front grows by as much as 30 Å on a 1 ns time scale. This would suggest that the crystallization kinetics at low temperature should be controlled by the β relaxation dynamics and not by the diffusion coefficient defined by the α relaxation dynamics at longer times after the plateau in the MSD.
At high temperatures in the supercooled liquid, far from the glass transition in glass former materials, the α and β relaxations actually coincide.51 Still, the good fitting with the WF formula over the whole temperature range with a single activation energy for the atomic diffusivity (see Fig. 3) suggests that the activation energy at high temperatures captures the elemental process of the local atomic motion that also controls the kinetics of crystallization at low temperature.
Actually, the processes responsible for the β relaxation have been proposed to accelerate the crystallization kinetics in metallic glasses53 and more recently in phase change chalcogenide alloys as well.54 The presence of a β relaxation process in phase change materials has been recently identified from the so called β-wing in the temperature dependence of the loss modulus measured by dynamical mechanical spectroscopy (DMS).54
On these premises on the crystallization process in the bulk, we moved to study the crystallization in ultrathin films. We considered the thinnest film of 3 nm studied experimentally in ref. 10. To mimic confinement by the silica capping layers employed experimentally, we proceeded as described below. We considered a supercell with edges 14.871 nm × 4.957 nm × 4.957 nm and PBC in three dimensions. The simulation cell is divided in two regions which are stacked along the z direction and correspond respectively to the encapsulating layer and the active film. The encapsulating layer is approximately 2 nm thick and contains frozen 5340 Sb atoms whose configuration is extracted from a NVT run at 1500 K at a density 15 % higher than the equilibrium density at Tm to mimic the higher atomic density of amorphous silica used as capping layers in ref. 10 (although the density of amorphous silica is about a factor 2.2 higher than that of liquid Sb). The active region, 3 nm thick, contains 7066 atoms free to move at the experimental density of the liquid at the melting point (see Fig. 4). The diffusion coefficient in the film turns out to be very similar to that of the bulk as shown in Fig. 5. The fitting of D(T) in the film with an Arrhenius function yields an activation energy of 0.17 eV and a prefactor of 28.3 × 10⁻⁵ cm2 s−1 which are close to those given above for the bulk. At low temperatures a two steps relaxation in the mean square displacement is present for the film as well.
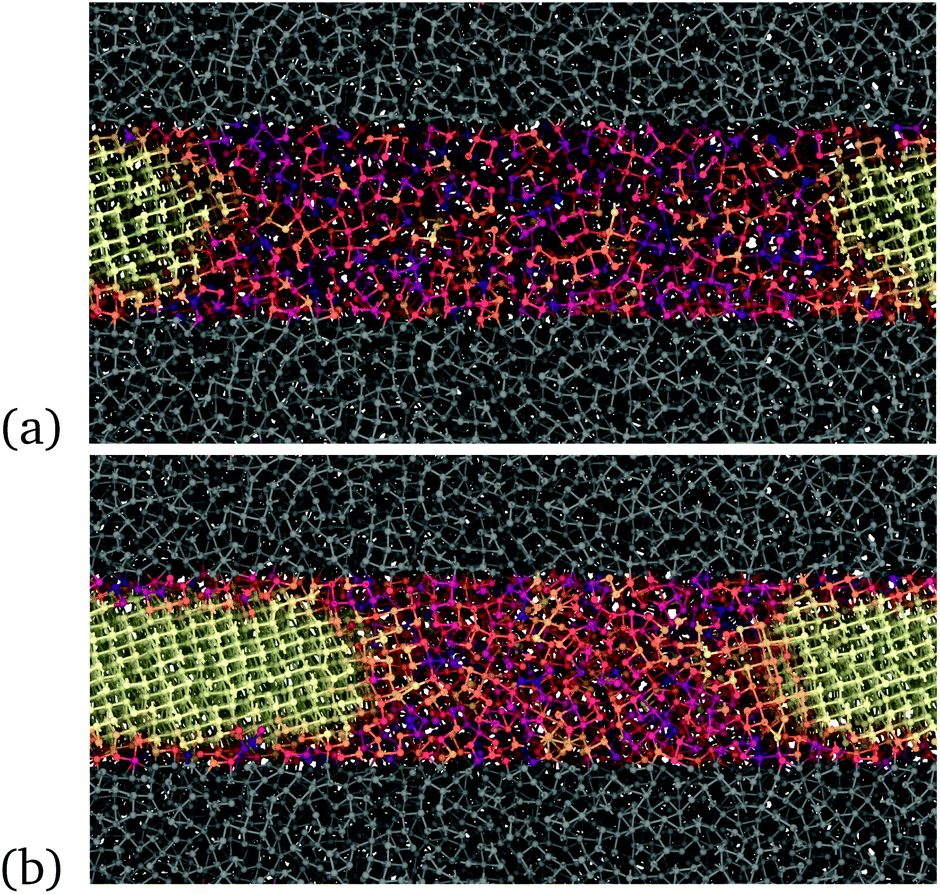 | ||
| Fig. 4 Snapshots of the model of the thin film, 3 nm thick, during crystallization at 300 K and at the experimental density of the liquid at melting. The film is confined on both sides by a region of Sb atoms (gray area) generated from the liquid at a higher density, approximately +15% of the density of the liquid at melting, to mimic a capping layer at high density. The atoms of the capping layers are frozen in a configuration extracted from the MD run at 1500 K. The color code for atoms in the film is the same as in Fig. 2; the crystal grows from the two sides of the figures. | ||
 | ||
| Fig. 5 Diffusion coefficient of the bulk (filled blue squares) and of the 3 nm film (filled red dots) calculated in NVT simulations. The diffusion coefficient in the film is obtained by multiplying by 3/2 the mean square displacements in the xy planes, z being the direction of the 3 nm thickness, i.e. 〈r2〉 = 6Dt, with 〈r2〉 = 3/2(〈x2〉 + 〈y2〉). The empty dots refer to data from NVE simulations in the film at high temperatures. | ||
We then proceeded as we did for the simulation of the crystallization in the bulk. We first generated a uniform amorphous region in the 3 nm thick film by quenching from the melt, and we then crystallized a small slice of the film. We then equilibrated the system at different temperatures with all atoms free to move but those in the capping layer. Note that in Fig. 4 we changed visualisation with respect to the bulk in Fig. 2 in such a way that half of the crystalline slab is on the left and half on the right of the figure in the case of the film. This allows highlighting the shrinking with time of the amorphous region to parallel what we expect to see in the linear device with the two crystalline sides at the electrodes that grow at the expense of a central amorphous region.
Constant temperature simulations were then performed to compute the crystal growth velocity as a function of temperature from the evolution of the crystal-amorphous interface. The evolution of the crystalline front as a function of time in the film at different temperatures is shown in Fig. S13 in ESI.† The same protocols discussed for the simulation of the crystallization in bulk is used here to extract the crystal growth velocity for the film. The results (red dots) are collected and compared in Fig. 3 with the corresponding data for the bulk. The maximum in the crystal growth velocity is much lower in the film than in the bulk and it is located at a lower temperature than in the bulk. A similar comparison was found in the crystallization kinetics in bulk and nanowires of the GeTe phase change compound27 where the lower crystallization speed of the nanowire was ascribed to a lower melting temperature in the nanowire than in the bulk. To investigate this effect, we again used the WF expression 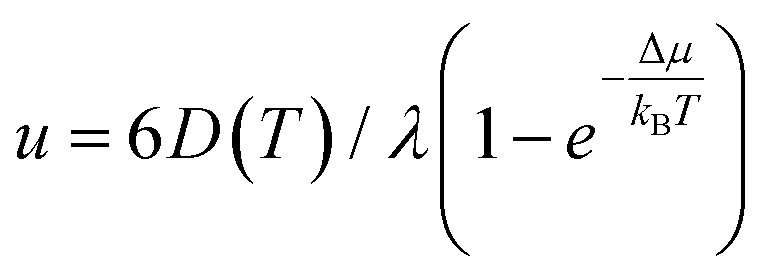 by using the Arrhenius fit of D(T) at high temperature. The interfacial free energy was included in the calculation of Δμ (see below) entering in the Thomson–Spaepen formula with a melting temperature initially set to the value of Tm = 790 K used for the bulk. The fitting yields λ = 0.8 Å which is slightly lower than the value of 1.2 Å obtained for the bulk. The fitting is decent at high temperatures but not at low temperatures for the reasons outlined below.
The large difference in the temperature at which the crystal growth velocity vanishes in the film with respect to the bulk is just due to the interfacial free energy (see Fig. 3). We estimated the difference in the interfacial free energy Δγ between the amorphous and crystalline phases in contact with our model of the capping layer as follows Δγ = (Ua − Uc − N(ua − uc))/2S where N is the total number of active atoms in the 3 nm thick film (7066), Ua and Uc are the time-averaged energies of the thin film model (including the capping layers) in the amorphous and fully crystallized phase at 300 K, ua and uc are the energy per atom in the bulk of the amorphous and crystalline (crystallized) phases at the same temperature, and S is the interfacial area. The calculation yields Δγ = −0.011 eV Å−2 which means that the interfacial energy is lower for the amorphous phase than for the crystal as expected by the higher flexibility of the amorphous phase to adapt to the change in density of the capping layer. This value, corresponding to an energy cost σ = −0.0233 eV per atom in the 3 nm film, is used to correct the difference in free energy between the two phases obtained from the Thomson–Spaepen formula for the bulk once applied to the thin film.
We actually used a temperature independent interfacial free energy which might overamplify the change in the u(T) at high temperatures, in fact the same interfacial free energy which disfavors the crystal with respect to the amorphous phase is expected to reduce the melting temperature in the film as well. The difference in the crystal growth velocities between the bulk and the film at high temperature might thus be ascribed mostly to thermodynamical effects related to the interfacial free energy. This is not the case at low temperatures, where a more interesting behavior emerges related to the strong stabilization of the amorphous phase found experimentally.10
As opposed to the bulk, it turns out that the crystal growth velocity for the thin film at low temperatures is much lower than the prediction of the Wilson–Frenkel formula with the diffusion coefficient D(T) extracted at high temperature (red line in Fig. 3). That amounts to say that the β relaxation, that should control the crystallization at low temperatures is strongly suppressed in the thin film.
The β relaxation, although faster than the α relaxation, has also been shown to feature cooperative effects in simulations of model systems.55–57 In particular, it was shown that randomly pinning only a small fraction of atoms (about 2%) can strongly suppress the β relaxation (and then the β-wing in DMS)58 in a Lennard-Jones glass model.56 We therefore ascribe the stabilization of the amorphous phase towards crystallization in ultrathin antimony film to a reduction of the β relaxation due to confinement effects which is supposed to appear once the size of the CRR involved in the β process approaches the thickness of the film. This conclusion suggests that the experimental measurement of the β-wing by DSM could provide crucial insights on the change in crystallization kinetics of phase change materials in confined geometries.
The β relaxation is supposed to control the short range dynamics and not long range diffusional processes. In the respect, we have observed an enhancement in the atomic mobility at the crystalline/amorphous interface at low temperature (300 K) in the bulk as shown in Fig. 6a. This mobility is measured as the mean square displacement over a 20 ps time lag averaged over slices 3.5 Å thick along the direction of crystal growth. This enhancement is not due to a local increase in temperature due to the heat released in the crystallization process. In fact, the thermostat acting on the ions is able to remove the heat and to keep the temperature nearly constant and uniform during growth. On the other hand, this enhancement is absent at the crystal/amorphous interface in the thin film at the same temperature (see Fig. 6b). One might read the lack of an enhanced mobility at the interface in the thin film as the result of the low crystal growth speed and not as its cause. However, an additional piece of information comes for Fig. 6c and d where we compare the mean square displacement at the crystal/amorphous interface in the bulk and in the thin film at the two temperatures at which the crystal growth velocity is the same in the bulk and in the film, namely 350 K for the bulk and 450 K in the film (see Fig. 3). Again, we see an enhancement of the atomic mobility at the interface in the bulk and not in the film. This can be a coincidence due to the fact that the MSD at the interface necessary to sustain the measured crystal growth velocities coincide with the MSD far from the interface at the same temperature in the film. However, these results might be suggestive of an even more local dynamics controlling the crystal growth than the β dynamics of the amorphous/supercooled liquid in quasi equilibrium.
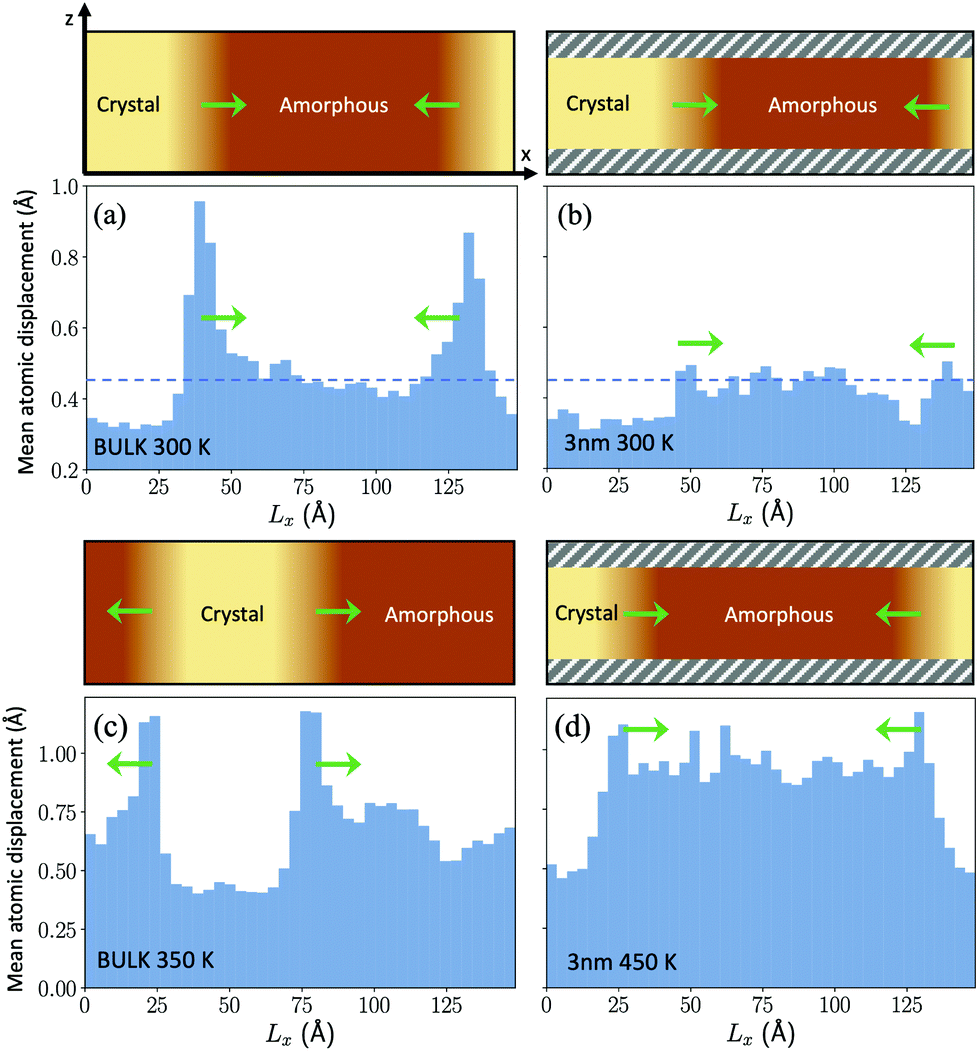 | ||
| Fig. 6 The figure shows the average displacement of atoms over a 20 ps time lag within slices approximately 3.5 Å thick along the growth direction of the crystalline front (Lx) for the bulk (panels (a) and (c)) and for the film (panels (b) and (d)). A sketch of the geometry of the system with an indication of the crystalline and amorphous regions is given in the upper part of each panel. There, the direction of the crystal growth is indicated by green arrows. The z direction is instead the direction of the thickness of the film capped by the two confining layers. The capping layers are indicated by shaded gray regions in the upper part of panels (b) and (d). The dashed horizontal line in panels (a) and (b) indicates the average mean square displacement in the homogeneous amorphous bulk at 300 K. Panels (a) and (c) refer to the crystal growth in the bulk at 300 and 350 K. Panels (b) and (d) refer to the crystal growth in the film at 300 and 450 K. The behaviour of the bulk and of the film are compared at the same temperature (300 K) in panels (a) and (b) and at different temperatures in panels (c) and (d) at which the crystal growth velocities in the film (at 450 K) and in the bulk (at 350 K) are equal (see Fig. 3). The enhancement of the atomic displacement at the growing surface is present in the bulk but not in the film (see text). | ||
As a final remark, we comment on the effect of confinement and of the density on crystal nucleation. The effect on density on crystal nucleation in the bulk was highlighted by the DFT simulations reported in ref. 10. We actually investigated the effect of the density on the crystal nucleation by estimating the incubation time defined operatively as the time elapsed until a markedly change in slope is observed in the number of the crystalline atoms as a function of time which would signal the appearance of a fast growing supercritical nucleus. The results are collected for the bulk (simulation cell with 3888 atoms) at different temperatures and at different densities in the range +2/−5% of the experimental density of the liquid at Tm. A single simulation was performed for each temperature/density condition; due to the stochasticity of the nucleation process the data should therefore be read as qualitative and not quantitative. The missing data points in Fig. 7 correspond to conditions at which the incubation time is longer than 20 ns which is the maximum length we set for our simulations. Models at lower densities clearly show longer incubation times in agreement with the outcomes of DFT molecular dynamics with smaller simulation cells and shorter simulation times.10 We also analyzed crystal nucleation in the model of the capped 3 nm film that contains 7066 atoms. Crystal nucleation was studied by heating at 380 K the amorphous model generated with the protocol discussed previously. The estimated incubation time in the film, 3 nm thick at the experimental density of the liquid, is 3.3 ns which is close to that of the bulk at the same temperature (4.0 ns). Analogously the incubation time of the film with a density 2 % lower than the equilibrium density of the liquid is about 11.3 ns which is again close to the value of 12.0 ns obtained for the bulk at the same conditions. However, since the number of atoms in the bulk models is a factor 1.8 less than the number of atoms in the models of the film, at fixed nucleation rate, the incubation time for the film should be 1.8 factor less than in the bulk. These results suggest, albeit with the large uncertainties due to our very rough estimate of the incubation time from a single simulation, that the confinement can reduce the nucleation rate with respect to the bulk, although not by the same large factor that it was found for the crystal growth velocities.
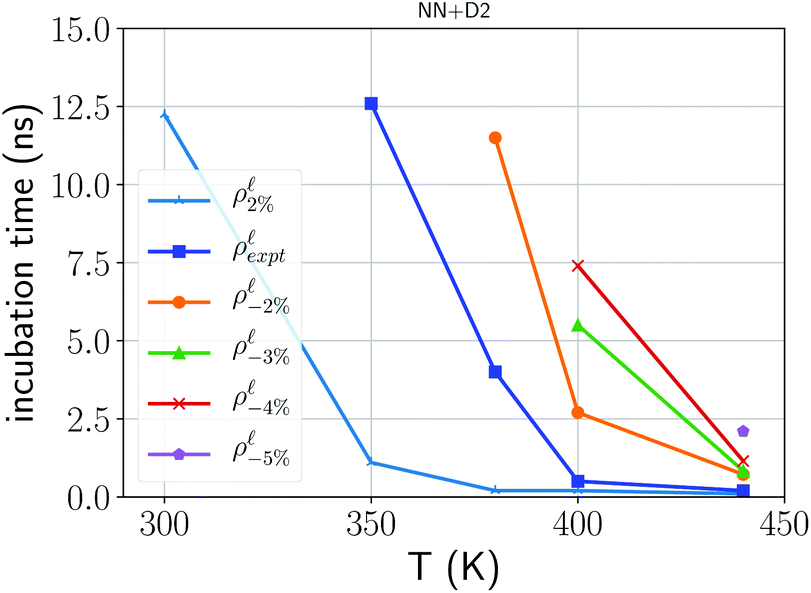 | ||
| Fig. 7 Estimated incubation time for crystal nucleation (see text) in the bulk at different temperatures and at different densities with changes expressed in percentage with respect to the experimental density of the liquid. | ||
4. Conclusions
In conclusions, we have performed large scale molecular dynamics simulations of the crystallization kinetics of the monoatomic phase change material Sb in confined geometry. The simulations confirm the higher stability of the amorphous phase in a 3 nm film, discovered experimentally by Salinga et al.,10 and shed light on the microscopic origin of the increase in the crystallization temperature. As discussed in ref. 10 the higher Tx in confined geometry makes Sb suitable for applications in memories with improved performances because the compositional simplification eliminates reliability problems due to alloy demixing and it mitigates the drift in the electrical resistance due to aging of the amorphous phase which affect the most used GeSbTe phase change alloys. The simulations reveal that at high temperatures in the bulk, crystallization is well described by the Wilson–Frenkel formula for crystal growth with the self diffusion coefficient as kinetic prefactor. Crystallization at low temperatures in the bulk is controlled by atomic motion on a shorter length and time scales typical of the β relaxation dynamics as opposed to the longer length and time scales of the α relaxation responsible for the self-diffusion coefficient. It is this β relaxation dynamics which seems to be strongly affected by the confinement of amorphous Sb in 3 nm thin films. As a matter of fact, we found a dramatic reduction in the crystal growth velocity in the film with respect to the bulk at temperatures equal and lower than 300 K, despite the diffusion coefficient in the film and in the bulk are essentially the same at high temperatures. This outcome suggests that the key for understanding the effect of nanostructuring/confinement on the crystallization kinetics is the analysis of the β relaxation dynamics which just started very recently to be investigated experimentally in bulk phase change materials.54Conflicts of interest
There are no conflicts of interest to declare.Author contributions
D. D. and M. B. conceptualized the work. J. B. contributed to the developement of the interatomic potential. The simulations were performed by D. D. M. B. and D. D. analyzed the data and wrote the paper. All authors approved the final version of the paper.Acknowledgements
This project has received funding from the European Union's Horizon 2020 research and innovation program under grant agreement No. 824957. D. D. acknowledges support by the Project HPC-EUROPA3 (INFRAIA-2016-1-730897) under the H2020 Programme. We gratefully thank R. Mazzarello and M. Salinga for discussions and information. We acknowledge the computational resources provided by the ISCRA program at Cineca (Casalecchio di Reno, Italy).References
- M. Wuttig and N. Yamada, Phase-Change Materials for Rewriteable Data Storage, Nat. Mater., 2007, 6, 824–832 CrossRef CAS PubMed.
- P. Noé, C. Vallée, F. Hippert, F. Fillot and J.-Y. Raty, Phase-Change Materials for Non-Volatile Memory Devices: from Technological Challenges to Materials Science Issues, Semicond. Sci. Technol., 2018, 33, 013002 CrossRef.
- W. Zhang, R. Mazzarello, M. Wuttig and E. Ma, Designing Crystallization in Phase-Change Materials for Universal Memory and Neuro-Inspired Computing, Nat. Rev. Mater., 2019, 4, 150–168 CrossRef CAS.
- G. W. Burr, R. M. Shelby, A. Sebastian, S. Kim, S. Kim, S. Sidler, K. Virwani, M. Ishii, P. Narayanan, A. Fumarola, L. L. Sanches, I. Boybat, M. Le Gallo, K. Moon, J. Woo, H. Hwang and Y. Leblebici, Neuromorphic Computing Using Non-Volatile Memory, Adv. Phys.: X, 2016, 2, 89–124 Search PubMed.
- D. Kuzum, R. G. Jeyasingh, B. Lee and H. S. Wong, Nanoelectronic Programmable Synapses Based on Phase Change Materials for Brain-Inspired Computing, Nano Lett., 2012, 12, 2179–2186 CrossRef CAS PubMed.
- A. Sebastian, M. Le Gallo, G. W. Burr, S. Kim, M. BrightSky and E. Eleftheriou, Tutorial: Brain-Inspired Computing Using Phase-Change Memory Devices, J. Appl. Phys., 2018, 24, 111101 CrossRef.
- M. Wuttig, H. Bhaskaran and T. Taubner, Phase-Change Materials for Non-Volatile Photonic Applications, Nat. Photonics, 2017, 11, 465–476 CrossRef CAS.
- C. Kim, D. Kang, T.-Y. Lee, K. H. P. Kim, Y.-S. Kang, J. Lee, S.-W. Nam, K.-B. Kim and Y. Khang, Direct Evidence of Phase Separation in Ge2Sb2Te5 in Phase Change Memory Devices, Appl. Phys. Lett., 2009, 94, 193504 CrossRef.
- Y.-H. Huang, C.-H. Hang, Y.-J. Huang and T.-E. Hsieh, Electromigration Behaviors of Ge2Sb2Te5 Chalcogenide Thin Films Under DC Bias, J. Alloys Compd., 2013, 580, 449–456 CrossRef CAS.
- M. Salinga, B. Kersting, I. Ronneberger, V. P. Jonnalagadda, X. T. Vu, M. Le Gallo, I. Giannopoulos, O. Cojocaru-Mirédin, R. Mazzarello and A. Sebastian, Monatomic Phase Change Memory, Nat. Mater., 2018, 17, 681–685 CrossRef CAS PubMed.
- N. Kaiser, Crystallization of Amorphous Antimony Films, Thin Solid Films, 1984, 116, 259–265 CrossRef CAS.
- F. Jiao, B. Chen, K. Ding, K. Li, L. Wang, X. Zeng and F. Rao, Monatomic 2D Phase-Change Memory for Precise Neuromorphic Computing, Appl. Mater. Today, 2020, 20, 100641 CrossRef.
- Z. Cheng, T. Milne, P. Salter, J. S. Kim, S. Humphrey, M. Booth and H. Bhaskaran, Antimony Thin Films Demonstrate Programmable Optical Nonlinearity, Sci. Adv., 2021, 7, eabd7097 CAS.
- B. J. Kooi and M. Wuttig, Chalcogenides by Design: Functionality through Metavalent Bonding and Confinement, Adv. Mater., 2020, 132, 1908302 CrossRef PubMed.
- P. Scheidler, W. Kob and K. Binder, The Relaxation Dynamics of a Supercooled Liquid Confined by Rough Walls, J. Phys. Chem. B, 2004, 108, 6673–6686 CrossRef CAS.
- X.-P. Wang, X.-B. Li, N.-K. Chen, B. Chen, F. Rao and S. Zhang, Phase-Change-Memory Process at the Limit: A Proposal for Utilizing Monolayer Sb2Te3, Adv. Sci., 2021, 2004185 CrossRef CAS PubMed.
- J. Behler and M. Parrinello, Generalized Neural-Network Representation of High-Dimensional Potential-Energy Surfaces, Phys. Rev. Lett., 2007, 98, 146401 CrossRef PubMed.
- J. Behler, First Principles Neural Network Potentials for Reactive Simulations of Large Molecular and Condensed Systems, Angew. Chem., Int. Ed., 2017, 56, 12828–12840 CrossRef CAS PubMed.
- G. C. Sosso, G. Miceli, S. Caravati, J. Behler and M. Bernasconi, A Neural-Network Interatomic Potential for the Phase Change Material GeTe, Phys. Rev. B: Condens. Matter Mater. Phys., 2012, 85, 174103 CrossRef.
- G. C. Sosso, J. Colombo, J. Behler, E. Del Gado and M. Bernasconi, Dynamical Heterogeneities in the Supercooled Liquid State of the Phase Change Compound GeTe, J. Phys. Chem. B, 2014, 118, 13621–13628 CrossRef CAS PubMed.
- G. C. Sosso, G. Miceli, S. Caravati, F. Giberti, J. Behler and M. Bernasconi, Fast Crystallization of the Phase Change Compound GeTe by Large Scale Molecular Dynamics Simulations, J. Phys. Chem. Lett., 2013, 4, 4241–4246 CrossRef CAS PubMed.
- G. C. Sosso, M. Salvalaglio, J. Behler, M. Bernasconi and M. Parrinello, Heterogeneous Crystallization of Phase Change Materials via Atomistic Simulations, J. Phys. Chem. C, 2015, 119, 6428–6434 CrossRef CAS.
- S. Gabardi, G. C. Sosso, J. Behler and M. Bernasconi, Priming Effects in the Crystallization of the Phase Change Compound GeTe from Atomistic Simulations, Faraday Discuss., 2019, 213, 287–301 RSC.
- G. C. Sosso, D. Donadio, S. Caravati, J. Behler and M. Bernasconi, Thermal Transport in Phase Change Compounds from Atomistic Simulations, Phys. Rev. B: Condens. Matter Mater. Phys., 2012, 86, 104301 CrossRef.
- D. Campi, D. Donadio, G. C. Sosso, J. Behler and M. Bernasconi, Electron-Phonon Interaction and Thermal Boundary Resistance at the Crystal-Amorphous Interface of the Phase Change Compound GeTe, J. Appl. Phys., 2015, tbf117, 015304 CrossRef.
- S. Gabardi, S. Caravati, G. C. Sosso, J. Behler and M. Bernasconi, Microscopic Origin of Resistance Drift in the Amorphous State of the Phase Change Compound GeTe, Phys. Rev. B: Condens. Matter Mater. Phys., 2015, 92, 054201 CrossRef.
- S. Gabardi, E. Baldi, E. Bosoni, D. Campi, S. Caravati, G. C. Sosso, J. Behler and M. Bernasconi, Atomistic Simulation of Crystallization Kinetics and Ageing of GeTe Nanowires, J. Phys. Chem. C, 2017, 121, 23827–23838 CrossRef CAS.
- E. Bosoni, D. Campi, D. Donadio, G. C. Sosso, J. Behler and M. Bernasconi, Atomistic Simulations of Thermal Conductivity in GeTe Nanowires, J. Phys. D: Appl. Phys., 2020, 53, 054001 CrossRef CAS.
- J. Behler, RuNNer: A Neural Network Code for High-Dimensional Potential-Energy Surfaces, Institut für Physikalische Chemie, Universität Göttingen, Germany, 2020 Search PubMed.
- S. Plimpton, Fast Parallel Algorithms for Short-Range Molecular Dynamics, J. Comput. Phys., 1995, 117, 1–19 CrossRef CAS.
- J. P. Perdew, K. Burke and M. Ernzerhof, Generalized Gradient Approximation Made Simple, Phys. Rev. Lett., 1996, 77, 3865 CrossRef CAS PubMed.
- J. VandeVondele, M. Krack, F. Mohamed, M. Parrinello, T. Chassaing and J. Hutter, Quickstep: Fast and Accurate Density Functional Calculations Using a Mixed Gaussian and Plane Waves Approach, Comput. Phys. Commun., 2005, 167, 103 CrossRef CAS.
- P. Giannozzi, et al., QUANTUM ESPRESSO: a Modular and Open-Source Software Project for Quantum Simulations of Materials, J. Phys.: Condens. Matter, 2009, 21, 395502 CrossRef PubMed.
- H. Weber, M. Schumacher, P. Jóvári, Y. Tsuchiya, W. Skrotzki, R. Mazzarello and I. Kaban, Experimental and ab initio molecular dynamics study of the structure and physical properties of liquid GeTe, Phys. Rev. B, 2017, 96, 054204 CrossRef.
- M. Schumacher, H. Weber, P. Jóvári, Y. Tsuchiya, T. G. A. Youngs, I. Kaban and R. Mazzarello, Structural, electronic and kinetic properties of the phase-change material Ge2Sb2Te5 in the liquid state, Sci. Rep., 2016, 6, 27434 CrossRef CAS.
- S. Grimme, Semiempirical GGA-type Density Functional Constructed with a Long-Range Dispersion Correction, J. Comput. Chem., 2006, 27, 1787–1799 CrossRef CAS.
- C. Barrett, P. Cucka and K. Haefner, The Crystal Structure of Antimony at 4.2, 78 and 298 K, Acta Crystallogr., 1963, 16, 451–453 CrossRef CAS.
- Q. Wang, C. Li, Z. Wu, L. Wang, X. Niu, W. Yan, Y. Xie, S. Wei and K. Lu, Temperature Effect of the Local Structure in Liquid Sb Studied with X-Ray Absorption Spectroscopy, J. Chem. Phys., 2008, 128, 224501 CrossRef CAS PubMed.
- A. Crawley and D. Kiff, The Density and Viscosity of Liquid Antimony, Metall. Mater. Trans. B, 1972, 3, 157–159 CrossRef CAS.
- P. Lamparter and S. Steeb, Self-Diffusion in Liquid Antimony, Z. Naturforsch., A: Phys., Phys. Chem., Kosmophys., 1977, 32, 1021–1024 Search PubMed.
- M. Ropo, J. Akola and R. O. Jones, Crystallization of Supercooled Liquid Antimony: a Density Functional Study, Phys. Rev. B, 2017, 96, 184102 CrossRef.
- I. Ronneberger, Y. Chen, W. Zhang and R. Mazzarello, Local Structural Origin of the Crystallization Tendency of Pure and Alloyed Sb, Phys. Status Solidi RRL, 2019, 13, 1800552 CrossRef.
- I. Ronneberger, Dr. rer. nat. thesis, RWTH Aachen University, 2016.
- J. Hegedüs and S. R. Elliott, Computer-Simulation Design of New Phase-Change Memory Materials, Phys. Status Solidi A, 2010, 207, 510–515 CrossRef.
- W. Lechner and C. Dellago, Accurate Determination of Crystal Structures Based on Averaged Local Bond Order Parameters, J. Chem. Phys., 2008, 129, 114707 CrossRef PubMed.
- C. Bichara, A. Pellegatti and J.-P. Gaspard, Properties of Liquid Group-V Elements: a Numerical Tight-Binding Simulation, Phys. Rev. B: Condens. Matter Mater. Phys., 1993, 47, 5002 CrossRef CAS PubMed.
- C. V. Thomson and F. Spaepen, On the Approximation of the Free Energy Change on Crystallization, Acta Metall., 1979, 27, 1855–1859 CrossRef.
- K. Kelton and A. L. Greer, Nucleation in Condensed Matter: Applications in Materials and Biology, Elsevier, 2010 Search PubMed.
- T. Matsunaga, J. Akola, S. Kohara, T. Honma, K. Kobayashi, E. Ikenaga, R. O. Jones, N. Yamada, M. Takata and R. Kojima, From Local Structure to Nanosecond Recrystallization Dynamics in AgInSbTe Phase-Change Materials, Nat. Mater., 2011, 10, 129–134 CrossRef CAS PubMed.
- W. Zhang, I. Ronneberger, P. Zalden, M. Xu, M. Salinga, M. Wuttig and R. Mazzarello, How Fragility Makes Phase-Change Data Storage Robust: Insights from Ab Initio Simulations, Sci. Rep., 2014, 4, 6529 CrossRef CAS PubMed.
- A. Cavagna, Supercooled Liquids for Pedestrians, Phys. Rep., 2009, 476, 51–124 CrossRef CAS.
- G. Eising, T. Van Damme and B. J. Kooi, Unraveling Crystal Growth in GeSb Phase-Change Films in between the Glass-Transition and Melting Temperatures, Cryst. Growth Des., 2014, 14, 3392–3397 CrossRef CAS.
- T. Ichitsubo, E. Matsubara, T. Yamamoto, H. S. Chen, N. Nishiyama, J. Saida and K. Anazawa, Microstructure of Fragile Metallic Glasses Inferred from Ultrasound-Accelerated Crystallization in Pd-Based Metallic Glasses, Phys. Rev. Lett., 2005, 95, 245501 CrossRef CAS PubMed.
- S.-X. Peng, Y. Cheng, J. Pries, S. Wei, H.-B. Yu and M. Wuttig, Uncovering β-Relaxations in Amorphous Phase-Change Materials, Sci. Adv., 2020, 6, eaay6726 CrossRef CAS PubMed.
- S. Karmakar, C. Dasgupta and S. Sastry, Short-Time Beta Relaxation in Glass-Forming Liquids Is Cooperative in Nature, Phys. Rev. Lett., 2016, 116, 085701 CrossRef PubMed.
- Y. Cohen, S. Karmakar, I. Procaccia and K. Samwer, The Nature of the β-Peak in the Loss Modulus of Amorphous Solids, Europhys. Lett., 2012, 100, 36003 CrossRef.
- H. B. Yu, W. H. Wang, H. Y. Bai and K. Samwer, The β-Relaxation in Metallic Glasses, Natl. Sci. Rev., 2014, 1, 429–461 CrossRef CAS.
- H.-B. Yu, M.-H. Yang, Y. Sun, F. Zhang, J.-B. Liu, C. Z. Wang, K. M. Ho, R. Richert and K. Samwer, Fundamental Link between β Relaxation, Excess Wings, and Cage-Breaking in Metallic Glasses, J. Phys. Chem. Lett., 2018, 9, 5877–5883 CrossRef CAS PubMed.
Footnote |
| † Electronic supplementary information (ESI) available: The validation of the Neural Network potential for Sb and on the crystallization in the bulk and in thin films. See DOI: 10.1039/d1nr03432d |
| This journal is © The Royal Society of Chemistry 2021 |