
MnO2-coated porous Pt@CeO2 core–shell nanostructures for photoacoustic imaging-guided tri-modal cancer therapy†
Qing
Xu‡
a,
Danyang
Li‡
a,
Haijun
Zhou
a,
Biaoqi
Chen
bc,
Junlei
Wang
a,
Shi-Bin
Wang
 bc,
Aizheng
Chen
bc and
Nina
Jiang
*abc
bc,
Aizheng
Chen
bc and
Nina
Jiang
*abc
aCollege of Chemical Engineering, Huaqiao University, Xiamen 361021, China. E-mail: ninajiang@hqu.edu.cn
bInstitute of Biomaterials and Tissue Engineering, Huaqiao University, Xiamen 361021, P. R. China
cFujian Provincial Key Laboratory of Biochemical Technology (Huaqiao University), Xiamen 361021, P. R. China
First published on 7th September 2021
Abstract
We describe the synthesis of MnO2-coated porous Pt@CeO2 core–shell nanostructures (Pt@CeO2@MnO2) as a new theranostic nano-platform. The porous Pt cores endow the core–shell nanostructures with high photothermal conversion efficiency (80%) in the near-infrared region, allowing for photothermal therapy (PTT) and photoacoustic imaging (PA) of tumors. The combination of the Pt core and porous CeO2 interlayer enhances the separation of photo-generated electrons and holes, which is beneficial for the generation of singlet oxygen. With the porous structures of the cores and interlayers, the Pt@CeO2@MnO2 nanostructures are further loaded with an anti-cancer drug (doxorubicin, DOX). The degradation of the MnO2 shell in the tumor microenvironment (TME) can generate O2 for enhanced photodynamic therapy (PDT) and simultaneously trigger DOX release. PA imaging shows good accumulation and retention of DOX-loaded Pt@CeO2@MnO2 in tumors, which guides precise laser irradiation to initiate combined PTT and PDT. The synergistic PTT/PDT/chemotherapy demonstrated by DOX-loaded Pt@CeO2@MnO2 yields remarkable therapeutic outcomes in vitro and in vivo. Taken together, our DOX-loaded Pt@CeO2@MnO2 provides a new avenue for designing high-performance nano-platforms for imaging and therapeutics.
 Nina Jiang | Dr. Nina Jiang received her Ph.D. degree in materials science and engineering in 2014 from The Chinese University of Hong Kong under the guidance of Professor Jianfang Wang, and then worked as a postdoctoral researcher at The Chinese University of Hong Kong for one year. She has been an Associate Professor in the College of Chemical Engineering of Huaqiao University in Xiamen, China since 2016. Her current research interests include novel inorganic nanomaterials for biomedical applications and metal–conductive polymer hybrid nanostructures for active plasmonics. |
Introduction
Recent advances in the studies of cancer therapy have been extended from monotherapy to multimodal therapy.1–3 Combined chemo-/photothermal/photodynamic therapy enables a high anticancer efficacy at a low dosage of therapeutic agents.4–6 In the tri-modal therapy, the heat generated by photothermal agents facilitates the tumor cell uptake of drug carriers, and increases the release of drugs and photodynamic agents.7–9 Meanwhile, the reactive oxygen species (ROS) produced by photodynamic agents enhance intracellular drug delivery by avoiding endosomal uptake.10–13 The cooperative enhancement of photothermal therapy (PTT) and photodynamic therapy (PDT) can overcome the multidrug resistance of tumors and avoid high-dose-induced side effects in chemotherapy. Realization of such synergistic effects among the individual treatments is believed to rely on integration of multiple therapeutic modalities in one platform rather than simple mixing. Encapsulation of drug molecules and photothermal and photodynamic agents in custom-designed nanocarriers is a common strategy to fabricate a multifunctional platform for the tri-modal therapy.14–17 However, the obtained platform is rather complicated and encounters potential molecule leakage in multi-step encapsulation. To overcome these shortcomings, one component that can act as a photothermal and photodynamic drug carrier is highly desired in the design of the multifunctional platform.Porous platinum nanoparticles (Pt NPs) have accessible channels for drug loading and release. Moreover, they have been considered as an attractive photothermal conversion agent owing to the plasmon-induced broadband absorption from the near-infrared (NIR) to the ultraviolet region.18 Under NIR laser irradiation, the heat generated in the plasmon decay causes an increase in the temperature of the surrounding environment, thus opening up opportunities for photothermal therapy (PTT). Besides hyperthermia, the hot electrons during the plasmon decay of Pt NPs also induce cancer cell death, because they can be trapped by oxygen molecules, forming ROS such as singlet oxygen (1O2) and superoxide species.19,20 However, the photodynamic effect of Pt NPs is significantly limited by the fast electron–hole recombination. Building plasmonic metal/semiconductor interfaces is an efficient way to enhance electron–hole separation.21–25 Ceria (CeO2) as an n-type semiconductor can form an appropriate Schottky barrier with Pt nanoparticles for trapping the transferred hot electrons.26 Moreover, abundant oxygen vacancies in the surface of CeO2 facilitate the adsorption of O2 for the generation of ROS.23,27,28 Therefore, hybrid CeO2/Pt nanostructures have great potential as a promising photothermal and photodynamic nanocarrier. As far as we know, there have been no reports on multifunctional platforms consisting of CeO2 and Pt for cancer therapy.
In addition to desirable therapeutic agents, efficient drug delivery to the tumor tissue is critical for the tri-modal therapy. The design and construction of drug delivery systems that are responsive to the inherent features of the tumor microenvironment (TME) are believed to hold great promise for tumor-specific cancer treatment.29,30 Manganese dioxide (MnO2) can react with H+, H2O2 and glutathione (GSH) in the TME, yielding Mn2+ and O2.31–33 The release of O2 relieves tumor hypoxia and improves the photodynamic effect. Thus, the incorporation of MnO2 endows drug delivery systems with tumor-targeted drug release and self-enhanced photodynamic therapy.
Herein, we develop a multifunctional theranostic nano-platform based on MnO2-coated porous Pt@CeO2 core–shell nanostructures (denoted as Pt@CeO2@MnO2), as shown in Scheme 1. Upon 808 nm laser irradiation, the Pt@CeO2@MnO2 nanostructures produce 1O2 and heat owing to their broadband absorption in the NIR region. The local hyperpyrexia enables the photoacoustic (PA) imaging of tumors, thereby guiding the laser irradiation for photothermal and photodynamic therapy. The porous channels in the Pt and CeO2 layers provide the space for loading of an anticancer drug, doxorubicin (DOX). The decomposition of the MnO2 shells in the presence of endogenous acidic H2O2 leads to the release of DOX and O2, allowing for TME-responsive drug delivery and an enhanced outcome of PDT. The combination of PTT/PDT/chemotherapy realized by the DOX-loaded Pt@CeO2@MnO2 nanostructures (denoted as DOX-Pt@CeO2@MnO2) yields a remarkable therapeutic effect in vitro and in vivo.
 | ||
| Scheme 1 Schematic illustration for the preparation of DOX-Pt@CeO2@MnO2 stabilized by PEG and its associated mechanistic pathways in the PA imaging-guided synergistic multimodal cancer therapy. | ||
Experimental
Growth of porous Pt NPs
An ascorbic acid solution (3 mL, 0.04 M) was added to a mixture of aqueous K2PtCl4 (2 mL, 0.01 M) and HO(CH2CH2O)20C16H33 (Brij58, 5 mL, 0.04 M). The resultant solution was kept at room temperature under ultrasonication for 1 h. The resultant Pt nanoparticles were separated from the reaction solution by centrifugation and redispersed in water for further use.Preparation of Pt@CeO2 nanostructures
The as-grown porous Pt NP solution (0.1 mL, mass concentration: 2.5 mg mL−1) was added to a cetyltrimethylammonium bromide (CTAB) solution (10 mL, 0.005 M), followed by the addition of a NaOH solution (0.12 mL, 0.1 M). After mixing the solution by ultrasonication for 10 min, a Ce(NO3)3 solution (0.04 mL, 0.04 M) was added and the mixture solution was kept under shaking at 60 °C in a thermostat steam bath vibrator. The reaction mixture was left undisturbed overnight at 60 °C. The resultant core/shell nanostructure product was separated from the reaction solution by centrifugation and then redispersed in water for further use.Preparation of PEG-stabilized Pt@CeO2@MnO2 nanostructures
The as-prepared Pt@CeO2 nanostructure solution (10 ml, 0.1 mg mL−1) was mixed with manganese acetate solution (50 μL, 25 mM) and PEG solution (2 mg mL−1, 50 μL, MW = 4000), and then incubated at room temperature without any disturbance for 30 min. NaCO3 solution (120 μL, 0.1 M) was added into the above mixture solution under ultrasonication for 30 min. The resultant PEG-stabilized Pt@CeO2@MnO2 nanostructure sample was obtained by centrifugation.Characterization
Scanning electron microscopy (SEM) images were obtained on a Hitachi S-4800 scanning electron microscope operated at 10 kV. Transmission electron microscopy (TEM) images were obtained on an FEI/Talos F200X G2 microscope operated at 200 kV. Extinction spectra were recorded on a UV-Vis spectrophotometer (Lambda 1050). Fourier transform infrared (FT-IR) spectra were recorded using an FT-IR spectrometer (NICOLET iS 50). X-ray diffraction (XRD) patterns were recorded on a PANalytical X'Pert PRO diffractometer with Cu Kα radiation (λ = 1.5418 Å) operated at 40 kV and 40 mA. ICP-MS measurements were performed on an Agilent 7800 system. Thermogravimetric analysis was performed on a Mettler TGA/DSC3+ analyzer at a heating rate of 10 K min−1 under an oxygen atmosphere. Dynamic light scattering (DLS) was performed on a Brookhaven NanoBrook Omni instrument.Determination of photothermal conversion efficiency
The Pt@CeO2@MnO2 nanostructure solution (1 ml, 200 mg mL−1) was added into a 1 cm path length quartz cuvette that was covered with a foam cap. With stirring, the solution was irradiated with an 808 nm laser at different power intensities (0.7, 1.0, 1.3, and 1.6 W) for 30 min. The area of the laser light spot was 1 cm2. A K-type thermocouple connected to a digital thermometer (CIE 305) was used to measure the temperature of the solution at each certain period of time. The cooling curve was obtained after the laser was switched off. The photothermal conversion efficiency (η) was calculated using the equation in a previous report.34Determination of ROS
The generation of 1O2 in Pt NPs, Pt@CeO2 nanostructures and Pt@CeO2@MnO2 nanostructures under 808 nm laser irradiation was monitored using 9,10-anthracenediyl-bis(methylene) dimalonic acid (ABDA) as a probe. ABDA reacts irreversibly with 1O2 to yield an endoperoxide, leading to a decrease in the fluorescence signal at 407 nm. In brief, an ABDA solution (1 mL, 100 μM) was mixed with the Pt@CeO2@MnO2 solution (1 mL, 0.1 mg mL−1). The mixture solution was irradiated with an 808 nm laser (1 W cm−2) for different time intervals. The generation of 1O2 was determined by measuring the fluorescence of the mixture solution under excitation at 380 nm.The intracellular ROS generation of the Pt@CeO2@MnO2 nanostructures with and without DOX loading was detected using 2′,7′-dichlorodihydrofluorescein diacetate (DCFH-DA). Typically, human liver cancer (HepG-2, BEINA, Beijing, China) cells were incubated in a six-well plate with coverslips. After 24 h incubation, the culture media were replaced with the nanostructure solution (200 μL, 200 μg mL−1) for another 4 h. Then, the cells were stained with DCFH-DA for 30 min and irradiated with an 808 nm laser (1 W cm−2) for 5 min. Finally, the cells were washed three times with PBS and imaged using a confocal fluorescence microscope (CLSM, Leica TCS SP8, Braunschweig, Germany).
In vitro degradation of MnO2 shells in DOX-Pt@CeO2@MnO2 nanostructures
The in vitro degradation of MnO2 shells was studied by recording the extinction spectra of DOX-Pt@CeO2@MnO2 nanostructures in different media. In brief, PBS solutions (pH 5.5) containing glutathione (GSH) and/or H2O2 were used to simulate the tumor microenvironment. PBS solutions (pH 7.4) with and without GSH and H2O2 were used as control groups. The Pt@CeO2@MnO2 nanostructures (0.1 mg) were dispersed in these PBS solutions (1 mL), which were further analyzed by UV-Vis spectra at given time intervals.DOX loading and releasing test
To realize the loading of DOX in the Pt@CeO2@MnO2 nanostructures, the Pt@CeO2 nanostructures (10 mg) were mixed with DOX solution (10 mL, 0.1 mg mL−1) under stirring for 24 h at room temperature, and then separated from the solution by centrifugation. The supernatant solution was collected for UV-Vis measurement with the typical absorbance wavelength at 480 nm. The loading rate of DOX was calculated as: loading rate (%) = (WDOX − WDOX in supernatant solution)/WDOX. After the loading of DOX, the Pt@CeO2 nanostructures were coated with MnO2 as mentioned above. DOX-Pt@CeO2@MnO2 was kept for the further release process. Typically, DOX-Pt@CeO2@MnO2 (1 mg) was dispersed in 10 mL of PBS at 37 °C under gentle shaking, and the supernatant was kept for further UV–Vis analysis. This release process was repeated at various time intervals. The concentration of DOX in the solution was determined from the UV–Vis spectra with the typical absorbance wavelength at 480 nm.In vitro cellular uptake
The uptake of DOX-Pt@CeO2@MnO2 on HepG-2 cells was observed using a CLSM. The fluorescence channel of DOX was monitored to investigate the intracellular uptake of the nanostructures. HepG-2 cells were seeded and incubated overnight in a 24-well culture plate. Thereafter, DOX-Pt@CeO2@MnO2 (200 mg mL−1, containing 30 μg mL−1 DOX) was added to the wells and incubated for 1, 4 and 8 h, respectively. Then, the cells were stained with 4′,6-diamidino-2-phenylindole (DAPI). Finally, a CLSM (Leica TCS SP8, Braunschweig, Germany) was used to record the fluorescence images of the cells. To investigate the location of the internalized nanostructures, Lyso-Tracker Green was used to stain lysosomes, and the nanostructures were labeled with polyethylene glycol–fluorescein isothiocyanate (PEG5000-FITC). HepG-2 cells were cultured with the FITC-labled nanostructures for 4 h, then stained with Lyso-Tracker Green, and finally imaged using a CLSM.In vitro cytotoxicity
In vitro cytotoxicity assay was performed against HepG-2 cells using the MTT assay. The cells were seeded in 96-well plates (5000 cells per well). After incubation for 24 h, the 4T1 cells were replaced with fresh medium, and the cells were treated with the DOX-Pt@CeO2@MnO2 solutions with the concentrations of 10, 25, 50, 100, 150, and 200 μg mL−1. After incubation for 10 h, the cells were rinsed with PBS, and treated with 808 nm laser irradiation (1 W cm−2, 3 min) for obtaining the laser irradiation groups. After that, the treated cells were incubated for 14 h, and then the MTT reagent (10 mL, 5 mg mL−1) was added to each well and further incubated for 4 h at 37 °C. DMSO (150 μL) was added to the wells and the absorbance at 570 nm was recorded. The proportion of viable cells in the experimental group to the control group was defined as the cytotoxicity. In comparison with DOX-Pt@CeO2@MnO2, the equivalent DOX at the concentrations of 1.4, 3.5, 7, 10, 14, and 30 μg mL−1 were selected to study the cytotoxicity of free DOX.In vivo PA imaging
PA imaging was performed using a PA imaging system (Endra Nexus 128 scanner, Michigan, USA). The DOX-Pt@CeO2@MnO2 solutions (100 μL, 5 mg mL−1) were intravenously injected into the tumor-bearing mice, along with the injection of PBS as a control group. After post-injection for various time intervals, the PA signals of the tumor site were recorded.In vivo therapeutic efficacy
All animal procedures were performed in accordance with the Principles of National Institute of Health Animal Care and the Animal Management Rules of the Ministry of Health (People's Republic of China) and approved by the Animal Ethics Committee of Medical College of Huaqiao University, China (A2020029). Four groups of mice (4 per group) with HepG-2 tumor volumes of ∼100 mm3 were treated with: (1) PBS solutions; (2) 808 nm laser irradiation; (3) free DOX; (4) Pt@CeO2@MnO2 nanostructure + laser; and (4) DOX-Pt@CeO2@MnO2 + laser, respectively. After 8 h injection, the tumor was irradiated with an 808 nm laser (1 W cm−2) for 10 min. The tumor sizes and body weights were measured every day after therapeutic administration. The tumor volume (mm3) was calculated as V = AB2/2, where A and B are the maximum and minimum diameters of the tumor. Mice were finally euthanized, and the main organs were harvested for histology analysis by hematoxylin and eosin staining (H&E staining).Results and discussion
Porous Pt NPs as the cores were prepared in aqueous solutions using HO(CH2CH2O)20C16H33 (Brij58) as the stabilizing and structure-directing agent. The resultant porous Pt NPs show an average diameter of 48 ± 2 nm (Fig. 1a). The coating of porous CeO2 layers on the Pt cores was achieved using Ce(NO3)3 as the precursor and cetyltrimethylammonium (CTAB) as the pore maker and structural stabilizer. Owing to the affinity for the oxygen atom in the hydrophilic part of Brij58, the Ce3+ ions undergo hydrolysis, condensation and oxidation on the surface of Pt NPs in the presence of O2, leading to the heterogeneous nucleation and growth of a porous CeO2 layer. The thickness and morphology of the CeO2 layer are dependent on the amount of Ce(NO3)3. When the volume of the Ce(NO3)3 solution (0.04 M) is above 0.04 mL, porous CeO2 starts to form complete shells on porous Pt NPs (Fig. S1†). However, as the Ce(NO3)3 volume is above 0.1 mL, the resultant core/shell nanostructures have similar sizes (Fig. S1†). We believe that this result is attributed to the growth of CeO2 in the porous channel of Pt NPs at the high Ce(NO3)3 amount. To obtain accessible channels for drug loading, the Ce(NO3)3 volume of 0.1 mL was employed in the synthesis of Pt@CeO2 nanostructures. The average thickness of the porous CeO2 layer measured from the TEM image is 10 ± 2 nm (Fig. 1b and Fig. S1d). After CeO2 coating, a MnO2 layer was grown on the Pt@CeO2 nanostructure using manganese acetate as the precursor in the presence of PEG. The Mn2+ ions in alkaline medium are oxidized into MnO(OH)2 by oxygen, and then transformed into MnO2 by the dehydration reaction.35 The PEG molecules act as a structural stabilizer because they have good affinity for the manganese hydroxyl compound during the generation of MnO2 shells.36 TEM images show that the Pt@CeO2 nanostructures are coated with amorphous MnO2 shells (Fig. 1c and Fig. S2†). The SEM image shows that the MnO2 shells well block the pores on the CeO2 surface (Fig. S3†). The resultant Pt@CeO2@MnO2 nanostructures were further investigated by scanning transmission electron microscopy (STEM) imaging and elemental mapping (Fig. 1d and e). The XRD pattern of Pt@CeO2@MnO2 nanostructures shows three sets of diffraction peaks which are assigned to the cubic phase of CeO2 (JCPDS 00-043-1002), the face-centered-cubic phase of Pt (JCPDS 01-089-7382), and MnO2(JCPDS no.42-0141) with an amorphous state, respectively. The amounts of Pt, CeO2 and MnO2 in the three-layer core/shell nanostructures were determined by inductively coupled plasma mass spectrometry (ICP-MS) (Fig. S4†). The mass ratio of Pt, CeO2 and MnO2 is calculated to be 1![[thin space (1/6-em)]](https://www.rsc.org/images/entities/char_2009.gif) :1.86:2.43 according to the result of ICP-MS. PEG on the surface of Pt@CeO2@MnO2 nanostructures was verified by the FT-IR spectrum (Fig. S5†). The Pt@CeO2@MnO2 nanostructures show the characteristic peaks of PEG: 1220 and 1080 cm−1 (the stretching of the C–O–C bond) and 3450 cm−1 (the stretching vibration of O–H). The content of PEG in the nanostructures is determined by thermogravimetric analysis (Fig. S6†). The slight weight loss before 200 °C is due to the evaporation of absorbed water. The weight loss at 200 °C–400 °C is ascribed to the decomposition of PEG chains.37 The content of PEG is calculated to be ∼9 wt%.
:1.86:2.43 according to the result of ICP-MS. PEG on the surface of Pt@CeO2@MnO2 nanostructures was verified by the FT-IR spectrum (Fig. S5†). The Pt@CeO2@MnO2 nanostructures show the characteristic peaks of PEG: 1220 and 1080 cm−1 (the stretching of the C–O–C bond) and 3450 cm−1 (the stretching vibration of O–H). The content of PEG in the nanostructures is determined by thermogravimetric analysis (Fig. S6†). The slight weight loss before 200 °C is due to the evaporation of absorbed water. The weight loss at 200 °C–400 °C is ascribed to the decomposition of PEG chains.37 The content of PEG is calculated to be ∼9 wt%.
 | ||
| Fig. 1 TEM images of (a) porous Pt NPs, (b) Pt@CeO2 and (c) Pt@CeO2@MnO2 nanostructures. (d) STEM images of a single Pt@CeO2@MnO2 nanostructure and elemental mapping images of Pt, Ce and Mn. (e) XRD pattern of the Pt@CeO2@MnO2 nanostructures. | ||
To study the optical properties of Pt NPs before and after coating of CeO2 and MnO2, their extinction spectra were recorded. The porous Pt NPs as the cores exhibit plasmon-induced broad light absorption from the ultraviolet to the NIR region (Fig. 2a).38 After CeO2 coating, a broad absorption peak corresponding to the bandgap of CeO2 appears at 314 nm (Fig. 2a).39 Compared with the Pt NPs and Pt@CeO2 nanostructures, the Pt@CeO2@MnO2 nanostructures exhibit stronger absorption from the ultraviolet to the NIR region, which is the contribution of the typical absorption of pure MnO2 (Fig. 2a).35 The remarkable light absorption over a broad NIR region makes the Pt@CeO2@MnO2 nanostructure sample has potential as a photothermal agent. The photothermal properties of the nanostructures were studied under 808 nm laser irradiation. Fig. 2b shows the temperature rise traces of the Pt@CeO2@MnO2 nanostructures under 808 nm laser irradiation at different power intensities. The temperature undergoes a rapid increase and then reaches a plateau after ∼20 min. The steady-state temperature at the laser powers of 0.7, 1.0, 1.3 and 1.6 W are 46 °C, 56 °C, 64 °C and 72 °C, respectively. The photothermal conversion efficiency (η) of the Pt@CeO2@MnO2 nanostructure sample was calculated according to the following equation

 | ||
| Fig. 2 Pt@CeO2@MnO2 nanostructures as a phototheranostic agent for the NIR-induced generation of heat and 1O2. (a) Extinction spectra of the porous Pt NP, Pt@CeO2 and Pt@CeO2@MnO2 nanostructure samples in water. The samples have the same mass concentration of Pt (50 μg mL−1). (b) Temperature rise traces of the Pt@CeO2@MnO2 nanostructures in water (1 mL, 200 μg mL−1) under 808 nm laser irradiation at different power intensities for 30 min. (c and d) PA signal values and images of Pt@CeO2@MnO2 nanostructures with various concentrations. (e) Reaction between ABDA and 1O2. (f) Normalized reductions in the fluorescence intensity of ABDA at 407 nm as functions of the irradiation time. | ||
The photo-induced generation of 1O2 from the Pt@CeO2@MnO2 nanostructures under 808 nm laser irradiation was investigated by employing 9,10-anthracenediyl-bis(methylene) dimalonic acid (ABDA) as a probe in a PBS solution (pH 5.5) containing H2O2 (1 mM, 200 μL). ABDA irreversibly reacts with 1O2 to yield an endoperoxide (Fig. 2e), leading to a decrease in the fluorescence signal at 407 nm under 380 nm excitation. The PBS solution (pH 5.5) was used to simulate the mild acidic environment of lysosomes in cancer cells. For comparison, control experiments were carried out using the Pt@CeO2 nanostructures and Pt NPs (Fig. S7†). After 1 h of irradiation, the fluorescence intensity of ABDA at 407 nm is almost unchanged for Pt NPs, but decreased to ∼51% for Pt@CeO2 and ∼30% for Pt@CeO2@MnO2 nanostructures (Fig. 2f). This result shows that the production efficiency of 1O2 is in the order of Pt@CeO2@MnO2 > Pt@CeO2 > Pt. We believe that the generation process of 1O2 can be understood as follows: O2 molecules adsorbed on the porous CeO2 layer with its abundant oxygen vacancies can trap the transferred electrons from the Pt cores,26 and transform into superoxide anion radicals which further react with the holes in the Pt cores to give 1O2. The electron–hole separation at the Pt/CeO2 interface can be evaluated by measuring the photocurrent for Pt@CeO2 nanostructures and Pt NPs (Fig. S8†). The photocurrent response for the Pt@CeO2 nanostructures is larger than that for Pt NPs, suggesting higher electron–hole separation efficiency. In the pH = 5.5 PBS solution containing H2O2, MnO2 can decompose and release O2.31 Therefore, we believe that the high yield of 1O2 for the Pt@CeO2@MnO2 nanostructures is the result of the effective electron–hole separation at the Pt/CeO2 interface and decomposition of MnO2 into O2. The remarkable photothermal and photodynamic performances of the Pt@CeO2@MnO2 nanostructures provide good opportunities to realize the PTT/PDT synergistic effect.
To evaluate the performance of Pt@CeO2@MnO2 nanostructures as drug carriers, DOX was employed as a model anti-cancer drug. In the experiment of DOX loading, the Pt@CeO2 nanostructures were mixed with DOX solution and then coated with MnO2. The coating of the MnO2 layer enables the encapsulation of DOX molecules in the Pt@CeO2 nanostructures, and opens the door to TME-responsive drug release. The amounts of DOX in solutions before and after encapsulation of Pt@CeO2@MnO2 nanostructures were calculated according to the relationship between the typical absorbance of DOX at 480 nm and its concentration (Fig. S9†). When the feeding weight ratio between the drug carrier and DOX (Wcarrier/WDOX) was increased from 5:1 to 50:1, the loading rate of DOX (WDOX in carrier/WDOX) was in the range of 70%–85% (Fig. 3a), revealing a relatively high loading capability. The corresponding loading efficiency (WDOX in carrier/Wcarrier) was in the range of 3.4%–4.1%. The obtained DOX-Pt@CeO2@MnO2 shows stronger absorption in the UV-Vis region which is ascribed to the characteristic absorption of DOX (Fig. S10†). An obvious color change between the Pt@CeO2@MnO2 and DOX-Pt@CeO2@MnO2 solutions is readily visible with the naked eye (Fig. S11†). The release of DOX from the drug carrier relies on the degradation of MnO2 shells. The high contents of H+, H2O2 and GSH in the TME are found to induce the decomposition of MnO2,32 which can be determined by recording the extinction spectra of DOX-Pt@CeO2@MnO2 under TME-like conditions. The UV-Vis absorption of DOX-Pt@CeO2@MnO2 in PBS buffer solutions (pH 5.5) with GSH (10 mM) or H2O2 (50 mM) was found to decrease with increasing time and reach an equilibrium in 60 min (Fig. S12a and S12b†), indicating the rapid degradation of MnO2 and DOX release. The absorption decrease was accelerated under the combined action of GSH and H2O2 (Fig. S12c and S12d†). In comparison, no apparent absorption changes were observed when DOX-Pt@CeO2@MnO2 was in PBS solutions (pH 7.4) with and without the GSH and H2O2 (Fig. S12e and S20f†). The TEM image shows that the MnO2 shells nearly disappear after the degradation process in PBS with GSH and H2O2 (Fig. S13†). The disappearance of the MnO2 shells causes a decrease in the size of the nanostructures, as detected by the DLS measurement (Fig. S14†). The release efficiency of DOX (WDOX in solution/WDOX in carrier) was quantitatively analysed by determining the concentration of DOX in PBS solutions. There is no obvious release of DOX from DOX-Pt@CeO2@MnO2 to the PBS solution (pH 7.4) (Fig. 3b), which is coincided with the result of extinction spectrum measurement. However, when the pH is changed from 7.4 to 5.5, the DOX release is increased to about 25% in 60 min, indicating the H+ induces the decomposition of MnO2 as the gatekeeper for drug release. Furthermore, when the mild acidic PBS containing GSH or H2O2 is used, the DOX release exhibits an obvious increase in 60 min (Fig. 3b). When the acidic PBS solution simultaneously contains GSH and H2O2, the release amount of DOX is up to 80% after 40 min incubation (Fig. 3b). These results indicate that the Pt@CeO2@MnO2 nanostructure-based drug delivery system can achieve the efficient drug release in the TME. The temperature of DOX-Pt@CeO2@MnO2 in water rose to 52 °C under 808 nm laser irradiation at 1 W cm−2 (Fig. S15†), which is close to that of Pt@CeO2@MnO2 (Fig. 2b). In the cyclic photothermal experiment, DOX-Pt@CeO2@MnO2 exhibited stable photothermal conversion capability (Fig. S15†). These results show that the photothermal conversion performance of Pt@CeO2@MnO2 is not affected by the loading of DOX.
 | ||
| Fig. 3 Loading and release behaviours of Pt@CeO2@MnO2 nanostructures as drug carriers. (a) Loading rate of DOX from the solution to Pt@CeO2@MnO2 nanostructures with different feeding weights. (b) Release efficiency of DOX from DOX-Pt@CeO2@MnO2 under TME-like conditions. | ||
Before exploring the synergistic effect of tri-modal therapy in vitro, we studied the internalization of DOX-Pt@CeO2@MnO2 by cells. The CLSM images of HepG-2 cells incubated with DOX-Pt@CeO2@MnO2 for 1, 4 and 8 h are shown in Fig. 4a. DAPI with blue emission was used to mark the cell nuclei. We observed that the red fluorescence radiated by DOX appeared after 1 h incubation. This red fluorescence was enhanced with the incubation time, suggesting the increased amount of DOX-Pt@CeO2@MnO2 internalized by the cells and the release of DOX. The overlap of red and blue fluorescence shows that DOX released from DOX-Pt@CeO2@MnO2 accumulated in the cell nuclei (Fig. S16†). To determine the location of DOX-Pt@CeO2@MnO2 in the cells, we further used Lyso-Tracker Red with red emission to mark the lysosome, and labeled DOX-Pt@CeO2@MnO2 with PEG-FITC emitting green fluorescence. The overlap of the red and green fluorescence shows that DOX-Pt@CeO2@MnO2 is efficiently internalized into the lysosome (Fig. S17†). The lower pH environment of the lysosome relative to the TME promotes a fast release of DOX from DOX-Pt@CeO2@MnO2.
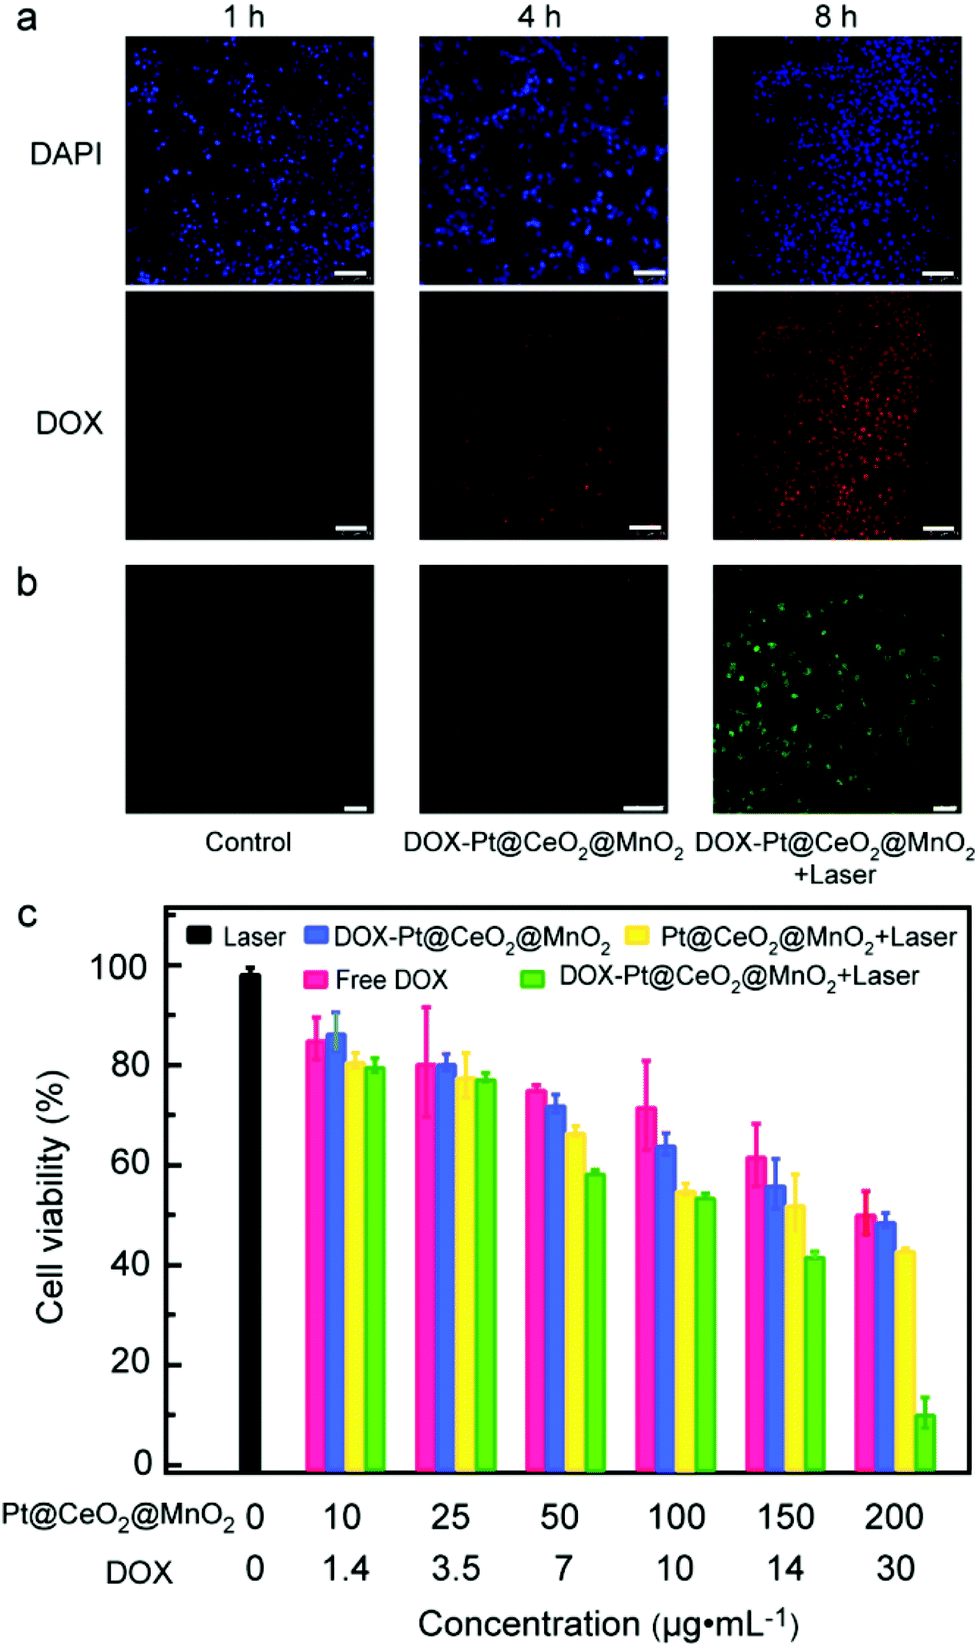 | ||
| Fig. 4 In vitro anticancer efficacy of DOX-Pt@CeO2@MnO2. (a) CLSM images of HepG-2 cells incubated with DOX-Pt@CeO2@MnO2 for 1, 4, and 8 h at 37 °C. Scale bar: 75 μm. (b) CLSM images of HepG-2 cells incubated with DCFH-DA with different treatments. Green fluorescence represents the intracellular singlet oxygen production. Scale bar: 100 μm. (c) Viabilities of HepG-2 cells treated with laser, DOX- Pt@CeO2@MnO2, free DOX, Pt@CeO2@MnO2 + laser and DOX-Pt@CeO2@MnO2 + laser. | ||
After verifying the efficient cellular uptake of DOX-Pt@CeO2@MnO2, we examined the generation of intracellular ROS under 808 nm laser irradiation using DCFH-DA as a probe. DCFH-DA can be hydrolyzed to DCFH by intracellular esterase and then oxidized by ROS, forming 7′-dichlorofluorescein (DCF) with green fluorescence under the excitation of 488 nm light. For the cells treated with DOX-Pt@CeO2@MnO2 and 808 nm laser, the typical green fluorescence of DCF is observed from their CLSM images (Fig. 4b). In comparison, the cells treated with laser irradiation or DOX-Pt@CeO2@MnO2 show negligible fluorescence (Fig. 4b). These results demonstrate that DOX-Pt@CeO2@MnO2 in cells can efficiently produce ROS for PDT under laser irradiation, while DOX-Pt@CeO2@MnO2 produced intracellular ROS, DOX released from the nanostructures (Fig. S18†). We evaluated the anticancer efficacy of DOX-Pt@CeO2@MnO2, DOX-Pt@CeO2@MnO2 with laser irradiation (denoted as DOX-Pt@CeO2@MnO2 + laser), the Pt@CeO2@MnO2 nanostructures with laser irradiation (denoted as Pt@CeO2@MnO2 + laser), the equivalent free DOX, and the laser treatment with the MTT assay against HepG-2 cells (Fig. 4c). The cells in the laser treatment group had a high viability (∼ 98%), indicating that the 808 nm laser had no negative effect to the cells. As for the free DOX group, the viability was obviously decreased, which was similar to that of the cells in the DOX-Pt@CeO2@MnO2 group having the equivalent DOX. From the above results, we infer that DOX-Pt@CeO2@MnO2 can efficiently release DOX in the cells, causing the cell death. The Pt@CeO2@MnO2 + laser group showed remarkable cytotoxicity owing to the photothermal and photodynamic effect. As expected, the cells in the DOX-Pt@CeO2@MnO2 + laser group had much lower viabilities than those in other four groups, suggesting a clear synergistic chemo-, photothermal, and photodynamic anti-cancer effect. When the mass concentration of DOX-Pt@CeO2@MnO2 was 200 μg mL−1, a cell survival rate of less than 10% was obtained under laser irradiation.
The good anticancer effect in vitro inspired us to further study the effect in vivo. Owing to the excellent photothermal conversion performance, DOX-Pt@CeO2@MnO2 can be used as a PA contrast agent for tumor imaging. We performed the PA imaging of HepG-2 tumor-bearing mice upon intravenous injection with DOX-Pt@CeO2@MnO2. The PA images and signals of the tumor region recorded in real time showed the accumulation and retention of DOX-Pt@CeO2@MnO2 (Fig. 5a and b). Before the intravenous injection (t = 0 h), a very weak PA signal was observed in the tumor region because of the weak NIR absorption of oxyhemoglobin and deoxyhemoglobin. After the intravenous injection, the PA signals in the tumor significantly increased, and reached a peak at ∼8 h. At 24 h post-injection, the PA intensity of the tumor region was kept at 70% of the peak value. The long tumor retention suggests that the DOX-Pt@CeO2@MnO2 nanostructures accumulate in the tumor through the enhanced permeation and retention (EPR) effect, which is beneficial for long-term combination therapy.
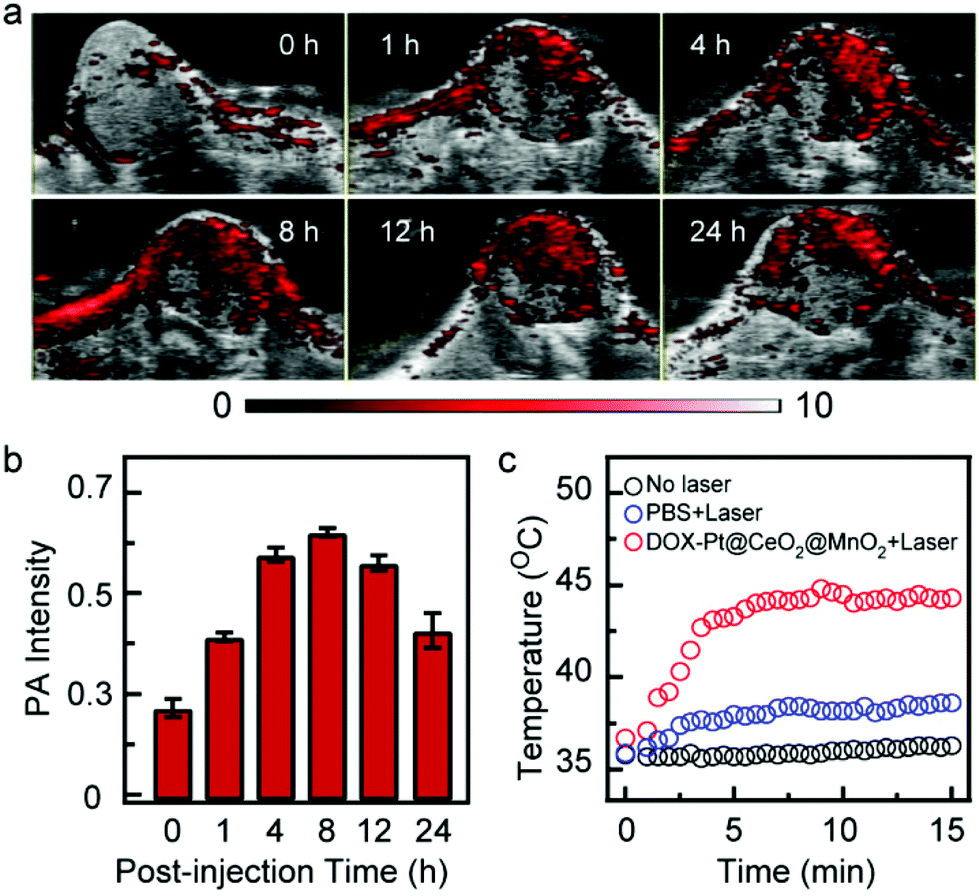 | ||
| Fig. 5 In vivo PA images and temperature traces of the tumor treated with DOX-Pt@CeO2@MnO2. (a) In vivo post-injection time dependent PA images of tumor sites. (b) The quantification of post-injection time-dependent PA signals of tumor sites in (a). (c) Surface temperature traces of the tumor after 8 h post-injection of DOX-Pt@CeO2@MnO2 and PBS with and without laser irradiation. | ||
Considering the high nanostructure accumulation in the tumor after 8 h post-injection, we measured the surface temperature of the tumor region under 808 nm laser irradiation (1 W cm−2) using an infrared thermal camera. Upon laser irradiation, the surface temperature of the tumor was increased to ∼45 °C within 5 min (Fig. 5c), which was high enough to kill cancer cells in vivo. In contrast, the tumor temperature of mice injected with PBS under the same laser irradiation showed a slight increase (Fig. 5c). No significant temperature changes were observed on the tumor surface without laser irradiation. These results indicate that the PA-guided laser irradiation can be utilized to initiate photothermal and photodynamic therapy.
Finally, the in vivo therapeutic efficacy of DOX-Pt@CeO2@MnO2 under laser irradiation was assessed by employing HepG-2 tumor-bearing mice as a model system. In our in vivo antitumor experiments, the tumor-implanted mice were divided into five groups: PBS solution (group 1), only laser irradiation (group 2), free DOX (group 3), Pt@CeO2@MnO2 nanostructures with laser irradiation (group 4), and DOX-Pt@CeO2@MnO2 with laser irradiation (group 5), respectively. The in vivo antitumor experiments were performed when tumor volume is up to ∼100 mm3. Considering the high accumulation of DOX-Pt@CeO2@MnO2, the mice in group 4 and group 5 were irradiated with an 808 nm laser (1 W cm−2) at 8 h post-injection. The variations in the body weights of the mice in the five groups were recorded during two weeks (Fig. 6a). All the mice had no appreciable weight fluctuations, indicating negligible systemic side effects during treatment. The therapeutic efficacy was evaluated by the change in the tumor volume. After two weeks of the treatment, the average volumes of the tumors in groups 1–5 increased 13.39-, 12.18-, 9.09-, 7.18- and 3.27-fold, respectively (Fig. 6b). From the photographs of the representative tumors in the five groups, we found that the tumor size of group 5 was the smallest (Fig. 6c). Remarkably, the growth of the tumor in group 5 relative to those in other groups was efficiently inhibited owing to the combination of DOX-based chemotherapy and Pt@CeO2@MnO2 enabled PTT and PDT. Hematoxylin and eosin (H&E) stained images of the tumor slices show that the tissue damage level in group 5 was more serious than those in other groups (Fig. 6d), which was coincided with the result of tumor growth.
 | ||
| Fig. 6 In vivo therapeutic efficacy of DOX-Pt@CeO2@MnO2. (a and b) Changes in the body weights (a) and relative tumor volume (b) of the mice in groups 1–5. Statistical significance was assessed by the unpaired Student's t test. **p < 0.01 compared to the PBS group. (c) Photographs of the representative tumors in groups 1–5 (from top to bottom). (d) Representative H&E stained tumor sections from each treating group. (e) H&E stained images of heart, liver, spleen, lung and kidneys obtained from the PBS, Pt@CeO2@MnO2 + laser and DOX-Pt@CeO2@MnO2 + laser groups after 2 weeks treatment. | ||
The major organs including heart, liver, spleen, lungs, and kidneys were collected for H&E staining assay after the mice sacrificed. The main organs in group 4 and group 5 compared with those in group 1 showed no obvious pathological changes (Fig. 6e), indicating that our synthesized Pt@CeO2@MnO2 nanostructures with and without DOX loading induced no significant side effects or toxicities.
Conclusions
We have synthesized DOX-loaded Pt@CeO2@MnO2 core–shell nanostructures as a new nano-platform for multimodal cancer therapy. The obtained Pt@CeO2@MnO2 core–shell nanostructures exhibit high photothermal conversion capability in the NIR region, which endows the nanostructures with PA imaging capability. The TME-induced decomposition of MnO2 shells efficiently relieves tumor hypoxia through in situ generation of O2, which enhances the PDT effect. The MnO2 decomposition concurrently triggers tumor-targeted DOX release. The in vivo PA imaging demonstrated the favorable accumulation and retention of DOX-Pt@CeO2@MnO2 for chemo-/PDT/PTT tumor therapy. DOX-Pt@CeO2@MnO2 under laser irradiation achieves an efficient antitumor effect owing to the synergistic therapeutic effect. Thus, our multifunctional nano-platform is a promising PA-guided tri-modal therapeutic agent for future applications.Conflicts of interest
There are no conflicts to declare.Acknowledgements
This work was supported by the Natural Science Foundation of Fujian Province of China (No. 2019J06019), the National Natural Science Foundation of China (No. 61605050), the Science and Technology Cooperative Project of Xiamen (No.3502Z20183028), the Promotion Program for Young and Middle-aged Teacher in Science and Technology Research of Huaqiao University (No. ZQN-PY416) and the Program for Innovative Research Team in Science and Technology in Fujian Province University.Notes and references
- W. Fan, B. Yung, P. Huang and X. Chen, Chem. Rev., 2017, 117, 13566–13638 CrossRef CAS PubMed.
- J. Chen, Y. Zhu, C. Wu and J. Shi, Chem. Soc. Rev., 2020, 49, 9057–9094 RSC.
- P. Liang, B. Ballou, X. Lv, W. Si, M. P. Bruchez, W. Huang and X. Dong, Adv. Mater., 2021, 332005155 Search PubMed.
- T. Lin, Y. Li, Q. Liu, J. Chen, H. Zhang, D. Lac, H. Zhang, K. W. Ferrara, S. Wachsmann-Hogiu and T. Li, Biomaterials, 2016, 104, 339–351 CrossRef CAS PubMed.
- K. Hayashi, T. Maruhashi, M. Nakamura, W. Sakamoto and T. Yogo, Adv. Funct. Mater., 2016, 26, 8613–8622 CrossRef CAS.
- S. Yu, Y. Zhou, Y. Su, S. Wu, T. Xu, Y. Chang, S. Bi, L. Jiang and J. Zhu, Angew. Chem., Int. Ed., 2020, 11, 5948–5958 Search PubMed.
- Y. Zhang, Z. Hou, Y. Ge, K. Deng, B. Liu, X. Li, Q. Li, Z. Cheng, P. Ma and C. Li, ACS Appl. Mater. Interfaces, 2015, 7, 20696–20706 CrossRef CAS PubMed.
- Z. Li, Y. Hu, K. Howard, T. Jiang, X. Fan, Z. Miao, Y. Sun, F. Besenbacher and M. Yu, ACS Nano, 2016, 10, 984–997 CrossRef CAS PubMed.
- J. Chen, H. Zhang, X. Huang, H. Wan, J. Li, X. Fan, K. Luo, J. Wang, X. Zhu and J. Wang, Nano-Micro Lett., 2019, 11, 93 CrossRef CAS PubMed.
- Q. Chen, X. Wang, C. Wang, L. Feng, Y. Li and Z. Liu, ACS Nano, 2015, 9, 5223–5233 CrossRef CAS PubMed.
- P. Kalluru, R. Vankayala, C.-S. Chiang and K. C. Hwang, Adv. Funct. Mater., 2016, 26, 7908–7920 CrossRef CAS.
- H. Wan, Y. Zhang, W. Zhang and H. Zou, ACS Appl. Mater. Interfaces, 2015, 7, 9608–9618 CrossRef CAS PubMed.
- C. He, D. Liu and W. Lin, ACS Nano, 2015, 9, 991–1003 CrossRef CAS PubMed.
- R. Lv, P. Yang, F. He, S. Gai, C. Li, Y. Dai, G. Yang and J. Lin, ACS Nano, 2015, 9, 1630–1647 CrossRef CAS PubMed.
- D. Chen, Q. Tang, J. Zou, X. Yang, W. Huang, Q. Zhang, J. Shao and X. Dong, Adv. Healthcare Mater., 2018, 7, 1701272 CrossRef PubMed.
- Q. Sun, Fe. He, H. Bi, Z. Wang, C. Sun, C. Li, J. Xu, D. Yang, X. Wang, S. Gai and P. Yang, Chem. Eng. J., 2019, 362, 679–691 CrossRef CAS.
- Q. Wang, Y. Dai, J. Xu, J. Cai, X. Niu, L. Zhang, R. Chen, Q. Shen, W. Hang and Q. Fan, Adv. Funct. Mater., 2019, 29, 1901480 CrossRef.
- X. Zhu, H. Wan, H. Jia, L. Liu and J. Wang, Adv. Healthcare Mater., 2016, 5, 3165–3172 CrossRef CAS PubMed.
- Y. Chen, Z. Wang, H. Wang, J. Lu, S. Yu and H. Jiang, J. Am. Chem. Soc., 2017, 139, 2035–2044 CrossRef CAS PubMed.
- Z. Lv, S. He, Y. Wang and X. Zhu, Adv. Healthcare Mater., 2021, 10, 2001806 CrossRef CAS PubMed.
- C. Clavero, Nat. Photonics, 2014, 8, 95–103 CrossRef CAS.
- A. Meng, L. Zhang, B. Cheng and J. Yu, Adv. Mater., 2019, 31, 1807660 CrossRef PubMed.
- D. Dao, T. Nguyen, P. Uthirakumar, Y. Cho, G. Kim, J. Yang, D. Tran, T. Le, H. Choi and H. Kim, Appl. Catal., B, 2021, 286, 119947 CrossRef CAS.
- Y. Zhang, S. He, W. Guo, Y. Hu, J. Huang, J. Mulcahy and W. Wei, Chem. Rev., 2018, 118, 2927–2954 CrossRef CAS PubMed.
- L. Collado, A. Reynal, F. Fresno, M. Barawi, C. Escudero, V. Perez-Dieste, J. Coronado, D. Serrano, J. R. Durrant and V. de la Peña O'Shea, Nat. Commun., 2018, 9, 4986 CrossRef PubMed.
- N. Jiang, D. Li, L. Liang, Q. Xu, L. Shao, S. Wang, A. Chen and J. Wang, Nano Res., 2020, 13, 1354–1362 CrossRef CAS.
- Z. Cui, W. Wang, C. Zhao, C. Chen, M. Han, G. Wang, Y. Zhang, H. Zhang and H. Zhao, ACS Appl. Mater. Interfaces, 2018, 10, 31394–31403 CrossRef CAS PubMed.
- H. Jia, A. Du, H. Zhang, J. Yang, R. Jiang, J. Wang and C. Zhang, J. Am. Chem. Soc., 2019, 141, 5083–5086 CrossRef CAS PubMed.
- Y. Yang, J. Liu, X. Sun, L. Feng, W. Zhu, Z. Liu and M. Chen, Nano Res., 2016, 9, 139–148 CrossRef CAS.
- C. Qian, J. Yu, Y. Chen, Q. Hu, X. Xiao, W. Sun, C. Wang, P. Feng, Q. Shen and Z. Gu, Adv. Mater., 2016, 28, 3313–3320 CrossRef CAS PubMed.
- G. Yang, L. Xu, Y. Chao, J. Xu, X. Sun, Y. Wu, R. Peng and Z. Liu, Nat. Commun., 2017, 8, 902 CrossRef PubMed.
- J. Xu, W. Han, P. Yang, T. Jia, S. Dong, H. Bi, A. Gulzar, D. Yang, S. Gai and F. He, Adv. Funct. Mater., 2018, 28, 1803804 CrossRef.
- Y. Zhang, F. Lv, Y. Cheng, Z. Yuan, F. Yang, C. Liu, Y. Cao, K. Zhang, H. Lu and S. Zada, Adv. Healthcare Mater., 2020, 9, 1901528 CrossRef CAS PubMed.
- H. Chen, L. Shao, T. Ming, Z. Sun, C. Zhao, B. Yang and J. Wang, Small, 2010, 6, 2272–2280 CrossRef CAS PubMed.
- J. Zhao, J. Nan, Z. Zhao, N. Li, J. Liu and F. Cui, Appl. Catal., B, 2017, 202, 509–517 CrossRef CAS.
- X. Zhou, S. Chen, D. Zhang, X. Guo, W. Ding and Y. Chen, Langmuir, 2006, 22, 1383–1387 CrossRef CAS PubMed.
- Y. Cui, L. Liu, B. Li, X. Zhou and N. Xu, J. Phys. Chem. C, 2010, 114, 2434–2439 CrossRef CAS.
- I. Zorić, M. Zäch, B. Kasemo and C. Langhammer, ACS Nano, 2011, 5, 2535–2546 CrossRef PubMed.
- M. Mao, H. Lv, Y. Li, Y. Yang, M. Zeng, N. Li and X. Zhao, ACS Catal., 2016, 6, 418–427 CrossRef CAS.
- R. Jiang, S. Cheng, L. Shao, Q. Ruan and J. Wang, J. Phys. Chem. C, 2013, 117, 8909–8915 CrossRef CAS.
- X. Ding, C. Liow, M. Zhang, R. Huang, C. Li, H. Shen, M. Liu, Y. Zou, N. Gao and Z. Zhang, J. Am. Chem. Soc., 2014, 136, 15684–15693 CrossRef CAS PubMed.
- A. Li, X. Li, X. Yu, W. Li, R. Zhao, X. An, D. Cui, X. Chen and W. Li, Biomaterials, 2017, 112, 164–175 CrossRef CAS PubMed.
Footnotes |
| † Electronic supplementary information (ESI) available. See DOI: 10.1039/d1nr03246a |
| ‡ These authors contributed equally to this work. |
| This journal is © The Royal Society of Chemistry 2021 |