
Deep learning-based denoising for improved dose efficiency in EDX tomography of nanoparticles†
Alexander
Skorikov
ab,
Wouter
Heyvaert
 ab,
Wiebke
Albecht
ab,
Daniël M.
Pelt
c and
Sara
Bals
*ab
ab,
Wiebke
Albecht
ab,
Daniël M.
Pelt
c and
Sara
Bals
*ab
aEMAT, University of Antwerp, Groenenborgerlaan 171, 2020 Antwerp, Belgium. E-mail: sara.bals@uantwerpen.be
bNANOlab Center of Excellence, University of Antwerp, Groenenborgerlaan 171, 2020 Antwerp, Belgium
cLeiden Institute of Advanced Computer Science, Niels Bohrweg 1, 2333 CA Leiden, The Netherlands
First published on 8th July 2021
Abstract
The combination of energy-dispersive X-ray spectroscopy (EDX) and electron tomography is a powerful approach to retrieve the 3D elemental distribution in nanomaterials, providing an unprecedented level of information for complex, multi-component systems, such as semiconductor devices, as well as catalytic and plasmonic nanoparticles. Unfortunately, the applicability of EDX tomography is severely limited because of extremely long acquisition times and high electron irradiation doses required to obtain 3D EDX reconstructions with an adequate signal-to-noise ratio. One possibility to address this limitation is intelligent denoising of experimental data using prior expectations about the objects of interest. Herein, this approach is followed using the deep learning methodology, which currently demonstrates state-of-the-art performance for an increasing number of data processing problems. Design choices for the denoising approach and training data are discussed with a focus on nanoparticle-like objects and extremely noisy signals typical for EDX experiments. Quantitative analysis of the proposed method demonstrates its significantly enhanced performance in comparison to classical denoising approaches. This allows for improving the tradeoff between the reconstruction quality, acquisition time and radiation dose for EDX tomography. The proposed method is therefore especially beneficial for the 3D EDX investigation of electron beam-sensitive materials and studies of nanoparticle transformations.
Introduction
Energy-dispersive X-ray (EDX) spectroscopy is one of the very few methods that can directly retrieve the elemental distribution in nanoscale objects. This technique is based on scanning transmission electron microscopy (STEM), where a highly focused electron beam is scanned across a specimen and the generated signal is registered at each point using one or several detectors. Interaction of swift electrons with atoms comprising the specimen produces characteristic X-rays with a spectrum unique for each chemical element and intensity proportional to the concentration of the corresponding species in the interaction area.1 This phenomenon allows for generating elemental maps of objects under investigation with a very high – up to atomic2,3 – resolution and quantifying the chemical composition of nanomaterials.4EDX can be combined with the concept of computed tomography by acquiring elemental maps of an object at multiple tilt angles for the subsequent 3D reconstruction. EDX tomography provides invaluable information on the structure of complex nano-objects, where 2D projections are insufficient for understanding the distribution of individual chemical elements.5–7 Unfortunately, in most cases the application of EDX tomography is severely limited by the typically very low signal-to-noise ratio (SNR) in the 2D elemental maps that are used as input for the 3D reconstruction algorithm. The poor SNR is caused by the combination of the fundamentally low probability of characteristic X-rays generation and low efficiency of their detection due to the size constraints on the EDX detector inside a TEM.1 Together with the requirement for recording elemental maps along multiple directions for 3D reconstruction, a typical EDX tomography experiment takes more than 2 h of acquisition time even when using high electron beam currents (in the range of 0.25–1.5 nA).8–11 This results in very high electron illumination doses (up to 109 e Å−2),8 making EDX tomography applicable only to materials that are extremely stable against electron irradiation.
One way to improve the SNR for EDX tomography lies in smart post-processing of experimental data. Given prior expectations about the studied object and the measurement process itself, it is possible to obtain an estimate of a true signal from the measurements corrupted by noise. So far, the research on this approach has followed three main directions: multivariate analysis of the spectral data,12–14 denoising of 2D elemental maps via filtering15 and promotion of certain qualities of the resulting 3D reconstruction (e.g. smoothness) by variational analysis.16,17 All these methods are model-based, meaning that an algorithm employs a set of fixed criteria for separating true signal and noise: for example smoothness and homogeneity of the expected signal or covariance of intensities for the energy channels corresponding to the same chemical element. This approach has the disadvantage of having to manually construct the image quality model and an algorithm for optimizing it. Moreover, such techniques require tuning the model parameters for achieving the optimal result (often in a manual way), and there is always a concern of how completely the designed model captures the expected signal features. These limitations can be overcome by using data-driven approaches, where the model for separating signal from noise is learned algorithmically from a sufficiently large set of training data.18 Especially with the rapid development of artificial neural networks and deep learning methodology,19 such techniques have been shown to provide superior results for a wide set of data analysis tasks, including the denoising problem.20 Specifically, in the field of tomography there has been significant progress in developing deep learning-based approaches for improving the quality of 3D reconstructions in biomedical imaging techniques, such as magnetic resonance imaging (MRI)21 and computed tomography (CT).22 For materials science applications, the corresponding benefits have been achieved for microscale CT23 and electron tomography.24 Recently, a deep learning-based methodology has been proposed for EDX tomography of nanocrystals.25 The authors demonstrated a sophisticated approach that allowed for improving the quality of 3D EDX reconstruction for experimental data based on a gold nanorod and Zn/S/Se quantum dots in comparison to conventional approaches for 3D reconstruction and denoising. However, the proposed method was only tested on a very limited number of datasets, and a quantitative evaluation of the performance was not possible due to absence of ground-truth data. In addition, the proposed method requires the acquisition of long-exposure EDX measurements to obtain accurate elemental maps for training, which may be impossible or infeasible in practice.
In this work, we develop and analyze a deep learning-based method to improve the SNR in EDX tomography based on an extensive dataset of simulated nanoparticle structures with an appropriate representation of possible geometries and experimental noise, removing the need for acquiring long-exposure EDX maps for training. The proposed method is based on denoising individual images in a tomographic series, which makes it easy to integrate into existing EDX tomography reconstruction methodologies and enables a direct comparison to conventional denoising approaches. Using simulated and experimental data, we demonstrate that the proposed denoising method may allow for a drastic reduction in acquisition time and electron dose requirements for EDX tomography without compromising the qualitative analysis of the 3D elemental distribution in nanoparticles.
Results and discussion
The first crucial step in designing the proposed deep learning-based method consists in establishing a sufficiently large set of data adequately representing the objects of interest and noise features of experimental EDX maps. Such a dataset is required for training the algorithm and carrying out a quantitative analysis of its performance. The training can be based on either pairs of noisy and ground truth data points in a supervised learning approach, or solely on noisy data using self-supervised learning.19 In this paper, we focus on the supervised approach because of its generally higher performance demonstrated for denoising tasks in various applications26,27 and a more established training methodology. Unfortunately, providing ground truth data for EDX mapping of nanoparticles experimentally is typically an infeasible task because of the electron beam damage resulting from the very long acquisition times required for achieving the desirable SNR for each map. Therefore, we decided to base the training solely on synthetic data, which was previously proposed in other fields.28 For this purpose, a dataset of simulated EDX data with an adequate representation of typical nanoparticle structures and experimentally observed signal and noise features was established. Fig. 1a illustrates the workflow used for generating entries in this dataset. Each data point contains a solid or a core–shell nanoparticle shape (for example, bipyramid, rod, sphere in cube, etc.) with randomized geometric parameters (Fig. 1b), its voxel grid representation and a set of projection images of the structure (Fig. 1c) paired with their noisy counterparts (Fig. 1d), which are used for training the denoising method (see also Methods section). Because of the large number of base shapes and complete randomization of geometric parameters via scripting, our database provides high variability in training data. Moreover, the availability of ground truth 3D structures and 2D projection images of the simulated nanoparticles allows for a robust, statistically representative assessment of the performance of various data processing methods, including denoising, reconstruction and segmentation algorithms. In the future, this database can be expanded to include other relevant nanoparticle morphologies, such as less regularly shaped and porous 3D structures. Therefore, we believe that the proposed dataset, which we make available together with this work,29 will facilitate the development of improved data-driven methods for (EDX) tomography of nanoparticles. | ||
| Fig. 1 Simulated dataset for EDX tomography of nanoparticles. (a) Flowchart of operations performed for generating each data point. Examples of simulated (b) nanoparticle shapes, (c) projection images, and (d) noisy EDX maps for three typical entries in the generated dataset. To improve visibility, a 3 × 3 uniform filter was applied to the simulated noisy EDX maps (the original maps can be found in Fig. S1 in the ESI†). | ||
In this paper, we focus on extremely noisy EDX data expected for low electron illumination doses and short acquisition times to probe the potential benefit of smart, deep learning-based post-processing in terms of dose/time reduction for EDX tomography. Accordingly, projection images in the simulated dataset were corrupted with heavy Poisson noise corresponding to 103 total counts for each simulated elemental map on average (see Fig. 1d). The residual EDX background noise typically present in experimental elemental maps was modelled by a Poisson distribution with a spatially uniform expected value resulting in additional 100 counts on average (see the Methods section). The adequacy of only taking into account the Poisson distribution of the signal for modelling the noisy EDX data was confirmed using experimental tests (see Fig. S3 in the ESI†). Equalizing the total number of counts per map allows for fixing the SNR of the simulated map with respect to the absolute size and composition of the object as well as microscope parameters, such as electron beam current, detector efficiency and acceleration voltage. The expected acquisition time for such an elemental map therefore depends on these parameters and can be estimated for specific settings using measured EDX generation cross-sections. For example, a 103 counts EDX map of a gold sphere with a diameter of 20 nm can be acquired in about 10 s using 150 pA electron beam current at our Thermo Fisher Titan TEM with a four-quadrant Super-X spectrometer,11 which is comparable to the electron dose and acquisition time used in typical conventional STEM imaging. We emphasize that the average number of counts in the elemental maps studied in this work is intentionally fixed to 103 to consistently represent the extremely short acquisition time and low electron dose case for EDX acquisition. On the other hand, the proposed simulated dataset can potentially be used to easily extend the deep learning-based denoising to the more typical, less noisy data by changing the corresponding level of Poisson noise in the simulated training database.
The strengths of the deep learning methodology can be used for denoising EDX tomography via several possible approaches, such as (a) deep learning-assisted multivariate analysis for extracting elemental maps from hyperspectral EDX data;30 (b) denoising of 2D elemental maps before using a classical 3D reconstruction algorithm;31 (c) denoising of 3D data after the classical reconstruction32 and (d) in an end-to-end approach, where the deep neural network implements the actual transformation of the tomographic tilt series into 3D reconstruction.33 Approach (a) offers limited benefit for most EDX hyperspectral images, where spectra of individual elements typically do not overlap and elemental maps can be reliably obtained via maximum likelihood fitting; approach (c) was shown to underperform compared to 2D based denoising because of severe artifacts introduced by 3D reconstruction algorithms when the input data is highly noisy (see Fig. S4 in the ESI†), and approach (d) is generally much more computationally demanding and difficult to apply for practical cases. On the other hand, approach (b) has been extensively studied in other fields, which can be used as a foundation for developing the methodology for EDX tomography.18,20 Furthermore, 2D denoising can be directly compared to conventional EDX denoising methods, such as Gaussian filtering10 or total variation (TV) denoising,34 and can be easily combined with existing advanced 3D reconstruction algorithms. Based on these considerations, we chose to pursue approach (b) in this work. At the same time, we envision that one or a combination of the other above-mentioned approaches can be developed into a potentially more powerful method in the future.
To perform the denoising task, we chose to use the well-established U-net deep neural network architecture,35 which was successfully applied in other fields for a wide variety of tasks involving image-to-image transformations.21,32,36 The U-net architecture corresponds to an encoder-decoder type, which allows the network to reconstruct an input image based on spatial features learned from the training dataset, whereas the presence of “residual” connections aids with preserving the image fidelity (see the Fig. S5 in the ESI†). For training and evaluating the network, a dataset of 1000 randomized 3D nanoparticle structures was selected from the database described above. The data were divided into training, validation and test subsets of 700, 150, and 150 structures, respectively. For each structure, one pair of a ground truth projection image and the corresponding simulated noisy elemental map was obtained. In this manner, the network was trained on 700 noisy maps and 150 maps were used for adjusting the training parameters. The quantitative comparison between the different denoising methods was performed on an independent set of 150 maps that were not exposed to the network during the training.
To evaluate the quality of deep learning-based denoising with respect to conventional methods, we compared it to the commonly used Gaussian filtering and TV minimization-based image denoising. Normally, both of these classical approaches have to be adjusted manually via the respective denoising strength parameters (Gaussian filter width and TV relative weight). However, for testing on simulated data we used the best-case scenario results for these methods by numerically optimizing the parameter values until the smallest absolute error with respect to the ground truth image was observed. We emphasize that for experimental data this approach is not applicable, which generally makes the optimization of denoising parameters a subjective and often tedious trial-and-error procedure, which typically results in a sub-optimal performance. In contrast to this, the deep learning-based method automatically adjusts to the noisy input data, which represents a significant advantage for the practical applications of the proposed approach. A qualitative comparison between the studied methods is demonstrated in Fig. 2a. It can be seen that the U-net output consists of realistic image features learned from the training dataset, such as sharp particle boundaries and smooth intensity variations within. On the other hand, Gaussian and TV denoising performs a non-discriminative filtering, producing blurry and patchy image appearance. To compare the approaches in a quantitative manner, we calculated normalized mean absolute errors (nMAE) between denoised and ground truth simulated images in the test dataset of 150 entries which had not been exposed to the network during the training (see the Methods section). Fig. 2b shows that in addition to the more sensible image appearance, the U-net based method produces significantly more accurate results compared to Gaussian and TV denoising.
 | ||
| Fig. 2 Qualitative and quantitative comparison of denoising performance on simulated 2D maps for optimal Gaussian filtering, TV denoising and proposed deep learning-based (U-net) methods. (a) Examples of simulated noisy, denoised and ground truth maps. To improve visibility, a 3×3 uniform filter was applied to the simulated noisy EDX maps (the original maps can be found in Fig. S2 in the ESI†). (b) Normalized mean absolute errors with respect to the ground truth data for the tested methods. Error bars correspond to the standard deviation of performance between 150 tested simulated maps. | ||
To compare the effect of different denoising methods on the quality of 3D reconstructions, tilt series of noisy elemental maps were generated for each simulated structure in the test dataset using a tilt range of ±75° and a 10° tilt step to mimic typical experimental conditions for EDX tomography. Each elemental map in the tilt series was denoised using the respective methods and a 3D reconstruction was obtained by the expectation–maximization algorithm (see Methods section). From the orthoslices through the reconstructions of test objects displayed in Fig. 3a, it can be seen that the tomography based on the U-net denoised data produces objects with sharp outer edges and smooth intensity distributions within, whereas Gaussian and TV denoising leads to unrealistic blurring and a speckled appearance. The quantitative improvement in the denoising performance was assessed by calculating the normalized mean absolute error for the reconstructions based on the denoised tilt series in comparison to the ground truth 3D structures. From Fig. 3b it can be seen that the performance improvement for the U-net based method is even more evident for the tomography results compared to the 2D case due to accumulation of denoising errors in the 3D reconstruction procedure, which significantly affects the results of classical denoising methods. Specifically, the average error for the 3D reconstruction denoised using U-net is reduced two-fold compared to the Gaussian and TV denoising.
 | ||
| Fig. 3 Qualitative and quantitative comparison of 3D reconstructions based on simulated tilt series denoised using optimal Gaussian filtering, TV minimization and proposed deep learning-based (U-net) methods. (a) Examples of orthoslices through the reconstructions based on the denoised tilt series and through the ground truth 3D data. Different colors in the same structure correspond to the different simulated elements. (b) Normalized mean absolute errors with respect to the ground truth data for the tested methods. Error bars correspond to the standard deviation of performance between 150 tested simulated 3D structures. | ||
To test the performance of the proposed denoising method on experimental data, we used EDX tilt series for three different core–shell Au/Ag nanoparticles: a nanorod, a rice-corn-shaped particle and a hollow nanoshell (see Fig. 4a). The data were collected in a conventional manner, using long acquisition times and high electron doses (see Table 1) to obtain reference 3D reconstructions. Afterwards, each elemental map was downsampled to 103 counts on average while preserving the Poisson distribution of the signal (see Methods section) to create a highly noisy input for testing the different denoising approaches. From Table 1, it can be seen that the noisy input corresponds to 20–40 times smaller electron dose and acquisition time per EDX map, bringing these values in the range of typical STEM tomography experiments. Fig. 4b depicts orthoslices through tomographic reconstructions based on noisy EDX maps denoised using classical methods and the proposed deep learning-based approach in comparison to the reference reconstruction obtained from the high signal-to-noise ratio data. It can be observed that U-net based denoising results in correct reconstruction of the core–shell structure of the particles while giving an adequate representation of the particles shape and elemental distribution inside. On the other hand, Gaussian and TV denoising result in fracturing and blurring of reconstructions, which impedes visualization and analysis of the reconstructed 3D elemental distributions. This comparison illustrates that the proposed deep learning-based denoising method offers a leverage in drastically reducing the acquisition time and electron dose required for EDX tomography, while preserving the quality adequate for analyzing elemental distribution in nanoparticles in 3D.
 | ||
| Fig. 4 Comparison of 3D tomography based on experimental data denoised using Gaussian filtering, TV minimization and deep learning-based (U-net) methods. (a) Visualization of the 3D structure of the used nanoparticles including the orientation of the depicted orthoslices. (b) Orthoslices through 3D reconstructions based on the noisy EDX data after applying the corresponding denoising methods and the reference, high signal-to-noise data reconstruction. Scale bars represent 30 nm. | ||
| Particle shape | Time per EDX map [s] | Electron dose per EDX map [e Å−2] | Average counts per EDX map | |||
|---|---|---|---|---|---|---|
| Conventional | Noisy | Conventional | Noisy | Conventional | Noisy | |
| Nanorod | 330 | 14 | 2.0 × 10⁵ | 8.3 × 10³ | 2.0 × 10⁴ | 103 |
| Ricecorn | 420 | 9 | 3.8 × 10⁵ | 8.0 × 10³ | 4.2 × 10⁴ | 103 |
| Nanoshell | 220 | 5 | 0.7 × 10⁵ | 0.2 × 10³ | 3.6 × 10⁴ | 103 |
Our results demonstrate that application of deep learning methodology for EDX tomography holds great promise in terms of retrieving the 3D structure of an object from extremely noisy elemental maps. This is especially interesting for such applications as investigation of electron beam-sensitive materials, in high-throughput EDX analysis – for example, in industrial settings, and for in situ studies of nanoparticle transformations, where both acquisition time reduction and lowering beam damage effects are essential for answering relevant materials science questions. The approach proposed in this paper can be further improved by specializing the training to a narrower set of shapes based on the particular material under investigation. Additionally, a promising direction consists in incorporating deep learning in the calculation of elemental maps and in the 3D reconstruction step of EDX tomography as well as in utilizing the additional information coming from e.g. high-angle annular dark-field STEM (HAADF-STEM) signal in a multimodal approach. We believe that such developments can bring a drastic improvement in balancing acquisition time and electron beam induced damage against reconstruction quality in EDX tomography.
Conclusions
In this work, we have addressed the problem of very high acquisition time and electron dose requirements for EDX tomography of nanoparticles by developing a deep learning-based method for denoising elemental maps. We established an extensive database of realistic nanoparticle structures and simulated noisy and clean EDX maps, which can be used for training and quantitative evaluation of various data-driven image processing, analysis, and reconstruction methods for nanoparticles. Based on these data, we trained a deep neural network with U-net architecture for denoising elemental maps and analyzed its performance on simulated and experimental data. A quantitative and qualitative comparison of the proposed method to classical denoising approaches demonstrated its superior performance. Furthermore, the improved performance of the proposed approach was even more pronounced for the 3D reconstructions based on the denoised elemental maps. Tests using noisy experimental data showed that deep learning-based denoising can allow for more than an order of magnitude reduction in electron dose and acquisition time for EDX tomography without compromising the analysis of elemental distribution in nanoparticles. The proposed methodology therefore offers a pathway to enable EDX tomography for more electron beam-sensitive materials, and higher throughput studies, such as in situ analysis of elemental redistribution in nanoparticles by TEM.Methods
Training database generation
Meshes corresponding to various typical nanoparticle shapes were generated using Python scripting of the Blender 3D modelling software.37 In this work we used regular shapes, namely spheres, cubes, spherically capped rods, (truncated) octahedra and icosahedra, (truncated) triangular, hexagonal and square platelets as well as oblate and prolate pentagonal bipyramids. Afterwards, geometric parameters of the shapes, such as aspect ratio and truncation degree (where pertinent), smoothing degree of the sharp edges, size, rotation and position in the simulation box were randomized while taking care that the object occupied between 50 and 90% of the final image. Next, the shape was converted to voxel grid representation using the VTK library.38 For simulating core–shell and void-containing particles, two randomized shapes were superimposed and their voxel masks were subtracted from each other. For the core–shell particles, a Gaussian blurring with a randomized strength was applied to the interface between the core and the shell to simulate partially alloyed particles. Projection images of the generated particles were calculated using the Astra Toolbox software.39 EDX maps were simulated by applying Poisson noise with a mean of 103 counts per projection image. Noise from uncompensated EDX background was modelled by Poisson distribution with spatially uniform expected value resulting in additional 100 counts on average. The adequacy of only taking into account the Poisson distribution of signal for modelling the noisy EDX data was confirmed using experimental tests (see Fig. S3 in the ESI†). The generated database was published in open access on Zenodo repository.29Denoising methods implementation
For Gaussian denoising we used the implementation from the SciPy library40 and for TV minimization denoising the Bregman algorithm41 from the scikit-image library42 was used. For the deep neural network we implemented the U-net architecture35 using the Pytorch library.43 The only difference with the original architecture was adding 1 pixel padding to all convolutions for preserving the size of the denoised image. The exact network structure can be found in the ESI (Fig. S5†). The network was trained on a set of 700 pairs of noisy and clean projection images randomly selected from the generated database for 100 epochs using Adam optimizer with 0.001 learning rate. The training took approximately 30 minutes on a workstation equipped with an Nvidia Tesla T4 GPU with 16 GB of memory. After the training, application of the network on the user computer took 25.4 ± 0.5 ms per 256 × 256 noisy image when using an Nvidia GeForce RTX 2060 GPU or 300 ± 20 ms per image using an Intel Core i7-10700 CPU.Assessment of denoising performance
For testing the denoising methods, 150 simulated 3D structures previously not exposed to the trained neural network were randomly selected from the generated database. For each structure, one pair of a clean projection image and a simulated noisy elemental map was obtained. As the error metric, we used normalized mean absolute error (nMAE) between the denoised and the corresponding ground truth data:where

![[x with combining circumflex]](https://www.rsc.org/images/entities/i_char_0078_0302.gif) i and xi are intensities of a pixel in the denoised and reference image, respectively, and N is the total number of pixels.
i and xi are intensities of a pixel in the denoised and reference image, respectively, and N is the total number of pixels.
Tunable parameters of Gaussian and TV denoising were adjusted to the optimal values via numerical minimization of the absolute error with respect to the ground truth data using Brent's algorithm44 implemented in the SciPy library. The neural network was used without any adjustment to particular images.
To test the effect of denoising on the quality of 3D reconstructions, a tilt series of simulated noisy elemental maps was obtained for each 3D structure in the test dataset using an angular range of ±75° and a tilt step of 10° to simulate the typical parameters of EDX tomography. The resulting tilt series were denoised using the respective methods and the 3D object was reconstructed using 15 iterations of the expectation–maximization (EM) algorithm implemented in the Astra Toolbox. For assessing the denoising performance, the normalized mean absolute errors with respect to the corresponding reference 3D structures were calculated.
Experimental data acquisition
Experimental EDX tilt series were acquired in an angular range of ±75° with a 10° tilt step using a Thermo Fisher Scientific Tecnai Osiris TEM equipped with a Super-X four-quadrant EDX spectrometer. The microscope was operated at 200 kV accelerating voltage. Approximately 150 pA electron beam current was used and the acquisition time per map was set by the microscope operator to result in subjectively high-quality maps – the resulting average times and electron doses per map are given in Table 1. Elemental maps for Au and Ag were retrieved using Bruker Esprit software using model spectrum fitting based on L line families. For testing the denoising methods, the number of counts in each elemental map was reduced to 103 on average by drawing a new image from a Poisson distribution with the expected value for each pixel equal to: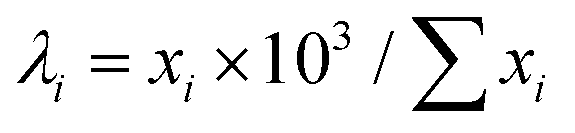 , where xi is the number of counts in the pixel and
  is the total number of counts for the whole original map. The obtained data were denoised using the tested methods and 3D reconstructions were obtained based on the denoised data using 15 iterations of the EM algorithm. For reconstructing the original high signal-to-noise EDX tilt series, the same algorithm and number of iterations were used. The tilt series were aligned using cross-correlation between HAADF-STEM images acquired in parallel with the EDX signal at each tilt angle.
Conflicts of interest
There are no conflicts to declare.Acknowledgements
The authors thank Dr Guillermo González-Rubio, Prof. Dr Andrés Guerrero-Martínez and Prof. Dr Luis Liz-Marzán for kindly providing the samples of nanorod and rice-corn particles, and Prof. Dr Jorge Pérez-Juste for the sample of nanoshell particles. The funding for this project was provided by European Research Council (ERC Consolidator Grant 815128, REALNANO) and European Commission (grant 731019, EUSMI). W. A. additionally acknowledges an Individual Fellowship funded by the Marie Skłodowska-Curie Actions (MSCA grant 797153, SOPMEN) and D. M. P. recognizes the financial support from The Netherlands Organization for Scientific Research (NWO project 016.Veni.192.235).References
- D. B. Williams and C. B. Carter, Transmission Electron Microscopy, Springer US, New York, 2009 Search PubMed.
- A. J. D'Alfonso, B. Freitag, D. Klenov and L. J. Allen, Phys. Rev. B: Condens. Matter Mater. Phys., 2010, 81, 2–5 Search PubMed.
- M. W. Chu, S. C. Liou, C. P. Chang, F. S. Choa and C. H. Chen, Phys. Rev. Lett., 2010, 104, 1–4 CrossRef PubMed.
- M. Watanabe and D. B. Williams, J. Microsc., 2006, 221, 89–109 CrossRef CAS PubMed.
- L. Polavarapu, D. Zanaga, T. Altantzis, S. Rodal-Cedeira, I. Pastoriza-Santos, J. Pérez-Juste, S. Bals and L. M. Liz-Marzán, J. Am. Chem. Soc., 2016, 138, 11453–11456 CrossRef CAS PubMed.
- T. J. A. Slater, A. Macedo, S. L. M. Schroeder, M. G. Burke, P. O'Brien, P. H. C. Camargo and S. J. Haigh, Nano Lett., 2014, 14, 1921–1926 CrossRef CAS PubMed.
- A. Orthacker, G. Haberfehlner, J. Taendl, M. C. Poletti, B. Sonderegger and G. Kothleitner, Nat. Mater., 2018, 17, 1101–1107 CrossRef CAS PubMed.
- K. Lepinay, F. Lorut, R. Pantel and T. Epicier, Micron, 2013, 47, 43–49 CrossRef CAS PubMed.
- A. Genc, L. Kovarik, M. Gu, H. Cheng, P. Plachinda, L. Pullan, B. Freitag and C. Wang, Ultramicroscopy, 2013, 131, 24–32 CrossRef CAS PubMed.
- T. J. A. Slater, A. Janssen, P. H. C. Camargo, M. G. Burke, N. J. Zaluzec and S. J. Haigh, Ultramicroscopy, 2016, 162, 61–73 CrossRef CAS PubMed.
- D. Zanaga, T. Altantzis, J. Sanctorum, B. Freitag and S. Bals, Ultramicroscopy, 2016, 164, 11–16 CrossRef CAS PubMed.
- N. Mevenkamp, K. E. MacArthur, V. Tileli, P. Ebert, L. J. Allen, B. Berkels and M. Duchamp, Ultramicroscopy, 2020, 209, 112877 CrossRef CAS PubMed.
- A. B. Yankovich, C. Zhang, A. Oh, T. J. A. Slater, F. Azough, R. Freer, S. J. Haigh, R. Willett and P. M. Voyles, Nanotechnology, 2016, 27, 1–14 CrossRef PubMed.
- P. Potapov and A. Lubk, Adv. Struct. Chem. Imaging, 2019, 5, 4–24 CrossRef PubMed.
- P. Potapov, P. Longo and E. Okunishi, Micron, 2017, 96, 29–37 CrossRef CAS PubMed.
- R. Huber, G. Haberfehlner, M. Holler, G. Kothleitner and K. Bredies, Nanoscale, 2019, 11, 5617–5632 RSC.
- Z. Zhong, W. J. Palenstijn, N. R. Viganò and K. J. Batenburg, Ultramicroscopy, 2018, 194, 133–142 CrossRef CAS PubMed.
- S. Ravishankar, J. C. Ye and J. A. Fessler, Proc. IEEE, 2020, 108, 86–109 Search PubMed.
- Y. Lecun, Y. Bengio and G. Hinton, Nature, 2015, 521, 436–444 CrossRef CAS PubMed.
- C. Tian, L. Fei, W. Zheng, Y. Xu, W. Zuo and C. W. Lin, Neural Networks, 2020, 131, 251–275 CrossRef PubMed.
- A. S. Lundervold and A. Lundervold, Z. Med. Phys., 2019, 29, 102–127 CrossRef PubMed.
- D. Ardila, A. P. Kiraly, S. Bharadwaj, B. Choi, J. J. Reicher, L. Peng, D. Tse, M. Etemadi, W. Ye, G. Corrado, D. P. Naidich and S. Shetty, Nat. Med., 2019, 25, 954–961 CrossRef CAS PubMed.
- D. M. Pelt, K. J. Batenburg and J. A. Sethian, J. Imaging, 2018, 4, 1–20 Search PubMed.
- E. Bladt, D. M. Pelt, S. Bals and K. J. Batenburg, Ultramicroscopy, 2015, 158, 81–88 CrossRef CAS PubMed.
- Y. Han, J. Jang, E. Cha, J. Lee, H. Chung, M. Jeong, T.-G. Kim, B. G. Chae, H. G. Kim, S. Jun, S. Hwang, S. Lee and J. C. Ye, et al., Nat. Mach. Intell., 2021, 3, 267–274 CrossRef.
- A. Krull, T.-O. Buchholz and F. Jug, in Proceedings of the IEEE/CVF Conference on Computer Vision and Pattern Recognition, 2019, pp. 2129–2137 Search PubMed.
- J. Batson and L. Royer, in International Conference on Machine Learning, PMLR, 2019, pp. 524–533 Search PubMed.
- X. Qu, Y. Huang, H. Lu, T. Qiu, D. Guo, T. Agback, V. Orekhov and Z. Chen, Angew. Chem., 2020, 59, 10297–10300 CrossRef CAS PubMed.
- A. Skorikov, W. Heyvaert, W. Albrecht, D. M. Pelt and S. Bals, Zenodo, 2021 DOI:10.5281/zenodo.4580546.
- M. T. Zeegers, D. M. Pelt, T. van Leeuwen, R. van Liere and K. J. Batenburg, J. Imaging, 2020, 6, 132 CrossRef.
- X. Yang, V. De Andrade, W. Scullin, E. L. Dyer, N. Kasthuri, F. De Carlo and D. Gürsoy, Sci. Rep., 2018, 8, 1–13 Search PubMed.
- K. H. Jin, M. T. McCann, E. Froustey and M. Unser, IEEE Trans. Image Process., 2017, 26, 4509–4522 Search PubMed.
- B. Zhu, J. Z. Liu, S. F. Cauley, B. R. Rosen and M. S. Rosen, Nature, 2018, 555, 487–492 CrossRef CAS PubMed.
- L. I. Rudin, S. Osher and E. Fatemi, Phys. D, 1992, 60, 259–268 CrossRef.
- O. Ronneberger, P. Fischer and T. Brox, in International Conference on Medical image computing and computer-assisted intervention, Springer, 2015, pp. 234–241 Search PubMed.
- M. Weigert, U. Schmidt, T. Boothe, A. Müller, A. Dibrov, A. Jain, B. Wilhelm, D. Schmidt, C. Broaddus, S. Culley, M. Rocha-Martins, F. Segovia-Miranda, C. Norden, R. Henriques, M. Zerial, M. Solimena, J. Rink, P. Tomancak, L. Royer, F. Jug and E. W. Myers, Nat. Methods, 2018, 15, 1090–1097 CrossRef CAS PubMed.
- Blender 2.92 - 3D modelling and rendering software, http://www.blender.org Search PubMed.
- W. Schroeder, K. Martin and B. Lorensen, The Visualization Toolkit, Kitware, 2006 Search PubMed.
- W. Van Aarle, W. J. Palenstijn, J. De Beenhouwer, T. Altantzis, S. Bals, K. J. Batenburg and J. Sijbers, Ultramicroscopy, 2015, 157, 35–47 CrossRef CAS PubMed.
- P. Virtanen, R. Gommers, T. E. Oliphant, M. Haberland, T. Reddy, D. Cournapeau, E. Burovski, P. Peterson, W. Weckesser and J. Bright, et al. , Nat. Methods, 2020, 17, 261–272 CrossRef CAS PubMed.
- T. Goldstein and S. Osher, SIAM J. Imaging Sci., 2009, 2, 323–343 CrossRef.
- S. der Walt, J. L. Schönberger, J. Nunez-Iglesias, F. Boulogne, J. D. Warner, N. Yager, E. Gouillart and T. Yu, PeerJ, 2014, 2, e453 CrossRef PubMed.
- A. Paszke, S. Gross, F. Massa, A. Lerer, J. Bradbury, G. Chanan, T. Killeen, Z. Lin, N. Gimelshein and L. Antiga and others, (Preprint) arXiv:1912.01703.
- R. P. Brent, Algorithms for minimization without derivatives, Courier Corporation, 2013 Search PubMed.
Footnote |
| † Electronic supplementary information (ESI) available. See DOI: 10.1039/d1nr03232a |
| This journal is © The Royal Society of Chemistry 2021 |