
 Open Access Article
 This Open Access Article is licensed under a
 Creative Commons Attribution 3.0 Unported Licence
High-throughput molecular simulations reveal the origin of ion free energy barriers in graphene oxide membranes†
Christopher D.
Williams
 *,
Flor R.
Siperstein
and
Paola
Carbone
*,
Flor R.
Siperstein
and
Paola
Carbone
Department of Chemical Engineering and Analytical Science, School of Engineering, The University of Manchester, Manchester, UK. E-mail: christopher.williams@manchester.ac.uk
First published on 14th July 2021
Abstract
Graphene oxide (GO) membranes are highly touted as materials for contemporary separation challenges including desalination, yet understanding of the interplay between their structure and salt rejection is limited. K+ ion permeation through hydrated GO membranes was investigated by combining structurally realistic molecular models and high-throughput molecular dynamics simulations. We show that it is essential to consider the complex GO microstructure to quantitatively reproduce experimentally-derived free energy barriers to K+ permeation for membranes with various interlayer distances less than 1.3 nm. This finding confirms the non-uniformity of GO nanopores and the necessity of the high-throughput approach for this class of material. The large barriers arise due to significant dehydration of K+ inside the membrane, which can have as few as 3 coordinated water molecules, compared to 7 in bulk solution. Thus, even if the membranes have an average pore size larger than the ion's hydrated diameter, the significant presence of pores whose size is smaller than the hydrated diameter creates bottlenecks for the permeation process.
Introduction
A desire to reduce energy consumption whilst improving the performance and efficiency of desalination technologies, such as reverse osmosis and nanofiltration, has led to a surge in proposed new membrane materials.1–4 Among candidate materials, those containing micropores are appealing because they have the attributes to control salt selectivity and rejection via a range of mechanisms, including physical size exclusion, charge repulsion, chemically specific pore wall interactions and dehydration.5 Unique to the sub-nanometer pore size regime, dehydration selectivity requires pores large enough to allow the permeation of the bare salt ion, but not its accompanying hydration shells. Confinement of the ion in these pores may require distortion or partial removal of hydration shells. This is associated with significant energetic penalties which depend on the ion's hydrated size (the distance to the oxygen atoms in the first hydration shell) and dehydration energy (the interaction strength between the ion and the surrounding water molecules).6,7 Ion dehydration effects have already been shown to be a crucial determinant of the selectivity of sub-nanometer channels in a variety of biological and engineered systems.8–14In the last 20 years many new membrane concepts based on carbonaceous nanomaterials have been proposed. This class of materials is attractive because they can be manipulated into structures containing sub-nanometer pores with highly tunable properties.15–19 Carbon nanotubes (CNTs) possess cylindrical porous channels that display high water flux20,21 and can have pore diameters as small as 0.3 nm.22 Experiments demonstrated tunable ion selectivity in narrow CNTs,23 and molecular dynamics (MD) simulations revealed that significant free energy barriers to K+ permeation (98 kJ mol−1) in CNTs with a pore diameter of 0.8 nm were due to ion dehydration.24 An alternative to CNTs is porous monolayer graphene. Sub-nanometer pores can be introduced to graphene using a range of techniques including UV treatment,25 ion bombardment,26,27 electrical pulsing,28 and oxygen plasma etching.29 Experiments again point towards free energy barriers arising from dehydration effects and selectivity for K+.30,31 MD simulations showed that the permeation of K+ through porous graphene with a pore diameter of 0.8 nm was associated with a free energy barrier of 9 kJ mol−1.32 Notably, the barrier to K+ permeation through pores with 0.8 nm diameter is an order of magnitude smaller for porous monolayer graphene than for CNTs,24 demonstrating the importance of pore geometry in governing the extent of dehydration. Despite their promise, both CNTs and porous monolayer graphene face significant manufacturing challenges, particularly concerning the large-scale production of membranes with a high pore density and narrow pore size distribution.1,33–35
Unlike CNTs and porous monolayer graphene, graphene oxide (GO) membranes can be fabricated by facile and easily-scalable means.36 GO membranes allow water to readily permeate via a tortuous pathway through nanopores formed in between adjacent layers of GO flakes.37 The effective pore size is related to the interlayer distance, d. In the dry state d = 0.7 nm, but contact with liquid water induces swelling of the membranes and an increase in d to ∼1.4 nm.38–40 When fully hydrated these pores are too large to reject ions on the basis of dehydration.41 However, a variety of methods have been proposed to improve ion rejection by restricting the swelling, thus constraining the pore size to the sub-nanometer regime.4,42–45 For example, Chen et al. controlled the swelling of GO membranes by ion cross-linking, exploiting the cation-specific interaction strengths between various aqueous ions and the delocalized electron network of unoxidised graphene regions.46 In particular, K+ intercalation resulted in a GO membrane with d = 1.1 nm and 99% ion rejection. Alternatively, Abraham et al.47 controlled d by partially hydrating the membrane and then confining it within an epoxy resin to prevent swelling. When the resulting physically-confined GO membranes were aligned with the flakes parallel to the feed flow direction, ion rejection was enhanced, particularly in membranes with smaller d values. For example, the barriers to permeation of K+ are 72 kJ mol−1 and 20 kJ mol−1 for d = 0.8 nm and d = 1.0 nm, respectively. In the same study, our group employed MD simulations to compute the free energy barrier to permeation, ΔF, using an idealized, two-dimensional ‘slit pore’ model, formed from the parallel alignment of unoxidized graphene sheets. The simulations qualitatively reproduced the experimentally observed trend, i.e. dependence of ΔF on d. However, the calculated K+ barriers were 17 kJ mol−1 and 6 kJ mol−1 for d = 0.8 nm and d = 1.0 nm, respectively, significantly underestimating the experimental results. One possible explanation for this is that the pore morphology of the employed slit pore model was unrepresentative of the real material.
In this paper, we reveal the origin of enhanced salt rejection in swelling-restricted (d < 1.3 nm) GO membranes using MD simulations. A high-throughput approach was adopted, in which permeation free energy barriers were calculated for a large number of possible K+ ion permeation pathways. The high-throughput approach is necessitated by the flexibility and amorphous nature of the constituent GO flakes and imperfect layering of flakes in the membrane, leading to a broad distribution of d, as evidenced by XRD experiments40 and recent MD simulations,48 and therefore variations in pore size and morphology. We show that the inherent structural heterogeneity and complex microstructure of GO membranes must be accounted for in order to predict K+ permeation barriers in quantitative agreement with experiments.
High-throughput MD simulations
Using MD simulations, realistic atomistic GO membrane models were prepared using six GO flakes following the same procedure described in more detail in our previous study.49 The GO flakes had an oxygen content of 25% by weight and were functionalized by hydroxide, epoxide and carboxylic acid groups. The procedure used is computationally efficient, meaning that average properties (such as ion permeation barriers) can be determined from several independent models. An example of one membrane model is shown in Fig. 1a.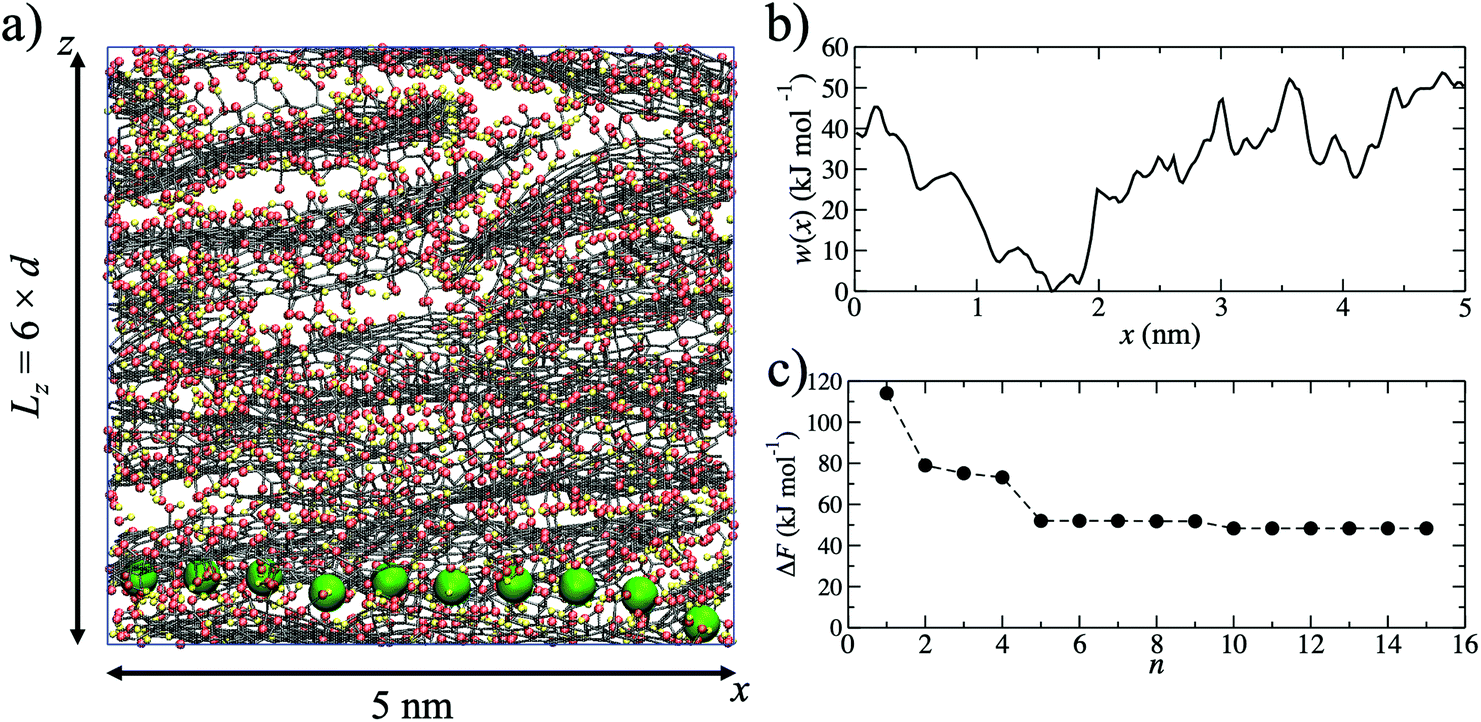 | ||
| Fig. 1 (a) A 5 nm K+ permeation pathway through a GO membrane with d = 0.79 nm. The graphitic lattice is shown with black lines, oxygen atoms with red spheres, hydrogen atoms with yellow spheres and K+ with a large green sphere. To visualize the pathway the position of K+ is shown at 0.4 ns intervals and water molecules are not shown for clarity. (b) The potential of mean force, w(x), for the pathway shown in (a), calculated using umbrella sampling. (c) Convergence of the K+ permeation barrier, ΔF, to 48 kJ mol−1 with increasing number of pathways. | ||
In experiments the average interlayer distance is typically obtained from the central position of broad X-ray diffraction peaks.46,47,50 Due to the disordered layering of GO sheets in the membrane,51d is an average interlayer distance over the entire membrane sample. In our models, the average interlayer distance, d, can be calculated by dividing the length of the simulation cell in the z-direction by the number of GO flakes. The oxygen content of GO sheets is amorphous and they therefore have variable thickness. Since the effective pore diameter is derived from d and the sheet thickness, a broad pore size distribution is expected. In our approach, d is tuned by varying the water content of the models, in a manner analogous to experiments. The free pore space of the models is filled with water molecules and these hydrated pores form the pathways through which ions can permeate the membrane. For a given membrane water content, the models have been validated against various experimental properties, such as d, bulk density and elastic modulus.49 For example, a water content of 15% by weight generates a GO membrane model with d = 0.79 nm, in good agreement with experiments.50
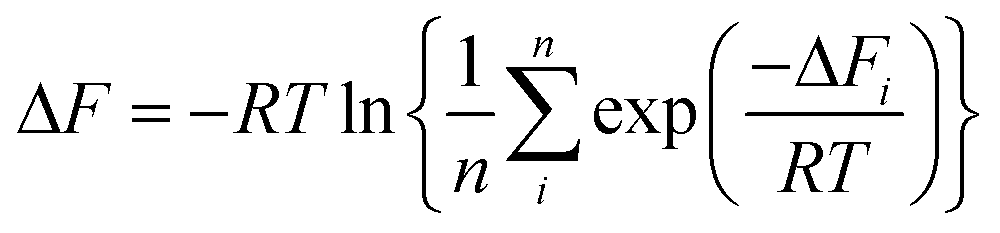
Starting from a single membrane model with d = 0.79 nm, one water molecule in the membrane was randomly selected and substituted for a K+ ion. The K+ ion was then pulled, using a harmonic potential, through the membrane (Fig. 1a) in the x-direction until it returned to its original x-coordinate, generating a single K+ permeation ‘pathway’. The pulling of the ion is intended to mimic an experimental external driving force for ion permeation irrespective of the flow mode (i.e. pressure or concentration gradient filtration). No constraints on sampling were applied in the y- or z-directions, allowing the ion to explore the membrane nanochannels and find a route through the membrane with respect to these two dimensions. The K+ permeation pathways therefore sample various pore morphologies, including capillary channels in between the planes of GO sheets of adjacently stacked layers, as well as in between the edges of sheets within the same layer. The model does not include hole defects, but these have extremely small diameters (∼0.3 nm)52 and an ion need not necessarily pass through such a defect in order to permeate the membrane. The pathway simulation was used to obtain the initial atomic coordinates for the generation of a potential of mean force (Fig. 1b), w(x), calculated using umbrella sampling.53,54 For pathway i, ΔFi was taken to be the maximum of w(x) after shifting w(x) = 0 at the minimum. ΔFi = 53.6 kJ mol−1 in the example shown in Fig. 1b. Due to the disordered membrane structure, the procedure described was repeated for five separately prepared membrane models, to account for the structural variability in the models and allow an average barrier to be calculated.
Since the adopted approach generates an artificial permeation pathway using an arbitrary biasing force, it is unlikely that the first pathway generated will be the one with the lowest energy barrier for a given membrane model. Therefore, the procedure was repeated n times for every membrane model, ensuring each time that the ion replaced a different water molecule. Ion permeation in GO membranes is an Arrhenius-type thermal activation process,47 so the permeation rate depends exponentially on −ΔFi. Therefore, pathways with the lowest ΔFi will contribute most significantly to the observable permeation rate. Pathways with much larger ΔFi would, in reality, either contribute to a much slower ion permeation rate or no measurable permeation. Therefore, of the n pathways generated, only the one with the lowest maximum in w(x) was used to estimate the final value of ΔF. It was found that 15 permeation pathways, averaged over 5 independent membrane models, was sufficient to converge ΔF (Fig. 1c). Alternatively, ΔF can be computed using a Boltzmann-weighted average over all pathways, calculated according to:
 | (1) |
| 1 | 2 | 3 | 4 | 5 | Average | |
|---|---|---|---|---|---|---|
| Simple average | 53.6 | 57.8 | 46.0 | 41.7 | 42.4 | 48.3 |
| Boltzmann-weighted average | 60.3 | 64.5 | 52.6 | 48.3 | 47.4 | 54.6 |
The high-throughput procedure described above is extremely computationally demanding, requiring 3825 separate simulations (equivalent to ∼6 × 10⁶ CPU hours) to obtain a single converged ΔF for a given d. Analysis of the simulations used to generate the pathways showed weak to moderate correlation between the average energy due to the harmonic potential used to pull the ion, Upull, and the maximum energy in w(x), ΔFi (Fig. 2). This relationship was exploited to screen for appropriate pathways; therefore, for all other values of d, ΔF was determined by initially generating 15 pathways but then only proceeding with calculation of w(x) for the two pathways with the lowest values of Upull. All other pathways were discarded, so that only ten pathways (two per membrane model) were required to calculate ΔF, reducing the overall computational cost by a factor of ∼7.5. Thus, the correlation between Upull and ΔFi can be exploited to avoid the significant computational expense associated with calculating the full Boltzmann-weighted average.
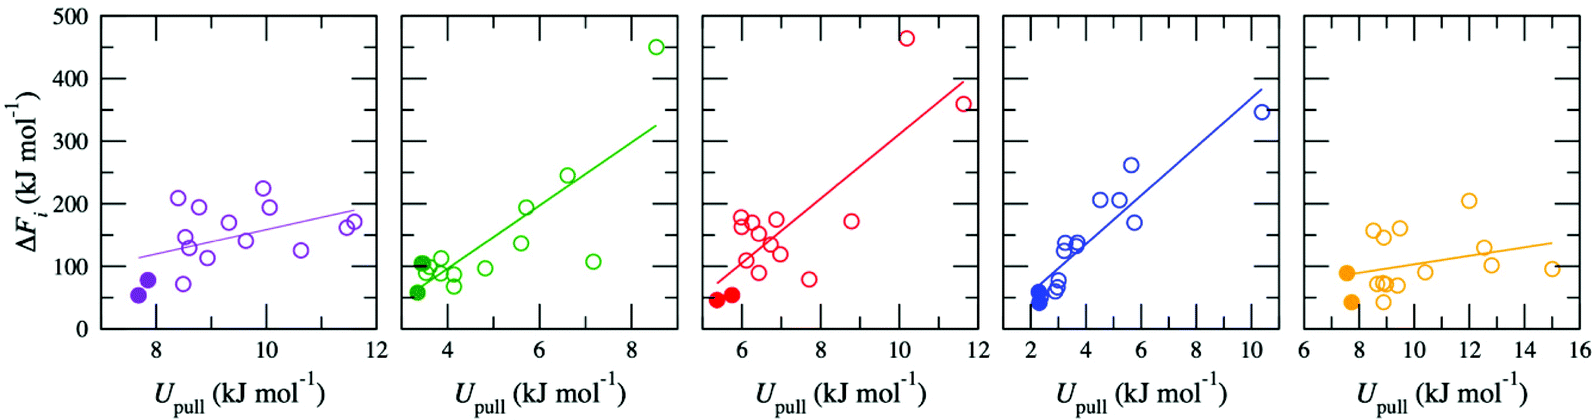 | ||
| Fig. 2 Correlation between ΔFi and Upull for K+ permeation in five independently constructed GO membrane models with a water content of 15% (d = 0.79 nm). The filled symbols highlight the two pathways with the lowest Upull. A line of best fit is also shown. | ||
Discussion
Fig. 3 shows that the K+ permeation barrier in GO membranes decreases with interlayer distance. For the most hydrated membrane (d = 1.35 nm), ΔF = 15 kJ mol−1. As d decreases, ΔF initially increases gradually, reaching 27 kJ mol−1 for d = 0.96 nm, and then more rapidly, reaching 48 kJ mol−1 for d = 0.79 nm and 75 kJ mol−1 for d = 0.76 nm. These values are in good quantitative agreement with the experimentally published barriers of 20 kJ mol−1 and 72 kJ mol−1, for membranes with d = 0.98 nm and d = 0.79 nm, respectively.47 The comparison of ΔF to experiment is much more favorable than using a slit pore model of GO nanopores.47 Using that idealized model, ΔF was 6 kJ mol−1 and 20 kJ mol−1 for d = 1.0 nm and d = 0.8 nm, significantly underpredicting the experimental results.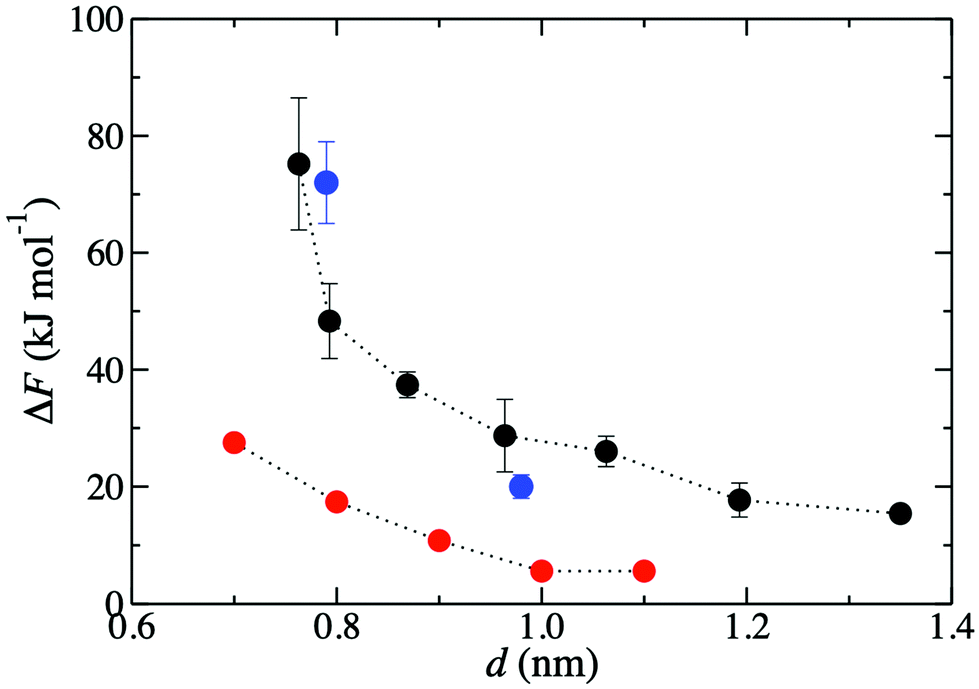 | ||
| Fig. 3 Free energy barriers, ΔF, for K+ permeation in GO membranes for various d values. Black circles denote those obtained in the present work. Blue and red circles denote previously published47 results, respectively from experiment and simulations employing a slit pore model. | ||
To explain the increased barrier at smaller interlayer distances, the interplay between the structure of the GO membrane and the hydrated K+ ion was investigated. Fig. 4a shows the radial distribution function, g(r), between K+ and water oxygen atoms, obtained from a simulation of a single ion in bulk water, demonstrating clearly defined hydration shells. The hydrated diameter of K+, estimated from the position of the first minimum in g(r), was 0.73 nm. The average number of waters in the first hydration shell, nKOw, obtained from the integral of g(r) at the position of the first minimum (r = 0.355 nm), was 7.3.
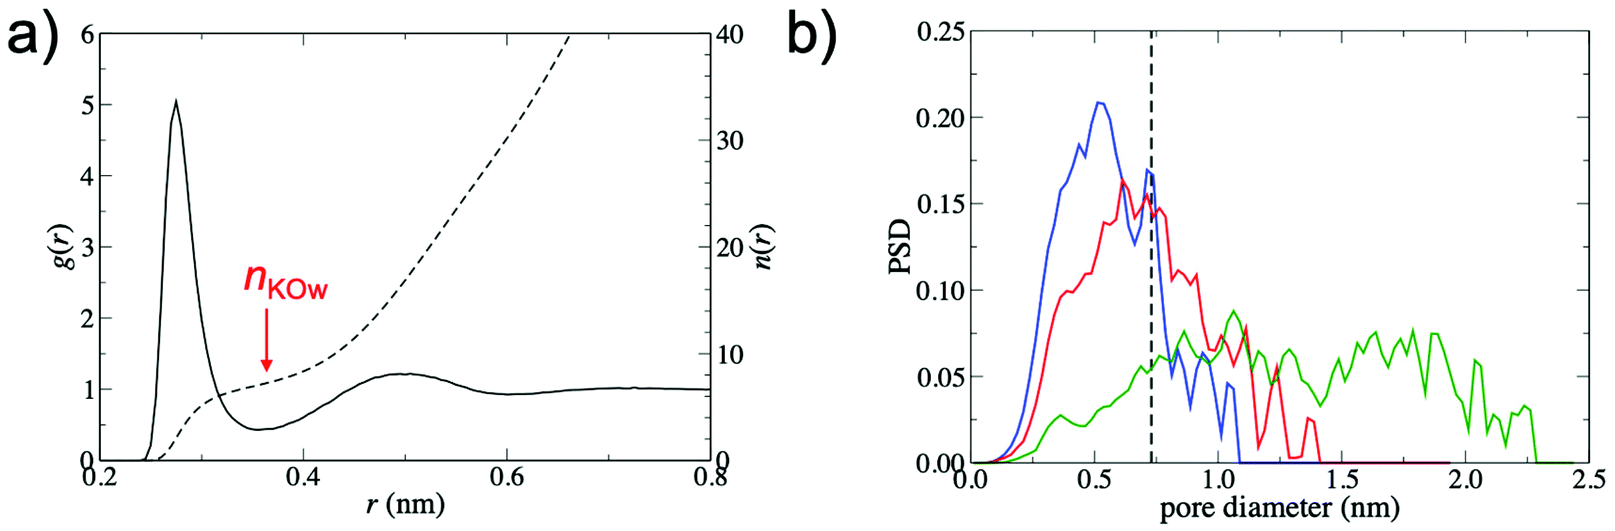 | ||
| Fig. 4 (a) Radial distribution function (solid line), g(r), and coordination number (dashed line), n(r) for K+ – O pairs from a simulation of K+ in pure water. (b) Pore size distributions (PSD) for d = 0.79 nm (blue), d = 0.96 nm (red) and d = 1.35 nm (green). The dashed line marks the hydrated diameter of K+. | ||
Fig. 4b shows pore size distributions (PSD) for membranes with d = 0.79 nm, 0.96 nm and 1.35 nm. The PSD peaks are broad, indicating the non-uniformity of pore diameters within the membrane. In order to permeate the membrane, K+ must pass through regions with a variety of pore sizes and morphologies, justifying the high-throughput approach adopted in this study. Despite the small hydrated diameter of K+ relative to the values of d considered in this study, the PSDs show that the free pore space that can accommodate the hydrated ion is limited. For instance, the PSD for d = 0.79 nm membranes is centered at 0.5 nm and only a small fraction of the free pore space in the membrane (∼16%) is large enough to accommodate the hydrated K+. Thus, partial dehydration of the first hydration shell is required for K+ permeation to occur. At increased values of d, the PSD shifts to larger diameters and significantly broadens. This leads to an increase in the fraction of membrane free pore space that can accommodate the hydrated K+ ion (39% and 83% for d = 0.96 nm and d = 1.35 nm membranes, respectively). As a result, the ion is more likely to be able to find a pathway through the membrane without significant dehydration and ΔF is therefore greatly reduced.
To quantify the extent of K+ dehydration for various d values, the number of O atoms in the first hydration shell in bulk water (7.3) was compared to that in the membranes (Fig. 5a). Due to the non-uniformity of pore size along a given permeation pathway it is also instructive to calculate maximum and minimum coordination numbers from the 50 individual umbrella sampling windows. The coordination numbers were calculated separately using (i) only oxygen atoms in water, nKOw, and (ii) all oxygen atoms in the system including those in GO, nKO. When only water oxygen atoms are considered, the average coordination number is always lower than that of bulk solution. This effect is more significant for small d (e.g. nKOw = 3.9 for d = 0.76 nm), demonstrating enhanced dehydration and explaining the increase in ΔF observed at smaller d. For d = 0.79 nm, the average nKOw is 4.5, compared to the pathway minimum and maximum of 3.1 and 5.8. Fig. 5a shows that the maximum nKO across all d values is ∼9, indicating there is always some region of the permeation pathway where the ion is coordinated by more oxygens than in bulk solution. However, the average of nKO barely deviates from the reference value of nKOw in bulk solution (7.3) and nKO = 6.9 even at the smallest d value considered. This suggests that the oxygen atoms of the GO membrane largely replace those water molecules lost upon dehydration. nKOw also varies considerably throughout a single pathway, as shown in Fig. 5b. Fig. 6 shows a snapshot of the partially dehydrated ion from the umbrella window in which nKOw = 3.1 in a membrane with d = 0.79 nm.
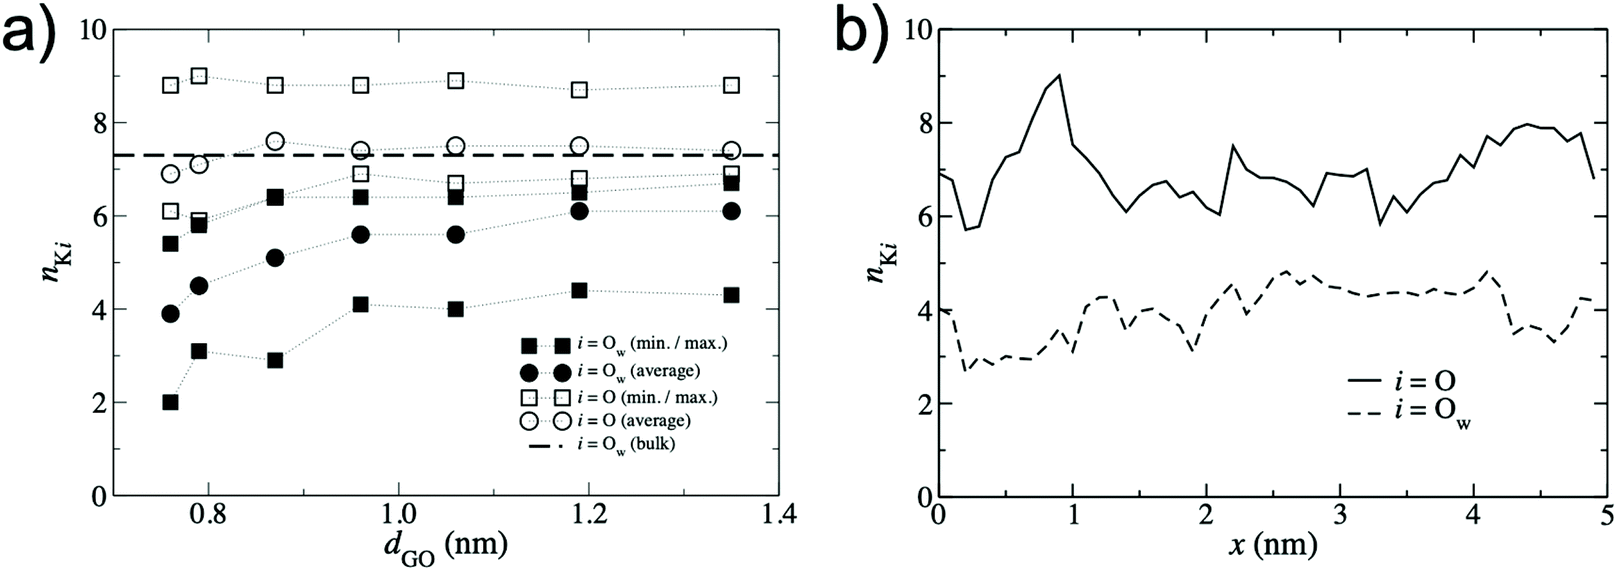 | ||
| Fig. 5 (a) K+ – O coordination numbers, nKi obtained from the lowest energy pathway. Circles denote the average coordination number over the entire permeation pathway and squares denote the minimum and maximum coordination number from the 50 umbrella windows. Filled symbols denote coordination numbers considering only O atoms in water, i = Ow, and hollow symbols denote coordination numbers considering all O atoms in the system, i = O (including those in the GO membrane). The dashed line represents the bulk value of nKOw for K+ obtained from Fig. 4a. (b) Variation in nKi along a single permeation pathway with d = 0.79 nm with GO oxygen atoms included, i = O (solid line), and excluded, i = Ow (dashed line). | ||
 | ||
| Fig. 6 Snapshot of a partially dehydrated K+ in a GO membrane with d = 0.79 nm. Water O and H atoms are shown in blue and white respectively and all other atoms follow the same color scheme as Fig. 1a. | ||
The results show that ion rejection in GO membranes with small d, such as those reported in Abraham et al.,47 can primarily be explained by dehydration effects due to constrictions along the hydrated capillary channels. Given that unoxidized regions of the GO sheet exist in islands and account for only a small percentage (∼16%) of the sheet surface,55,56 it is implausible for an ion to encounter only pristine channels with slit pore geometry (formed between unoxidised graphene regions in adjacent GO sheets) on its tortuous pathway through the membrane. The heterogeneous oxidized regions that have been modelled in this work dominate the GO sheet surface, contributing to the disordered pore morphology and the resulting narrow constrictions that create significant dehydration bottlenecks in the ion permeation process. Other possible ion rejection mechanisms, such as Donnan electrostatic exclusion4 or cation-pi interactions,57–59 do not explain the experimentally-observed strong dependence of ΔF on d in the sub-nanometer regime.47 Furthermore, cation-π interactions, which arise from polarization of the sp2 electrons in pristine graphene, are likely not relevant to permeation through extensively oxidized regions which dominate the GO sheet surface area.
In Table 2 the calculated values of ΔF and average nKOw are compared to literature data for various porous carbons (CNTs, porous monolayer graphene and slit pore model) all with d ≈ 0.8 nm. Only water oxygen atoms are included in this comparison because GO oxygen atoms are immobile so the ion must detach from these oxygen atoms to move through the membrane. The comparison demonstrates the importance of nanopore geometries in determining the extent of dehydration and the associated barriers to permeation. For example, in a GO slit pore model where K+ is coordinated by 5 water molecules ΔF = 17 kJ mol−1,47 whereas in a CNT it is only coordinated by 3 molecules ΔF = 98 kJ mol−1.24 In the present work, K+ is coordinated by 3.9 and 4.5 waters in membranes with d = 0.76 nm and 0.79 nm, respectively, and ΔF lies in between the values for the slit pore model and the CNT. It is clear that, starting from a fully hydrated ion, the removal of successive water molecules from the first hydration shell results in a progressively larger energetic penalty due to dehydration. The above discussion demonstrates the universal relationship between ΔF and nKOw and shows that the relative size of the K+ permeation barrier in any carbonaceous nanomaterial can be estimated provided nKOw is known.
Conclusions
This study has shown that MD simulations can be employed to successfully predict free energy barriers for K+ permeation in swelling-restricted GO membranes with quantitative accuracy. We focused on GO membranes which are physically confined, in which the chemical composition of the membrane is not altered. Other approaches to restrict swelling, such as the use of cross-linkers and ions, could affect the pore environment and lead to more complex transport mechanisms that are not considered in this study. The increase in free energy barrier with decreasing interlayer distance, d < 1.3 nm, is explained by dehydration selectivity, and this is an important finding for GO membranes in which the swelling is restricted. Achieving quantitative accuracy required the use of a molecular model that fully accounts for key structural features of the real material, including heterogeneity in nanopore size and morphology, and resolves a previously published discrepancy between simulated and experimental barriers.47 Moreover, we have shown that ion permeation barriers in carbonaceous nanomaterials with sub-nanometer pores can be universally estimated by the dehydration extent, i.e. the reduction in the number of waters in the first hydration shell of the ion compared to bulk solution. Although this study has specifically focused on K+ in order to facilitate a quantitative comparison with available experimental data, it could easily be extended to other aqueous ions, such as Na+. The approach could therefore be employed in the computational design of GO membranes for desalination or decontamination applications, by enhancing ion rejection or tuning ion selectivity. Finally, this Article highlights the necessity of adopting a high-throughput approach when calculating free energy barriers to permeation in disordered porous materials, because the barriers may vary considerably from pathway to pathway.Methodology
GO membrane models
GO membrane models were constructed according to the MD simulation procedure developed in our previous work,48,49 using six GO sheets with a 5 nm × 5 nm sheet size, an oxygen content of 25% by weight and a variable membrane water content. The type and ratios of oxygen-containing functionalities (hydroxide, epoxide and carboxylic acid) on the GO flakes are justified by experimental data.60–62 Fully flexible GO flakes were modelled using the CHARMM potential63 and partial charges were also taken from our previous work.49 Water was modelled using the three-site TIP3P model.64 Pore size distributions were calculated using the approach of Gelb and Gubbins,65 as implemented in Poreblazer 3.0.2.66 In this approach, water molecules were first removed from the membrane model and the geometric surface of the GO membrane was defined by overlapping VDW spheres. A Monte Carlo procedure was employed in which a probe with radius r is randomly inserted at points in the simulation cell and tested for overlaps with the membrane surface. At each point the largest r that can be accommodated without overlapping with the GO surface was determined and the normalized cumulative pore volume function, Vpore(r), calculated. The derivative −dVpore(r)/dr is the pore size distribution (PSD). A full description of the model construction and characterization can be found in our previous publications48,49Ion permeation simulations
Permeation pathways were generated by swapping a randomly selected water molecule for K+ and then gradually pulling it the length of the simulation cell (5 nm) through the membrane in the x-direction (Fig. 1a). The ion was pulled using the harmonic potential, U(x) = kx(x − xeq)2, where x is the coordinate of the ion, xeq is the equilibrium coordinate of the potential and kx is the force constant. xeq was increased at a rate of 1.0 nm ns−1 for 5 ns and kx = 1.0 × 10⁴ kJ mol−1 nm−2. Upull is defined as the average of U(x) over the length of the entire pathway. Pathway simulations were conducted in the canonical ensemble. Because the harmonic potential was only applied to the position of the ion in the x-direction, the ion was able to freely explore the GO membrane pore structure in the y- and z-directions. An additional harmonic potential, with a force constant of 104 kJ mol−1 nm−2, was used to anchor the center-of-mass of the GO membrane to its initial position, in order to prevent the large force being applied to the ion from shifting the entire membrane through the simulation cell.Umbrella sampling simulations
Initial coordinates for the umbrella sampling windows were selected using coordinates generated from the pathway simulations. Configurations were chosen such that there was an equal spacing of 0.1 nm between the x-coordinate of K+ in adjacent umbrella windows, resulting in a total of 50 umbrella sampling windows along each pathway to ensure good sampling overlap between adjacent simulation windows. Each umbrella sampling simulation was performed for 5.1 ns in the NPT ensemble with the final 5 ns of data used for analysis. Pressure was coupled semi-isotropically, only allowing the simulation cell length in the z-direction (the direction of the flake stacking) to vary, to prevent artificially rigid confinement from hindering the passage of the ion. The ion's position in the x-dimension was maintained using a harmonic potential with a force constant of 2.5 × 10³ kJ mol−1 nm−2. The biased forces from each umbrella window were combined and unbiased using the weighted histogram analysis method67,68 to obtain w(x). K+ was modelled using the parameters from Joung and Cheatham,69 compatible with the TIP3P model. This combination of parameters reproduces the experimental K+ hydration free energy and K+ – water binding distance, which are key parameters governing free energy barriers in sub-nanometer channels.47 For d = 0.79 nm membranes, the effects of slowing the ion pulling rate to 0.5 nm ns−1 and increasing the number of umbrella sampling windows to 100 on ΔF were also separately investigated. Neither change was found to have a significant effect on the final value of ΔF.MD simulation parameters
All MD simulations were performed using Gromacs version 2016.3 in double precision.70 Equations of motion were integrated using the leapfrog algorithm using a timestep of 1 fs. The Verlet cutoff scheme was used to generate the neighbor list.71 The geometry of water molecules was constrained using the SETTLE algorithm.72 A target temperature of 298 K was maintained using the Nose-Hoover73,74 thermostat and a temperature fluctuation period of 1.0 ps. The Parrinello-Rahman barostat75 was employed to maintain the pressure in NPT simulations, employing a reference pressure of 1 bar, a 1 ps time constant and a compressibility of 4.5 × 10⁻⁵ bar−1. Non-bonded interactions were calculated as the sum of a Lennard-Jones 12–6 and coulombic terms. The 12–6 potential was modified by a switch function which smoothly takes the potential to zero between 1 nm and 1.2 nm. The Lorentz-Berthelot combining rules were used to obtain the interaction parameters for unalike atom pairs. coulombic interactions were evaluated using the particle-mesh Ewald method76 with a real space cutoff of 1.2 nm, a Fourier spacing of 0.12 nm and cubic interpolation. The ion permeation simulations have a net charge of +1e. A uniform background charge distribution was added to enable evaluation of the Ewald algorithm, which requires a charge-neutral system.77 This is considered to be equivalent to including of a single counterion in the simulation cell. Due to the very small charge imbalance and uniformity of the charge distribution (i.e. no electrostatic gradient is generated), it is very unlikely to result in artifacts affecting the free energy barriers.Conflicts of interest
The authors have no competing financial interests.Acknowledgements
The authors thank the Engineering and Physical Sciences Research Council for funding (Grant Numbers EP/K016946/1 and EP/R033366/1). The authors acknowledge the assistance given by Research IT, the use of the Computational Shared Facility and the use of The HPC Pool funded by the Research Lifecycle Programme at The University of Manchester. This work also used the ARCHER UK National Supercomputing Service.References
- M. A. Shannon, P. W. Bohn, M. Elimelech, J. G. Georgiadis, B. J. Marinas and A. M. Mayes, Science and technology for water purification in the coming decades, Nature, 2008, 452(7185), 301–310 CrossRef CAS PubMed.
- M. Elimelech and W. A. Phillip, The Future of Seawater Desalination: Energy, Technology, and the Environment, Science, 2011, 333(6043), 712–717 CrossRef CAS PubMed.
- J. R. Werber, C. O. Osuji and M. Elimelech, Materials for Next-Generation Desalination and Water Purification Membranes, Nat. Rev. Mater., 2016, 1(5), 16018 CrossRef CAS.
- J. Safaei, P. Xiong and G. Wang, Progress and prospects of two-dimensional materials for membrane-based water desalination, Mater. Today Adv., 2020, 8, 100108 CrossRef.
- M. Thomas, B. Corry and T. A. Hilder, What Have We Learnt About the Mechanisms of Rapid Water Transport, Ion Rejection and Selectivity in Nanopores from Molecular Simulation?, Small, 2014, 10(8), 1453–1465 CrossRef CAS PubMed.
- B. Corry, Designing carbon nanotube membranes for efficient water desalination, J. Phys. Chem. B, 2008, 112(5), 1427–1434 CrossRef CAS PubMed.
- C. D. Williams and P. Carbone, Selective Removal of Technetium from Water Using Graphene Oxide Membranes, Environ. Sci. Technol., 2016, 50(7), 3875–3881 CrossRef CAS PubMed.
- D. A. Doyle, J. M. Cabral, R. A. Pfuetzner, A. L. Kuo, J. M. Gulbis, S. L. Cohen, B. T. Chait and R. MacKinnon, The structure of the potassium channel: Molecular basis of K+ conduction and selectivity, Science, 1998, 280(5360), 69–77 CrossRef CAS PubMed.
- H. R. Zhekova, V. Ngo, M. C. da Silva, D. Salahub and S. Noskov, Selective ion binding and transport by membrane proteins - A computational perspective, Coord. Chem. Rev., 2017, 345, 108–136 CrossRef CAS.
- W. Kopec, D. A. Kopfer, O. N. Vickery, A. S. Bondarenko, T. L. C. Jansen, B. L. de Groot and U. Zachariae, Direct knock-on of desolvated ions governs strict ion selectivity in K+ channels, Nat. Chem., 2018, 10(8), 813–820 CrossRef CAS PubMed.
- M. Thomas, D. Jayatilaka and B. Corry, The predominant role of coordination number in potassium channel selectivity, Biophys. J., 2007, 93(8), 2635–2643 CrossRef CAS PubMed.
- M. Zwolak, J. Wilson and M. Di Ventra, Dehydration and ionic conductance quantization in nanopores, J. Condens. Matter Phys., 2010, 22, 454126 CrossRef PubMed.
- L. A. Richards, B. S. Richards, B. Corry and A. I. Schaefer, Experimental Energy Barriers to Anions Transporting through Nanofiltration Membranes, Environ. Sci. Technol., 2013, 47(4), 1968–1976 CrossRef CAS PubMed.
- R. Epsztein, E. Shaulsky, M. Qin and M. Elimelech, Activation behavior for ion permeation in ion-exchange membranes: Role of ion dehydration in selective transport, J. Membr. Sci., 2019, 580, 316–326 CrossRef CAS.
- M. S. Mauter and M. Elimelech, Environmental applications of carbon-based nanomaterials, Environ. Sci. Technol., 2008, 42(16), 5843–5859 CrossRef CAS PubMed.
- F. Perreault, A. F. de Faria and M. Elimelech, Environmental applications of graphene-based nanomaterials, Chem. Soc. Rev., 2015, 44(16), 5861–5896 RSC.
- A. Striolo, A. Michaelides and L. Joly, The Carbon-Water Interface: Modeling Challenges and Opportunities for the Water-Energy Nexus, Annu. Rev. Chem. Biomol. Eng., 2016, 7, 533–556 CrossRef CAS PubMed.
- B. Corry, Mechanisms of selective ion transport and salt rejection in carbon nanostructures, MRS Bull., 2017, 42(4), 306–310 CrossRef CAS.
- L. D. Wang, M. S. H. Boutilier, P. R. Kidambi, D. Jang, N. G. Hadjiconstantinou and R. Karnik, Fundamental transport mechanisms, fabrication and potential applications of nanoporous atomically thin membranes, Nat. Nanotechnol., 2017, 12(6), 509–522 CrossRef CAS PubMed.
- G. Hummer, J. C. Rasaiah and J. P. Noworyta, Water conduction through the hydrophobic channel of a carbon nanotube, Nature, 2001, 414(6860), 188–190 CrossRef CAS PubMed.
- B. J. Hinds, N. Chopra, T. Rantell, R. Andrews, V. Gavalas and L. G. Bachas, Aligned multiwalled carbon nanotube membranes, Science, 2004, 303(5654), 62–65 CrossRef CAS PubMed.
- X. Zhao, Y. Liu, S. Inoue, T. Suzuki, R. O. Jones and Y. Ando, Smallest carbon nanotube is 3 angstrom in diameter, Phys. Rev. Lett., 2004, 92, 125502 CrossRef CAS PubMed.
- R. H. Tunuguntla, R. Y. Henley, Y. C. Yao, T. A. Pham, M. Wanunu and A. Noy, Enhanced water permeability and tunable ion selectivity in subnanometer carbon nanotube porins, Science, 2017, 357(6353), 792–796 CrossRef CAS PubMed.
- C. Song and B. Corry, Intrinsic Ion Selectivity of Narrow Hydrophobic Pores, J. Phys. Chem. B, 2009, 113(21), 7642–7649 CrossRef CAS PubMed.
- S. P. Koenig, L. D. Wang, J. Pellegrino and J. S. Bunch, Selective molecular sieving through porous graphene, Nat. Nanotechnol., 2012, 7(11), 728–732 CrossRef CAS PubMed.
- C. J. Russo and J. A. Golovchenko, Atom-by-atom nucleation and growth of graphene nanopores, Proc. Natl. Acad. Sci. U. S. A., 2012, 109(16), 5953–5957 CrossRef CAS PubMed.
- S. C. O'Hern, M. S. H. Boutilier, J. C. Idrobo, Y. Song, J. Kong, T. Laoui, M. Atieh and R. Karnik, Selective Ionic Transport through Tunable Subnanometer Pores in Single-Layer Graphene Membranes, Nano Lett., 2014, 14(3), 1234–1241 CrossRef PubMed.
- A. T. Kuan, B. Lu, P. Xie, T. Szalay and J. A. Golovchenko, Electrical pulse fabrication of graphene nanopores in electrolyte solution, Appl. Phys. Lett., 2015, 106(20), 203109 CrossRef PubMed.
- S. P. Surwade, S. N. Smirnov, I. V. Vlassiouk, R. R. Unocic, G. M. Veith, S. Dai and S. M. Mahurin, Water desalination using nanoporous single-layer graphene, Nat. Nanotechnol., 2015, 10(5), 459–464 CrossRef CAS PubMed.
- T. Jain, B. C. Rasera, R. J. S. Guerrero, M. S. H. Boutilier, S. C. O'Hern, J. C. Idrobo and R. Karnik, Heterogeneous sub-continuum ionic transport in statistically isolated graphene nanopores, Nat. Nanotechnol., 2015, 10(12), 1053–1057 CrossRef CAS PubMed.
- R. C. Rollings, A. T. Kuan and J. A. Golovchenko, Ion selectivity of graphene nanopores, Nat. Commun., 2016, 7, 11408 CrossRef CAS PubMed.
- S. Sahu, M. Di Ventra and M. Zwolak, Dehydration as a Universal Mechanism for Ion Selectivity in Graphene and Other Atomically Thin Pores, Nano Lett., 2017, 17(8), 4719–4724 CrossRef CAS PubMed.
- S. Homaeigohar and M. Elbahri, Graphene membranes for water desalination, NPG Asia Mater., 2017, 9, e427 CrossRef CAS.
- P. R. Kidambi, G. D. Nguyen, S. Zhang, Q. Chen, D. Kong, J. Warner, A. P. Li and R. Karnik, Facile Fabrication of Large-Area Atomically Thin Membranes by Direct Synthesis of Graphene with Nanoscale Porosity, Adv. Mater., 2018, 30(49), 1804977 CrossRef PubMed.
- R. Van Noorden, The Trials of New Carbon, Nature, 2011, 469(7328), 14–16 CrossRef CAS PubMed.
- D. A. Dikin, S. Stankovich, E. J. Zimney, R. D. Piner, G. H. B. Dommett, G. Evmenenko, S. T. Nguyen and R. S. Ruoff, Preparation and Characterization of Graphene Oxide Paper, Nature, 2007, 448(7152), 457–460 CrossRef CAS PubMed.
- R. R. Nair, H. A. Wu, P. N. Jayaram, I. V. Grigorieva and A. K. Geim, Unimpeded Permeation of Water Through Helium-Leak-Tight Graphene-Based Membranes, Science, 2012, 335(6067), 442–444 CrossRef CAS PubMed.
- A. V. Talyzin, T. Hausmaninger, S. J. You and T. Szabo, The structure of graphene oxide membranes in liquid water, ethanol and water-ethanol mixtures, Nanoscale, 2014, 6(1), 272–281 RSC.
- B. Rezania, N. Severin, A. V. Talyzin and J. P. Rabe, Hydration of Bilayered Graphene Oxide, Nano Lett., 2014, 14(7), 3993–3998 CrossRef CAS PubMed.
- S. X. Zheng, Q. S. Tu, J. J. Urban, S. F. Li and B. X. Mi, Swelling of Graphene Oxide Membranes in Aqueous Solution: Characterization of Interlayer Spacing and Insight into Water Transport Mechanisms, ACS Nano, 2017, 11(6), 6440–6450 CrossRef CAS PubMed.
- R. K. Joshi, P. Carbone, F. C. Wang, V. G. Kravets, Y. Su, I. V. Grigorieva, H. A. Wu, A. K. Geim and R. R. Nair, Precise and Ultrafast Molecular Sieving Through Graphene Oxide Membranes, Science, 2014, 343(6172), 752–754 CrossRef CAS PubMed.
- S. Park, K. S. Lee, G. Bozoklu, W. Cai, S. T. Nguyen and R. S. Ruoff, Graphene Oxide Papers Modified by Divalent Ions - Enhancing Mechanical Properties via Chemical Cross-Linking, ACS Nano, 2008, 2(3), 572–578 CrossRef CAS PubMed.
- M. Hu and B. X. Mi, Enabling Graphene Oxide Nanosheets as Water Separation Membranes, Environ. Sci. Technol., 2013, 47(8), 3715–3723 CrossRef CAS PubMed.
- U. Martinez, J. H. Dumont, E. F. Holby, K. Artyushkova, G. M. Purdy, A. Singh, N. H. Mack, P. Atanassov, D. A. Cullen, K. L. More, M. Chhowalla, P. Zelenay, A. M. Dattelbaum, A. D. Mohite and G. Gupta, Critical Role of Intercalated Water for Electrocatalytically Active Nitrogen-Doped Graphitic Systems, Sci. Adv., 2016, 2(3), e1501178 CrossRef PubMed.
- W. B. Li, W. F. Wu and Z. J. Li, Controlling Interlayer Spacing of Graphene Oxide Membranes by External Pressure Regulation, ACS Nano, 2018, 12(9), 9309–9317 CrossRef CAS PubMed.
- L. Chen, G. S. Shi, J. Shen, B. Q. Peng, B. W. Zhang, Y. Z. Wang, F. G. Bian, J. J. Wang, D. Y. Li, Z. Qian, G. Xu, G. P. Liu, J. R. Zeng, L. J. Zhang, Y. Z. Yang, G. Q. Zhou, M. H. Wu, W. Q. Jin, J. Y. Li and H. P. Fang, Ion sieving in graphene oxide membranes via cationic control of interlayer spacing, Nature, 2017, 550(7676), 415–418 CrossRef PubMed.
- J. Abraham, K. S. Vasu, C. D. Williams, K. Gopinadhan, Y. Su, C. T. Cherian, J. Dix, E. Prestat, S. J. Haigh, I. V. Grigorieva, P. Carbone, A. K. Geim and R. R. Nair, Tunable Sieving of Ions using Graphene Oxide Membranes, Nat. Nanotechnol., 2017, 12(6), 546–550 CrossRef CAS PubMed.
- C. D. Williams, P. Carbone and F. R. Siperstein, In Silico Design and Characterization of Graphene Oxide Membranes with Variable Water Content and Flake Oxygen Content, ACS Nano, 2019, 13(3), 2995–3004 CrossRef CAS PubMed.
- C. D. Williams, P. Carbone and F. R. Siperstein, Computational characterisation of dried and hydrated graphene oxide membranes, Nanoscale, 2018, 10(4), 1946–1956 RSC.
- R. L. Liu, T. Gong, K. Zhang and C. Lee, Graphene oxide papers with high water adsorption capacity for air dehumidification, Sci. Rep., 2017, 7, 9761 CrossRef PubMed.
- A. Iakunkov and A. V. Talyzin, Swelling properties of graphite oxides and graphene oxide multilayered materials, Nanoscale, 2020, 12(41), 21060–21093 RSC.
- H. Li, Z. N. Song, X. J. Zhang, Y. Huang, S. G. Li, Y. T. Mao, H. J. Ploehn, Y. Bao and M. Yu, Ultrathin, Molecular-Sieving Graphene Oxide Membranes for Selective Hydrogen Separation, Science, 2013, 342(6154), 95–98 CrossRef CAS PubMed.
- G. M. Torrie and J. P. Valleau, Monte Carlo Free Energy Estimates Using Non-Boltzmann Sampling: Application to Sub-critical Lennard-Jones Fluid, Chem. Phys. Lett., 1974, 28(4), 578–581 CrossRef CAS.
- G. M. Torrie and J. P. Valleau, Non-Physical Sampling Distributions in Monte Carlo Free-Energy Estimation: Umbrella Sampling, J. Comput. Phys., 1977, 23(2), 187–199 CrossRef.
- D. Pacile, J. C. Meyer, A. F. Rodriguez, M. Papagno, C. Gomez-Navarro, R. S. Sundaram, M. Burghard, K. Kern, C. Carbone and U. Kaiser, Electronic properties and atomic structure of graphene oxide membranes, Carbon, 2011, 49(3), 966–972 CrossRef CAS.
- K. Erickson, R. Erni, Z. Lee, N. Alem, W. Gannett and A. Zettl, Determination of the Local Chemical Structure of Graphene Oxide and Reduced Graphene Oxide, Adv. Mater., 2010, 22(40), 4467–4472 CrossRef CAS PubMed.
- P. Sun, F. Zheng, M. Zhu, Z. Song, K. Wang, M. Zhong, D. Wu, R. B. Little, Z. Xu and H. Zhu, Selective Trans-Membrane Transport of Alkali and Alkaline Earth Cations through Graphene Oxide Membranes Based on Cation-pi Interactions, ACS Nano, 2014, 8(1), 850–859 CrossRef CAS PubMed.
- C. D. Williams, J. Dix, A. Troisi and P. Carbone, Effective Polarization in Pairwise Potentials at the Graphene-Electrolyte Interface, J. Phys. Chem. Lett., 2017, 8(3), 703–708 CrossRef CAS PubMed.
- J. D. Elliott, A. Troisi and P. Carbone, A QM/MD Coupling Method to Model the Ion-Induced Polarization of Graphene, J. Chem. Theory Comput., 2020, 16(8), 5253–5263 CrossRef CAS PubMed.
- A. Lerf, H. Y. He, M. Forster and J. Klinowski, Structure of Graphite Oxide Revisited, J. Phys. Chem. B, 1998, 102(23), 4477–4482 CrossRef CAS.
- K. Krishnamoorthy, M. Veerapandian, K. Yun and S. J. Kim, The Chemical and structural analysis of graphene oxide with different degrees of oxidation, Carbon, 2013, 53, 38–49 CrossRef CAS.
- O. C. Compton, B. Jain, D. A. Dikin, A. Abouimrane, K. Amine and S. T. Nguyen, Chemically Active Reduced Graphene Oxide with Tunable C/O Ratios, ACS Nano, 2011, 5(6), 4380–4391 CrossRef CAS PubMed.
- K. Vanommeslaeghe, E. Hatcher, C. Acharya, S. Kundu, S. Zhong, J. Shim, E. Darian, O. Guvench, P. Lopes, I. Vorobyov and A. D. MacKerell, CHARMM General Force Field: A Force Field for Drug-Like Molecules Compatible with the CHARMM All-Atom Additive Biological Force Fields, J. Comput. Chem., 2010, 31(4), 671–690 CAS.
- W. L. Jorgensen, J. Chandrasekhar, J. D. Madura, R. W. Impey and M. L. Klein, Comparison of Simple Potential Functions for Simulating Liquid Water, J. Chem. Phys., 1983, 79(2), 926–935 CrossRef CAS.
- L. D. Gelb and K. E. Gubbins, Pore size distributions in porous glasses: A computer simulation study, Langmuir, 1999, 15(2), 305–308 CrossRef CAS.
- L. Sarkisov and A. Harrison, Computational Structure Characterisation Tools in Application to Ordered and Disordered Porous Materials, Mol. Simul., 2011, 37(15), 1248–1257 CrossRef CAS.
- S. Kumar, D. Bouzida, R. H. Swendsen, P. A. Kollman and J. M. Rosenberg, The Weighted Histogram Analysis Method for Free Energy Calculations on Biomolecules. I. The Method, J. Comput. Chem., 1992, 13(8), 1011–1021 CrossRef CAS.
- J. S. Hub, B. L. de Groot and D. van der Spoel, g_wham-A Free Weighted Histogram Analysis Implementation Including Robust Error and Autocorrelation Estimates, J. Chem. Theory Comput., 2010, 6(12), 3713–3720 CrossRef CAS.
- I. S. Joung and T. E. Cheatham III, Determination of alkali and halide monovalent ion parameters for use in explicitly solvated biomolecular simulations, J. Phys. Chem. B, 2008, 112(30), 9020–9041 CrossRef CAS PubMed.
- D. Van der Spoel, E. Lindahl, B. Hess, G. Groenhof, A. E. Mark and H. J. C. Berendsen, GROMACS: Fast, Flexible, and Free, J. Comput. Chem., 2005, 26(16), 1701–1718 CrossRef CAS PubMed.
- S. Pall and B. Hess, A flexible algorithm for calculating pair interactions on SIMD architectures, Comput. Phys. Commun., 2013, 184(12), 2641–2650 CrossRef CAS.
- S. Miyamoto and P. A. Kollman, Settle: an Analytical Version of the SHAKE and RATTLE Algorithm for Rigid Water Models, J. Comput. Chem., 1992, 13(8), 952–962 CrossRef CAS.
- S. Nose, A Molecular Dynamics Method for Simulations in the Canonical Ensemble, Mol. Phys., 1984, 52(2), 255–268 CrossRef CAS.
- W. G. Hoover, Canonical Dynamics: Equilibrium Phase-Space Distributions, Phys. Rev. A, 1985, 31(3), 1695–1697 CrossRef PubMed.
- M. Parrinello and A. Rahman, Polymorphic Transitions in Single-Crystals - a New Molecular Dynamics Method, J. Appl. Phys., 1981, 52(12), 7182–7190 CrossRef CAS.
- U. Essmann, L. Perera, M. L. Berkowitz, T. Darden, H. Lee and L. G. Pedersen, A Smooth Particle Mesh Ewald Method, J. Chem. Phys., 1995, 103(19), 8577–8593 CrossRef CAS.
- J. S. Hub, B. L. de Groot, H. Grubmuller and G. Groenhof, Quantifying Artifacts in Ewald Simulations of Inhomogeneous Systems with a Net Charge, J. Chem. Theory Comput., 2014, 10(1), 381–390 CrossRef CAS PubMed.
Footnote |
| † Electronic supplementary information (ESI) available. See DOI: 10.1039/d1nr02169a |
| This journal is © The Royal Society of Chemistry 2021 |