
“One stone, two birds”: engineering 2-D ultrathin heterostructure nanosheet BiNS@NaLnF4 for dual-modal computed tomography/magnetic resonance imaging guided, photonic synergetic theranostics†
Sihan
Ma
 ab,
Lin
Wang
*cd,
Zongjunlin
Liu
c,
Xian
Luo
c,
Zonglang
Zhou
ce,
Jun
Xie
c,
Yipeng
Li
ab,
Shuo
Cong
ab,
Min
Zhou
f,
Yang
Xu
*f and
Guang
Ran
*ab
ab,
Lin
Wang
*cd,
Zongjunlin
Liu
c,
Xian
Luo
c,
Zonglang
Zhou
ce,
Jun
Xie
c,
Yipeng
Li
ab,
Shuo
Cong
ab,
Min
Zhou
f,
Yang
Xu
*f and
Guang
Ran
*ab
aCollege of energy, Xiamen University, Xiamen City, Fujian Province 361002, China. E-mail: gran@xmu.edu.cn
bFujian Research Center for Nuclear Engineering, Xiamen City, Fujian Province 361102, China
cSchool of Medicine, Xiamen University, Xiamen, Fujian 361002, China
dDepartment of Oncology, Zhongshan Hospital, Xiamen University, No. 201-209 Hubinnan Road, Xiamen 361004, Fujian Province, China. E-mail: wanglin_linda82@163.com
e174 Clinical College affiliated to Anhui Medical University, Anhui Medical University, Hefei, Anhui Province 230032, China
fSchool of pharmaceutical sciences, Xiamen University, Xiamen City, Fujian Province 361002, China. E-mail: xu_yang@xmu.edu.cn
First published on 27th November 2020
Abstract
It is interesting yet challenging to design theranostic nanoplatforms for the accurate diagnosis and therapy of diseases; these nanoplatforms consist of single contrast-enhanced imaging or therapeutic agents, and they possess their own unique shortcomings that limit their widespread bio-medical applications. Therefore, designing a potential theranostic agent is an emerging approach for the synergistic diagnosis and therapeutics in bio-medical applications. Herein, a lanthanide-loaded (NaLnF4) heterostructure BiOCl ultrathin nanosheet (BiNS@NaLnF4) as a theranostic agent was synthesized facilely by a solvothermal protocol. BiNS@NaLnF4 was employed as a multi-modal contrast agent for computed tomography (CT) and magnetic resonance imaging (MRI), showing a high-performance X-ray absorption contrast effect, an outstanding T1-weighted imaging function result, good cytocompatibility and favorable in vivo effective imaging for CT. Notably, BiNS@NaLnF4 was applied to achieve a satisfactory photon-thermal conversion efficiency (35.3%). Moreover, the special heterostructure barrier achieved increased utilization of electrons/holes, enhancing the generation of reactive oxygen species (ROS) under visible-light irradiation to further expand the therapeutic effect. Dramatically, visible light emission with the up-conversion law was employed to stimulate ROS after irradiation with a 980 nm laser. Simultaneously, the as-prepared BiNS@NaLnF4 can be applied in photothermal/photodynamic therapy (PTT/PDT) investigation for tumor ablation. In summary, the results reveal that BiNS@NaLnF4 is a potential multi-modal theranostic candidate, providing new insights for synergistic theranostics of tumors.
Introduction
X-ray computed tomography (CT) and magnetic resonance imaging (MRI) are highly significant molecular technologies in the diagnosis and treatment of diseases;1,2 however, despite providing various pieces of the medical information after diagnostic scanning projects, they possess some weaknesses. For instance, CT has high X-ray tissue penetration ability but poor detection sensitivity for soft matter.3–5 MRI has good resolution for soft tissue detection but has poor contrast ability for the detection of hard organs.1,6,7 In general, contrast-enhanced agents must be used to improve the technical deficiencies in some extended fields. A good contrast agent should have a high X-ray absorption attenuation, a long circulating time, a small proton longitudinal relaxation time (T1) or a lower proton transverse relaxation time (T2).1,8 However, most agents are limited in the clinical setting because of their small molecule properties (e.g., short circulating time in the body, higher injection dose and kidney toxicity)9–12 and cannot provide sufficient information for diagnosis. Therefore, there is an urgent need to develop optimized contrast agents with multiple functions.Over the past decades, nanomaterials with unique properties have been used as contrast agents; these materials attract the most interest because they provide extensive techniques to achieve convenient goals, making up for the deficiencies of single contrast agents. Importantly, inorganic-based nanoparticles, such as metal oxides, metal sulfides and lanthanide element compounds, have been investigated widely. These inorganic-based nanomaterials have high atomic numbers to generate favorable X-ray absorption characterization and display long circulating times, including Au, Ag, BaYbF5, NaYbF4, NaYF4, MoS2, KGdF4, and NaGdF4.13–27 Contrast agents with high MRI contrast effects result from the seven unpaired electrons in Gd,28,29 such as nanosized Gd2O3,30 Ba2GdF5, and CaF2:Gd.21,28,31–35 The above reports demonstrated good contrast effects; meanwhile, greater contrast effects can be observed in inexpensive bismuth particles because of their excellent capacities, such as high X-ray absorption and optimized optical properties. Therefore, bismuth is a wise choice as an emerging contrast agent.
In addition, the use of bismuth nanomaterials as synergetic theranostic candidates is a promising and emerging approach. Bismuth-based nanomaterials can be used as promising therapeutic agents and have been investigated in previous reports.36–38 On the one hand, semiconductor functional bismuth nanomaterials can manufacture electron–hole pairs (e−/h+) to induce the generation of ROS after laser irradiation. The holes are absorbed by surrounding water to become hydroxyl radicals (˙OH), and the electrons interact with oxygen to become superoxide radicals (˙O2−).39,40 As a result, the generated ˙OH and ˙O2− will subsequently break DNA or biomolecules to realize killing of tumor cells or damage the structures of objects36,41 when photodynamic therapy (PDT) is performed. However, the generation of photogenerated electron–hole pairs has been restricted because of the limitation of the narrow band gap energy and wavelength of irradiated light, mostly using UV light.42,43 To the best of our knowledge, vis-NIR light stimulates the generation of photo-electrons, which is a significant improvement; because heterojunction materials with irreplaceable potential barriers can effectively promote the separation of photogenerated electron–hole pairs to enhance the generation of ROS, it is worthwhile to research heterostructure bismuth-based nanomaterials. On the other hand, the surface plasma resonance (SPR) of bismuth generates a large amount of heat after light irradiation; photothermal therapy (PTT) as a fashionable therapeutic strategy is widely investigated because of potential SPR, and thus, the advantages of PTT can be exploited fully. However, a low photothermal conversion efficiency is not sufficient; it is of great significance to find materials with high photothermal conversion efficiency. Furthermore, ultrathin helical bowl-like44 or platform-structured nanomaterials with high surface areas and light penetration play promising roles in optical properties-related applications, showing high light utilization compared with common assembled structures.45–47
In this study, we develop a facile solvothermal strategy to generate a novel lanthanide-loaded heterojunction bismuth-based theranostic candidate, BiNS@NaLnF4, with multiple functions after combining the advantages of different elements. The physical structures of BiNS@NaLnF4 are studied in detail. The electronic densities of states and band structures of BiNS@NaLnF4 are investigated by density functional theory (DFT). The multi-modal contrast effects of BiNS@NaLnF4 are investigated for CT and MRI in vitro. Notably, the high photothermal efficiency, bio-imaging application prospects and potential vis-NIR photothermal–photodynamic applications of BiNS@NaLnF4 are further evaluated, indicating its tremendous potential for tumor diagnosis and treatment; thus, the use of BiNS@NaLnF4 can provide a reliable method to accelerate anti-tumor activities.
Results and discussion
First, BiOCl nanoparticles with two different morphologies were prepared, including flower-like nanoparticles (BiNPs@NaLnF4) and ultrathin nanosheets (BiNS@NaLnF4). The fabrication processes for BiNS@NaLnF4 and BiNPs@NaLnF4 are shown in Scheme 1. A controlled strategy was employed to manufacture products without the use of complex procedures. Briefly, 10 mL EG solution containing KCl (0.04 g) was slowly added to 35 mL (EG![[thin space (1/6-em)]](https://www.rsc.org/images/entities/char_2009.gif) :DI = 5:2) solution containing 1 mmol Bi(NO3)3 and 0.5 g PVP (MW = 10k) to generate a mixture. Subsequently, the mixture was transferred to an autoclave for 160 °C for 24 h, and the reaction products were centrifuged to remove impurities before freeze drying. The as-synthesized BiNS were reacted with a mixture solution (NaF and Ln(NO3)3 raw material solution) at 100 °C for 4 h with ultraviolet irradiation to obtain BiNS@NaLnF4. Similarly, lanthanide-loaded BiOCl nanospheres (BiNPs@NaLnF4) were synthesized by the above strategy. The morphologies and microstructures of the BiNPs and BiNPs@NaLnF4 were recorded by TEM images (Fig. S1(a)–(d)†); each TEM image has an SEM picture inserted in the top right corner. Different views are displayed (Fig. S2(a)–(d)†). The TEM images reveal the typical size distributions and morphologies of the nanoparticles. The BiNPs and BiNPs@NaLnF4 were ∼717.16 nm and 832.36 nm in diameter, respectively, which are consistent with the SEM images (Fig. S2(e)–(f)†). Small amounts of bar-shaped nanoproducts were observed in the background; the corresponding elemental compositions of the samples were obtained by map scanning analysis (Fig. S1(e)–(l)†) and EDS (Fig. S1(g)†). The BiNPs have two main components, and BiNPs@NaLnF4 demonstrate the successful conjugation of lanthanide elements such as Gd, Ce and Er on the surface of the BiNPs.
:DI = 5:2) solution containing 1 mmol Bi(NO3)3 and 0.5 g PVP (MW = 10k) to generate a mixture. Subsequently, the mixture was transferred to an autoclave for 160 °C for 24 h, and the reaction products were centrifuged to remove impurities before freeze drying. The as-synthesized BiNS were reacted with a mixture solution (NaF and Ln(NO3)3 raw material solution) at 100 °C for 4 h with ultraviolet irradiation to obtain BiNS@NaLnF4. Similarly, lanthanide-loaded BiOCl nanospheres (BiNPs@NaLnF4) were synthesized by the above strategy. The morphologies and microstructures of the BiNPs and BiNPs@NaLnF4 were recorded by TEM images (Fig. S1(a)–(d)†); each TEM image has an SEM picture inserted in the top right corner. Different views are displayed (Fig. S2(a)–(d)†). The TEM images reveal the typical size distributions and morphologies of the nanoparticles. The BiNPs and BiNPs@NaLnF4 were ∼717.16 nm and 832.36 nm in diameter, respectively, which are consistent with the SEM images (Fig. S2(e)–(f)†). Small amounts of bar-shaped nanoproducts were observed in the background; the corresponding elemental compositions of the samples were obtained by map scanning analysis (Fig. S1(e)–(l)†) and EDS (Fig. S1(g)†). The BiNPs have two main components, and BiNPs@NaLnF4 demonstrate the successful conjugation of lanthanide elements such as Gd, Ce and Er on the surface of the BiNPs.
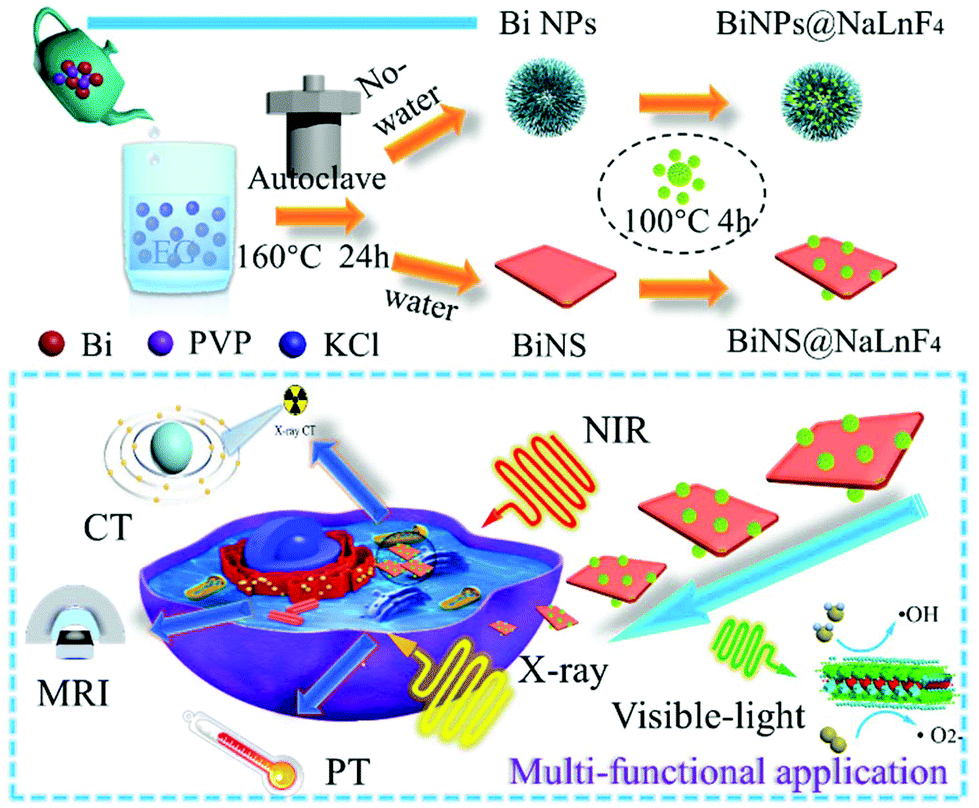 | ||
| Scheme 1 Synthesis of Bi-based nanomaterials, including BiNPs@NaLnF4 and BiNS@NaLnF4, by a facile hydrothermal protocol. Two different procedures could be used to achieve nanomaterials with different morphologies because of the efficient use of water. | ||
The morphologies and microstructures of BiNS and BiNS@NaLnF4 were obtained by TEM images; as shown in Fig. 1(a) and (b), an obvious ultrathin nanosheet structure with a length of ∼80 nm for BiNS and BiNS@NaLnF4 with a heterostructure model are clearly visible and are consistent with the SEM images (Fig. S2(h)–(l)†) on an ultrathin scale of ∼8 nm. The corresponding elemental compositions of the as-prepared nanosheets were considered by map scanning analysis (Fig. 1(c)–(l)) and EDS (Fig. 1(m)–(n)). The components of BiNS are similar to those of BiNP, and BiNS@NaLnF4 demonstrates the successful conjugation of lanthanide elements such as Gd, Yb and Er on the surface of the BiNS; thus, the heterojunction composition was successful.
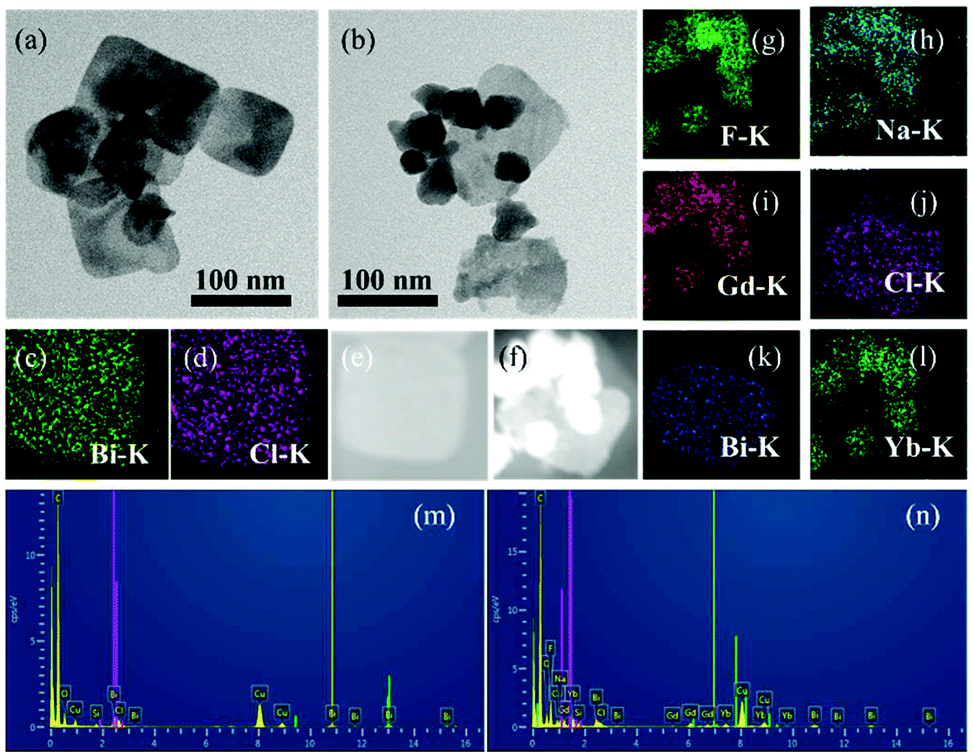 | ||
| Fig. 1 Characterization of the multi-modal agent BiNS nanomaterials. TEM images of BiNS (a) and BiNS@NaLnF4 (b), displaying their morphologies and microstructures. The map scanning images for BiNS (c)–(d) and BiNS@NaLnF4 (f)–(l) suggest the elemental compositions of the as-prepared samples. EDS images of BiNS (m) and BiNS@NaLnF4 (n), respectively. | ||
The size distributions of BiNPs@NaLnF4 were analyzed via SEM (Fig. S3(a)†), and the hydrodynamic scales of BiNPs@NaLnF4 with different solution environments were measured by DLS at room temperature, respectively (Fig. S3(b) and (c)†); the results showed comparatively homogenous dispersions in DI and PBS. Likewise, the hydrodynamic distributions of BiNS@NaLnF4 were analyzed via DLS (Fig. 2(a) and (b)), which showed stationary dispersions in DI and PBS and a more uniform and stable outcome than BiNPs@NaLnF4, which derives from the small scale.
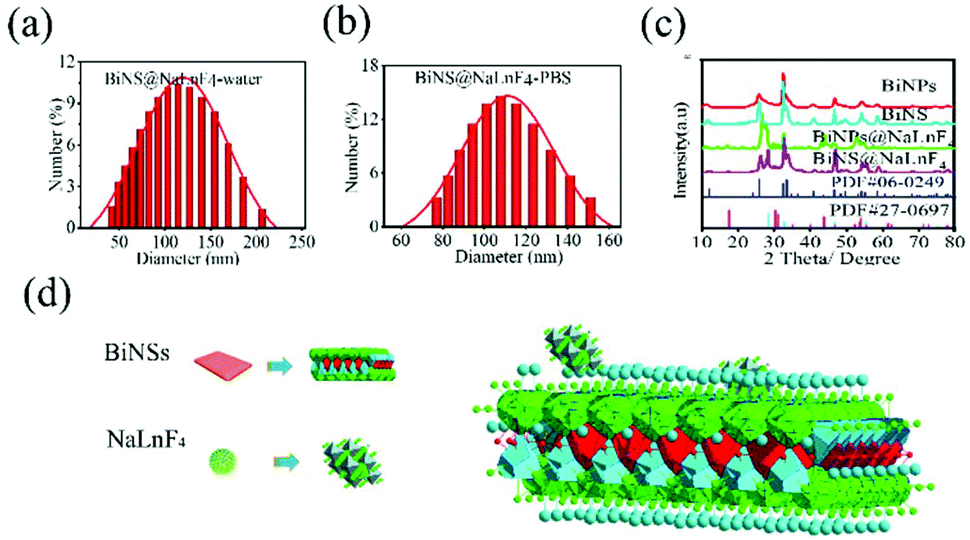 | ||
| Fig. 2 Particle sizes and phase statistics of the products. (a)–(b) The homogenous hydrodynamic diameters of BiNS@NaLnF4 considered in different solutions. (c) The XRD patterns of BiNPs@NaLnF4 and BiNS@NaLnF4, respectively, showing the surface co-doped with NaLnF4 and a pure phase. (d) Schematic of the nanoparticles based on the XRD patterns. | ||
The XRD spectra of BiNPs@NalnF4 and BiNS@NalnF4 are respectively shown in Fig. 2(c). All the peaks could be well matched with the standard BiOCl (PDF 06-0249). The XRD patterns of the nanoscale BiNPs and BiNS revealed that the samples obtained from the solvothermal reaction were tetragonal phase-pure and could be readily indexed in the space group P4/nmm (no. 129). The BiNPs and BiNS have the same physical structures; the standard structures indicate that BiOCl is similar to BiOI.50 Therefore, the atomic parameters of the BiOCl structure can be used as the initial parameters in the standard crystal card using Diamond software, and the refinement fitting image is shown in Fig. S4.† The final crystal structure obtained from PDF 06-0249 had parameters of a = 3.891(1) Å, c = 7.369(1) Å, V = 111.57(3) Å3, density (c) = 7.752 and density (m) = 7.717. The structure of BiOCl can be considered to consist of layers of BiOCl perpendicular to the c direction, as shown in Fig. S5.† Within each BiOCl layer, there are five alternating Cl–Bi–O–Bi–Cl sublayers (Fig. S5(a)†). The O layer is situated at the center of the double Bi sandwich. The sandwich-like Bi layer is supported by an O layer from the bottom and coated with a Cl layer on the top (Fig. S5(b)†). The coordination information of the Bi ion was given, where each Bi atom is eight-coordinated and bound by four O atoms in a tetragonal base and four I atoms in a tetragonal cap to form a tetragonal antiprism (Fig. S5(c)†). The atomic bond lengths, bond angles and geometric parameters are summarized in Tables S1 and S2,† and the corresponding lattice distance information from XRD data is consistent with PDF #06-0249 (Table S3†). Furthermore, the calculated crystal lattice distances from BiNS@NaLnF4 are considered in Table S4,† showing no significant impact on the sizes of the grain gaps. The atomic layer structure of NaLnF4 can be viewed in Fig. S6† according to cubic phase NaGdF4 in the PDF cards: a = b = c = 5.518(1) Å, V = 168.01 Å3, density (c) = 5.064 and density (m) = 5.52 Å, which can be readily indexed to the space group Fm![[3 with combining macron]](https://www.rsc.org/images/entities/char_0033_0304.gif) m (no. 225). The corresponding structural model of BiNS@NaLnF4 is shown in Fig. 2(e).
m (no. 225). The corresponding structural model of BiNS@NaLnF4 is shown in Fig. 2(e).
Good water solubility and biocompatibility are essential requirements that can be obtained using PVP. Hence, PVP was used to decorate the products, and FT-IR spectra were employed to identify the successful modification of PVP on the surface of the BiNS, as shown in Fig. 3(a). There are strong absorption peaks of C![[double bond, length as m-dash]](https://www.rsc.org/images/entities/char_e001.gif) O at 1627 cm−1 for BiNS@NaLnF4, and another absorption peak of C–C appeared at 1293 cm−1. The black line in the FT-IR image is due to pure PVP, and the above results demonstrate the successful coating of PVP on the surface of the BiNS. Above all, BiNS@NaLnF4 with outstanding structural characteristics was employed to investigate its bio-medical applications.
O at 1627 cm−1 for BiNS@NaLnF4, and another absorption peak of C–C appeared at 1293 cm−1. The black line in the FT-IR image is due to pure PVP, and the above results demonstrate the successful coating of PVP on the surface of the BiNS. Above all, BiNS@NaLnF4 with outstanding structural characteristics was employed to investigate its bio-medical applications.
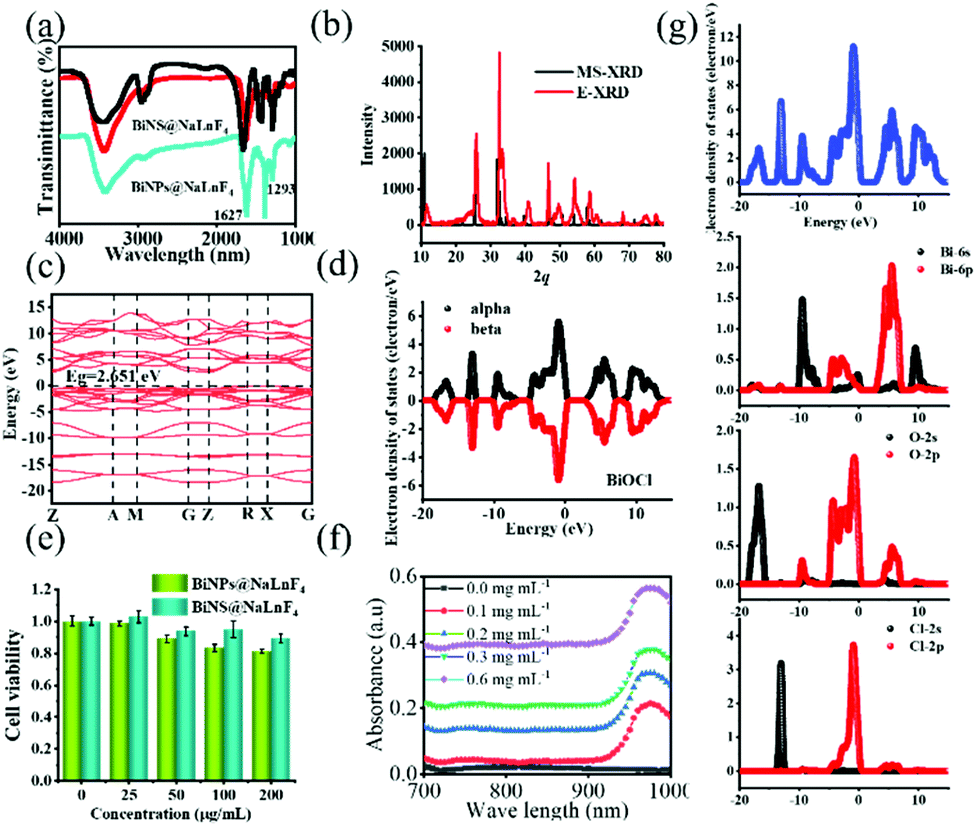 | ||
| Fig. 3 (a) The FTIR spectra of BiNPs@NaLnF4 and BiNS@NaLnF4, indicating the successful conjugation of PVP on the surfaces of the samples. (b) MS simulation of BiNS according to the XRD patterns, indicating a good match. (c) DFT simulations of the band structure, demonstrating that BiNS is an indirect semiconductor (corresponding Eg = 2.651 eV). (d) The total density of states (TDOS). (e) The cell viability ratios of the products at different concentrations (0, 25, 50, 100 and 200 μg mL−1). HeLa cells were incubated in medium with different concentrations of products for 24 h, and the cell viability was then evaluated by the MTT assay, suggesting low cytotoxicity at suitable concentrations. (f) The UV-vis spectra of BiNS@NaLnF4 products at different concentrations (0, 100, 200, 300 and 600 μg mL−1) showing the characteristic absorption peak at ∼975 nm. (g) Analysis of the different distributions of elements for the DOS. | ||
A good valence band structure is beneficial to the utilization of photons; excellent optical properties can be highlighted. Indirectly, the band structures and electronic densities of states for BiNS were further investigated by DFT simulations. In Fig. 3(b), the simulated XRD spectrum (MS-XRD) and experimental XRD spectrum (E-XRD) are displayed; the theoretical results match with the experiments, and a slight displacement may be influenced by the surface-coated PVP. The electronic band structure of BiNS is presented in Fig. 3(c); it can be seen from the electronic band structure of BiNS that the conduction band minimum (CBM) is at the R point, the valence band maximum (VBM) is at the Z–R connection, and the Fermi level is located between the VBM and CBM, indicating that BiNS is an indirect semiconductor. The band gap energy (Eg = CBM − VBM) is close to 2.651 eV; a small Eg can enable strong absorption of visible light to induce the generation of free radical species, which is significant.51,52Fig. 3(d) shows the symmetric electron state density spectrum; the electron density is concentrated around the Fermi level, demonstrating that a large section of carriers can be obtained. Further, the contributions of different atomic state densities were considered (Fig. 3(g)), and the electron density distribution of BiNS indicates that the electron density around the O in BiNS is greater than that around Bi and Cl (Fig. S7(a)†); this result is consistent with a previous report.52 Within the energy range of −20 eV to −10 eV, the Cl-2s and O-2s orbitals contribute the main share, while the O-2p and Cl-2p orbitals contribute the main share in the range of −10 eV–0 eV. Similarly, the DFT simulations for NaGdF4 are shown in Fig. S7.† The band structure of NaGdF4 is displayed in Fig. S7(b);† the result demonstrates that in the conductor characterization, the VBM and CBM overlap, and the metal properties are more conducive to carrier transfer. The total DOS of NaGdF4 and the partial DOS are given in Fig. S7(c) and (d),† respectively. The main electronic distribution of Gd is at 0 eV–8 eV, and F atom contributes the most to the share at −32 eV–0 eV.
The stabilities of BiNPs@NaLnF4 and BiNS@NaLnF4 were further estimated by DLS in different environments; the as-prepared products were dispersed in DI and PBS. As shown in Fig. S8,† the aqueous solution of BiNS@NaLnF4 was placed at room temperature, and the size distributions were monitored over 5 h. The results showed that the distribution of BiNS@NaLnF4 was more stable than that of BiNPs@NaLnF4 for the different environments in the time range of 5 h. Furthermore, the long-term stability of the distribution of BiNS@NaLnF4 was determined by DLS (Fig. S8†) for 12 days; the results demonstrated long-term stability and good dispersion.
Biocompatibility is a significant factor in determining whether BiNS@NaLnF4 can be used as candidate for in vivo bio-imaging. As shown in Fig. 3(e), the survival viability of HeLa cells was higher than 80% even at the high concentration of 200 μg mL−1 after BiNS@NaLnF4 was added for 24 h. The results suggest the good cytocompatibility of BiNS@NaLnF4.
The photothermal conversion efficiency (η) was determined in this work according to the equation given previously. As seen in Fig. 3(f), the UV-Vis-NIR spectra of BiNS@NaLnF4 in the NIR region and different concentrations (0, 100, 200, 300 and 600 μg mL−1) were obtained, and the effective absorption peak at ∼975 nm can be observed. An extensive absorption spectrum over the UV range is shown in Fig. S9,† indicating the absorption of UV light, and the full spectrum scan is displayed in Fig. S10.† All the peak spectra demonstrated good absorption from the UV to the NIR regions for the as-prepared products. The UV-Vis-NIR spectra of DI and BiNS are shown in Fig. S11;† the BiNS have a wide absorption spectrum. A 980 nm absorption peak of DI is observed, which is consistent with previous reports.53 Although the DI 980 nm absorption is strong, whether BiNS@NaLnF4 can provide photothermal conversion at 980 nm remains to be investigated.
Good photonic thermal conversion efficiency is the basis of good therapeutic effects. To detect whether a high photothermal conversion phenomenon occurred at 980 nm laser irradiation, photothermal imaging (PTI) was performed, as shown in Fig. 4. Different concentrations of products exhibited good photothermal results, as shown in Fig. 4(a). The dramatically rapid increase of temperature over the laser irradiation time at 980 nm with 1.17 W cm−2 for different concentrations can be observed in Fig. 4(b). A stable temperature was obtained within four minutes, and the temperature changes are shown in Fig. 4(e) for different concentrations; the maximum temperature change is approximately 35.7 °C, and the temperature change of DI is approximately 3.6 °C.
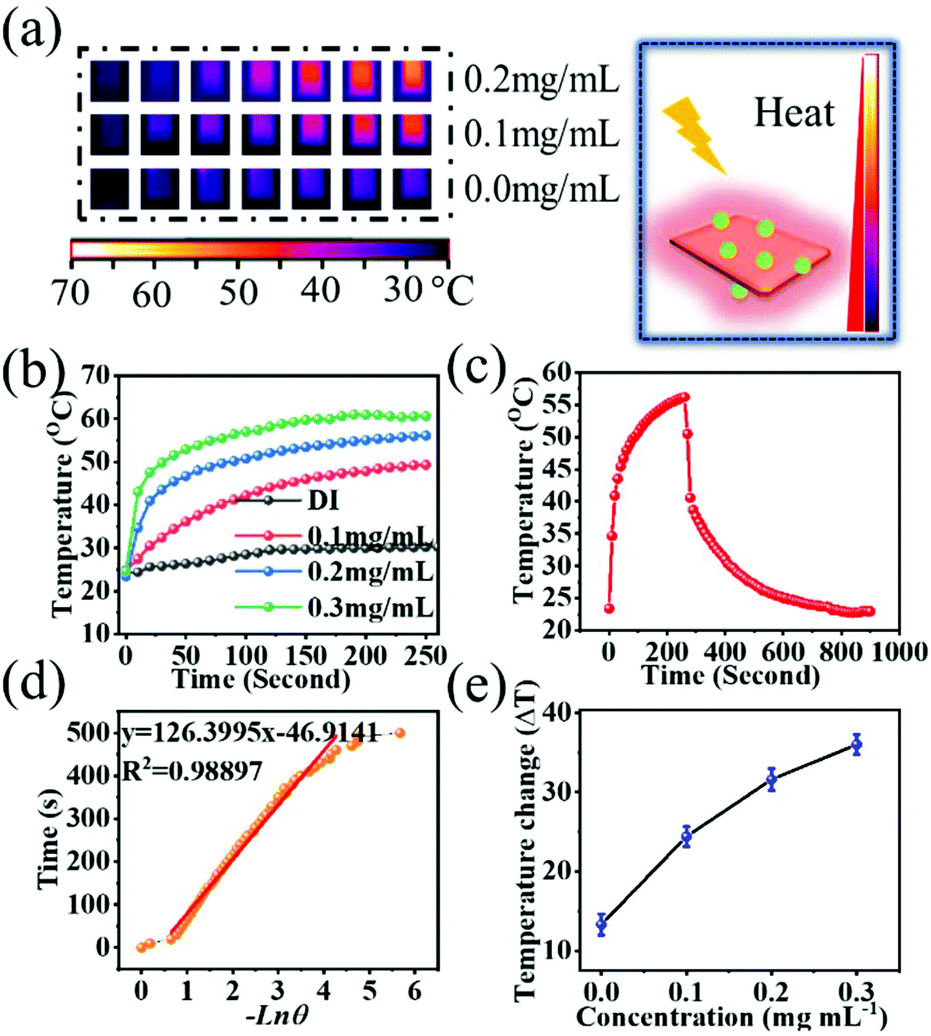 | ||
| Fig. 4 Photothermal conversion characterization. (a) Infrared thermal images of different concentrations under 980 nm laser irradiation at 1.17 W cm−2, suggesting a good photothermal effect. (b) Temperature increases of BiNS@NaLnF4 at varying solution concentrations under laser irradiation (980 nm, 1.17 W cm−2) as a function of time (0–240 s). (c) Time-stable stage of BiNS@NaLnF4 aqueous solution irradiated with a 980 nm laser; the laser was turned off after 240 s irradiation. (d) The time constant of the temperature fitting function was obtained by calculating the time stage versus −Lnθ. (e) The temperature changes obtained at the maximum steady state temperature. | ||
The time constant for the photo-changed heat transfer efficiency of this system can be acquired by applying the linear time data versus Lnθ from the cooling stage (Fig. 4(c) and (d)). The details of the calculation are displayed in the ESI.† According to the above equation, the η value of BiNS@NaLnF4 was calculated to be approximately 35.3%, which is good compared to those of nanoparticles in some previous reports48,49,54,55 and better than those in other reports.55,56 The corresponding temperature changes for different concentrations under irradiation with a 980 nm laser at 0.49 W cm−2 are given in Fig. S12.† A small temperature change was observed for a lower concentration (0.1 mg mL−1) under 980 nm laser irradiation with 0.49 W cm−2, and a higher concentration could be applied to achieve a good heating effect. A good temperature change of 13.5 °C can be detected even under irradiation at a lower power density of 0.49 W cm−2. As shown in Fig. S13,† BiNS@NaLnF4 retains good photothermal conversion sensibility and stability after three on/off cycles of NIR laser irradiation. Higher power density laser irradiation can achieve a good temperature change at the same concentration of 0.2 mg mL−1, which showed a dramatic temperature change (Fig. S14†). The UV-Vis-NIR spectrum of BiNS@NaLnF4 remained homogenous before and after 980 nm laser irradiation (Fig. S15†), showing that laser irradiation has little influence on the UV-vis spectrum.
The absorption coefficient of bismuth inspired us to apply it in bioimaging. To ensure the contrast function of BiNS@NaLnF4, the CT signal values were measured in vitro, and commercial Ioversol was used as a comparison (Fig. 5). Fig. 5(a) and (b) show the CT phantoms of BiNS@NaLnF4 and Ioversol at different concentrations. The phantom signals became stronger with increasing concentration of BiNS@NaLnF4, and the slopes from the linear fits of BiNS@NaLnF4 and Ioversol were 32.918 and 30.044, respectively. These results illustrate that the CT imaging effects of BiNS@NaLnF4 are much better than those of commercial Ioversol at the same concentration (as shown in Fig. 5(c)). In other words, to generate the same imaging effects as Ioversol, the dose of the BiNS@NaLnF4 contrast agent can be lower. The fitting data with different concentrations are given in Table S5.† To further ensure the CT application of the contrast agent in vivo, bio-imaging strategies were performed using CT. As shown in Fig. 5(d), a good contrast effect is clearly displayed; aggregation in the liver and spleen can be viewed for BiNS@NaLnF4, and enrichment in the kidneys for Ioversol is given. These results are consistent with previous literature reports.7,55
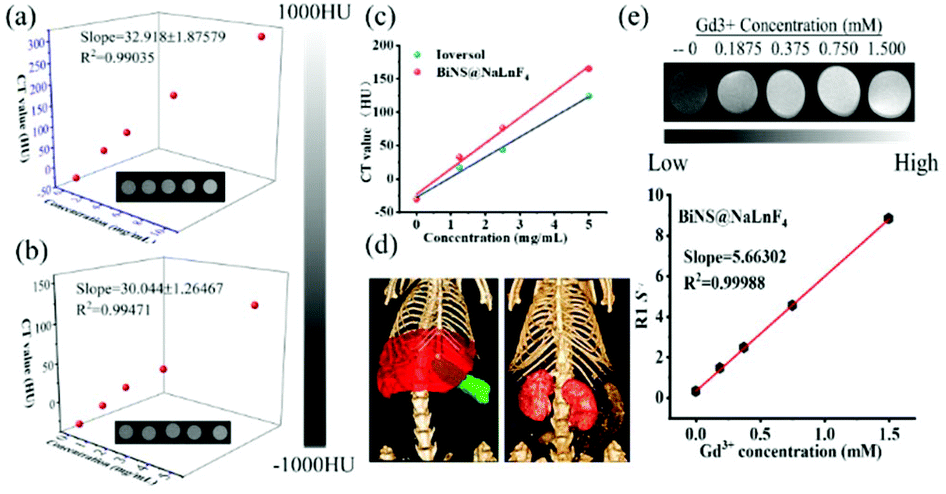 | ||
| Fig. 5 Dynamic X-ray CT/MR imaging. (a) CT concentration-dependent (0, 1.25, 2.5, 5.0, 10 mg mL−1) phantom images for BiNS@NaLnF4 and (b) CT concentration-dependent (0, 0.625, 1.25, 2.5, 5.0 mg mL−1) phantom images for the commercial contrast agent Ioversol. (c) The fitting curves of the contrast agents at corresponding concentrations. The contrast effect of BiNS@NaLnF4 was better than that of Ioversol. (d) In vivo CT images of BiNS@NaLnF4 and Ioversol after injection via tail vein. (e) Relative MR imaging of BiNS@NaLnF4in vitro. Top: T1-Weighted phantom images of BiNS@NaLnF4. Bottom: The fitting curve for the relativities R1. | ||
Because BiNS@NaLnF4 contains the lanthanide element Gd, nuclear MRI ability was expected. The MRI image signal and relaxation of BiNS@NaLnF4 in Fig. 5(e) show that BiNS@NaLnF4 had good T1-weighted relaxation. The increasing signal response is consistent with the rising Gd3+ concentration, which can play a good role in MRI, and the slope is approximately 5.66305 mM−1 s−1. The corresponding relaxation parameter R1 (Table S6†) and relaxation time T1 are given in Table S7 and Fig. S16,† respectively. A higher BiNS@NaLnF4 concentration resulted in a shorter MRI T1 relaxation time. In Fig. S17(a),† 2D CT images are displayed with or without injection of BiNS@NaLnF4. A dramatically enhanced signal can be viewed in the red circle location, and the signal-to-noise ratio (SNR) expressed an enhanced effect; these advantages resulted in good tumor imaging. In addition, enhanced gastrointestinal imaging function was demonstrated; in Fig. S17(b),† the visualized gastrointestinal outline can be observed, indicating a diagnostic approach for gastrointestinal diseases.
Meanwhile, the photoelectric effect, Compton scattering and electron pair effects generate electrons to produce ROS, which can cause cell damage issues. Thus, X-ray sensitization therapy was suggested, and BiNS@NaLnF4 was investigated to present a comprehensive mechanism of the theoretically enhanced free radical therapy. Because of the particular band structure of the BiNS (the conduction band and valence band generation), the BiNS have a natural advantage in the generation of nonoxygen-dependent free radicals. For instance, BiNS can generate a free electron (e−) and a positive hole (h+) to catalyze the production of ˙OH from H2O or hydrogen peroxide (H2O2), and it can also manufacture O2− after X-ray irradiation. However, electron–hole pairs can be recombined, limiting the generation of ˙OH and O2− and resulting in less efficient generation of free radicals during application. As shown in Fig. 6, when the BiNS and the impurity-coated NaLnF4 come into contact, the free electrons from BiNS will transfer to the surface of NaLnF4 to form an interactional interface. The result is a new interface for the functional generation of free radicals to achieve a good radical environment. This process will improve the therapeutic effects; also, the utilization of electrons and holes was fully demonstrated after X-ray induction and was comparable to that of single BiNS. Theoretically, BiNS@NaLnF4 is a potential agent for enhancing X-ray induced therapy.
 | ||
| Fig. 6 Catalytic performance studies of BiNS@NaLnF4. A naturally enhanced irradiation mechanism for the enhanced generation of free radicals via an X-ray-induced catalytic process based on the heterostructures of BiNS@NaLnF4. | ||
Free electrons and holes with great activity can be introduced for bismuth-based materials under light irradiation; ROS will be generated because the electrons/holes interact with H2O. Bismuth-based products with good photocatalytic properties will achieve good therapeutic anti-tumor effects. In order to investigate the photocatalytic properties of the obtained BiNS and BiNS@NaLnF4 by generating radical species, a traditional organic pollutant, MO, which is widely applied in industry, was selected to verify the formation of free radicals. As shown in Fig. 7, MO could be rapidly degraded at different concentrations and under visible-light irradiation within 60 min using BiNS and BiNS@NaLnF4, respectively. The UV-vis absorption spectra of MO treated with different concentrations of samples and 60 min irradiation with visible light can be observed in Fig. 7(a) and (b); the degradation process of MO was obvious for BiNS (Fig. 7(a)) and BiNS@NaLnF4 (Fig. 7(b)), but no significant changes were observed under dark treatment. In addition, the absorbance of MO at 455 nm after degradation is displayed in Fig. 7(c); the reaction kinetics of BiNS and BiNS@NaLnF4 were studied (Fig. 7(d)) using the equation (C0/C), where C0 and C are the starting MO concentration and tested MO concentration under visible light irradiation, respectively. BiNS@NaLnF4 has a better degradation ratio (C0/C) compared with BiNS at the same amount of BiNS. To further study the improvement of photogenerated electron–hole pairs, the degradation of MO for different times at concentrations of 5 mg mL−1 BiNS and BiNS@NaLnF4 was performed under a light source. The results shown in Fig. S18† indirectly testify that BiNS@NaLnF4 can generate more photogenerated electron/hole pairs. The possible experimental mechanism was proposed in previous literature. As shown in Fig. S19,† the formation of a heterojunction structure between BiNS and NaLNF4 leads to improved catalytic activity, as observed by increasing the separation efficiency of holes and electrons.57–59
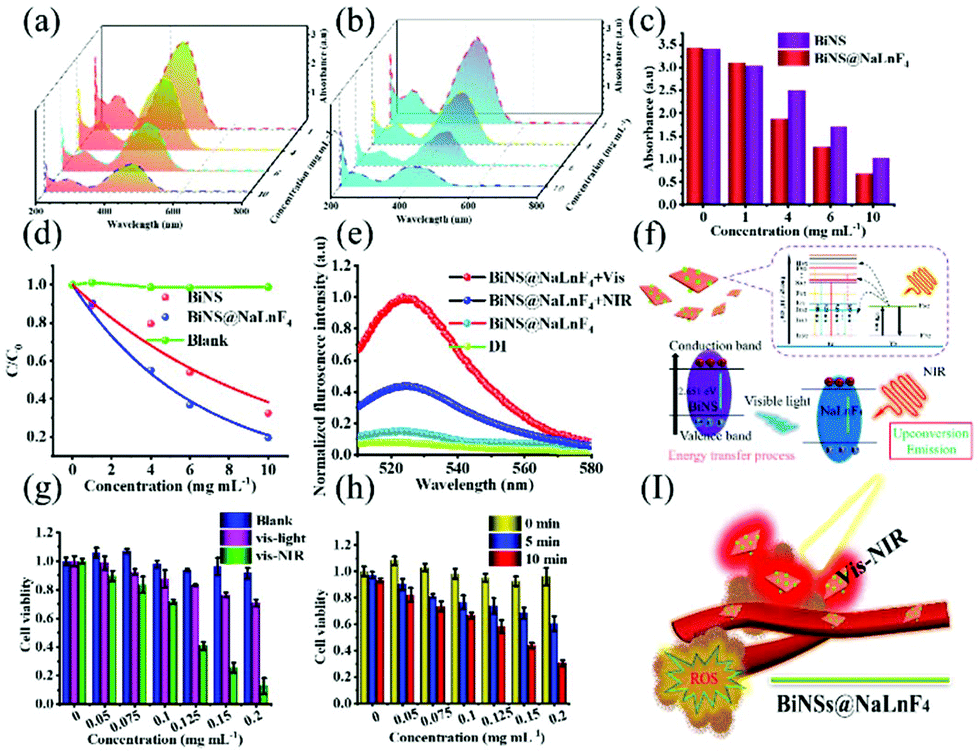 | ||
| Fig. 7 Photocatalytic degradation of MO using BiNS (a) and BiNS@NaLnF4 (b). (c) The absorbance of MO using different concentrations of catalytic products (1, 4, 6 and 10 mg mL−1) after 60 min visible light irradiation. (d) The plots of C0/C at different irradiation concentrations for the BiNS and BiNS@NaLnF4 samples under visible light irradiation. (e) The fluorescence spectra of DCF aqueous solution before and after irradiation using DCFH-DA as a ROS probe. (f) Schematic of the photocatalytic process based on upconversion after NIR irradiation. (g) The cell survival rates of ECA109 incubated with different conditions under visible or vis-NIR light for 10 min. (h) Cell viabilities of ECA109 with different concentrations of BiNS@NaLnF4 after different irradiation times. (I) Schematic in vivo synergetic model using nanoparticles as the therapeutic agent. | ||
Furthermore, to simulate the tumor cell micro-environment, H2O2 was introduced into this process. The pH was adjusted to 5, different concentrations were added to MO before visible light was introduced, and the UV-vis spectra were recorded (Fig. S20†). Unquestionably, free radicals were produced at a low pH level under vis-light irradiation. Interestingly, a good degradation ratio can be viewed at a low pH level, comparable to that at a neutral level; as a result, h+ changes H2O2 to ˙OH, and the degradation ratio is enhanced.
The ROS generation was directly investigated using the ROS probe dichloro-fluorescein diacetate (DCFH-DA) because it can be oxidized by ROS irreversibly to form 2′,7′-dichlorofluorescein (DCF) with an emission peak at 520–540 nm with strong green fluorescence. As shown in Fig. 7(e), the emission peak at 520–540 nm indicates the production of ROS from the as-prepared BiNS@NaLnF4. Especially, up-conversion luminescence-stimulated ROS estimation was studied due to the phenomenon of up-conversion luminescence with visible light emission. As shown in Fig. 7(e), the generation of ROS is ensured after 980 nm NIR irradiation with a synergistic PDT effect from the visible to the NIR region, which is significant for PDT. A mechanism analysis is considered in Fig. 7(f); the anti-Stokes shift results in the emission of visible light after NIR laser irradiation, and the light interacts with the BiNS to generate ROS.
Meanwhile, to verify the synergy of PDT and PTT, the cell survival abilities were performed. As shown in Fig. 7(g), the cell death rates rose with increasing concentration of the samples under vis-light or vis-NIR irradiation; the collaboration effect of PTT/PDT can be obviously observed after vis-NIR irradiation, resulting in a synergistic enhanced mechanism. The time-dependent process is shown in Fig. 7(h); the cell viabilities of ECA109 declined with increasing laser irradiation time at the same concentrations, suggesting the enhanced effect of PTT after a long irradiation time. A synergetic in vivo model is displayed in Fig. 7(i) using nanoparticles as the therapeutic agents.
Photothermal therapeutic experiments were performed. Briefly, Calcein-AM with green emission and propidium (PI) with red emission under laser irradiation were employed to stain living and dead ECA109 cells, respectively. As shown in Fig. 8(a), the confocal images of cells in the PBS, PBS + NIR laser and BiNS@NaLnF4 groups showed strong green fluorescence, implying that neither the NIR laser nor BiNS@NaLnF4 alone greatly damage cells. In contrast, in the BiNS@NaLnF4 combined with laser irradiation group, the strong red fluorescence implies that cell death occurred; it is obvious that NIR laser irradiation induced PTT.
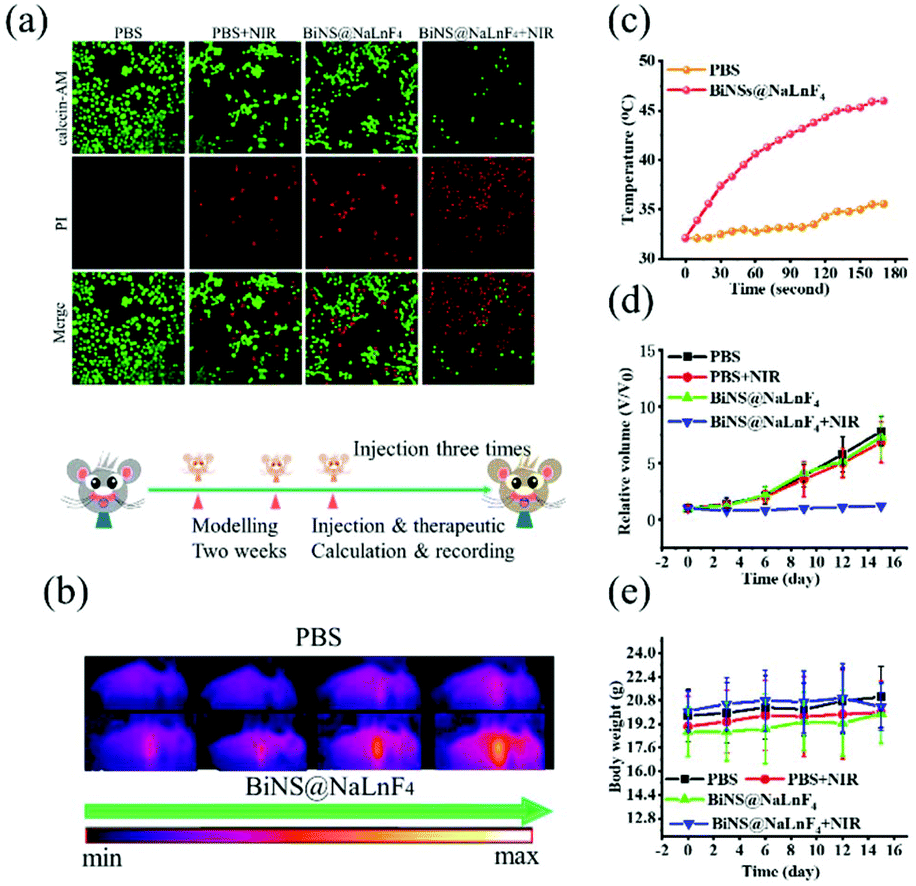 | ||
| Fig. 8 (a) In vitro PTT confocal images of ECA109 cells treated with PBS and BiNS@NaLnF4 with or without NIR irradiation. (b) NIR thermal images of ECA109 tumor-bearing mice with BiNS@NaLnF4 injection and PBS injection. (c) The average temperature changes at the tumor sites of the mice after laser irradiation of the region of interest in (b). (d) The evolution of the relative tumor volumes after different treatment processes and times. (e) The evaluation of the body weights of the tumor-bearing mice after different treatments. | ||
The therapeutic effect was further evaluated in ECA109 tumor-bearing BALB/C mice in in vivo experiments because of the above encouraging results in vitro. The photothermal imaging was performed after intratumoral injection; irradiation with a 980 nm laser with a power density of 1.17 W cm−2 was performed for 3 min. As shown in Fig. 8(b), the temperature of the tumor region increased with increasing irradiation time upon injection of BiNS@NaLnF4 for thermal imaging in vivo, and a small temperature increase was observed in the PBS group. The temperature changes in the tumor regions are recorded in Fig. 8(c), in which an obvious increase of temperature can be observed after treatment with BiNS@NaLnF4 under laser irradiation. Finally, a NIR laser irradiation experiment was performed in vivo to verify the validity of the investigations. As shown in Fig. 8(d), the relative volumes of the tumors were recorded; the growth of the tumors was inhibited effectively after injection of BiNS@NaLnF4 with laser irradiation compared with PBS or BiNS@NaLnF4 alone without laser irradiation. The body weights of the mice in different groups are recorded in Fig. 8(e); the weight changes of the mice were small in each experimental group during treatment, demonstrating good biosafety of BiNS@NaLnF4 at this injection dose.
The long-term biosafety (2 weeks) was further evaluated after tail vein injection of BiNS@NaLnF4 (50 mg kg−1) in vivo; little change in the organization structures was observed in the major tissues of the sample-treated mice, including the heart, liver, spleen, lung and kidney tissue (Fig. 9). These results indicate that BiNS@NaLnF4 had no obvious toxicity at the dose of 50 mg kg−1in vivo; the mice exhibited similar structures and morphologies compared to those from the control group, suggesting good biocompatibility of the nanomaterial with potential application in medical fields.
 | ||
| Fig. 9 H&E-stained images of major organs from mice in the control group (PBS) and treatment group (BiNS@NaLnF4) after two weeks. | ||
Interestingly, the controlled morphology and scale is significant, and optimized structures can demonstrate great photonic performance. To provide a wide range of interest in the synthesis of nanoscale BiOCl (BiNPs), different volumes of HNO3 were introduced to create BiNPs, including BiNPs-5 (5 mL HNO3) and BiNPs-10 (10 mL HNO3). A good morphology was fabricated (Fig. S21†), displaying a uniform size distribution. Dramatically, the sizes of the BiNPs changed tremendously because of the introduction of excess H+. The corresponding crystal structures and photoabsorption properties are considered in Fig. S22;† the crystalline phase was almost perfect, but significant phase changes occurred for BiNPs-10, indicating that H+ regulated the particle size while guiding phase changes. Good absorption is evident from the UV to the NIR regions, indicating excellent photon utilization characteristics.
Multi-modal imaging with theranostic functions can provide detailed information on different tissues after combining the advantages of single imaging modes, decreasing the drawbacks of the diagnostic process. A multi-functional contrast agent is needed for multi-modal imaging and therapeutic function. The good properties of the nanomaterials were suitable to explore their application as multifunctional contrast agents. Although we have sufficient confidence that BiNS@NaLnF4 provided encouraging results in the experiments, there are still some insufficiencies in our study that need continued exploration. Lanthanide elements are often used in up-conversion luminescence imaging (UCL);60–64 the lanthanide-doped materials can achieve UCL in this work. The gadolinium nuclide has a large neutron capture cross-section of approximately 255000 barns during thermal neutron interaction (this value is more than 66 times larger than that of boron) and emits γ-rays with a high energy of 7.8 MeV during neutron capture absorption; this is associated with low-energy electrons, which damaged cells in previous reports.65,66 Enhanced irradiation therapy or novel neutron therapy with BiNS@NaLnF4 can be studied further in future work because of its good potential applications. Multi-modal imaging guided therapeutic strategies are of significant interest for the development of advanced nanotechnologies with wide application; thus, the continuous improvement of theranostic candidates must be investigated.
Conclusions
In summary, the ultrathin heterostructure BiNS@NaLnF4 was synthesized via a simple solvothermal protocol. BiNS@NaLnF4 was used in in vitro and in vivo imaging as a CT contrast agent and exhibited more favorable effects than commercial Ioversol. In particular, BiNS@NaLnF4 can be applied to photothermal conversion with encouraging results; it showed a high photothermal conversion efficiency of 35.3%. Additionally, BiNS@NaLnF4 displayed outstanding T1-weighted efficiency as an in vitro contrast agent for MRI. Theoretically, BiNS@NaLnF4 can have both X-ray enhanced therapy (XET) and neutron capture therapy (NCT) functions. Good visible-light and NIR synergistic irradiation to induce the generation of enhanced ROS was achieved; the heterostructure BiNPs@NaLnF4 further increased the utilization of electrons/holes, enhancing the generation of ROS. Due to the synergistic effect of PTT and PDT, BiNS@NaLnF4 reveals enhanced anti-tumor efficacy. Above all, these results indicate that BiNS@NaLnF4 is a potential candidate for theranostics in bio-application fields. This work conveys a method to achieve multi-modal imaging and will effectively play a role in improving multi-functional therapy research in preclinical explorations. This provides an effective research approach for the integration of diagnosis and treatment.Ethical statement
All experiments were performed in compliance with relevant laws or guidelines.All experiments followed institutional guidelines.
All animal procedures were performed in accordance with the Guidelines for Care and Use of Laboratory Animals of Xiamen University and approved by the Animal Ethics Committee of Xiamen University.
Conflicts of interest
The authors declare that there are no conflicts of interest.Acknowledgements
This work was supported financially by the National Natural Science Foundation of China, through Grant No. U1967211, 11975191 and U1832112.Notes and references
- Y. Cai, Y. Wang, H. Xu, C. Cao, R. Zhu, X. Tang, T. Zhang and Y. Pan, Nanoscale, 2019, 11, 2644–2654 RSC.
- Y. Li, S. Zeng and J. Hao, ACS Nano, 2019, 13, 248–259 CrossRef CAS PubMed.
- S. H. Xue, Y. Wang, M. X. Wang, L. Zhang, X. X. Du, H. C. Gu and C. F. Zhang, Int. J. Nanomed., 2014, 9, 2527–2538 Search PubMed.
- R. Meir, K. Shamalov, O. Betzer, M. Motiei, M. Horovitz-Fried, R. Yehuda, A. Popovtzer, R. Popovtzer and C. J. Cohen, ACS Nano, 2015, 9, 6363–6372 CrossRef CAS PubMed.
- M. L. James and S. S. Gambhir, Physiol. Rev., 2012, 92, 897–965 CrossRef CAS PubMed.
- Z. Y. Shen, T. X. Chen, X. H. Ma, W. Z. Ren, Z. J. Zhou, G. Z. Zhu, A. Zhang, Y. J. Liu, J. B. Song, Z. H. Li, H. M. Ruan, W. P. Fan, L. S. Lin, J. Munasinghe, X. Y. Chen and A. G. Wu, ACS Nano, 2017, 11, 10992–11004 CrossRef CAS PubMed.
- S. Ma, J. Zhang, S. Xia, W. Yin, Y. Qin, R. Lei, J. Kong, L. Mei, J. Li, G. Xin and G. Li, Nanoscale, 2018, 10, 13402–13409 RSC.
- Y. Li, N. Wang, X. Huang, F. Li, T. P. Davis, R. Qiao and D. Ling, ACS Appl. Bio Mater., 2019, 3(1), 121–142 CrossRef.
- J. Wallyn, N. Anton, D. Mertz, S. Begin-Colin, F. Perton, C. A. Serra, F. Franconi, L. Lemaire, M. Chiper, H. Libouban, N. Messaddeq, H. Anton and T. F. Vandamme, ACS Appl. Mater. Interfaces, 2019, 11, 403–416 CrossRef CAS PubMed.
- N. Lee, S. H. Choi and T. Hyeon, Adv. Mater., 2013, 25, 2641–2660 CrossRef CAS PubMed.
- J. C. De La Vega and U. O. Hafeli, Contrast Media Mol. Imaging, 2015, 10, 81–95 CrossRef CAS PubMed.
- T. S. Nedaei and H. H. Delavari, ChemistrySelect, 2018, 3, 11098–11102 CrossRef.
- H. Dong, S. R. Du, X. Y. Zheng, G. M. Lyu, L. D. Sun, L. D. Li, P. Z. Zhang, C. Zhang and C. H. Yan, Chem. Rev., 2015, 115, 10725–10815 CrossRef CAS PubMed.
- S. Fu, Y. Ding, T. Cong, X. Yang, X. Hong, B. Yu, Y. Li and Y. Liu, Dalton Trans., 2019, 48, 12850–12857 RSC.
- Y. Jin, D. Ni, L. Gao, X. Meng, Y. Lv, F. Han, H. Zhang, Y. Liu, Z. Yao, X. Feng, W. Bu and J. Zhang, Adv. Funct. Mater., 2018, 28(33), 1802656 CrossRef.
- S. Zhao, R. Tian, B. Shao, Y. Feng, S. Yuan, L. Dong, L. Zhang, K. Liu, Z. Wang and H. You, ACS Appl. Mater. Interfaces, 2019, 11, 394–402 CrossRef CAS PubMed.
- Y. Zhong, Z. Ma, F. Wang, X. Wang, Y. Yang, Y. Liu, X. Zhao, J. Li, H. Du, M. Zhang, Q. Cui, S. Zhu, Q. Sun, H. Wan, Y. Tian, Q. Liu, W. Wang, K. C. Garcia and H. Dai, Nat. Biotechnol., 2019, 37(11), 1322–1331 CrossRef CAS PubMed.
- K. L. Ai, Y. L. Liu, J. H. Liu, Q. H. Yuan, Y. Y. He and L. H. Lu, Adv. Mater., 2011, 23, 4886–4891 CrossRef CAS PubMed.
- M. Berger, M. Bauser, T. Frenzel, C. S. Hilger, G. Jost, S. Lauria, B. Morgenstern, C. Neis, H. Pietsch, D. Sulzle and K. Hegetschweiler, Inorg. Chem., 2017, 56, 5757–5761 CrossRef CAS PubMed.
- P. Li, L. Liu, Q. Lu, S. Yang, L. Yang, Y. Cheng, Y. Wang, S. Wang, Y. Song, F. Tan and N. Li, ACS Appl. Mater. Interfaces, 2019, 11, 5771–5781 CrossRef CAS PubMed.
- K. Liu, X. Yan, Y. J. Xu, L. Dong, L. N. Hao, Y. H. Song, F. Li, Y. Su, Y. D. Wu, H. S. Qian, W. Tao, X. Z. Yang, W. Zhou and Y. Lu, Biomater. Sci., 2017, 5, 2403–2415 RSC.
- Y. L. Liu, K. L. Ai, J. H. Liu, Q. H. Yuan, Y. Y. He and L. H. Lu, Angew. Chem., Int. Ed., 2012, 51, 1437–1442 CrossRef CAS PubMed.
- C. Wang, W. Fan, Z. Zhang, Y. Wen, L. Xiong and X. Chen, Adv. Mater., 2019, e1904329, DOI:10.1002/adma.201904329.
- X. Y. Zheng, Y. J. Wang, L. D. Sun, N. X. Chen, L. D. Li, S. Shi, S. Malaisamy and C. H. Yan, Nano Res., 2016, 9, 1135–1147 CrossRef CAS.
- S. M. Zhou, D. K. Ma, S. H. Zhang, W. Wang, W. Chen, S. M. Huang and K. Yu, Nanoscale, 2016, 8, 1374–1382 RSC.
- H. Lusic and M. W. Grinstaff, Chem. Rev., 2013, 113, 1641–1666 CrossRef CAS PubMed.
- X. Wang, J. Wang, J. Pan, F. Zhao, D. Kan, R. Cheng, X. Zhang and S. K. Sun, ACS Appl. Mater. Interfaces, 2019, 11, 33650–33658 CrossRef CAS PubMed.
- C. Lu, P. Dong, L. Pi, Z. Wang, H. Yuan, H. Liang, D. Ma and K. Y. Chai, Langmuir, 2019, 35, 9474–9482 CrossRef CAS PubMed.
- E. Peng, F. Wang and J. M. Xue, J. Mater. Chem. B, 2015, 3, 2241–2276 RSC.
- W. Cai, Y. Zhang, J. Wang, Z. Wang, Y. Tian, H. Liu, H. Pan, L. Fu, W. Chen, C. Wu, X. Wang and G. Liu, Chem. Eng. J., 2020, 380, 122473 CrossRef CAS.
- Z. Zhou, L. Yang, J. Gao and X. Chen, Adv. Mater., 2019, 31, e1804567 CrossRef PubMed.
- I. Fernandez-Barahona, L. Gutierrez, S. Veintemillas-Verdaguer, J. Pellico, M. D. P. Morales, M. Catala, M. A. Del Pozo, J. Ruiz-Cabello and F. Herranz, ACS Omega, 2019, 4, 2719–2727 CrossRef CAS PubMed.
- G. Lalwani, J. L. Sundararaj, K. Schaefer, T. Button and B. Sitharaman, J. Mater. Chem. B, 2014, 2, 3519–3530 RSC.
- X. Lv, X. Wang, T. Li, C. Wei, Y. Tang, T. Yang, Q. Wang, X. Yang, H. Chen, J. Shen, H. Yang and H. Ke, Small, 2018, 14, e1802904 CrossRef PubMed.
- Y. Si, G. Zhang, D. Wang, C. Zhang, C. Yang, G. Bai, J. Qian, Q. Chen, Z. Zhang, Z. Wu, Y. Xu and D. Zou, Chem. Eng. J., 2019, 360, 289–298 CrossRef CAS.
- Y. Zang, L. Gong, L. Mei, Z. Gu and Q. Wang, ACS Appl. Mater. Interfaces, 2019, 11, 18942–18952 CrossRef CAS PubMed.
- R. Zhou, H. Wang, Y. Yang, C. Zhang, X. Dong, J. Du, L. Yan, G. Zhang, Z. Gu and Y. Zhao, Biomaterials, 2019, 189, 11–22 CrossRef CAS PubMed.
- C. Zhang, L. Yan, Z. Gu and Y. Zhao, Chem. Sci., 2019, 10, 6932–6943 RSC.
- K. Lv, H. Lin and F. Qu, Chem. Eng. J., 2020, 392, 124555 CrossRef CAS.
- H. Liu, Q. Yang, W. Guo, H. Lin, F. Zhang, J. Zhao, T. Ma, L. Zhao, N. Xu, R. Wang, J. Yu and F. Qu, Chem. Eng. J., 2020, 385, 123979 CrossRef.
- X. Wang, C. Zhang, J. Du, X. Dong, S. Jian, L. Yan, Z. Gu and Y. Zhao, ACS Nano, 2019, 13, 5947–5958 CrossRef CAS PubMed.
- X. Liu, H. Cao and J. Yin, Nano Res., 2011, 4, 470–482 CrossRef CAS.
- Y. Sun, Q. Tang, T. Tian and C. Kang, ChemistrySelect, 2019, 4, 9476–9482 CrossRef CAS.
- D. Wang, M. Tang, H. Jiang, M. Li, S. Jiang, L. Sun and J. Sun, Chem. Eng. J., 2020, 400, 125814 CrossRef CAS.
- X. Y. Ji, N. Kong, J. Q. Wang, W. L. Li, Y. L. Xiao, S. T. Gan, Y. Zhang, Y. J. Li, X. R. Song, Q. Q. Xiong, S. J. Shi, Z. J. Li, W. Tao, H. Zhang, L. Mei and J. J. Shi, Adv. Mater., 2018, 30(36), 1803031 CrossRef PubMed.
- C. L. Tan, L. Z. Zhao, P. Yu, Y. Huang, B. Chen, Z. C. Lai, X. Y. Qi, M. H. Goh, X. Zhang, S. K. Han, X. J. Wu, Z. Liu, Y. L. Zhao and H. Zhang, Angew. Chem., Int. Ed., 2017, 56, 7842–7846 CrossRef CAS PubMed.
- W. Tao, X. B. Zhu, X. H. Yu, X. W. Zeng, Q. L. Xiao, X. D. Zhang, X. Y. Ji, X. S. Wang, J. J. Shi, H. Zhang and L. Mei, Adv. Mater., 2017, 29(1), 1603276 CrossRef PubMed.
- W. Ren, Y. Yan, L. Zeng, Z. Shi, A. Gong, P. Schaaf, D. Wang, J. Zhao, B. Zou, H. Yu, G. Chen, E. M. Brown and A. Wu, Adv. Healthcare Mater., 2015, 4, 1526–1536 CrossRef CAS PubMed.
- Y. Liu, K. Ai, J. Liu, M. Deng, Y. He and L. Lu, Adv. Mater., 2013, 25, 1353–1359 CrossRef CAS PubMed.
- M. S. Kandanapitiye, M. Gao, J. Molter, C. A. Flask and S. D. Huang, Inorg. Chem., 2014, 53, 10189–10194 CrossRef CAS PubMed.
- J. Hou, D. Dai, R. Wei, X. Wu, X. Wang, M. Tahir and J.-J. Zou, ACS Sustainable Chem. Eng., 2019, 7, 16569–16576 CrossRef CAS.
- X. Ren, M. Gao, Y. Zhang, Z. Zhang, X. Cao, B. Wang and X. Wang, Appl. Catal., B, 2020, 274, 119063 CrossRef CAS.
- X. Xie, N. Gao, R. Deng, Q. Sun, Q. H. Xu and X. Liu, J. Am. Chem. Soc., 2013, 135, 12608–12611 CrossRef CAS PubMed.
- W. Yang, W. Guo, W. Le, G. Lv, F. Zhang, L. Shi, X. Wang, J. Wang, S. Wang, J. Chang and B. Zhang, ACS Nano, 2016, 10, 10245–10257 CrossRef CAS PubMed.
- L. Dong, P. Zhang, X. Liu, R. Deng, K. Du, J. Feng and H. Zhang, ACS Appl. Mater. Interfaces, 2019, 11, 7774–7781 CrossRef CAS PubMed.
- X. Liu, Q. Ren, F. Fu, R. Zou, Q. Wang, G. Xin, Z. Xiao, X. Huang, Q. Liu and J. Hu, Dalton Trans., 2015, 44, 10343–10351 RSC.
- X. Li, D. Chen, N. Li, Q. Xu, H. Li, J. He and J. Lu, Appl. Catal., B, 2018, 229, 155–162 CrossRef CAS.
- J. D. Xiao and H. L. Jiang, Acc. Chem. Res., 2019, 52, 356–366 CrossRef CAS PubMed.
- G. Zhang, D. Chen, N. Li, Q. Xu, H. Li, J. He and J. Lu, Appl. Catal., B, 2019, 250, 313–324 CrossRef CAS.
- S. He, N. J. J. Johnson, V. A. Nguyen Huu, E. Cory, Y. Huang, R. L. Sah, J. V. Jokerst and A. Almutairi, Nano Lett., 2017, 17, 4873–4880 CrossRef CAS PubMed.
- Y. X. Liu, L. Y. Li, Q. W. Guo, L. Wang, D. D. Liu, Z. W. Wei and J. Zhou, Theranostics, 2016, 6, 1491–1505 CrossRef CAS PubMed.
- F. Y. Liu, X. X. He, L. Liu, H. P. You, H. M. Zhang and Z. X. Wang, Biomaterials, 2013, 34, 5218–5225 CrossRef CAS PubMed.
- Y. Sun, X. J. Zhu, J. J. Peng and F. Y. Li, ACS Nano, 2013, 7, 11290–11300 CrossRef CAS PubMed.
- M. Wu, G. Guan, B. Yao, C.-P. Teng, S. Liu, S. Y. Tee, B. C. Ong, Z. Dong and M.-Y. Han, ACS Appl. Nano Mater., 2019, 2, 1421–1430 CrossRef CAS.
- M. J. Moghaddam, L. de Campo, M. Hirabayashi, P. A. Bean, L. J. Waddington, J. A. Scoble, G. Coia and C. J. Drummond, Biomater. Sci., 2014, 2, 924–935 RSC.
- P. Mi, H. Yanagie, N. Dewi, H. C. Yen, X. Liu, M. Suzuki, Y. Sakurai, K. Ono, H. Takahashi, H. Cabral, K. Kataoka and N. Nishiyama, J. Controlled Release, 2017, 254, 1–9 CrossRef CAS PubMed.
Footnote |
| † Electronic supplementary information (ESI) available. See DOI: 10.1039/d0nr07590f |
| This journal is © The Royal Society of Chemistry 2021 |