Crystal structure, photoluminescence and afterglow properties of red-emitting phosphors Ca4Nb2O9:Pr3+ for AC-LEDs
Pengfei
Zhang
ab,
Na
Li
a,
Zhiting
Wei
a,
Ziqi
Wang
a,
Mengwei
Gou
a,
Lei
Zhao
 *a,
Wenbo
Chen
*b and
Qinping
Qiang
b
aSchool of Physics and Opto-Electronic Technology, Collaborative Innovation Center of Rare-Earth Optical Functional Materials and Devices Development, Baoji University of Arts and Sciences, Baoji, Shaanxi 721016, P. R. China. E-mail: zhaoleibjwl@163.com
bEngineering Research Center of New Energy Storage Devices and Applications, Chongqing University of Arts and Sciences, Chongqing 402160, P. R. China. E-mail: qschenbo@sina.com
First published on 25th November 2020
Abstract
Alternating current light-emitting diodes (AC-LEDs) set up a new era of economic semiconductor-based lighting. However, the flicker of AC-LEDs in the AC cycles is unhealthy for human eyes. In this work, the red-emitting afterglow phosphor Ca4Nb2O9:Pr3+ was successfully synthesized via a traditional high temperature solid-state reaction method. The phase composition, photoluminescence spectra, afterglow curve, and thermoluminescence were investigated. It was revealed that the red emission (617 nm) is ascribed to the 3P0 → 3H6 transition of Pr3+ ions, and the afterglow time was in the second range after removal of the excitation source. In order to gain a deeper understanding of the origin of afterglow, a subsequent thermoluminescence analysis was performed and a relatively shallow trap within the host was found. These results indicated that Ca4Nb2O9:Pr3+ phosphors could compensate for the flickering behavior of AC-LEDs and may be a candidate for application in AC-LEDs.
1. Introduction
Due to their advantages such as convenience and high efficiency, white light-emitting diodes (LEDs) are in the stage of vigorous development, and are considered as alternatives to fluorescent lamps and incandescent lamps.1–3 At present, the leading products in the industrial market are direct current (DC) LEDs. It is worth noting that there is 30% power loss during the process of alternating current (AC) to DC transfer. In addition, a large amount of heat will be generated during the AC to DC transfer process, which will cause the packaging resin to turn yellow and the phosphor to be degraded.4 Recently, AC driven LED (AC-LED) systems have attracted much attention from the industry because of the possibility to overcome these disadvantages. Besides, AC-LEDs will produce a dark interval of 5–20 ms,5,6 and the dark duration phenomenon leads to an undesirable flicker effect that may cause visual fatigue and other symptoms in the human body.7 Therefore, an effective scheme is proposed to develop phosphors with short afterglow to compensate for the dark time and eliminate flicker.Afterglow luminescence is a phenomenon of light persistent emission after the excitation source is stopped, which has attracted large-scale research attention because of its wide application in anti-counterfeiting, night displays, in vivo bioimaging, optical storage and so on.8,9 However, the afterglow time of these phosphors is required to be much longer in some applications mentioned above. In contrast, little attention has been paid to short afterglow phosphors applied to AC-LEDs. There are two processes that need attention in the application of AC-LEDs: firstly, the optimal excitation wavelength should be adjusted to about 450 nm to match the commercial InGaN chip; secondly, the depth of the modulated trap should be shallow in order to detrap easily; thirdly, the carrier density in the shallow trap should not be too high, otherwise the afterglow time will be too long. In 2012, Yeh et al. first reported the afterglow phosphor SrSi2O2N2:Eu2+,Mn2+ and proposed to reduce flicker for AC-LEDs.6 Over the same year, a blue-light activated Gd2.98Al2Ga3O12:0.02Ce3+ yellow–green persistent phosphor was reported by Lin et al., with a decreased flicker rate from 100% to 69%.10 Particularly, Chen et al. reported a green phosphor SrAl2O4:Eu2+,Y3+ for AC-LEDs.11 However, SrAl2O4:Eu2+,Y3+ and most of the garnet phosphors emitted yellow or green light under blue light excitation and a white-colour-emitting afterglow had not yet been vigorously developed because of the difficulties associated with red-emitting afterglow phosphors.12–14 As far as we know, red-emitting afterglow phosphors, which have a millisecond afterglow time, used in AC-LEDs have not been much reported so far. Therefore, in this study, a novel AC-LED phosphor Ca4Nb2O9:Pr3+ was developed based on red-emitting afterglow phosphors. As an important host-material, niobates have been extensively explored due to their diverse crystal structure and multifunctional properties. As for the selection of doped ions, the Pr3+ ion is a common element to explore rare earth doped multifunctional luminescent materials. In general, the luminescence spectra of Pr3+ can exhibit intense 3P0–3H6 emission at about 610 nm, and consequently the Pr3+ ion is widely used in the red emission region. For example, a bright red-emitting perovskite phosphor (Ca, Zn)TiO3:Pr3+ in long afterglow applications was reported by Haranayh et al. In 2006, Liu et al. developed a highly stable red oxynitride β-SiAlON:Pr3+ for white LED applications.15,16 Additionally, a variety of Pr3+ doped phosphors has been studied so far, such as long afterglow phosphors CdSiO3:Pr3+,17 X-ray storage phosphors YNbO4:Pr3+![[thin space (1/6-em)]](https://www.rsc.org/images/entities/char_2009.gif) 18 and magnetic materials Bi–FeO3:Pr3+.19 Owing to the properties of Pr3+-doped functional materials, they are widely used in night displays, in vivo bioimaging and temperature sensors, which have been explored by many researchers.20
18 and magnetic materials Bi–FeO3:Pr3+.19 Owing to the properties of Pr3+-doped functional materials, they are widely used in night displays, in vivo bioimaging and temperature sensors, which have been explored by many researchers.20
In this work, a red-emitting afterglow phosphor Ca4Nb2O9:Pr3+ was developed successfully, and the crystal structure, morphology, photoluminescence properties and afterglow phenomenon were deeply discussed, and all the results indicated that the Ca4Nb2O9:Pr3+ phosphor is suitable for the application of AC-LEDs.
2. Experimental details
2.1 Synthesis of samples
CaCO3 (AR, Sinopharm Chemical Reagent Co., Ltd), Nb2O5 (99.9%, Shanghai Aladdin Biochemical Technology Co., Ltd), and Pr6O11 (99.99, Shanghai Aladdin Biochemical Technology Co., Ltd) were used by raw materials. Ca4Nb2O9:xPr3+ powders with various Pr3+-doped concentrations were synthesized by the traditional solid-state reaction technique. The stoichiometric amounts of CaCO3, Nb2O5, Pr6O11 and ethanol were added into an agate mortar to mix and grind for 30 min. Then, the mixture was dried and sintered at 1450 °C for 5 h under 95% N2 + 5% H2 reductive atmosphere in a tube furnace.2.2 Synthesis and characterization
The X-ray diffraction (XRD) patterns were recorded on a Germany Brucker D2 PHASER diffractometer in the 2θ range of 10–80° equipped with Cu Kα radiation (λ = 1.5418 Å) at 40 kV and 40 mA. The crystal structure was refined by the Rietveld method using the General Structure Analysis System (GSAS) program. The photoluminescence (PL), photoluminescence excitation (PLE), persistent luminescence (PersL), and decay curves were measured using an FLS980 spectrometer (Edinburgh Instruments, the United Kingdom). The diffuse reflection spectra (DRS) of the samples were measured using a UV-Vis-NIR spectrophotometer (PerkinElmer, Lambda 950), using BaSO4 as a standard reference. For the thermoluminescence (2D-TL/3D-TL) measurements, the samples were mounted on a thermal stage (298–770 K, LTTL-3DS, Radi Tec), after irradiation with 254 nm UV light for 5 min, and the heating rate was 1 K s−1 and reached 770 K. The persistent luminance (mcd m−2) was measured by using a PR 305 persistent luminance instrument (Zhejiang University Sensing Instrument Co. Ltd, Hangzhou, China). The samples were irradiated for 5 min, and then measured and the duration of the luminance 15 s was calculated after the excitation was stopped, until the intensity reached 0.00032 cd m−2. The sample morphology was measured by using a scanning electron microscope TESCAN VEGA 3 SEM (Tescan China, Ltd). Energy-dispersive spectroscopy (EDS) and elemental mapping (SEM) were performed by using a table-top electron microscope.3. Results and discussion
3.1 Crystal structure analysis
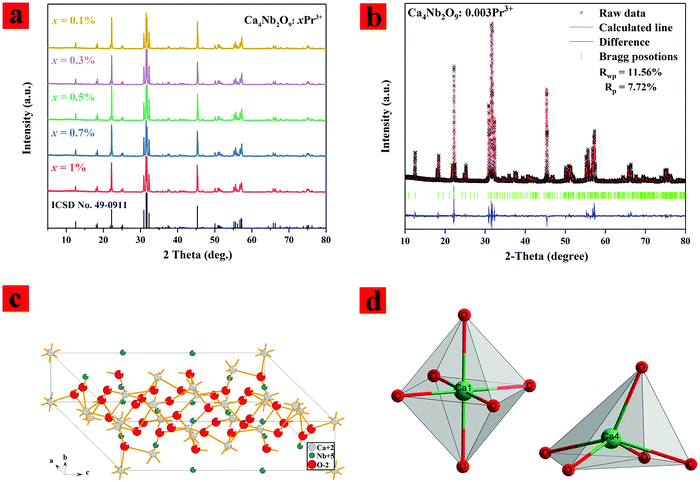
The phase purity of the sample was determined by XRD and further data analysis. Fig. 1(a) shows the XRD pattern of the samples with different concentrations of Pr3+ ion doped Ca4Nb2O9, and it can be seen that all the diffraction peaks match well with standard card ICSD NO. 49-0911. This indicates that a small number of Pr3+ ions was successfully incorporated into the host. Fig. 1(b) depicts the results of Rietveld refinement for Ca4Nb2O9:0.003Pr3+. It can be found that there is little difference between the experimental value and the calculated value. The refinement factors of χ2, the weighted profile R-factor (Rwp), and the expected R factor (Rp) are determined to be ∼3.04, ∼11.56%, and ∼7.72%, respectively, indicating that the refined results are reliable. More crystallographic data of Ca4Nb2O9:0.003Pr3+ are listed in Table 1. These results indicate that all the samples have a single phase with a monoclinic structure. The Ca4Nb2O9 structure belongs to the space group P21/c with medium lattice parameters a = 9.813 Å, b = 5.535 Å, c = 17.344 Å and V = 767.048 Å3. We have listed the lattice parameters of the samples doped with different concentrations of Pr3+ in Table 1 according to this suggestion, and the corresponding descriptions were added as follows: “owing to the similar valence and ionic radius of Pr3+ ions (CN = 6, RPr3+ = 0.99) and Ca2+ (r = 1.00 Å for CN = 6), the Pr3+ ions tend to replace the site of Ca2+ in the Ca4Nb2O9 host. In order to prove that the Pr3+ ions occupy the Ca2+ crystallization site, lattice parameters of the samples doped with different concentrations of Pr3+ were calculated and are shown in Table 2. It can be seen that the lattice parameters gradually decrease with the increase of the Pr3+ doping concentration, confirming that the Pr3+ ions occupy the Ca2+ crystallization site.| Formula | Ca4Nb2O9 |
|---|---|
| Crystal system | Monoclinic |
| Space group | P21/c |
| Vol (Å3) | 767.048 |
| Unit cell dimension (Å) | a = 9.813, b = 5.535, c = 17.344 |
| Reliability factors | R wp = 8.83%, Rp = 7.72% |
| Program | GSAS |
| Profile range | 5–80° |
| Step | 0.006° |
| Radiation | Cu Kα |
| Ca4Nb2O9:xPr3+ | Crystal system | Space group | a/(Å) | b/(Å) | c/(Å) | V/(Å3) |
|---|---|---|---|---|---|---|
| x = 0 | Monoclinic | P21/c | 9.832 | 5.542 | 17.361 | 769.229 |
| x = 0.001 | Monoclinic | P21/c | 9.827 | 5.539 | 17.352 | 768.485 |
| x = 0.003 | Monoclinic | P21/c | 9.813 | 5.535 | 17.344 | 767.048 |
| x = 0.005 | Monoclinic | P21/c | 9.805 | 5.531 | 17.336 | 766.862 |
| x = 0.007 | Monoclinic | P21/c | 9.796 | 5.529 | 17.329 | 766.134 |
| x = 0.01 | Monoclinic | P21/c | 9.788 | 5.525 | 17.315 | 765.683 |
The crystal structure of Ca4Nb2O9 was drawn using Diamond software and is shown in Fig. 1(c and d). It is composed of [NbO6] and [CaO6] octahedra, where Nb and Ca are located at the center of the octahedra and the oxygen atoms are located on six peaks, in which the oxygen between the layers is shared by Nb and Ca. There are two different Ca sites in the host lattice. Ca1, Ca2, and Ca3, Ca4, Ca5 are octahedral arrangements and pentahedron arrangements, respectively.
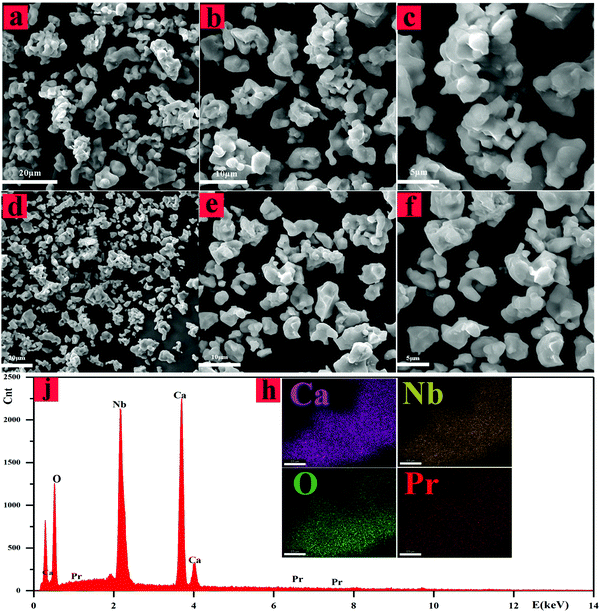
As shown in Fig. 2(a–f), SEM-EDS and elemental mapping analysis of Ca4Nb2O9 and Ca4Nb2O9:0.003Pr3+ were performed to determine whether the dopants result in element aggregation. The SEM images (Fig. 2(a–f)) with different magnifications show partial aggregation of the elements and exhibit relatively homogeneous sizes, which range from a few microns to tens of microns. The elemental map displays that the elements of Ca, Nb, O and Pr are uniformly distributed as shown in Fig. 2(h), and the energy-dispersive X-ray spectroscopy (EDS) analysis as shown in Fig. 2(j) indicated that each component element is distributed in the selected region. All the results indicated that Pr3+ has been completely mixed into this phosphor.
3.2 Photoluminescence properties
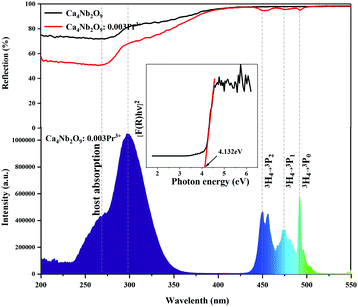
Fig. 3 displays the diffuse reflectance spectra of the un-doped and Pr3+-doped Ca4Nb2O9 and the two spectra are basically the same except for many sharp absorption peaks in the range of 450–500 nm. In addition, it can be seen that the Pr3+-doped Ca4Nb2O9 phosphor has a strong absorption band of 225–400 nm and a high reflection band of 400–500 nm. Therein, the reason for the increase in the intensity at 200–275 nm and 275–400 nm is due to host absorption and 4f–5d transition. By comparing the PLE spectra detected at 617 nm of the sample Ca4Nb2O9:0.003Pr3+, extensive absorption was found at ∼260 nm and ∼299 nm, among which the 260 nm band belongs to the absorption band of the Ca4Nb2O9 host material and the 299 nm band was due to the 4f → 5d transitions of Pr3+. However, the broadband in the range of 225–350 nm may be considered as the overlap of the Nb5+–O2− charge transfer band and the 4f → 5d transition of Pr3+. Additionally, another three distinguishable absorption peaks located at ∼450 nm, ∼476 nm and ∼482 nm are assigned to strong 3H4 → 3P2, 3H4 → 3P1 and 3H4 → 3P0 spin-allowed transitions of Pr3+ ions. A satisfactory result is that the DRS of Pr3+-doped Ca4Nb2O9 is consistent with the PLE spectrum as shown in Fig. 3. The band gap (Eg) is calculated as eqn (1):21–23| [αhν]2 = A(hν − Eg) | (1) |
 | (2) |
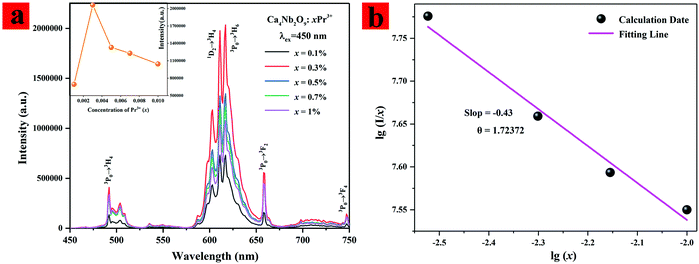
In order to further verify the luminescence properties of Ca4Nb2O9:Pr3+ upon excitation by blue light, the PL spectra were measured and are shown in Fig. 4(a). The PL spectra show that the Pr3+ ion doped samples have the strongest emission band located at 613 nm for the red emission region. The dependence of the Pr3+ doping concenstration on the emission intensity is illustrated in the inset of Fig. 4(a). It can be seen that the relative emission intensity of the series of samples first enhanced with the increase of the Pr3+ doping concenstration and then decreased immediately. The enhancement of the emission intensity is caused by the increasing luminescence centers when the Pr3+ concentration was less than 0.3%. And the concentration quenching effect occurred due to the decrease of the Pr3+–Pr3+ distance and the nonradiative transition increased in the Ca4Nb2O9 host when the Pr3+ concentration reached 0.3%. These results show that the optimal Pr3+ doping concentration in Ca4Nb2O9:xPr3+ is 0.3%. Under 450 nm excitation, intense red emission peaks located at 613, 617 and 660 nm were observed in the PL spectra of Ca4Nb2O9:xPr3+, which could be ascribed to the 1D2 → 3H4, 3P0 → 3H6 and 3P0 → 3F2 transitions of Pr3+ ions, respectively. Due to the electron–phonon coupling effect, the transitions of 1D2 → 3H4 and 3P0 → 3H6 coincide approximately. Based on the Judd–Ofelt theory, the strong emission intensity of 613 and 617 nm is caused by the host lattice distortion or non-radiative relaxation of Pr3+ ions.25,26 The peaks centered around 480 nm and 750 nm are attributed to 3P0 → 3H4 and 3P0 → 3F4 of Pr3+, respectively. In order to further appreciate the mechanism of concentration quenching, the critical distance (Rc) between the neighboring Pr3+ ions is obtained as shown in eqn (3):27
 | (3) |
| I/x = K[1 + β(x)θ/3]−1 | (4) |
![[thin space (1/6-em)]](https://www.rsc.org/images/entities/char_2009.gif) x, and the curve of lg(I/x) vs. lg(x) is shown in Fig. 4(b) to obtain the value of θ considering β(x)θ/3 ≫ 1 when x is more than the critical concentration.30 A nearly linear fitting can be obtained and the slope of the fitting line is about ∼1.5308 (−θ/3). So, the value of θ can be calculated to be 4.6, which is approximately equal to 6. The result indicates that the d–d interaction is the major mechanism for the luminescence quenching of Pr3+ in the Ca4Nb2O9 host.
x, and the curve of lg(I/x) vs. lg(x) is shown in Fig. 4(b) to obtain the value of θ considering β(x)θ/3 ≫ 1 when x is more than the critical concentration.30 A nearly linear fitting can be obtained and the slope of the fitting line is about ∼1.5308 (−θ/3). So, the value of θ can be calculated to be 4.6, which is approximately equal to 6. The result indicates that the d–d interaction is the major mechanism for the luminescence quenching of Pr3+ in the Ca4Nb2O9 host.
The corresponding decay curves of 3P0 → 3H6 transitions of Pr3+ (excited at 299 nm and 450 nm) have been measured at room temperature and are shown in Fig. 5(a and b). The decay curves can be well fitted by a double exponential fitting and the average lifetimes can be further calculated by using eqn (5):31
I(t) = A1![[thin space (1/6-em)]](https://www.rsc.org/images/entities/char_2009.gif) exp(−t/τ1) + A2 exp(−t/τ1) + A2![[thin space (1/6-em)]](https://www.rsc.org/images/entities/char_2009.gif) exp(−t/τ2) exp(−t/τ2) | (5) |
| τ* = (A1τ12 + A2τ22)/(A1τ1 + A2τ2) | (6) |
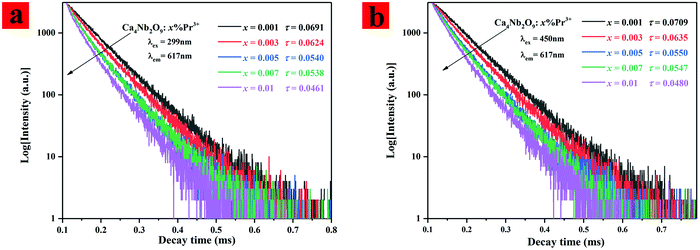 | ||
| Fig. 5 (a and b) Luminescence decay curves of Pr3+ under 299 nm and 450 nm excitation in Ca4Nb2O9:xPr3+ (x = 0.001, 0.003, 0.005, 0.007, and 0.01). | ||
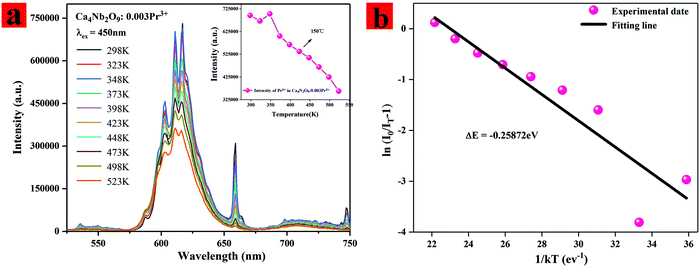
It is essential to investigate the thermo-stability of phosphors used for LEDs. Fig. 6(a) illustrates the PL spectra of the typical Ca4Nb2O9:0.003Pr3+ sample measured at various temperatures. It is found that with the increasing temperature from 298 K to 523 K, all the PL spectra show the same shapes and peak positions, but the PL intensity decreases gradually due to the influence of thermal quenching. It is worth noting that the PL intensity at 348 K is more potent than that at all temperatures. We speculate that the PL intensity increased abnormally at 348 K due to the contribution of shallow trap electrons discharged in the heating process. The relationship between the maximum strength integral value and the temperature is illustrated in Fig. 6(a). It can be seen that the strength decreases with the increase of temperature due to thermal quenching. The emission intensity of the Ca4Nb2O9:0.003Pr3+ phosphors at 423 K remained about 92% compared with that at 298 K, indicating that the Ca4Nb2O9:0.003Pr3+ phosphors had excellent thermal stability. To further explore the thermal quenching characteristics, the activation energy (Ea) is studied by using the Arrhenius formula:34,35
 | (7) |
The above equation can be written as:
In(I0/I − 1) = In![[thin space (1/6-em)]](https://www.rsc.org/images/entities/char_2009.gif) A − Ea/KT A − Ea/KT | (8) |
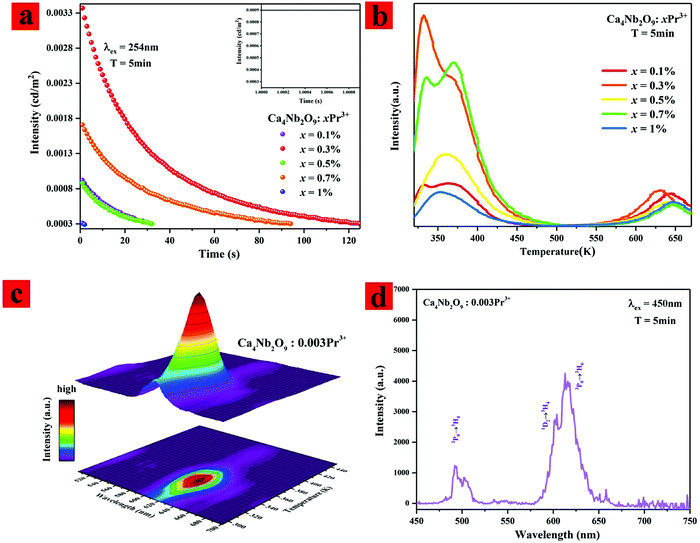
Fig. 7(a) shows the afterglow decay curves in single and double logic diagrams of the typical Ca4Nb2O9:xPr3+(x = 0.1%, 0.3%, 0.7%, 0.9%, and 1%) samples. All the samples were charged for 5 min with an ultraviolet (λex = 254 nm) lamp before measurements. The result indicated that the afterglow of the sample was sufficient to compensate for the scintillation time of the AC-LED. The afterglow luminescence behavior originating in 10 ms is shown in Fig. 7(a) inset. It can be seen that the afterglow intensity has no attenuation trend, indicating that it can be used to compensate for the flicker of the AC-LED.
As shown in Fig. 7(b), the trap properties of Ca4Nb2O9:xPr3+(x = 0.1%, 0.3%, 0.7%, 0.9%, and 1%) were carefully studied by means of recording TL curves that monitor the whole visible range immediately after UV light irradiation for 5 min. All the samples showed similar TL spectral characteristic of a conspicuous peak around 350 K. The changing trend of the TL intensity is the same as that of the afterglow. It can be seen that the integral TL intensity of the Ca4Nb2O9:0.003Pr3+ sample is the largest of all in appearance. Generally, the intensity of TL can represent the trapped carrier concentration, and the location of the TL peak value is relevant to the depth of the trap. They all rely on the concentration of introduced Pr3+ for Ca4Nb2O9:xPr3+. Meanwhile, the excess Pr3+ (x > 0.003) ions play a negative role in promoting the afterglow intensity and the half width of the TL peak.
As shown in Fig. 7(b), there are both deep and shallow traps, and the shallow traps are asymmetric, so there may be three kinds of defects. One is the oxygen vacancy created by the reduction of hydrogen at high temperatures, and the other is because of nonequivalent substitutions; an excess of positive charge in the host must be compensated. The only possible way to fulfil the charge compensation is that two Pr3+ ions replace three Ca2+ ions to balance the charge of the phosphor, which will create two  positive defects and one
  negative defect, which leads to the formation of a large number of traps along with the increased concentration of Tb3+ ions, based on the defect reaction of
  .
.
The reason for the sudden increase of the 348 K PL intensity (as shown in Fig. 6(a)) can be further explained from the TL curves. In the TL curve, it was indicated that there is a shallow trap at 348 K; when the temperature rises to 348 K, a large number of trap electrons are discharged, so the PL intensity of 348 K increases sharply. For illustrating the afterglow process intuitively, the 3D-TL spectrum is displayed in Fig. 7(c). The trap depths can be calculated using the Urbach method:36–38
| E = Tm/500 | (9) |
| Concentration (x) | x = 0.001 | x = 0.003 | x = 0.005 | x = 0.007 | x = 0.01 |
|---|---|---|---|---|---|
| Trap depth (eV) | 0.728 | 0.664 | 0.718 | 0.738 | 0.706 |
In order to prove that the Ca4Nb2O9:Pr3+ phosphor is useful for blue-chip AC-LEDs, Fig. 7(d) shows the blue light pre-irradiated afterglow spectrum of Ca4Nb2O9:0.003Pr3+, for example. The similarity of the afterglow spectrum to the PL spectrum indicates that afterglow also originates from the Pr3+ ions. And the highest afterglow peak is attributed to the 3P0–3H6 (617 nm) and 1D2–3H4 transitions (613 nm) of Pr3+.
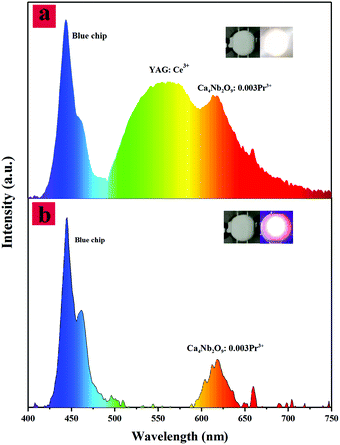
Based on the previous data, an AC-LED device based on the Ca4Nb2O9:0.003Pr3+ phosphor was fabricated as shown in Fig. 8(b). It is pumped by a 450 nm blue-chip with 5 V, 100 mA, and it emitted a red color. When the entire circuit is electrically connected, the Ca4Nb2O9:0.003Pr3+ phosphor is irradiated to produce red light and the phosphors excited by the blue light chip begin to store the excited energy in the trap. CIE = (0.353, 0.3629), Ra = 74.96 and CCT = 2986 K can be obtained from the W-LEDs encapsulated as shown in Fig. 8(a). Meanwhile, quantum efficiency is also important for both theoretical and practical views, and the quantum efficiency of the Ca4Nb2O9:Pr3+ sample is 30.3%. These results indicate that the prepared Ca4Nb2O9:Pr3+ phosphors can be used as red light components of AC-LEDs.
4. Conclusions
In summary, we successfully prepared a series of Ca4Nb2O9:Pr3+ phosphors. Structural analysis confirmed the formation of the monoclinic phase and the homogeneous distribution of Pr3+ in Ca4Nb2O9. PL and PLE spectral analysis revealed that the Ca4Nb2O9:Pr3+ phosphors can be efficiently excited by blue light and generated bright red emission. Temperature dependent PL property measurements demonstrated that this phosphor has excellent thermal stability for applications in the AC-LED field. Moreover, the afterglow luminescence time of Ca4Nb2O9:0.003Pr3+ matched well with the requirement for AC-LEDs. Thus, the obtained outcomes with the Ca4Nb2O9:xPr3+ phosphor reveals that it is very suitable for AC-LEDs as a potential candidate for depreciation of dark duration and flickering.Conflicts of interest
The authors declare that they have no known competing financial interests or personal relationships that could have appeared to influence the work reported in this paper.Acknowledgements
This work was supported by the National Natural Science Foundation of China (11804038 and 11804007), the Natural Science Foundation of Shaanxi Province of China (2020JQ-891 and 2019JQ-424), the Opening Foundation of Key Laboratory for Special Function Materials and Structural Design of the Ministry of the Education (lzujbky-2020-kb06), the Baoji University of Arts and Sciences Key Research (ZK16071, ZK2018053, and ZK2017033), the Key Research and Development Plan of Shaanxi Province (2018ZDXMGY119), the Key Scientific Research Plan of Shaanxi Provincial Department of Education (18JC001), the Scientific and Technological Research Program of Chongqing Municipal Education Commission (KJQN202001325 and KJQN201901349), the Yongchuan Natural Science Foundation (YCSTC, 2020nb0601), and the Foundation of Chongqing University of Arts and Sciences (R2016DQ10 and R2019SCL01).References
- G. Zhang and L. Zhao, et al., Near UV-pumped yellow-emitting Ca3TeO6:Dy3+ phosphor for white light-emitting diodes, Spectrochim. Acta, Part A, 2019, 223(2019), 117343, DOI:10.1016/j.saa.2019.117343.
- E. F. Schubert and J. K. KimSchubert, et al., Solid-state light sources getting smart, Science, 2005, 308(5726), 1274–1278, DOI:10.1126/science.1108712.
- F. Y. Fan and L. Zhao, et al., Thermally stable double-perovskite Ca3TeO6:Eu3+ red-emitting phosphors with high color purity, J. Lumin., 2019, 211(2019), 14–19, DOI:10.1016/j.jlumin.2019.03.001.
- H. Lin and R. Zhang, et al., Tuning of multicolor emissions in glass ceramics containing γ-Ga2O3 and β-YF3 nanocrystals, J. Mater. Chem. C, 2013, 1(9), 1804–1811, 10.1039/c2tc00658h.
- L. Chen and Y. Zhang, et al., A new green phosphor of SrAl2O4: Eu2+, Ce3+, Li+ for alternating current driven light-emitting diodes, Mater. Res. Bull., 2012, 47(12), 4071–4075, DOI:10.1016/j.materresbull.2012.08.057.
- C. W. Yeh and Y. Li, et al., Appropriate green phosphor of SrSi2O2N2: Eu2+, Mn2+ for AC LEDs, Opt. Express, 2012, 20(16), 18031–18043, DOI:10.1364/oe.20.018031.
- A. Wilkins and J. Veitch, et al., LED lighting flicker and potential health concerns: IEEE standard PAR1789 update. in Energy Conversion Congress and Exposition (ECCE), 2010 IEEE. 2010.
- Z. W. Pan and Y. Y. Lu, et al., Sunlight-activated long-persistent luminescence in the near-infrared from Cr3+-doped zinc gallogermanates, Nat. Mater., 2011, 11(1), 58–63, DOI:10.1038/nmat3173.
- Y. J. Zhao and X. Min, et al., Metal-Based Nanocatalysts via a Universal Design on Cellular Structure, Adv. Sci., 2020, 7(3), 1902051, DOI:10.1002/advs.201902051.
- H. Lin and B. Wang, et al., Phosphor-in-Glass for High-Powered Remote-Type White AC-LED, ACS Appl. Mater. Interfaces, 2014, 6(23), 21264–21269, DOI:10.1021/am506251z.
- L. Chen and Y. Yao, et al., THE GREEN PHOSPHOR SrAl2O4: Eu2+, R3+ (R = Y, Dy) AND ITS APPLICATION IN ALTERNATING CURRENT LIGHT-EMITTING DIODES, Funct. Mater. Lett., 2013, 06(04), 1350047, DOI:10.1142/s1793604713500471.
- B. Wang and H. Lin, et al., Design, Preparation, and Characterization of a Novel Red Long-Persistent Perovskite Phosphor: Ca3Ti2O7:Pr3+, Inorg. Chem., 2015, 54(23), 11299–11306, DOI:10.1021/acs.inorgchem.5b01894.
- Y. L. Liu and B. F. Lei, et al., Luminescent Properties of a White Afterglow Phosphor CdSiO3: Dy3+, J. Cheminf., 2004, 17(8), 2108–2113, DOI:10.1021/cm0496422.
- J. Xu and Z. H. Ju, et al., Na2CaSn2Ge3O12: A Novel Host Lattice for Sm3+-Doped Long-Persistent Phosphorescence Materials Emitting Reddish Orange Light, Inorg. Chem., 2013, 52(24), 13875–13881, DOI:10.1021/ic401262w.
- D. Haranath and A. F. Khan, et al., Bright Red Luminescence and Energy Transfer of Pr3+-Doped (Ca,Zn)TiO3 Phosphor for Long Decay Applications, J. Phys. D: Appl. Phys., 2006, 39(23), 4956, DOI:10.1088/0022-3727/39/23/009.
- T. C. Liu and B. M. Cheng, et al., Highly Stable Red Oxynitride β-SiAlON:Pr3+ Phosphor for Light-Emitting Diodes, Chem. Mater., 2011, 23(16), 3698–3705, DOI:10.1021/cm201289s.
- J. Y. Kuang and Y. L. Liu, Observation of energy transfer from host to rare earth ions in Pr3+-doped CdSiO3 long-lasting phosphor, Chem. Phys. Lett., 2006, 424(1–3), 58–62, DOI:10.1016/j.cplett.2006.04.033.
- W. J. Schipper and M. F. Hoogendorp, et al., The luminescence and X-ray storage properties of Pr3+ and Ce3+ in YNbO4 and M′-YTaO4, J. Alloys Compd., 1993, 202(1–2), 283–287, DOI:10.1016/0925-8388(93)90550-7.
- S. Bharathkumar and M. Sakar, et al., Dual oxidation state induced oxygen vacancies in Pr substituted BiFeO3 compounds: An effective material activation strategy to enhance the magnetic and visible light-driven photocatalytic properties, Mater. Res. Bull., 2018, 101(2018), 107–115, DOI:10.1016/j.materresbull.2017.12.029.
- M. Coeck and F. Vanhavere, et al., Thermoluminescent Characteristics of LiKYF5: Pr3+ and KYF4: Tm3+ Crystals for Applications in Neutron and Gamma Dosimetry, Radiat. Prot. Dosim., 2002, 100(1–4), 221–223, DOI:10.1093/oxfordjournals.rpd.a005851.
- C. Aydın and M. Benhaliliba, et al., Determination of optical band gap of ZnO:ZnAl2O4 composite semiconductor nanopowder materials by optical reflectance method, J. Electroceram., 2013, 31(1–2), 265–270, DOI:10.1007/s10832-013-9829-5.
- R. Wu and J. Wu, et al., Morphological characteristic of Zn/ZnO nanopowders and the optical properties, Mater. Sci. Eng., A, 2002, 328(1–2), 196–200, DOI:10.1016/S0921-5093(01)01685-9.
- Y. H. Jin and Y. H. Hu, et al., Synthesis and Persistent Luminescence Mechanism of a Novel Orange Emitting Persistent Phosphor Sr5(BO3)3Cl:Eu2+, J. Am. Ceram. Soc., 2014, 97(8), 2573–2579, DOI:10.1111/jace.12985.
- K. Inaba and S. Suzuki, et al., Metastable Sr0.5TaO3 Perovskite Oxides Prepared by Nanosheet Processing, Ber. Dtsch. Chem. Ges., 2008, 2008(35), 5471–5475, DOI:10.1002/ejic.200800776.
- G. C. Aumüller and W. Köstler, et al., Luminescence properties of Pr3+ in cubic rare earth oxides, J. Phys. Chem. Solids, 1994, 55(8), 767–772, DOI:10.1016/0022-3697(94)90029-9.
- W. Jia and D. Jia, et al., UV excitation and trapping centers in CaTiO3:Pr3+, J. Lumin., 2006, 119(2006), 13–18, DOI:10.1016/j.jlumin.2005.12.067.
- G. Zhang and W. B. Chen, et al., Synthesis and luminescence properties of a novel deep red phosphor Li2ZnTi3O8: Mn4+ for plant-cultivation, Spectrochim. Acta, Part A, 2020, 2020, 118567, DOI:10.1016/j.saa.2020.118567.
- M. M. Shang and S. S. Liang, et al., Luminescence Properties of Ca19Ce(PO4)14: A (A = Eu3+/Tb3+/Mn2+) Phosphors with Abundant Colors: Abnormal Coexistence of Ce4+/3+-Eu3+ and Energy Transfer of Ce3+ → Tb3+/Mn2+ and Tb3+–Mn2+, Inorg. Chem., 2017, 56(11), 6131–6140, DOI:10.1021/acs.inorgchem.7b00092.
- D. L. Dexter, A Theory of Sensitized Luminescence in Solids, J. Chem. Phys., 1953, 21(5), 836–850, DOI:10.1063/1.1699044.
- S. Z. Ma and W. L. Feng, et al., KSr4(BO3)3: Pr3+: A new red-emitting phosphor for blue-pumped white light-emitting diodes, J. Alloys Compd., 2017, 700(2017), 49–53, DOI:10.1016/j.jallcom.2017.01.069.
- H. P. Zhou and Q. P. Wang, et al., A novel green emitting phosphor Ba2Gd2Si4O13: Eu2+ for near UV-pumped light-emitting diodes, Dalton Trans., 2015, 44(31), 13962–13968, 10.1039/c5dt01441g.
- J. Fu, L. S. Sun and X. W. Hu, et al., Preparation and fluorescence properties of Zn2SnO4:Eu3+ orange emitting afterglow phosphor, Ceram. Int., 2020 DOI:10.1016/j.ceramint.2020.05.110.
- X. Min and M. H. Fang, et al., Synthesis and optical properties of Pr3+-doped LaMgAl11O19–A novel blue converting yellow phosphor for white light emitting diodes, Ceram. Int., 2015, 41(3), 4238–4242, DOI:10.1016/j.ceramint.2014.11.070.
- J. S. Zhong and M. Xu, et al., Novel red-emitting Sr2LaSbO6: Eu3+ phosphor with enhanced 5D0 → 7F4 transition for warm white light-emitting diodes, Dyes Pigm., 2017, 146(2017), 272–278, DOI:10.1016/j.dyepig.2017.07.019.
- B. Henderson and G. F. Imbush, Optical Spectroscopy of Inorganic Solids (Clarendon Press, Oxford, 1989). 2016, Oxford University Press Search PubMed.
- A. Lecointre and A. Bessière, et al., Designing a Red Persistent Luminescence Phosphor: The Example of YPO4: Pr3+,Ln3+ (Ln = Nd, Er, Ho, Dy), J. Phys. Chem. C, 2011, 115(10), 4217–4227, DOI:10.1021/jp108038v.
- N. Li and P. F. Zhang, et al., Novel UV and X-ray irradiated white-emitting persistent luminescence and traps distribution of Ca5Ga6O14: Pr3+ phosphors, J. Alloys Compd., 2020, 157719, DOI:10.1016/j.jallcom.2020.157719.
- Z. Q. Wang and Z. T. Wei, et al., Long persistent luminescence and traps distribution of Tb3+ doped calcium gallium germanate, J. Lumin., 2020, 228, 117638, DOI:10.1016/j.jlumin.2020.117638.
| This journal is © The Royal Society of Chemistry and the Centre National de la Recherche Scientifique 2021 |

