 Open Access Article
Linear chains of Ag nanoparticles embedded in dielectric films for SERS applications in analytical chemistry†
Sophie
Camelio
 a,
David
Babonneau
a,
Elliot
Vandenhecke
a,
Guy
Louarn
b and
Bernard
Humbert
a,
David
Babonneau
a,
Elliot
Vandenhecke
a,
Guy
Louarn
b and
Bernard
Humbert
 *b
*b
aInstitut Pprime, Département Physique et Mécanique des Matériaux, UPR 3346 CNRS, Université de Poitiers, SP2MI, TSA 41123, Poitiers Cedex 9 86073, France. E-mail: sophie.camelio@univ-poitiers.fr
bInstitut des Matériaux Jean Rouxel, Université de Nantes, CNRS, 2 rue de la Houssinière, BP32229, Nantes Cedex 3 44322, France. E-mail: bernard.humbert@cnrs-imn.fr
First published on 12th October 2021
Abstract
In line with the approach known as shell-isolated nanoparticle-enhanced Raman spectroscopy (SHINERS), in which Raman signal amplification of analytes is provided by metallic nanoparticles with an ultrathin silica or alumina shell, we report here on a Surface-Enhanced Raman Spectroscopy (SERS) substrate consisting of periodic lines of Ag nanoparticles embedded in dielectric surfaces for enhancing Raman signals. This paper demonstrates the possibility to use these so-called ‘PLANEDSERS’ substrates as washable and reusable chemical sensors with a good level of repeatability. Large-area Ag nanoparticle arrays are produced by glancing-angle ion-beam sputtering deposition on nanorippled patterns and are protected from the chemical environment (atmospheric or liquid solutions) by a robust and functionalizable thin dielectric layer of alumina or silicon nitride. Our results show that linear assemblies of ellipsoidal nanoparticles (size ∼15 nm) separated by interparticle gaps of approximately 5 nm generate enough near-field intensity enhancement to give rise to significant SERS signals of non-Raman-resonant bipyridine molecules without chemical contact between molecules and Ag nanoparticles. Moreover, the optical dichroic response of these plasmonic assemblies allows for the possibility of tuning the excitation wavelength of the Raman spectra over a wide spectral range. This study is a first step towards designing a substrate-platform without chemical specificity to enhance in equal manner all the weak Raman signals of usual organic molecules and to avoid loss of balance in favour of only one species as usual in SERS experiments. The quantitative detection ranges for bipyridine used as a probe test molecule are around between 10−3 to 10−6 M.
1. Introduction
Surface-Enhanced Raman Spectroscopy (SERS) was discovered in the 1970s by Fleischmann et al. and Van Duyne and coworkers.1,2 SERS is undergoing a rapid growth that is nurtured by the motivating challenge to overcome the classic limits of analytical detection in Raman spectroscopy. “Conventional Raman spectroscopy” is not used to analyse trace concentrations because the Raman scattering process is extremely inefficient, with scattering cross-sections (∼10−30 cm2) being at least 14 orders of magnitude lower than fluorescence excitation.3 This very weak efficiency can be overcome by using noble metals with nanoscale structures that exhibit surface plasmon resonance (SPR) when impinged by light of an appropriate wavelength. SERS is usually associated with the strong near-field amplifying properties of these plasmonic nanostructures together with a direct chemical interaction between the adsorbed species and the metal. As a result of these combined electromagnetic and chemical effects, a huge electromagnetic enhancement of the local field is produced at both the excitation and Raman wavelengths, and the Raman signal of the target molecules is greatly magnified.4 As a powerful analysis method, SERS is employed in the fields of chemistry, material sciences and life sciences, for food security, chemical or biological catalysis, biochemistry, detection of trace chemicals, etc.5–10 However, the SERS process is strongly dependent on the chemical nature of the detected molecules, so that a strong selectivity between molecules may occur in case of different components in mixtures. In particular, if one species of the mixture is easily involved in strong interactions with the noble metal and not the others, the balance tilts overwhelmingly in favour of this molecular family against other families. Moreover, while SERS is sensitive to low or very low concentrations (<10−6 M), it does not provide a linear quantitative response at intermediate concentrations (typically between 10−6 and 10−3 M) where the conventional Raman is yet too inefficient.3 This is due, in particular, to the fact that the adsorption isotherm of the target molecule on the metallic plasmonic structures displays an asymptotic plateau, either characteristic of the molecular saturation of the ‘hot spots’ or more simply saturation of the more energetic adsorption sites.11,12 Additionally, the applicability of the usual SERS substrates is undermined by either the repeatability of the deposits of colloidal dispersions or the fabrication complexity, which involves multiple steps and lithography processes.6 Self-assembled plasmonic nanoparticle (NP) arrays obtained by fabrication routine, involving large-scale nanopatterning of solid surfaces and glancing-angle metal deposition,13 have recently been proposed to partly overcome these limitations.14–19 The resulting systems, which consist of periodic chains of NPs (Ag, Au, or AgxAu1−x) with nanometer separation along the chains, display localised SPRs that can be bidirectionally excited. This allows broadband excitable SERS with both wavelength- and polarisation-dependence of the SERS enhancement factor, which makes these systems an appealing platform for advanced SERS detection.16–18 In practice, however, although problems of fabrication can thus be resolved, the issue remains the chemical selectivity that may favor one species at the expense of the others. Here, we report an approach based on similar self-organised arrays of Ag NPs with strong plasmonic coupling, but protected from atmospheric exposure by a dielectric capping-layer of controlled thickness.13,20–22 We call this new spectroscopic sampling technique Periodic Lines of Ag Nanoparticles Embedded in Dielectric Surfaces for Enhancing Raman Signals (PLANEDSERS). It constitutes an alternative to shell-isolated nanoparticle-enhanced Raman spectroscopy (SHINERS), in which the Raman signal amplification is provided by colloidal NPs surrounded with an ultrathin protective shell.5,23–25 In this article, we demonstrate that the chemically inert capping-layer prevents direct interaction between the NPs and the probed molecules, while preserving high-quality Raman spectra with a bidirectional response. Moreover, the substrate sensitivity is not altered after repeated cycles of cleaning by usual solvents, which expands the flexibility of SERS for designing reusable liquid or gas chemical sensors able to detect and identify a wide range of chemical species in a quantitative detection range typically between 10−6 to 10−3 M.2. Experimental methods
2.1 Fabrication of the SERS substrates
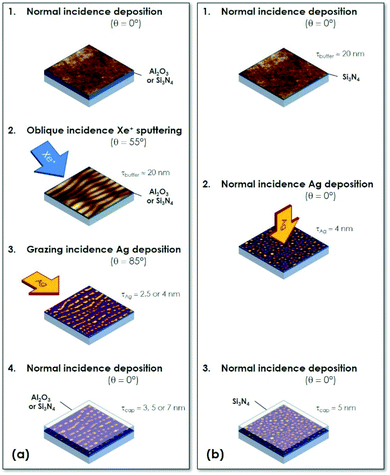
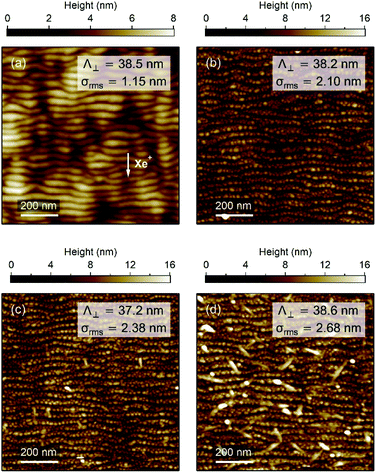
Dielectric/Ag/dielectric trilayers (labelled SAS or AAA hereafter) consisting of Ag NPs sandwiched between two amorphous dielectric films (Si3N4 or Al2O3) have been grown on fused silica glass by alternate ion-beam sputtering (IBS) deposition in a dual IBS Nordiko chamber under high vacuum (∼6 × 10⁻⁸ mbar base pressure). To study the influence of different parameters on the SERS signal, such as the thickness of the protective capping-layer, various substrates with periodic chains of Ag NPs (nSAS-τcap and nAAA-τcap substrates, prefix n for nanopatterned) were fabricated following a four-step sequence, as sketched in Fig. 1(a). Deposition of amorphous dielectric films totalling up to 230 nm in thickness was first accomplished at normal incidence by IBS of Si3N4 and Al targets, respectively. In order to obtain transparent layers in the visible region, Si3N4 was deposited at 400 °C while carrying out ion assistance by a 50 eV nitrogen ion-beam oriented at 45° with respect to the surface normal. Al2O3 layers were elaborated at room temperature under ion assistance by a 50 eV oxygen ion-beam during deposition. Ion erosion of the dielectric buffer-layers was then performed by IBS at room temperature with a collimated 1 keV Xe+ ion beam produced from a filamentless radio-frequency ion source at a sputtering angle of θ = 55° with respect to the surface normal and a total fluence of about 8 × 10¹⁷ ions per cm2.26,27 This led to the formation of periodic ripples oriented in the direction perpendicular to the projection of the ion beam, with a period of Λ⊥ ≈ 25 nm for Si3N4 and Λ⊥ ≈ 38 nm for Al2O3 [Fig. 2(a)], respectively. The pre-patterned dielectric surfaces were then used as templates for the subsequent growth of Ag NP chains by glancing-angle deposition with the metal flux being oriented perpendicular to the ripples. Ag was deposited by IBS at room temperature under a grazing incidence of 5° from the mean surface (θ = 85°) and the effective Ag thickness was τAg = 4 nm (nSAS-τcap sample) or 2.5 nm (nAAA-τcap samples). A thin dielectric capping-layer was finally deposited on the Ag NP arrays. The thickness of this protective capping-layer was varied from τcap = 3 nm to 7 nm.For comparison, a SAS trilayer obtained from an unpatterned Si3N4 flat surface with Ag deposition at normal incidence (fSAS-τcap sample with τcap = 5 nm and τAg = 4 nm, prefix f for flat) was also prepared [Fig. 1(b)]. All the samples are listed in Table 1.
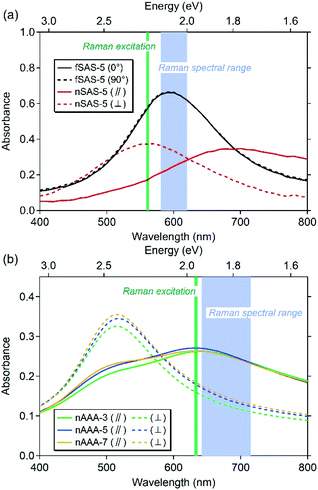
| Label | Dielectric medium | τ cap (nm) | τ Ag (nm) | λ ‖ (nm) | λ ⊥ (nm) |
|---|---|---|---|---|---|
| fSAS-5 | Si3N4 | 5 | 4 | 596 | 595 |
| nSAS-5 | Si3N4 | 5 | 4 | 694 | 562 |
| nAAA-3 | Al2O3 | 3 | 2.5 | 632 | 517 |
| nAAA-5 | Al2O3 | 5 | 2.5 | 632 | 518 |
| nAAA-7 | Al2O3 | 7 | 2.5 | 642 | 516 |
2.2 Morphological analyses
The surface topography of the samples was investigated by atomic force microscopy (AFM) with a MultiMode equipment (Digital Instruments) operated in the tapping mode under ambient conditions. AFM images were analysed with the WSxM software.28 An example of periodic ripple pattern formed by Xe+ IBS at oblique incidence of amorphous Al2O3 is presented in Fig. 2(a). The pre-patterned surface exhibits unidirectional shallow ripples oriented in the direction perpendicular to the projection of the incident Xe+ beam with a periodicity of ∼38.5 nm and a root mean square (rms) roughness of ∼1.15 nm. In Fig. 2(b)–(d), the AFM images of the surface of the nAAA-7, nAAA-5, and nAAA-3 samples exhibit topography consistent with periodic ripples decorated with nanobumps due to the presence of NP chains buried under the Al2O3 capping-layer.20 Indeed, at glancing-angle deposition, the NP growth proceeds by replication of the rippled surface pattern as a result of shadowing effects, which leads to the formation of self-aligned NPs, with ellipsoidal shape (average in-plane size of about 11 nm and 15 nm in the transverse and longitudinal directions, respectively) and interparticle gaps within the chains in the range between 2 and 12 nm (Fig. S1† and ref. 22). However, while the rms roughness decreases with the capping-layer thickness, we can notice that large dots are present on the surface of the nAAA-3 sample [Fig. 2(d)], which may correspond to partly uncovered Ag NPs or to isolated islands that stem from Ag diffusion through the capping layer.29 It should also be mentioned that trilayers obtained from an unpatterned buffer-layer are constituted of quasi-spheroidal NPs (with typical in-plane size of about 15 nm) with isotropic distribution and interparticle gaps greater than 5 nm.212.3 Far-field optical spectra
The optical properties were investigated by means of spectroscopic transmission of polarised light at normal incidence by using a Cary 5000 spectrophotometer from Agilent Technologies equipped with a rotating polarizer. Let us note that all transmittance spectra correspond to macroscopic measurements with a beam size of ∼3 mm. In contrast to the fSAS-5 trilayer showing an isotropic distribution of quasi-spheroidal NPs and therefore a unique resonance at ∼595 nm [Fig. 3(a)], nanopatterned samples exhibit two resonances depending on the polarisation of the incident light with respect to the direction of the NP chains, i.e., longitudinal (‖) or transverse (⊥). Such an optical dichroism originates from the preferential orientation of ellipsoidal NPs, but also from strong coupling between NPs when the incident electric field is parallel to the chain direction (longitudinal direction) whereas insignificant coupling is expected in the perpendicular direction (transverse direction).22 The spectral positions of the absorbance maxima (Table 1) depend of course on the interparticle gap, but also on the shape of the NPs (in-plane and out-of-plane aspect ratios) and on the dielectric function of the surrounding medium. Thus, the maximum of the transverse resonance mode for the nSAS-5 trilayer is displayed at ∼560 nm [Fig. 3(a)], while it is observed at ∼520 nm for the nAAA-τcap trilayers [Fig. 3(b) and Table 1]. Compared to the transverse resonance, the longitudinal resonance is red-shifted by more than 100 nm and appears broadened because a broad distribution of gaps between adjacent NPs within the chains exists (Fig. S1† and ref. 22).2.4 SERS characterisations
Raman measurements were performed with two micro-Raman devices in order to check the reproducibility of our observations and to test several laser excitations with different polarisations. Only some of these experiments will be presented here.Raman spectra (Fig. 4) were recorded using a triple subtractive configuration with a Horiba Jobin Yvon's T64000 system equipped with an Olympus confocal microscope with a motorised 80 nm-step XY stage. The detector was a charge-coupled device (CCD) cooled by liquid nitrogen. For this study, the samples were excited with either an argon laser at 514.53 nm or with a 561 nm solid laser. Full details about the experimental setup are given elsewhere.30 The laser beam with an adjustable surface power density between 10 to 200 μW μm−2 was focused on the sample. The Raman backscattering was collected through the objective of the microscope (100×, area probed of ∼0.5 μm2 with numerical aperture of 0.95 or 20×, area of ∼2.5 μm2, with numerical aperture of 0.35) and dispersed by a diffraction grating with 1800 grooves per mm to obtain a spectral resolution of 2.7 cm−1 for the 514.53 nm excitation and around 2.5 cm−1 for the 561 nm excitation. The wavenumber in vacuum accuracy was better than 0.8 cm−1. The polarisation discrimination of the optical device was checked by measuring the depolarisation ratios for the perfectly known bands of reference liquid pure products. For instance, the experimental depolarisation ratio for the 459 cm−1 symmetric component of the CCl4 spectrum varies from 0.02 to 0.005 for the different wavenumber positions of the centred CCD camera or from 0.03 to 0.01 for the C–H stretching mode of CH2Cl2. Moreover, during all our experiments, the signal of a single crystal of silicon was systematically checked.
Raman spectra were also collected with a Renishaw's Raman system (Fig. 5) using a micro confocal InVia Reflex device. The instrument was equipped with a double edge filter to eliminate the Rayleigh scattering, and with a CCD camera working at a temperature of 220 K with a 1024 × 256 pixels array. Laser excitations were then at 514.53 nm and 633 nm. The setup was composed of a confocal microscope that was equipped with an automated XYZ table, where the displacement motors were able to generate 100 nm steps with a spatial precision better than 100 nm verified on an AFM grid and a repositioning possibility better than 200 nm after removing–replacing cycles of the substrates. The spectral resolution achieved with the use of gratings of 2400 or 1200 grooves per mm was between 3 and 5 cm−1 depending on the excitation wavelength. The focused power of the laser beam was also checked for each wavelength to avoid any transformation or heating of the samples. Accordingly, the surface power density was kept below 50 μW μm−2 with the magnitudes 20× or 100× of the objective being selected after a series of tests.
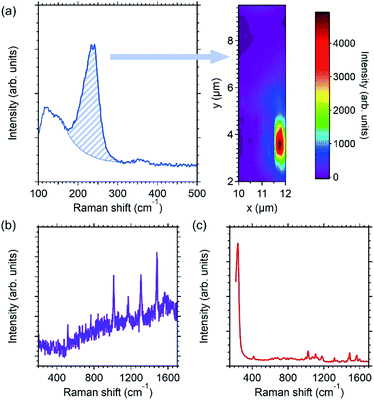 | ||
| Fig. 5 Raman signals of bipyridine molecules (1.7 × 10⁻⁴ M) deposited on the nAAA-3 trilayer excited at 633 nm with an electric field polarised parallel to the direction of the Ag NP chains. (a) Typical spectrum in the low-frequency extended range displaying the modes assigned to interaction between Ag NPs and bipyridine molecules (left panel),25,31 and map of the intensity of the Raman fingerprint at 240 cm−1 that evidences the spatial heterogeneity of this substrate (right panel). Examples of enhanced Raman spectrum recorded in spatial areas that appear (b) in purple and (c) in red in the map displayed in (a). | ||
In order to compare the possible quantitative responses of our SERS substrates, two ways of collection of Raman data have been used:
(i) For each sample, a list of 9 spatial localisations at ±1 μm has been identified and used for all Raman measurements. Indeed, it appeared that to reproduce the Raman signals (profiles and intensities) it is necessary to probe the same spatial area with an accuracy on the spatial position better than 1 μm on X and Y. Moreover, to obtain a quantitative response with a weak standard deviation, it was better to use the 20× objective rather than the 100×, even if the signal-to-noise ratio is decreased. Then, the recorded signals were more representative of the average local response of the substrate.
(ii) Raman mapping (for instance in Fig. 5) was also performed to give a description or an estimation of the spatial heterogeneity of the Raman responses obtained with different nAAA substrates.
The molecular probe used for our Raman tests was the bipyridine (2,2′), because (i) electronic transitions in the visible range are absent for this molecule, (ii) the presence of Ag–N chemical bonds gives a Raman signature between 210 to 250 cm−1 that enables either the outcrop of Ag NPs at the capping-layer surface or the porosity of the dielectric capping-layer to be probed, and (iii) the Raman signal in enhanced conditions is well known and documented in the literature.12,25,31,32 As the objective of this paper is to measure the SERS responses of our substrates and not yet to understand all the SERS mechanisms involved with all types of molecule, the bipyridine probe as long as there is no chemical bonds with Ag atoms, will reflect then the local electric field generated by the embedded plasmonic nanostructures. Stock 2,2′-bipyridine aqueous solutions were prepared precisely at about 8 × 10⁻³ M concentration. Other solutions were obtained by successive dilutions of this first stock solution. The Raman spectrum of the stock solution (Fig. S2†) allowed us to check the chemical quality of the solution and its possible degradation or pollution. SERS spectra of mixtures of 10−5 M and 10−8 M bipyridine solutions with a silver colloidal solution were also checked (Fig. S2–S4†) in order to reproduce the previously published SERS results30,31 with our devices. The colloidal dispersion of Ag NPs was synthesised in aqueous medium by reduction of an AgNO3 containing solution by NaBH4. The quasi-spherical Ag NPs with a diameter of about 15 ± 7 nm were either deposited on a pure silica glass or used directly in suspension in contact with 2,2′-bipyridine solutions. The SERS spectra of these deposits and suspensions, obtained with our experimental devices (Fig. S2 and S3†), were used to (i) estimate the order of magnitude of the enhancement factors of our nAAA substrates, (ii) study the changes in the Raman profiles between the different substrates, and (iii) probe the presence of Ag–N bonds.
The deposition of the 2,2′-bipyridine molecules on the surface of the SAS and AAA trilayers was achieved from a diluted solution (concentration varying from 1.6 × 10⁻⁷ M to 8.3 × 10⁻³ M) either via a dispersing spray or through the deposition of a droplet using a micro-syringe. The lowest corresponding surface concentrations of deposited molecules were then estimated to be between 0.5 and 3 molecules per nm2 (i.e., a total number of probed molecules ranging between 1.25 × 10⁶ and 7.5 × 10⁶ with the 20× objective). All SERS spectra were normalized per mW laser power and per second of accumulation time.
3. Results and discussion
3.1 Evidence of SERS enhancement
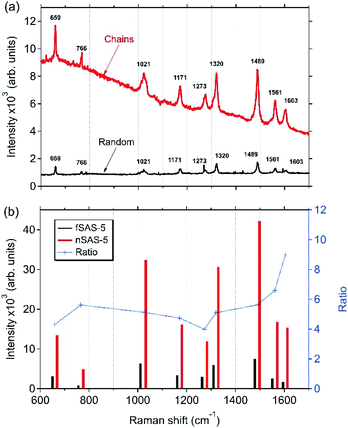
Fig. 4(a) displays the Raman spectra of bipyridine molecules (1.7 × 10⁻⁶ M) adsorbed on the surface of the fSAS-5 and nSAS-5 trilayers. These spectra were excited at 561 nm in order to be close to the SPR for both substrates in transverse polarisation. In both cases, despite the presence of the 5 nm-thick Si3N4 capping-layer, a significant Raman signal is clearly recorded, while, in the same Raman recording conditions, no Raman signal is observed when bipyridine molecules are deposited on a pure silica glass slide. Whereas clear evidence of Raman enhancement is thus obtained, Fig. 4(b) also shows that at this excitation wavelength, the ordered nSAS-5 trilayer gives more intense Raman signals, namely around 4 to 9 times higher in our experimental conditions than for the non-ordered fSAS-5 substrate. The NP chain nanostructure (nSAS-5 sample) thus allows a signal enhancement significantly stronger than without organisation (fSAS-5 sample), without changing the profile of the spectrum overall [Fig. 4(a)].The Raman spectra presented in Fig. 4 are entirely in accordance with what is expected for a SERS effect of bipyridine, whose vibrational modes have been fully interpreted for more than 20 years.25,31,32 Moreover, the detailed analysis of the Raman spectra in the range below 600 cm−1 (as shown for instance in Fig. 5) makes it possible to claim that no inelastic scattering signal is displayed around a Raman shift of 240 cm−1, neither for the nSAS-5 and fSAS-5 trilayers nor for the nAAA-5 and nAAA-7 trilayers, in contrast to what is seen in the case of colloidal Ag NPs in direct contact with bipyridine molecules (Fig. S3†) or for some probed spatial areas of the nAAA-3 substrate (Fig. 5). Indeed, as also observed in the case of colloidal Ag NPs covered with a thiol-functionalized C12 spacer that provides a protective layer between bipyridine molecules and Ag NPs (Fig. S4† and ref. 25), no Raman signature of the presence of Ag–N chemical bonds is detected.
The related data sets collected with our experimental Raman configuration are very consistent with the results published by Brolo et al.32 Thus, on the basis of these observations, we can propose that the vibrational bands observed in Fig. 4(a) for the fSAS-5 and nSAS-5 trilayers correspond to the SERS signals of bipyridine molecules adsorbed onto Si3N4 without chemical contact with silver and then without electron transfer or other ‘chemical’ process. Accordingly, the enhancement observed in Fig. 4 shall be only assignable to the near-field amplifying effects generated by the embedded plasmonic Ag nanostructures.
3.2 Influence of the capping-layer thickness
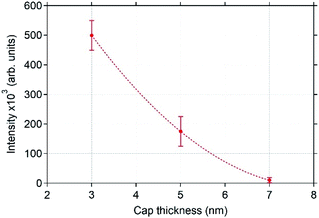 | ||
| Fig. 6 Decrease of the integrated intensity of the bipyridine Raman peak at 1490 cm−1 as a function of the capping-layer thickness (the vertical bars represent the standard deviation and the dotted line is a guide to the eye). Raman spectra of bipyridine molecules (1.7 × 10⁻⁴ M) adsorbed on the nAAA-3, nAAA-5, nAAA-7 trilayers were averaged over 9 measurements at different locations using a laser excitation wavelength of 633 nm. The polarisation of the electric field of the excitation was oriented parallel to the Ag NP chains. The data considered here for the nAAA-3 trilayer are those obtained from zones (purple areas in Fig. 5) without the signal at 240 cm−1, characteristic of chemical bonds between Ag atoms and bipyridine molecules. | ||
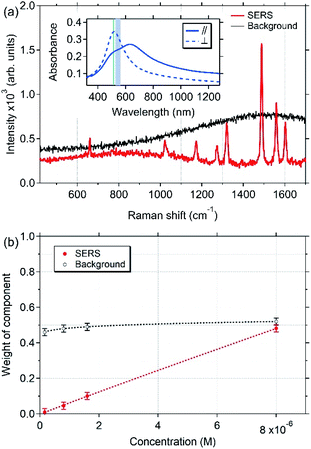
3.3 Influence of the bipyridine concentration and cleaning tests
A set of experiments was undertaken to monitor the dependence of the SERS enhancement upon the molecule concentration. Droplets of bipyridine solutions (200 μL) were deposited on a large area (around 10 mm2) of the surface of the nAAA-5 trilayer using a micro-syringe and the Raman spectra were excited at 514.53 nm with a transverse polarisation of the incident light [Fig. 7(a), inset]. For each concentration, SERS measurements were repeated 3 times on 9 different points of square targets. Between two SERS measurements, the surface was wiped with ethanol as a solvent followed by a water cleaning. A total of 108 spectra were then recorded in the range of concentration from 1.6 × 10⁻⁷ M to 8 × 10⁻⁶ M. Through this series of experiments, the robustness of the nAAA-5 SERS substrate has been highlighted, since the results were retrieved without noted ageing and with a standard deviation of ±20% on the Raman intensities. In order to obtain the different spectral sources constituting the experimental spectra and to follow their evolutions with the bipyridine concentration, we adopted a curve resolution method using all the spectral data. We used the Bayesian Positive Source Separation (BPSS) approach that was developed for spectral mixture analysis to provide an estimation of the unknown component spectra and the relative concentrations of the underlying species.34–36 Indeed, where spectroscopic techniques fail to resolve unknown or unstable individual constituents contained in multi-component mixtures, vibrational spectroscopies combined with BPSS treatment may offer a promising and efficient approach.36Fig. 7 displays the results of the BPSS method obtained from the 108 spectra collected with the nAAA-5 trilayer. It is worth noting that the SERS spectra consist of two components [Fig. 7(a)] whose behaviour as a function of solution concentration is different [Fig. 7(b)]. The first component corresponds to the Raman spectra of the bipyridine molecules (red curve), and is very similar to the usual SERS signal obtained without direct chemical interaction between silver and bipyridine. Accordingly, as seen in Fig. 7(b), the weight of this component increases linearly with the concentration. In contrast, the weight of the second component (black curve) is quasi-constant, which suggests that it corresponds to the ‘background’ contribution arising from the buried NPs and the surrounding Al2O3 matrix.All these results highlight the possibility of using quantitatively the nAAA-5 SERS substrate as an analytical reusable substrate. The capping layer not only prevents direct interaction between bipyridine molecules and Ag NPs, but also allows solvent cleaning of the substrate without loss of performance. Actually, we noticed that the substrate can be reused more than 200 times without deterioration of sensitivity whereas its ageing after six months is not significant. Nevertheless, owing to the presence of this capping layer, the probed molecules are kept away from the electric-field hot spots generated by the plasmonic assembly of Ag NPs, which certainly decreases the enhancement effects. As mentioned in Sec. 2.4, SERS spectra collected from different systems (i.e., stock 2,2′-bipyridine aqueous solutions, deposits of colloidal Ag NPs on surfaces or colloidal suspensions, Fig. S2 and S3†) with the same experimental spectroscopic configurations were used to estimate the order of magnitude of the enhancement factors of our substrates. Of course, this method of estimation may be flawed because spectral changes of the Raman signals may be caused both by electromagnetic or chemical effects when bipyridine molecules come in contact with colloidal Ag NPs or are surrounded by other molecules in a highly concentrated solution. However, the intensity ratios normalised to the molecule concentration allow us to claim that with a capping-layer thickness of τcap = 5 nm, the enhancement factor is decreased by about three to four orders of magnitude in comparison with colloidal Ag NPs deposited on a pure silica glass (Fig. S2†). Also, when compared to conventional Raman spectra, our PLANEDSERS substrate enhances by about two or three orders of magnitude the Raman signal at 1020 cm−1. Thus, our reusable PLANEDSERS substrates will be intended for a specific concentration range, where the objective would not be to reach measurements of traces but concentrations lower than 10−3 M, which corresponds to the usual limit of detection reached by conventional Raman spectroscopy.
4. Conclusions
To summarise, we have reported the successful design of a SERS substrate constituted of three layers: (1) a dielectric transparent buffer-layer with periodic nanoripples, (2) an assembly of self-aligned Ag NP chains with nanometer separation, and (3) a dielectric capping-layer that protects the plasmonic nanostructures from damaging effects (e.g., oxidation or coalescence) caused by contact with solutions (i.e., solutions of interest or cleaning solvents). In spite of this capping layer, SERS enhancement is demonstrated in a wide spectral range through polarisation- and wavelength-dependence of the SPR. Furthermore, higher enhancement is observed for ordered ellipsoidal NPs compared to randomly distributed spheroidal NPs. In contrast to periodic chains of uncapped NPs, these PLANEDSERS substrates appear as slides reusable and easy to store and preserve. Also, by preventing direct interaction between the NPs and the probed molecules, only electromagnetic effects contribute to the SERS intensity, which scales linearly with the concentration of analytes. These PLANEDSERS substrates, which appear non-selective to a specific molecular specie, might open up promising opportunities for investigating multi-component mixtures with quantitative feedback in a range typically between 10−3 to 10−6 M and with a limit of detection around 1.5 × 10⁻⁷ M.Author contributions
The manuscript was written through contributions of all authors. All authors have given approval to the final version of the manuscript.Conflicts of interest
There are no conflicts to declare.Acknowledgements
We acknowledge the assistance of Philippe Guérin during the sample preparation and the efficient maintenance of the Raman devices of Jean-Yves Mevellec. This work was partially funded by the “C'Nano” network (French National Competency Cluster in Nanosciences). This work pertains to the French Government program “Investissements d'Avenir” (LABEX INTERACTIFS, reference ANR-11-LABX-0017-01, and EUR INTREE, reference ANR-18-EURE-0010).Notes and references
- M. Fleischmann, P. J. Hendra and A. J. McQuillan, Chem. Phys. Lett., 1974, 26, 163–166 CrossRef CAS.
- D. L. Jeanmaire and R. P. Van Duyne, J. Electroanal. Chem., 1977, 84, 1–20 CrossRef CAS.
- S. Nie and S. R. Emory, Science, 1997, 275, 1102–1106 CrossRef CAS PubMed.
- P. J. Schuck, D. P. Fromm, A. Sundaramurthy, G. S. Kino and W. E. Moerner, Phys. Rev. Lett., 2005, 94, 017402 CrossRef CAS PubMed.
- J. F. Li, Y. F. Huang, Y. Ding, Z. L. Yang, S. B. Li, X. S. Zhou, F. R. Fan, W. Zhang, Z. Y. Zhou, D. Y. Wu, B. Ren, Z. L. Wang and Z. Q. Tian, Nature, 2010, 464, 392–395 CrossRef CAS PubMed.
- A. Bouvrée, A. D'Orlando, T. Makiabadi, S. Martin, G. Louarn, J.-Y. Mevellec and B. Humbert, Gold Bull., 2013, 46, 283–290 CrossRef.
- R. Hao, J. Lin, H. Wang, B. Li, F. Li and L. Guo, Phys. Chem. Chem. Phys., 2015, 17, 20840–20845 RSC.
- N. Guarrotxena and G. C. Bazan, Adv. Mater., 2014, 26, 1941–1946 CrossRef CAS PubMed.
- K. Zhao, J. Lin and L. Guo, RSC Adv., 2015, 5, 53524–53528 RSC.
- Y. F. Huang, H. P. Zhu, G. K. Liu, D. Y. Wu, B. Ren and Z. Q. Tian, J. Am. Chem. Soc., 2010, 132, 9244–9246 CrossRef CAS PubMed.
- B. Teiten and A. Burneau, J. Raman Spectrosc., 1997, 28, 879–884 CrossRef CAS.
- A. Chauvin, M. Lafuente, J.-Y. Mevellec, R. Mallada, B. Humbert, M. P. Pina, P.-Y. Tessier and A. El Mel, Nanoscale, 2020, 12, 12602–12612 RSC.
- S. Camelio, D. Babonneau, D. Lantiat, L. Simonot and F. Pailloux, Phys. Rev. B: Condens. Matter Mater. Phys., 2009, 80, 155434 CrossRef.
- M. Ranjan and S. Facsko, Nanotechnology, 2012, 23, 485307 CrossRef PubMed.
- K. P. Sooraj, M. Ranjan, R. Rao and S. Mukherjee, Appl. Surf. Sci., 2018, 447, 576–581 CrossRef CAS.
- D. Gkogkou, B. Schreiber, T. Shaykhutdinov, H. K. Ly, U. Kuhlmann, U. Gernert, S. Facsko, P. Hildebrandt, N. Esser, K. Hinrichs, I. M. Weidinger and T. W. H. Oates, ACS Sens., 2016, 1, 318–323 CrossRef CAS.
- B. Schreiber, D. Gkogkou, L. Dedelaite, J. Kerbusch, R. Hübner, E. Sheremet, D. R. T. Zahn, A. Ramanavicius, S. Facsko and R. D. Rodriguez, RSC Adv., 2018, 8, 22569–22576 RSC.
- R. P. Zaccaria, F. Bisio, G. Das, G. Maidecchi, M. Caminale, C. D. Vu, F. De Angelis, E. Di Fabrizio, A. Toma and M. Canepa, ACS Appl. Mater. Interfaces, 2016, 8, 8024–8031 CrossRef PubMed.
- E. Rezvani, O. Ualibek, B. Bulfin, G. Sugurbekova, G. S. Duesberg and I. Shvets, Phys. Status Solidi A, 2017, 214, 1700088 CrossRef.
- D. Babonneau, S. Camelio, E. Vandenhecke, S. Rousselet, M. Garel and F. Pailloux, Phys. Rev. B: Condens. Matter Mater. Phys., 2012, 85, 235415 CrossRef.
- S. Camelio, D. Babonneau, F. Pailloux, S. Rousselet and E. Vandenhecke, Nanosci. Nanotechnol. Lett., 2013, 5, 19–26 CrossRef CAS.
- S. Camelio, E. Vandenhecke, S. Rousselet and D. Babonneau, Nanotechnology, 2014, 25, 035706 CrossRef CAS PubMed.
- K. G. Schmitt, R. Schmidt, H. F. von-Horsten, G. Vazhenin and A. A. Gewirth, J. Phys. Chem. C, 2015, 119, 23453–23462 CrossRef CAS.
- S. Guan, O. Donovan-Sheppard, C. Reece, D. J. Willock, A. J. Wain and G. A. Attard, ACS Catal., 2016, 6, 1822–1832 CrossRef CAS.
- F. Forato, S. Talebzadeh, N. Rousseau, J.-Y. Mevellec, B. Bujoli, D. A. Knight, C. Queffélec and B. Humbert, Phys. Chem. Chem. Phys., 2019, 21, 3066–3072 RSC.
- D. Babonneau, E. Vandenhecke and S. Camelio, Phys. Rev. B, 2017, 95, 085412 CrossRef.
- A. Fafin, S. Camelio, F. Pailloux and D. Babonneau, J. Phys. Chem. C, 2019, 123, 13908–13917 CrossRef CAS.
- I. Horcas, R. Fernández, J. M. Gómez-Rodríguez, J. Colchero, J. Gómez-Herrero and A. M. Baro, Rev. Sci. Instrum., 2007, 78, 013705 CrossRef CAS PubMed.
- S. Camelio, D. Babonneau, T. Girardeau, J. Toudert, F. Lignou, M.-F. Denanot, N. Maître, A. Barranco and P. Guérin, Appl. Opt., 2003, 42, 674–681 CrossRef CAS PubMed.
- J. Grausem, B. Humbert, M. Spajer, D. Courjon, A. Burneau and J. Oswalt, J. Raman Spectrosc., 1999, 30, 833–840 CrossRef CAS.
- A. De Bonis, G. Compagnini, R. S. Cataliotti and G. Marletta, J. Raman Spectrosc., 1999, 30, 1067–1071 CrossRef CAS.
- A. G. Brolo, Z. Jiang and D. E. Irish, J. Electroanal. Chem., 2003, 547, 163–172 CrossRef CAS.
- A. Fafin, S. Yazidi, S. Camelio and D. Babonneau, Plasmonics, 2016, 11, 1407–1416 CrossRef CAS.
- S. Moussaoui, D. Brie, C. Carteret and A. Mohammad-Djafari, AIP Conf. Proc., 2004, 735, 237–244 CrossRef CAS.
- F. Quilès, C. Nguyeng-Trung, C. Carteret and B. Humbert, Inorg. Chem., 2011, 50, 2811–2823 CrossRef PubMed.
- C. Carteret, A. Dandeu, S. Moussaoui, H. Muhr, B. Humbert and E. Plasari, Cryst. Growth Des., 2009, 9, 807–812 CrossRef CAS.
Footnote |
| † Electronic supplementary information (ESI) available: Raman spectra of aqueous solutions of bipyridine (a stock-solution and a dilution in contact with a colloidal dispersion of Ag NPs), Raman spectra of a colloidal suspension of bipyridine in contact with Ag NPs deposited on a silica slide, SERS spectrum of a bipyridine dilution in contact with a colloidal dispersion of Ag NPs functionalized by a thiol-functionalized C12 spacer. See DOI: 10.1039/d1na00586c |
| This journal is © The Royal Society of Chemistry 2021 |

