 Open Access Article
A novel zinc sulfide impregnated carbon composite derived from zeolitic imidazolate framework-8 for sodium-ion hybrid solid-state flexible capacitors†
Vishal
Shrivastav‡
ab,
Shashank
Sundriyal‡§
 a,
Priyanshu
Goel
ab,
Avishek
Saha
a,
Umesh K.
Tiwari
*ab and
Akash
Deep
a,
Priyanshu
Goel
ab,
Avishek
Saha
a,
Umesh K.
Tiwari
*ab and
Akash
Deep
 *ab
*ab
aCSIR-Central Scientific Instruments Organisation (CSIR-CSIO), Chandigarh-160030, India. E-mail: dr.akashdeep@csio.res.in; umeshtiwari@csio.res.in
bAcademy of Scientific and Innovative Research (AcSIR-CSIO), Ghaziabad-201002, India
First published on 7th September 2021
Abstract
The pyrolysis of metal–organic frameworks (MOFs) is an easy approach to prepare metal oxides as well as nanoporous carbon with high specific surface area. In the present work, for the first time, ZIF-8 (zeolitic imidazolate framework-8) has been pyrolyzed under different conditions to derive two products, i.e., highly porous carbon (C) and zinc sulfide (ZnS) infused carbon (ZnS@C). These two materials, i.e., nanoporous C and ZnS@C, have been investigated as a negative and a positive electrode, respectively, for potential application in a hybrid asymmetrical solid-state supercapacitor device (HASD). The controlled pyrolysis approach for the preparation of ZnS@C has yielded uniformly distributed ZnS nanoparticles inside the carbon structure. A 1.8 V HASD has been assembled, which delivered an excellent energy density of 38.3 W h kg−1 (power density of 0.92 kW kg−1) along with the greatly desirable feature of cycling stability. The proposed selection of materials as electrodes is promising to develop futuristic hybrid capacitors.
1. Introduction
The existing energy storage devices (ESDs) need technological improvements to meet the future requirements of high energy (ED) and power density (PD) delivery and long cycle life.1,2 Supercapacitors have shown potential to meet such requirements, e.g., in automobile and other power-demanding applications.3 Among the symmetrical (SSC) and asymmetrical (ASC) configurations, the former design does not necessarily deliver sufficient ED because of the relatively narrow potential windows. The latter configuration (ASC), with two electrodes of different materials, offers some distinct charge storage properties, e.g., high ED and wide operating potential windows.4 In a hybrid configuration, one electrode works on the principle of faradaic processes while the second might follow non-faradaic behavior, i.e., electric double layer capacitance (EDLC).Most of the ASCs are based on sulfide or oxide-based electrodes and they function via a redox type charge storage mechanism. However, some technological challenges need to be addressed, e.g., poor electrode stability due to the partially irreversible redox reactions.5,6 At times, the limitation of low PD is encountered because of the less conductive nature of the oxide/sulfide based electrodes and the structural changes in the electrode material during the charging/discharging steps. The use of composites is a solution to obtain better conductivity.7,8 For the preparation of an efficient composite electrode material, a uniform distribution of the components is one of the most desirable conditions.9,10 For instance, the oxides or sulfides should be well distributed within the porous structure of a conductive additive (e.g., C).8,11 Such structural configurations help in achieving better electrical charge transport and the much required control of volume changes during the charging–discharging processes.
Metal–organic frameworks (MOFs) have been explored in a wide range of applications owing to their exceptional properties, such as large surface area, wide range of pore size distribution, thermal stability, etc.12 However, in the context of their energy storage applications, most MOFs possess limited electrical conductivity and may undergo crystal deformation during the redox reactions. The above issues limit the applications of MOFs in energy storage devices.13,14 Nonetheless, various suitable MOFs can be used as a sacrificial framework to derive other functional materials like carbon, oxides, sulfides, phosphides, and nitrides. Due to the hierarchical structure and coordinate linkages between the metal center and organic linker, the pyrolysis of MOFs facilitates an even distribution of components within the composite structure.15,16 The metal part can be transformed into metal oxide/sulfides/phosphides (faradaic nature) while the organic linker dissociates to get converted into carbon. Therefore, the pyrolysis of MOFs can yield useful composite materials for energy storage applications. Zhao et al. utilized the above strategy to convert a Co-MOF into nano-architectured CoSe2 microcubes, which showed electrocatalytic behavior toward the hydrogen evolution (HER) and oxygen evolution (OER) reactions.17 Similarly, Cu-MOF and Ni-MOF were used to derive Cu3N–Cu3P and Ni3N heterostructures, respectively for the HER application.18,19 Li et al. have worked on the utilization of MOFs for preparing carbon composites (Co–Nx/C).20 This homogeneous mixture of Co–Nx and C exhibited good electrocatalytic activity toward the OER. Likewise, Fe-SBU (iron 2,5-dihydroxyterephthalic acid) was incorporated into a ZIF-67 matrix and the resulting matrix (Fe-SBU@Co-Matrix) was proposed for the OER application.21 A MOF@COF (COF = covalent organic framework) was used to derive a N doped carbon@COF structure that could exhibit a high activity toward the oxygen reduction reaction (ORR).22 Young et al. have demonstrated the conversion of a bimetallic MOF (NiCo-MOF-74) into a hybrid heterostructure (e.g., carbon, metal, and metal oxide) which was further used in a supercapacitor.23 The above heterostructure material showed a high capacitance of 715 F g−1 at a discharge rate of 1 A g−1. The presence of graphitic carbon with uniformly doped binary mixed metals was responsible for the excellent output realized in the above study.
Due to their high oxidation states and effective electronic pathways, sulfides have attracted the attention of many researchers in the field of ESDs in recent years. In particular, zinc sulfide (ZnS) has emerged as an attractive candidate because of the features of high conductivity, high stability, and vast morphological properties.24 However, ZnS based supercapacitors might encounter the problems of material aggregation during electrode preparation and volume expansion during the charge–discharge cycles.25,26 As demonstrated in the present study, a Zn-based MOF can be utilized as a sacrificial template to derive the ZnS@C composite which not only addresses the issue of material aggregation but also facilitates fast electronic charge transfer due to the presence of carbon. Moreover, the mesoporous nature of the precursor MOF microstructure ensures that the ZnS nanoparticles forming during the pyrolysis step confine well inside the carbon microstructure. Such a composite material (ZnS@C) is likely to be a useful supercapacitor electrode with both EDLC and pseudocapacitance based charge storage mechanisms. Apart from this, ZIF-8 has also been pyrolyzed completely into a nanoporous carbon (NPC) material, which is used as a second supercapacitor electrode in the asymmetric supercapacitor (ASC) configuration. We have prepared the ZIF-8 precursor using relatively harmless chemicals (e.g., zinc acetate and 2-methylimidazole), demonstrating the environment friendliness of the whole approach.27
The ASC device has yielded an outstanding ED of 38.3 W h kg−1 with a high PD of 0.92 kW kg−1. The novelty of this work lies in the fact that the application of the ZnS infused carbon composite, derived from a MOF, has not been reported for supercapacitors to the best of our knowledge. Additionally, the use of a single MOF as a template material for the preparation of both positive and negative electrode materials, applicable in a hybrid ASC device, is seldom explored. We have investigated the pyrolysis of the MOF at different temperatures so as to obtain optimized pore size evolution in the carbon structure. This becomes relevant as the present study also shows the effects of the surface area and the presence of different pore sizes on the electrochemical performance. A number of important electrochemical performance parameters have been identified to establish the best values of capacitance, ED, PD, and charge–discharge stability. The proposed approach of preparing a functional composite can also be extended to other MOFs with different linkers and metal ions. This might lead to realization of novel supercapacitor electrodes possessing combined EDLC and redox features.
2. Results and discussion
The detailed synthesis of ZIF-8 and its conversion to carbon and the composite is described in the ESI.† The X-ray diffraction (XRD) pattern of ZIF-8 is provided in Fig. S1 of the ESI.† Various other optimization steps along with the experimental conditions are also mentioned in the ESI.† The methods of electrode preparation and electrochemical studies are given in ESI Section S1.2.3.† The different ZIF-8 derived carbon products are denoted as ZFC-n (ZFC = zinc-free carbon, n = pyrolysis temperature). Based on the optimization results, ZFC-800 is found to possess a larger specific surface area than ZFC-700 and ZFC-900. Since ZFC-800 has been used in all the other electrochemical investigations, it is denoted as ZFC for the sake of clarity in the text. The zinc sulfide-loaded carbon (ZnS@C) is denoted as ZLC. For the assembly of the hybrid asymmetric supercapacitor (ASC) device, ZFC-n and ZLC have been chosen as the negative and the positive electrodes, respectively. The primary characterization and the electrochemical testing of ZFC and ZLC are described in the subsequent subsections. The detailed characterization of different ZFC-n products is provided in the ESI.†2.1 Positive electrode
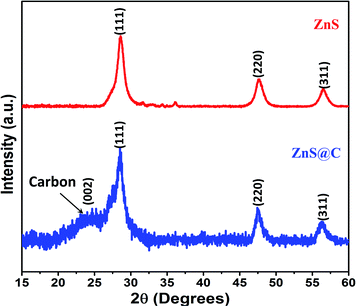
The XRD pattern of the ZnS@C (ZLC-800 or ZLC) indicates that it is a ZnS infused carbon composite (Fig. 1). The characteristic peaks of ZnS at 2θ of 28°, 47.5°, and 56.2° are attributed to the (111), (220), and (311) planes, respectively.24,28 These peaks verify the presence of ZnS in the cubic phase (spherulite).29 The EDS analysis of the ZLC sample further confirms the purity and the ratio of ZnS to C in the prepared sample (Fig. S4†). Based on the XRD and EDS studies, the formation of impurity-free ZLC is confirmed.
X-ray photoelectron spectroscopy (XPS) of the ZLC was performed to explore the surface composition. The survey scan is shown in Fig. 2a. The spectrum reveals the C 1s, O 1s, S 2p, Zn 2p, and N 1s peaks at their appropriate positions. The Zn and S peaks confirm the presence of the desired elements in the sample. Since carbon is present as the largest fraction, the C 1s peak is of highest intensity. Furthermore, the high-resolution XPS (HRXPS) spectrum was recorded and the data of C 1s, Zn 2p, and S 2p peaks are given in Fig. 2b–d. The deconvolution of the C 1s spectrum yields four peaks at binding energies assigned to different carbon bonds with other elements (Fig. 2b). The HRXPS of Zn 2p and S 2p spectra are found to be split into two peaks at their own specific binding energies associated with the spin–orbit coupling of the p orbital. In these spectra of Zn 2p and S 2p, the corresponding binding energies of the peaks can be attributed to the bonding in ZnS. The actual peak of Zn metal is observed at around 1021.7 eV for 2p3/2; however it shifts towards higher energies (e.g., 1022 eV) due to sulfur.30 Similarly, the binding energy of 161.6 eV for S 2p3/2 is also assigned to ZnS.31 The HRXPS for O 1s and N 1s are provided in Fig. S5.† The resolved peaks of O 1s at 533.2 eV and 532.5 eV correspond to the C–O–H and C–O–C bonds.32 The low-intensity peak at 530.8 eV is ascribed to a small amount of impurity (Zn–O).33 A small fraction of ZnO might have formed as some Zn reacted with oxygen during the hydrothermal reaction. Nonetheless, this impurity is relatively very small and not identifiable in the X-ray diffraction pattern. The resolved HRXPS of N 1s shows two peaks at 399.5 eV and 398.1 eV, assigned to the different bonding configurations of nitrogen with carbon (Fig. S5b†).32 The presence of nitrogen in the carbon structure is usually considered favorable for supercapacitor applications as it contributes toward electrical conductivity.34
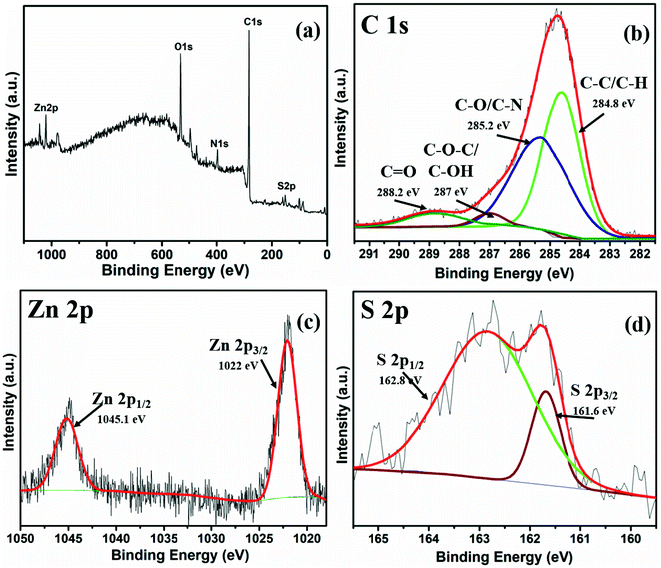 | ||
| Fig. 2 XPS characterization of ZLC. (a) Survey scan; (b–d) high-resolution spectra of C 1s, Zn 2p, and S 2p. | ||
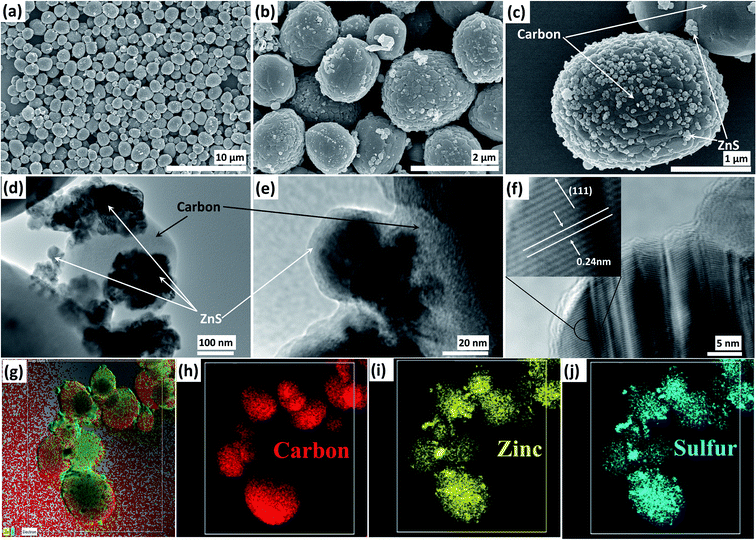
Fig. 3a–c present the SEM based morphological analysis of ZLC. Carbon particles can be seen as large size spherical structures, in which ZnS nanoparticles are almost homogeneously distributed. The appearance of the ZnS nanoparticles on the carbon surface can be linked with volume expansion occurring during the conversion of zinc metal to ZnS. Note that the morphology of the material can influence some of the critical electrochemical aspects of the material, such as electrical conductivity and diffusion of ions. A spherical microstructure of carbon provides open spaces for the transfer of electrolyte ions inside the pores of the active electrode material. Furthermore, the nanosized ZnS particles allow a highly exposed surface area to facilitate the surface faradaic reactions. Thus, the synergy between the conductive pathways of carbon and high surface area of infused ZnS nanoparticles would guarantee high and stable electrochemical activity. As another advantage, the porous carbon structure can withstand volume changes induced during the ZnS nanoparticle catalyzed faradaic reactions. Based on SEM studies, the average size of the ZLC particles has been assessed to be around 1.5 μm. The TEM and HRTEM analyses (Fig. 3d–f) also confirm the distribution of ZnS nanoparticles in the carbon shell. The d spacing of the ZnS nanoparticles can be distinguished, which further confirms the crystalline nature of the ZnS nanoparticles (Fig. 3f). The defects in the ZnS nanoparticles, as observed in the HRTEM image, correspond to the screw and edge dislocations. Furthermore, the elemental mapping of the ZLC has been performed to determine the distribution of the elements (Fig. 3g–j). Zinc and sulfur are distributed all over the carbon structure. It is to be noted that the ZnS nanoparticles are not aggregated and appear in relatively small lumps. Some bigger lumps are observed at some locations where ZnS nanoparticles protrude from the carbon structure.
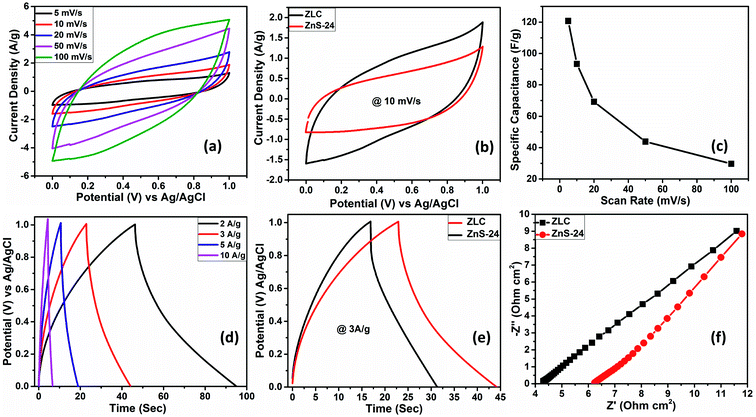
The variation of the specific capacitance of ZLC as a function of scan rate is shown in Fig. 4c. The ZLC electrode exhibits an excellent capacitance of 120.7 F g−1 at a scan rate of 5 mV s−1 that decreases to 29.6 F g−1 with a 20-fold (100 mV s−1) increase in the scan rate. The decrease in the specific capacitance at large scan rates can be associated with the hindered adsorption of the electrolyte ions within the pores of the electrode material and the incomplete surface reactions.36
GCD studies are useful to determine the practical supercapacitor performance of the electrode materials as these experiments allow accurate estimations of the specific capacitance values (eqn (S2) of the ESI†). The GCD data for the ZLC electrode within a potential window similar to that chosen in the CV experiments at varying current densities (2, 3, 5, and 10 A g−1) are shown in Fig. 4d. The ZLC electrode (as a positive electrode) yields a specific capacitance of 127.8 F g−1 at 2 A g−1. The specific capacitance decreases upon increasing the current density, e.g., 36.3 F g−1 at 10 A g−1. Like the observations made during the CV studies at high scan rates, the GCD studies also point to a decrease in the specific capacitance at high current densities. Fig. 4e shows the comparative GCD data of the bare ZnS and ZLC electrodes. This study clearly indicates that the ZLC electrode can deliver a better specific capacitance with a larger discharge time than the bare ZnS electrode. A better performance of the ZLC electrode is associated with more effective transport of electrolyte ions. The presence of carbon encapsulating the ZnS nanoparticles also contributed to a better electrochemical performance. The ZnS nanoparticles remained well confined within the mixed micro- and meso-porous phase carbon shell, which aided in preventing agglomeration. In the bare ZnS electrode, the agglomeration of the nanoparticles (Fig. S3†) affects the electrochemical output. Though some agglomeration of ZnS nanoparticles can also be seen in ZLC it is much less than in the bare ZnS. A highly porous carbon shell also facilitates a large surface-to-volume ratio for the faradaic reactions. The variation of specific capacitance of the ZLC electrode at different current densities is shown in Fig. S8a.†
Electrochemical impedance spectroscopy (EIS) has been performed on both the ZLC and bare ZnS electrodes. Nyquist plots, depicting the relationship between the real and imaginary parts of the impedance, are shown in Fig. 4f. The starting point of the curve (corresponding to the ohmic nature of the system) defines the effective series resistance (ESR), which is the sum of resistances from the electrolyte, electrode material, and current collector. The ZLC electrode shows a lower ESR value (4.29 Ω) than the bare ZnS electrode (6.23 Ω). This improved property of ZLC can be attributed to the confinement of ZnS nanoparticles within the carbon shell. The absence of a significant semicircular shape in the Nyquist plot indicates that the system possesses negligible charge transfer resistance. Beyond the semicircular shape is the diffusion region, which can be used to identify the nature of the charge storage mechanism, i.e., diffusion processes. The above studies conclude that the presence of carbon has facilitated conductive pathways and as a result the ZLC electrode displays both EDLC and pseudocapacitance based charge storage. The pseudocapacitance mechanism is helpful in achieving a high specific capacitance, while the involvement of EDLC processes would ensure cycling stability. Thus, ZLC is a potentially attractive positive electrode material for HASD applications.
| CT = Co + CD | (1) |
The above two types of process are dependent on the scan rate (ν) as per the Cottrell equation (eqn (2)),
 | (2) |
 | (3) |
 | (4) |
 and
and  , respectively.
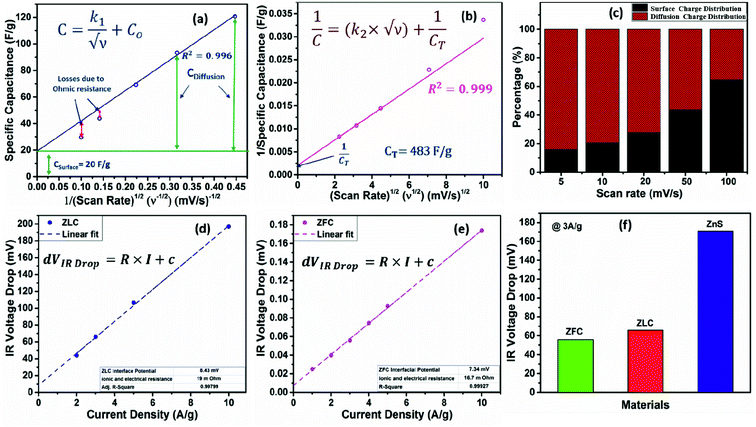
The CV data have been used to investigate the surface and diffusion charge contributions as per the above defined equations. The variation of specific capacitance with  is plotted in Fig. 5a. A linear relationship is observed at lower scan rates (ν) and these data points have been used to fit the curve. At higher ν, a non-linearity in the curve is observed because of the increase in ohmic resistance. The fitting model is based on the fact that the diffusion of charges in the material would decrease with increasing ν because under these conditions the ions do not diffuse completely inside the bulk material. Therefore, at relatively high ν, the surface charge contribution-based charge storage mechanism dominates. The linearity of the fitted data has been extrapolated to the zero point to simulate very high ν conditions. At this point, the contribution of the surface capacitance was recorded to be 20 F g−1. Similarly, the variation of 1/CT with
  is shown in Fig. 5b. The extrapolation of the linear line toward the origin gives an estimation of the total capacitance. Fig. 5c depicts the contribution of the diffusion charge based mechanism to the total capacitance of the material. The extents of the surface and diffusion charge contributions towards the total capacitance have also been investigated. It has been observed that at lower scan rates the diffusion of the electrolyte is the dominating factor toward the total capacitance. However, at high scan rates the surface charge contribution becomes more prominent. For instance, the surface charge contribution is only 15% at 5 mV s−1 but it surpasses 50% at 100 mV s−1.
| dVIR drop ∝ I | (5) |
| dVIR drop = R × I + c | (6) |
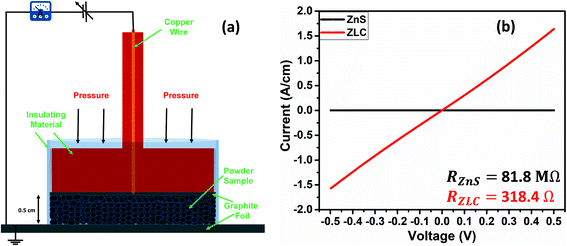
Using eqn (6), the value of R can be assessed from the slope of the straight line. Since the present study has also investigated zinc-free carbon (ZFC) as a negative electrode for the assembly of a hybrid asymmetric supercapacitor device (HASD), the extent of voltage (IR) drop was also studied for ZFC, maintaining identical experimental conditions, including the electrolyte. The linear curves for ZLC and ZFC are fitted and shown in Fig. 5d and e. A comparison of dVIR drop observed in ZFC, ZLC, and bare ZnS electrodes is summarized in Fig. 5f. The curve for the ZLC electrode exhibits a larger slope (corresponding to 19 mΩ) than that of the ZFC (16.7 mΩ). The additional presence of ZnS nanoparticles in ZLC could be attributed to its higher charge transfer resistance than that of the ZFC. Furthermore, the bare ZnS electrode shows the highest dVIR drop values, indicating a larger resistance in this material (74.7 mΩ). Apparently, ZnS nanoparticles, when mixed with carbon black, could not form as efficient interface as we obtained in the ZLC material. Therefore, despite adding carbon black, the electrochemical performance of the bare ZnS doesn't seem to match that of the ZLC electrode. These results clearly highlight the advantage of using the ZIF-8 MOF as a precursor material to derive ZnS loaded carbon (ZLC). The conversion of ZIF-8 into ZLC is characterized by a regular and effective infiltration of the ZnS nanoparticles in the carbon shell. Due to the crystalline nature of ZIF-8, we obtained an electrically conducting phase of carbon, in which ZnS was infiltrated almost uniformly. The ZLC composite has nanoscale interfacial contact between the ZnS and carbon components. The ZnS nanoparticles, once introduced into the carbon shell, are unlikely to encounter the issue of aggregation and as a result they maintain robust surface-to-volume contact with carbon. The results obtained in the present study demonstrate the advantages of using a MOF as a template to obtain effective composite materials whose preparation otherwise is not as straightforward. We have also measured the comparative current–voltage (IV) characteristics (electrical resistance) of the ZLC and bare ZnS in powdered sample form using an in-house fabricated device (schematic shown in Fig. 6a). The ZLC material possesses much lower electrical resistance than the bare ZnS (Fig. 6b).
2.2 Fabrication and electrochemical analysis of the HASD
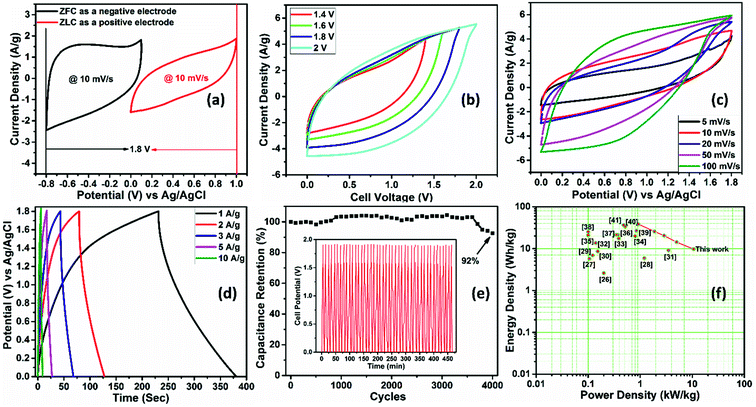
After confirming the excellent electrochemical performance of the positive (ZLC) and negative (ZFC) electrode materials, we assembled a hybrid asymmetrical supercapacitor device (HASD). It might be mentioned here that assembling a symmetrical supercapacitor is easier than assembling a HASD because in the former configuration both the electrodes are identical, i.e., same material with equal weight. Nevertheless, maintaining an equal mass of material on the positive and negative electrodes may not always work in an optimal manner. The same electrode might deliver different specific capacitances in positive and negative potential ranges. This can result in charge disbalance, causing a loss in the overall potential window of the device. Therefore, it is of significance to maintain a charge balance between the two electrodes. Note that it is of even greater importance in a HASD as it utilizes different materials on the positive and negative electrodes. To elaborate on this factor, the potential window ranges of ZLC and ZFC are shown in Fig. 7a. The exact weight loadings of the active material to maintain the above charge balance conditions are determined by the following eqn (7).| m+C+V+ = m−C−V− | (7) |
![[thin space (1/6-em)]](https://www.rsc.org/images/entities/char_2009.gif) :
:![[thin space (1/6-em)]](https://www.rsc.org/images/entities/char_2009.gif) 1 (1.1 mg ZLC and 1 mg ZFC). The above two electrodes were assembled to realize a HASD employing PVA–1 M Na2SO4 as a gel electrolyte. The HASD was tested under various cell potential windows (up to 2 V) at a fixed scan rate of 20 mV s−1 (Fig. 7b). The CV characteristics of the device indicate the emergence of semi-rectangular curves with an increase in potential window. This observation points toward the functioning of the device via hybrid EDLC and faradaic type charge storage processes. The edge of the CV curve becomes smaller particularly for the 2 V range, suggesting a reduction in the specific capacitance. Note that the extent of specific capacitance is directly proportional to the area under the CV curve. Therefore, the optimized potential window was established as 1.8 V. This experimentally optimized potential window range is in excellent agreement with the data shown in Fig. 7a revealing the individual potential window ranges of the positive and negative electrodes. The operation of the device at broader potential windows caused the undesirable evolution of H2 and O2 gases as evidenced by a rapid increase in the current values at the outer edge of the CV curve for the 2 V window (Fig. 7b). The evolution of the gas at the electrodes would result in a low coulombic efficiency from the device (Fig. 7d).
1 (1.1 mg ZLC and 1 mg ZFC). The above two electrodes were assembled to realize a HASD employing PVA–1 M Na2SO4 as a gel electrolyte. The HASD was tested under various cell potential windows (up to 2 V) at a fixed scan rate of 20 mV s−1 (Fig. 7b). The CV characteristics of the device indicate the emergence of semi-rectangular curves with an increase in potential window. This observation points toward the functioning of the device via hybrid EDLC and faradaic type charge storage processes. The edge of the CV curve becomes smaller particularly for the 2 V range, suggesting a reduction in the specific capacitance. Note that the extent of specific capacitance is directly proportional to the area under the CV curve. Therefore, the optimized potential window was established as 1.8 V. This experimentally optimized potential window range is in excellent agreement with the data shown in Fig. 7a revealing the individual potential window ranges of the positive and negative electrodes. The operation of the device at broader potential windows caused the undesirable evolution of H2 and O2 gases as evidenced by a rapid increase in the current values at the outer edge of the CV curve for the 2 V window (Fig. 7b). The evolution of the gas at the electrodes would result in a low coulombic efficiency from the device (Fig. 7d).
After optimizing the working potential window, the device was scanned at different scan rates (Fig. 7c). The CV curves are not completely rectangular in shape at low scan rates, suggesting charge storage via a combination of surface charge and diffusion processes. However, the CV curves attain an almost rectangular shape at high scan rates, indicating that the surface charge is the main contributor toward the achieved capacitance. The rectangular shape of the CV curves at high scan rates is also associated with restricted access of the electrolyte ions to the inner portion of the bulk material.
The GCD of the HASD was recorded at different current densities (1, 2, 3, 5, and 10 A g−1) in a working cell potential window of 1.8 V (Fig. 7d). Similar to the conclusion reached with the CV studies at high scan rates, the triangular GCD curves observed at higher current densities indicate a pure capacitive behavior. The discharge curves show some non-linearity at low current densities, highlighting that the total capacitance is a result of the mixed contribution of surface adsorption and diffusion processes. The device also exhibits lower coulombic efficiency at low scan rates/current densities as there is an evolution of H2 and O2 gases due to the slow movement of charges. The use of high scan rates or high current densities leads to a shift in the gas evolution potential toward higher values. This is elaborated in Fig. S11† with two representative CV curves of the same electrode at low (5 mV s−1) and high (100 mV s−1) scan rates.
The device delivered a maximum specific capacitance value of 85 F g−1 at a current density of 1 A g−1. The capacitance decreases to 21.6 F g−1 upon increasing the current density ten times, i.e., 10 A g−1. The variation of specific capacitance with scan rate and current density for the HASD is presented in Fig. S12.† The equations used to calculate the specific capacitance of the device are given in the ESI.†
The cycling stability of the HASD is a crucial test to assess its potential commercial viability. The device was tested for 4000 continuous charging–discharging cycles at a high current density of 20 A g−1 (Fig. 7e). As the results show, the device retains 92% of its initial capacitance even after 4000 cycles, which demonstrates the device's utility for long-term use. To determine the stability of the carbon structure, we performed the FESEM analysis of the electrode before and after the cycling tests (Fig. S13†). No significant change is observed in the morphology of the electrode, which supports a long-term suitability of the system during multiple events of electrolyte adsorption–desorption. The energy and power densities are also two important criteria of any energy storage device. The HASD delivers a high ED of 38.3 W h kg−1 at a PD of 0.92 kW kg−1. The variation of ED with increasing PD values is shown in the Ragone plot (Fig. 7f). The ED and PC characteristics of the HASD are attributed to the hybrid configuration, which uses one electrode composed of metal sulfides (pseudocapacitance) and the second made up of nanoporous carbon (EDLC). The mixed meso-/micro-porosity of the electrode material allows charge transfer with negligible resistance while the use of gel electrolyte also facilitates the fast kinetics of electrolyte ion diffusion.
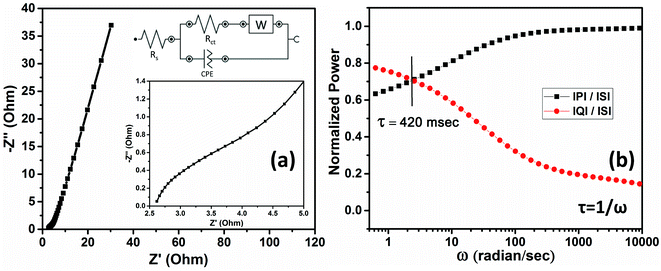
The EIS characteristics of the device have also been investigated. The Nyquist plot (Fig. 8a) contains two significant regions, i.e., high-frequency and low-frequency regions. The equivalent circuit is also shown in Fig. 8a. The values of ESR and Rct were estimated to be 2.6 Ω and 1.47 Ω, respectively. A vertical rise in the impedance value is observed in the high-frequency region, indicating a capacitive behavior. The intermediate region between the high and low frequency regions, having an impedance angle of 45° between the real and imaginary parts, is associated with Warburg resistance. The realization of the Warburg element is a result of the frequency-dependent movement of the electrolyte ions within the pores of the electrodes.
The relaxation time is a fundamental characteristic of a supercapacitor, representing its response time as a function of changing current direction. The shorter the relaxation time, the faster the response of the supercapacitor to the high-frequency AC. The relaxation time can be evaluated by plotting the power dissipation factor as a function of frequency.35 For the HASD, the plot of normalized power against the change in angular frequency is shown in Fig. 8b. More details on this topic and the equations used to calculate the normalized real and imaginary power are provided in the ESI.† The intersection of the real and imaginary normalized power is the point of relaxation angular frequency (ω). The relaxation time (1/ω) was calculated to be 420 milliseconds, which is small enough to outline the fast chemical kinetics behavior.
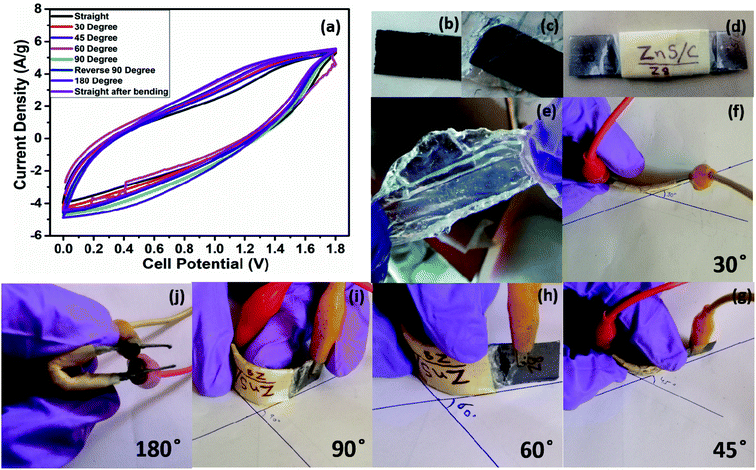
A comparison of the electrochemical performance of the herein presented HASD with that of previously reported supercapacitors is given in Table S2† and represented in a Ragone plot (Fig. 7f).37–52 As shown in Fig. 9, the HASD, containing a solid-state electrolyte, is fairly flexible as well. The vital characteristics (e.g., specific capacitance) of the HASD do not show any noticeable change even when it is operated at different bending angles, e.g., 30–180° (Fig. 9a).
3. Conclusion
The present study has elaborated the use of a single MOF (ZIF-8) precursor to prepare ZnS nanoparticle loaded carbon (ZLC) and zinc-free porous carbon (ZFC) materials which are then utilized as a positive and a negative electrode, respectively, for the assembly of a high-performance HASD. The pyrolysis of ZIF-8 is optimized at different temperatures in an inert atmosphere to identify the best conditions for the preparation of electrode materials with respect to the critical features of large specific surface area, pore size distribution, and high conductivity. The optimized ZFC material, when used as the negative electrode, operates in a potential window of 0.1 to −0.8 V and delivers a high specific capacitance of 145.7 F g−1 (current density of 2 A g−1). The ZLC material is characterized by uniformly distributed ZnS nanoparticles inside the porous carbon shell. The ZLC material has proven to be a useful positive electrode material, operatable in a potential window of 0–1 V, while exhibiting a high specific capacitance of 127.8 F g−1 at a current density of 2 A g−1. Using the ZLC and ZFC electrodes, a hybrid asymmetric supercapacitor device (HASD) is successfully assembled which could operate within a wide potential window of 1.8 V. The use of PVA–1 M Na2SO4 as a gel electrolyte has allowed the fabrication of a flexible device. This device exhibited an excellent ED at a high power density and more than 90% of its initial capacitance could be retained even after 4000 charging/discharging cycles.The use of ZIF-8 as a precursor and the experimental strategy adopted for the preparation of ZFC have yielded a composite which contains well-distributed ZnS nanoparticles within the porous and conducting carbon shell. The approach can also be extended to other MOFs with different linkers and metal ions to obtain novel composites for energy storage applications.
Author contributions
V. Shrivastav performed the experimental work including materials synthesis, electrochemical studies, and device fabrication. S. Sundriyal planned the experimental protocols, and contributed to the electrochemical studies, manuscript drafting, and data interpretation. P. Goel contributed to the analysis of materials and electrochemical characterization. A. Saha contributed to data interpretation and manuscript correction. U. K. Tiwari supervised the research and contributed to data analysis and manuscript preparation. A. Deep directed the project, supervised the research work, and edited the manuscript.Conflicts of interest
There are no conflicts to declare.Acknowledgements
SS and VS thank the University Grants Commission (UGC), India for their research fellowships. The financial support through the CSIR project (MLP-2006) is gratefully acknowledged. The authors acknowledge the Sophisticated Analytical Instrumentation Facility (SAIF) and CIL facility, Panjab University, Chandigarh, India for the SEM and TEM characterization data.References
- P. Poizot and F. Dolhem, Energy Environ. Sci., 2011, 4, 2003–2019 RSC.
- P. Simon, Y. Gogotsi and B. Dunn, Science, 2014, 343, 1210–1211 CrossRef CAS PubMed.
- J. Chmiola, G. Yushin, Y. Gogotsi, C. Portet, P. Simon and P. Taberna, Science, 2006, 313, 1760 CrossRef CAS PubMed.
- H. Wu and K. Lian, J. Power Sources, 2018, 378, 209–215 CrossRef CAS.
- P. Simon and Y. Gogotsi, Nanoscience and Technology: a Collection of Reviews from Nature Journals, World Scientific, 2010, pp. 320–329 Search PubMed.
- V. Augustyn, P. Simon and B. Dunn, Energy Environ. Sci., 2014, 7, 1597–1614 RSC.
- S. Sundriyal, M. Sharma, A. Kaur, S. Mishra and A. Deep, J. Mater. Sci.: Mater. Electron., 2018, 29, 12754–12764 CrossRef CAS.
- S. Sundriyal, V. Shrivastav, H. Kaur, S. Mishra and A. Deep, ACS Omega, 2018, 3, 17348–17358 CrossRef CAS.
- M. Yang, X. Hu, Z. Fang, L. Sun, Z. Yuan, S. Wang, W. Hong, X. Chen and D. Yu, Adv. Funct. Mater., 2017, 27, 1701971 CrossRef.
- B. You, N. Jiang, M. Sheng, S. Gul, J. Yano and Y. Sun, Chem. Mater., 2015, 27, 7636–7642 CrossRef CAS.
- J. J. Alcaraz-Espinoza, C. P. de Melo and H. P. de Oliveira, ACS Omega, 2017, 2, 2866–2877 CrossRef CAS PubMed.
- V. Shrivastav, S. Sundriyal, P. Goel, H. Kaur, S. K. Tuteja, K. Vikrant, K.-H. Kim, U. K. Tiwari and A. Deep, Coord. Chem. Rev., 2019, 393, 48–78 CrossRef CAS.
- S. K. Bhardwaj, A. L. Sharma, N. Bhardwaj, M. Kukkar, A. A. Gill, K.-H. Kim and A. Deep, Sens. Actuators, B, 2017, 240, 10–17 CrossRef CAS.
- A. E. Baumann, D. A. Burns, B. Liu and V. S. Thoi, Commun. Chem., 2019, 2, 1–14 CrossRef.
- X. Shi, Z. Zhang, K. Du, Y. Lai, J. Fang and J. Li, J. Power Sources, 2016, 330, 1–6 CrossRef CAS.
- J. Ma, W. Liu, X. Liang, B. Quan, Y. Cheng, G. Ji and W. Meng, J. Alloys Compd., 2017, 728, 138–144 CrossRef CAS.
- A. Zhao, G. Xu, Y. Li, J. Jiang, C. Wang, X. Zhang, S. Zhang and L. Zhang, Inorg. Chem., 2020, 59, 12778–12787 CrossRef CAS.
- Q. Wang, Z. Zhang, X. Zhao, J. Xiao, D. Manoj, F. Wei, F. Xiao, H. Wang and S. Wang, ChemElectroChem, 2020, 7, 289–298 CrossRef CAS.
- S. Hu, S. Wang, C. Feng, H. Wu, J. Zhang and H. Mei, ACS Sustainable Chem. Eng., 2020, 8, 7414–7422 CrossRef CAS.
- J. Li, W. Xia, J. Tang, H. Tan, J. Wang, Y. V. Kaneti, Y. Bando, T. Wang, J. He and Y. Yamauchi, Nanoscale Horiz., 2019, 4, 1006–1013 RSC.
- L. Meng, L. Zhang, Y. Zhu, H. Jiang, Y. V. Kaneti, J. Na, Y. Yamauchi, D. Golberg, H. Jiang and C. Li, Nanoscale, 2021, 13, 1213–1219 RSC.
- S. Zhang, W. Xia, Q. Yang, Y. V. Kaneti, X. Xu, S. M. Alshehri, T. Ahamad, M. S. A. Hossain, J. Na and J. Tang, Chem. Eng. J., 2020, 396, 125154 CrossRef CAS.
- C. Young, J. Kim, Y. V. Kaneti and Y. Yamauchi, ACS Appl. Energy Mater., 2018, 1, 2007–2015 CrossRef CAS.
- M. S. Javed, J. Chen, L. Chen, Y. Xi, C. Zhang, B. Wan and C. Hu, J. Mater. Chem. A, 2016, 4, 667–674 RSC.
- M. Mao, L. Jiang, L. Wu, M. Zhang and T. Wang, J. Mater. Chem. A, 2015, 3, 13384–13389 RSC.
- R. Ramachandran, M. Saranya, P. Kollu, B. P. Raghupathy, S. K. Jeong and A. N. Grace, Electrochim. Acta, 2015, 178, 647–657 CrossRef CAS.
- C. Kirchner, T. Liedl, S. Kudera, T. Pellegrino, A. Muñoz Javier, H. E. Gaub, S. Stölzle, N. Fertig and W. J. Parak, Nano Lett., 2005, 5, 331–338 CrossRef CAS.
- F. A. La Porta, J. Andrés, M. S. Li, J. R. Sambrano, J. A. Varela and E. Longo, Phys. Chem. Chem. Phys., 2014, 16, 20127–20137 RSC.
- Y. Li, L. Zhang, K. Kisslinger and Y. Wu, Opt. Mater. Express, 2014, 4, 1140–1150 CrossRef CAS.
- K. Laajalehto, I. Kartio and P. Nowak, Appl. Surf. Sci., 1994, 81, 11–15 CrossRef CAS.
- L. Dake, D. Baer and J. Zachara, Surf. Interface Anal., 1989, 14, 71–75 CrossRef CAS.
- L. T. Dall'Agnol, Deeper insights into SRB-driven biocorrosion mechanisms, Doctoral dissertation, Universidade NOVA de Lisboa, Portugal, 2013, pp. 1–149.
- T. L. Barr, M. Yin and S. Varma, J. Vac. Sci. Technol., A, 1992, 10, 2383–2390 CrossRef CAS.
- Y. Hu, H. Liu, Q. Ke and J. Wang, J. Mater. Chem. A, 2014, 2, 11753–11758 RSC.
- A. Singh and A. Chandra, Sci. Rep., 2015, 5, 15551 CrossRef CAS PubMed.
- V. Shrivastav, S. Sundriyal, P. Goel, V. Shrivastav, U. K. Tiwari and A. Deep, Electrochim. Acta, 2020, 345, 136194 CrossRef CAS.
- W. H. Li, K. Ding, H. R. Tian, M. S. Yao, B. Nath, W. H. Deng, Y. Wang and G. Xu, Adv. Funct. Mater., 2017, 27, 1702067 CrossRef.
- K. Lee, H. Song, K. H. Lee, S. H. Choi, J. H. Jang, K. Char and J. G. Son, ACS Appl. Mater. Interfaces, 2016, 8, 22516–22525 CrossRef CAS PubMed.
- Y. Cheng, L. Huang, X. Xiao, B. Yao, L. Yuan, T. Li, Z. Hu, B. Wang, J. Wan and J. Zhou, Nano Energy, 2015, 15, 66–74 CrossRef CAS.
- Y. Zhang, B. Lin, Y. Sun, X. Zhang, H. Yang and J. Wang, RSC Adv., 2015, 5, 58100–58106 RSC.
- C. Zhang, J. Xiao, X. Lv, L. Qian, S. Yuan, S. Wang and P. Lei, J. Mater. Chem. A, 2016, 4, 16516–16523 RSC.
- Y. Liu, G. Li, Y. Guo, Y. Ying and X. Peng, ACS Appl. Mater. Interfaces, 2017, 9, 14043–14050 CrossRef CAS PubMed.
- Z. Wang, Y. Liu, C. Gao, H. Jiang and J. Zhang, J. Mater. Chem. A, 2015, 3, 20658–20663 RSC.
- A. Mahmood, R. Zou, Q. Wang, W. Xia, H. Tabassum, B. Qiu and R. Zhao, ACS Appl. Mater. Interfaces, 2016, 8, 2148–2157 CrossRef CAS.
- C.-S. Dai, P.-Y. Chien, J.-Y. Lin, S.-W. Chou, W.-K. Wu, P.-H. Li, K.-Y. Wu and T.-W. Lin, ACS Appl. Mater. Interfaces, 2013, 5, 12168–12174 CrossRef CAS.
- R. R. Salunkhe, J. Tang, N. Kobayashi, J. Kim, Y. Ide, S. Tominaka, J. H. Kim and Y. Yamauchi, Chem. Sci., 2016, 7, 5704–5713 RSC.
- M. K. Wu, C. Chen, J. J. Zhou, F. Y. Yi, K. Tao and L. Han, J. Alloys Compd., 2018, 734, 1–8 CrossRef CAS.
- S. Wang, S. Sun, S. Li, F. Gong, Y. Li, Q. Wu, P. Song, S. Fang and P. Wang, Dalton Trans., 2016, 45, 7469–7475 RSC.
- J. Cao, Y. Wang, Y. Zhou, J.-H. Ouyang, D. Jia and L. Guo, J. Electroanal. Chem., 2013, 689, 201–206 CrossRef CAS.
- Y. Zhang, B. Lin, J. Wang, J. Tian, Y. Sun, X. Zhang and H. Yang, J. Mater. Chem. A, 2016, 4, 10282–10293 RSC.
- X. Li, Y. Qiao, C. Wang, T. Shen, X. Zhang, H. Wang, Y. Li and W. Gao, J. Alloys Compd., 2019, 770, 803–812 CrossRef CAS.
- P. Wen, P. Gong, J. Sun, J. Wang and S. Yang, J. Mater. Chem. A, 2015, 3, 13874–13883 RSC.
Footnotes |
| † Electronic supplementary information (ESI) available. See DOI: 10.1039/d1na00549a |
| ‡ Both authors contributed equally. |
| § Present address: CSIR-National Physical Laboratory (CSIR-NPL), New Delhi, India. |
| This journal is © The Royal Society of Chemistry 2021 |

