 Open Access Article
Visible light active Zr- and N-doped TiO2 coupled g-C3N4 heterojunction nanosheets as a photocatalyst for the degradation of bromoxynil and Rh B along with the H2 evolution process†
Souman
Pahi
,
Sumanta
Sahu
,
Satish Kumar
Singh
,
Abhijit
Behera
and
Raj Kishore
Patel
 *
*
Department of Chemistry, National Institute of Technology, Rourkela, Odisha, India. E-mail: rkpatel@nitrkl.ac.in; souman27@gmail.com; Fax: +91-0661-246-2651; Tel: +91-0661-246-2652 Tel: +91-9437245438
First published on 15th September 2021
Abstract
Herein, we drastically increased the l ight-harvesting abilities of TiO2 by creating a defect level with doping using zirconium (Zr) and nitrogen (N). Titanium was substantially replaced by Zr from its lattice point, and N was bound on the surface as (NO)x. The doped system comes with a reduced band edge of 2.8 eV compared to pure TiO2 (3.2 eV), and the doping was accompanied by a higher rate of recombination of photogenerated electron–hole pairs. A heterostructure was fabricated between the modified titania and g-C3N4 to efficiently separate the carriers. An easy and cost-effective sol–gel process followed by a co-calcination technique was used to synthesize the nanostructured composite. The optimum dopant concentration and the extent of doping were investigated via XRD, Raman, XPS, TEM, and PL analyses, followed by a photocatalytic study. The impact of the band positions was investigated via UV-DRS and EIS. The dynamic nature of the band alignment at the depletion region of the heterojunction increased the carrier mobility from the bulk to active sites. The photogenerated electrons and holes retained their characteristic redox abilities to generate both OH˙ and O2−˙ through a z-scheme mechanism. The photocatalytic activity resulted in superior photocatalytic H2 evolution along with the defragmentation of bromoxynil, a persistent herbicide. The active catalyst exhibited 97% degradation efficiency towards pollutants along with 0.86% apparent quantum efficiency during the H2 evolution reaction.
1. Introduction
In recent years, there has been great interest in advanced photocatalytic technology because it can be applied to environmental and energy-harnessing projects.1–3 A versatile and green photocatalyst for these projects could be developed with the assistance of different semiconducting materials.4 A breakthrough in evergreen technology resulted in expansion of the field by the development of numerous semiconductor-based photocatalysts.Among all the photocatalysts scrutinized to date, TiO2 is the most promising candidate due to its outstanding characteristics, including its optical and electronic properties as well as its low cost, nontoxicity, high stability, and strong oxidizing capacity. Unfortunately, the optoelectronic phenomenon of TiO2 is significantly hampered due to its wide band gap and excessive recombination rate of photo-excited electron–hole pairs.5,6 Because of this considerable disadvantage, TiO2 is inoperative under visible light, and its applications are limited in many areas.
To overcome these problems, diversification has been performed to modify its band gap and strengthen its visible light photocatalytic activity through doping.6–8 Metal modification and metal/nonmetal doping processes are advantageous because the physical characteristics and the electronic architecture of semiconducting materials can be altered to fit a wide variety of practical applications. However, this type of strategy can sometimes induce a defect level, which enhances the visible light absorption ability by reducing the energy threshold, where the defect level acts as a recombination zone for photo-induced carriers.
It is noteworthy that this particular issue can quench photocatalytic efficiency.9 Therefore, ideas for reliable nanocomposites and heterostructures have been developed, including an upgrade for the photocatalytic performance of doped TiO2 by decorating an appropriate semiconducting material with a precise band gap to construct suitable heterojunctions.10–12 The heterojunctions effectively separate the photogenerated electron and hole (e−–h+) pairs, and also assist in the transportation of the charge carriers to the active site of the reaction.13
Graphene carbonitrides (g-C3N4) have been used to improve the photocatalytic performance of TiO2![[thin space (1/6-em)]](https://www.rsc.org/images/entities/char_2009.gif) 14 because g-C3N4 is a novel metal-free polymeric semiconductor with a narrow band gap (2.6–2.8 eV) that can be smoothly irradiated by visible light. It has a high surface area, more optimal conductivity, and an exceptional layered structure similar to that of graphene.15–17 g-C3N4 is a sustainable, cost-effective, environmentally friendly, and visible light-sensitive semiconductor that can be synthesized by a one-pot thermolysis procedure. The photocatalytic performance of pure g-C3N4 is comparatively negligible due to the high recombination movement of promoted photo-excited carriers. However, the separate components of the g-C3N4/TiO2 nanocomposite work synergistically with excellent performance in the active oxidation process (AOP) by diminished e−–h+ recombination with improved carrier mobility.18,19
14 because g-C3N4 is a novel metal-free polymeric semiconductor with a narrow band gap (2.6–2.8 eV) that can be smoothly irradiated by visible light. It has a high surface area, more optimal conductivity, and an exceptional layered structure similar to that of graphene.15–17 g-C3N4 is a sustainable, cost-effective, environmentally friendly, and visible light-sensitive semiconductor that can be synthesized by a one-pot thermolysis procedure. The photocatalytic performance of pure g-C3N4 is comparatively negligible due to the high recombination movement of promoted photo-excited carriers. However, the separate components of the g-C3N4/TiO2 nanocomposite work synergistically with excellent performance in the active oxidation process (AOP) by diminished e−–h+ recombination with improved carrier mobility.18,19
The intimate heterostructure should have a suitable band edge of the valence band (VB) and conduction band (CB) for both semiconductors, which would create a depletion region involved in overall conductivity and activity of the material, depending on the types of contacts.20 Several heterostructures can be fabricated using g-C3N4 as the parent material, such as template-free mesoporous g-C3N4@TiO2 described by Hao et al., for pollutant mineralization under visible light.21 Zhang et al. prepared self-assembled cotton-fabricated g-C3N4/TiO2 and investigated its catalytic activity.19 Other z-scheme photocatalysts such as Ag2CO3/Ag/WO3, TiO2/g-C3N4–(IO3−/I−), CdS/rGO/g-C3N4, Bi2MoO6/CNTs/g-C3N4, SrTiO3: La, and Rh/Au/BiVO4 have also been adapted.22–26 These z-scheme combinations are noble metal-based or a combination of redox pair catalysts that lead to higher cost and lower stability. In addition, the use of a high band-gap material drastically diminishes the light-harvesting ability, which subsequently minimizes the catalytic activity.
Because doping mainly relies on the ionic radii and co-ordination tendency of induced dopants, the selection of a dopant and determination of its optimum concentration will affect the resultant band structure of the material.27 Herein, this work has mainly concentrated on tailoring the band position of TiO2 with the assistance of doping Zr at its lattice point by creating a donor level below the conduction band to enhance the light absorption efficiency towards the visible region. The optimum dopant concentration of Zr and the extent of lattice replacement were investigated with various characterizations, whereas nitrogen (N) was doped as a surface species (NOx) simply to increase the carrier conductivity.28
Because doping has its own drawbacks due to its action as a recombination zone, steps has been taken to establish a hetero-structure with g-C3N4 because of its suitable band position with the doped system. The carrier transfers and separation efficiency within the junction of the heterostructure were determined by comparing the characterization and experimental outcomes, in which a z-scheme mechanism was confirmed. This z-scheme heterostructure was achieved using a binary system without any use of novel metals (as a mediator) or redox couples. Lastly, the heterojunction does well in terms of visible light absorption and carrier separation, which leads to photocatalytic H2 generation along with pollutant degradation.
2. Experimental section
2.1 Materials
Titanium tetraisopropoxide (Ti(OCH(CH3)2)4), urea, ZrOCl2, ethanol, HCl, NH4OH, methanol, and indium tin oxide (ITO) glass were purchased from Sigma-Aldrich Chemicals, India. Isopropanol, p-benzoquinone (BQ), ethylenediaminetetraacetic acid disodium salt (2Na-EDTA), rhodamine B (Rh B), nitroblue tetrazolium (NBT), terephthalic acid (TA), and bromoxynil were acquired from Hi Media Chemicals, India. All chemicals were of analytical grade and used without further purification.2.2 Synthesis of zirconium and nitrogen co-doped TiO2/g-C3N4
A series of zirconium and nitrogen co-doped titania (TNZ-x) were synthesized by the sol–gel technique. To a solution of 5 mL deionized water and 35 mL ethanol, a certain amount of ZrOCl2 was added with continuous stirring for 30 min at room temperature. Then, 12 mL of titanium isopropoxide and 3 mL of concentrated HCl were added, followed by the subsequent addition of 3 mL of 25% ammonium hydroxide solution (N precursor). The white gel formed remained undisturbed for 24 h. After that, it was dried at 100 °C for 12 h followed by calcination at 500 °C for 12 h. A series of materials was synthesized by maintaining a constant N dopant concentration and varying the percentage, where x (wt%) = (Zr/(Zr + Ti)). The zirconium and nitrogen co-doped titania material is abbreviated as TNZ-10, TNZ-20, and TNZ-30 where x denotes 10, 20, and 30 wt% of ZrOCl2, respectively. Again, for comparison purposes, pure TiO2 was synthesized by the above process without the addition of ZrOCl2 and NH4OH solution.The heterostructured composite of zirconium and nitrogen-doped TiO2/g-C3N4 was synthesized by a simple one-pot solid-state annihilation method using urea as a precursor for graphene carbon nitride (CN). TNZ-x% at different weight ratios and urea (1![[thin space (1/6-em)]](https://www.rsc.org/images/entities/char_2009.gif) :
:![[thin space (1/6-em)]](https://www.rsc.org/images/entities/char_2009.gif) 2, 1
2, 1![[thin space (1/6-em)]](https://www.rsc.org/images/entities/char_2009.gif) :
:![[thin space (1/6-em)]](https://www.rsc.org/images/entities/char_2009.gif) 4, and 1
4, and 1![[thin space (1/6-em)]](https://www.rsc.org/images/entities/char_2009.gif) :
:![[thin space (1/6-em)]](https://www.rsc.org/images/entities/char_2009.gif) 6) were ground to a fine powder and subsequently calcined at 500 °C for 3 h with a ramp rate of 5 °C per min. The overall synthetic procedure is shown in Scheme 1. Out of all combinations, the 1
6) were ground to a fine powder and subsequently calcined at 500 °C for 3 h with a ramp rate of 5 °C per min. The overall synthetic procedure is shown in Scheme 1. Out of all combinations, the 1![[thin space (1/6-em)]](https://www.rsc.org/images/entities/char_2009.gif) :
:![[thin space (1/6-em)]](https://www.rsc.org/images/entities/char_2009.gif) 4 ratios of TNZ-10 and urea (abbreviated as TNZ-10–CN) exhibited the most optimal possible catalytic activity and were chosen for further study. The corresponding results are presented in the ESI Table T1.†
4 ratios of TNZ-10 and urea (abbreviated as TNZ-10–CN) exhibited the most optimal possible catalytic activity and were chosen for further study. The corresponding results are presented in the ESI Table T1.†
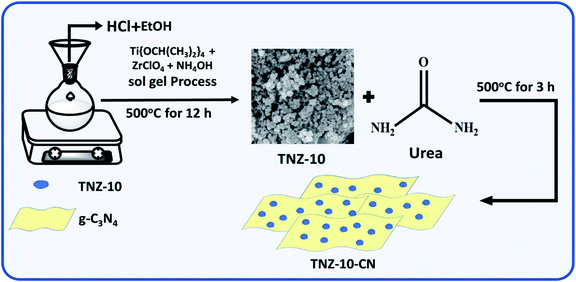 | ||
| Scheme 1 A schematic representation of the synthetic approach used to produce the TNZ-x(wt%)–CN photocatalyst. | ||
2.3 Instrumentation and measurements
The preliminary results regarding the crystalline phase of nanoparticles (NPs) were obtained from an X-ray diffraction study using a Philips PW 1830 X-ray diffractometer with a Cu-Kα radiation source. For the morphological analysis, transmission electron microscopy (TEM) and high-resolution transmission electron microscopy (HRTEM) were performed, and selected area electron diffraction (SAED) patterns were obtained using a Tecnai G2 F20 electron microscope with a voltage of 200 kV.The X-ray photoelectron spectroscopy (XPS) was recorded on a PHI 5000 Versa Probe-III. The Fourier transform infrared (FTIR) spectra (400–4000 cm−1 range) of as-prepared materials were recorded using a KBr disc with a RX-I FTIR spectrophotometer (PerkinElmer USA). The UV-Vis absorption and reflectance spectra in solutions (H2O) as well as solids (diffuse reflectance spectroscopy, DRS) were obtained using a UV-Vis spectrophotometer (UV-2450 PerkinElmer). The photoluminescence (PL) emission spectra of photocatalysts in solid and also in solution phase were measured by a Fluoromax 4P spectrophotometer (Horiba Jobin Yvon USA) at an excitation wavelength of 345 nm. The electrochemical impedance analysis and the Mott–Schottky plots were carried out by using cyclic voltammetry (CV) with an AUTOLAB 302N modular potentiostat.
2.4 Photocatalytic degradation study
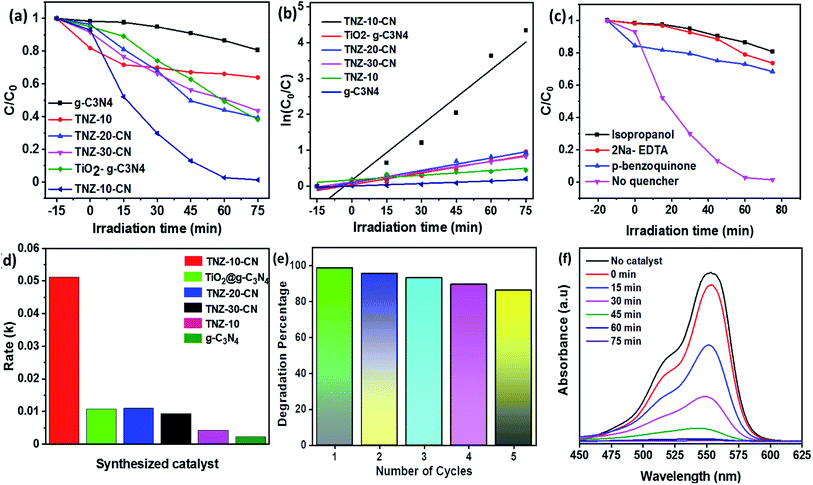
The catalytic degradation efficiency was studied by choosing bromoxynil (a widely used herbicide) and rhodamine B dye as model pollutants for a scavenger and reactive species quantification study. In detail, 50 mg of the prepared photocatalyst was dispersed in 50 mL of a 20 mg L−1 organic pollutant solution. The catalytic performance was tested under a visible light source simulator (Lelesil quartz photo chamber with 250 W xenon light source and 420 nm cut-off filter).Before irradiation of the light source, the solution was stirred in the dark for 60 minutes to achieve adsorption–desorption equilibrium. The solution was then irradiated under a visible light source, and thereafter, every 15 minutes, a 5 mL aliquot was removed and centrifuged to separate the catalyst. Then, the supernatant was analyzed by UV-Vis spectrophotometer and HPLC to determine the remaining pollutant concentration in it. The photocatalytic study revealed that the composite TNZ-10–CN had shown the highest pollutant breakdown activity.
2.5 Photocatalytic H2 evolution experiments
The hydrogen evolution experiment was carried out in a gas-closed circulatory apparatus. A 100 mg sample was dispersed in 100 mL of a solution of 80 mL of H2O and 20 mL methanol as a sacrificial agent. The temperature of the system was maintained at a constant 20 °C. A 250 W xenon lamp was used as a light source with a cut-off filter (λ > 420 nm), and the power density was set to 100 mW cm−2 before each test. The quantity of evolved H2 was analyzed by an online gas chromatograph (GC-7920) equipped with a thermal conductivity detector.2.6 Quantification of reactive species and scavengers
For the trapping of reactive species such as hydroxide radicals (OH˙), superoxide radicals (O2−˙), and holes (h+) involved in the active photocatalytic process, 1 mM IPA (OH˙ quencher), 1 mM BQ (O2−˙ quencher), or 1 mM 2Na·EDTA (h+ quencher) was added to the pollutant. A similar method was followed for the quantitative analysis of O2−˙ by conducting the nitroblue tetrazolium (NBT) test,29 where the sample was added to 2.5 × 10⁻⁵ mole per L NBT solution, and the concentration of NBT at different time intervals was observed by UV-Vis spectrophotometer (absorption maximum at 259 nm). The above study was similar to that of the photocatalytic activity test except that the pollutants were replaced with an NBT solution. Terephthalic acid (TA) was used as a probe to quantify the amount of OH˙ radicals generated during the photocatalytic study. In brief, 0.1 g of the catalyst was dispersed in a 100 mL aqueous solution of TA (5 × 10⁻⁴ mol L−1) and NaOH (2 × 10⁻³ mol L−1) at room temperature. The suspension was irradiated by visible light. TA reacts with OH˙ radicals to produce 2-hydroxyterephthalic acid, which is a highly fluorescent product (fluorescence peak at 425 nm and excitation wavelength of 315 nm).302.7 Electrochemical impedance spectroscopy (EIS)
EIS analysis was conducted using an AUTOLAB 302N modular potentiostat based upon a three-way electrode system that includes a platinum wire as a counter electrode, Ag/AgCl as the reference electrode, and a working electrode, which was fabricated on indium tin oxide (ITO) glass. Typically, 5 mg of the prepared sample was added to 0.5 mL dimethylformamide, and a dense slurry was created by sonication for several minutes. The slurry was evenly dispersed on an exposed area 1 cm2 in size and dried at 80 °C in a hot-air oven. Then, it was heated at 200 °C for 1 h for greater adhesion. The electrolyte used was a 0.1 M Na2SO4 aqueous solution without other additives.3. Results and discussion
3.1 XRD analysis
The extent of crystallinity and phase of the nanocomposite was studied using an X-ray diffraction technique. Fig. 1a exhibits the XRD data for the composites and root materials formed. The typical peaks observed at 25.15°, 37.38°, 47.78°, 53.34°, 54.75°, 62.19°, and 74.39° correspond to the (101), (004), (200), (105), (211), (204), and (125) crystal planes of the anatase phase of titania (JCPDS 21-2172), respectively.31 A small satellite peak (star marked), observed at 27.21°, is due to the presence of g-C3N4 and represents the (002) plane, but the insignificant peak intensity is due to the low crystallinity of g-C3N4 in comparison to titania.32,33 The origination of the (002) plane is due to the interlayer reflection of the graphite-like structure. The sharp rise in a peak at 30.58°, regarding crystal plane (111), is due to the enhanced doping of zirconium (Fig. S1a†). It was observed that Zr doping at 10 wt% did not have any effect on the XRD pattern, but with further increase in doping, the peak at 30.58° increased, and at approximately 40% dopant concentration, the phase was completely changed (Fig. S1a†).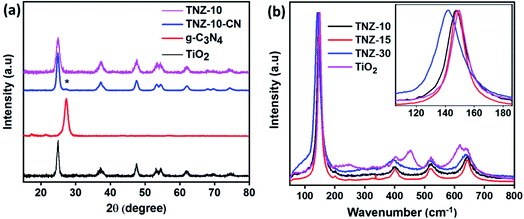 | ||
| Fig. 1 (a) The XRD patterns of g-C3N4, TiO2, Zr- and N-doped titania (TNZ-10), and its composite. (b) Raman spectra of pure TiO2 and 10, 20, and 30% Zr-doped TiO2. | ||
Upon doping of nitrogen, there is no net change in the lattice parameters of samples TiO2 and N–TiO2, and therefore, the presence of nitrogen at the lattice is not a valid consideration. Therefore, nitrogen could exist as a surface species as (NO)x, which would enhance the carrier mobility over the surface.28 The enlarged (101) XRD peak of samples is displayed in Fig. S1b.† No peak shift was observed in the case of the N-doped and undoped system, whereas the peaks of TNZ-10, TNZ-15, and TNZ-30 shift to a lower diffraction angle as the Zr concentration is increased (Fig. S1b†). From the above considerations, the presence of Zr at the lattice point of titania can be predicted by the positive change in lattice parameters and shifting of the peak to a lower diffraction angle.28
3.2 Raman analysis
The characteristic vibrational stretching bands observed at 144, 197, 396, 516, and 640 cm−1 correspond to the Eg, B1g, A1g, B1g, and Eg modes of the anatase phase of titania (Fig. 1b), respectively.34 As the percentage of zirconia is enhanced, a new satellite peak at 280 cm−1 is observed in TNZ-15 and TNZ-30, but no changes are observed for TNZ-10. A newly formed satellite peak at 280 cm−1 is observed as a vibrational mode of the ZrTiO3 phase. In Zr-doped systems, the peak at 144 cm−1 shifts to a lower wavenumber, with an increase in dopant concentration, and the shifting is more frequent as concentration increases. In contrast, no shifting in the 144 cm−1 peak was observed when a comparison was performed between Zr, N-doped titania, and the Zr-doped system (Fig. S2†). Therefore, it could be concluded that Zr ion (72 pm) substitution occurred at the lattice point of Ti (53 pm), which can be further explained by the equation below.28 | (1) |
![[small nu, Greek, macron]](https://www.rsc.org/images/entities/i_char_e0ce.gif) = wave number (cm−1), μ = reduced mass of bound elements, k = force constant (bond strength), and c = velocity of light. The stretching of Zr–O is less as compared to Ti–O interaction due to the larger size of Zr4+ with respect to Ti4+. As per the results, stress is induced by the substantial replacement of Ti by Zr in the lattice point, which results in a decrease in the vibrational frequency of the Eg band.35 The Raman spectra provide satisfactory agreement with the XRD data towards the doping theory.
= wave number (cm−1), μ = reduced mass of bound elements, k = force constant (bond strength), and c = velocity of light. The stretching of Zr–O is less as compared to Ti–O interaction due to the larger size of Zr4+ with respect to Ti4+. As per the results, stress is induced by the substantial replacement of Ti by Zr in the lattice point, which results in a decrease in the vibrational frequency of the Eg band.35 The Raman spectra provide satisfactory agreement with the XRD data towards the doping theory.
3.3 FTIR analysis
Fig. 2a reveals the FTIR spectra and the nature of the interaction between the elements of the parent constituents and hybrid composites g-C3N4, TNZ-10, and TNZ-10–CN. An absorption band is observed in the range of 500–800 cm−1 due to the stretching vibration of Ti–O–Ti. The fine peak at 802 cm−1 is assigned to the out-of-plane breathing vibration of the s-triazine units.36 The band of peaks between 1300 and 1700 cm−1 is due to the various stretching modes between C![[double bond, length as m-dash]](https://www.rsc.org/images/entities/char_e001.gif) N and C–N of heptazine-derived repeating units.37 A broad band obtained from 3000–3600 cm−1 is ascribed to vibrational stretching modes of the N–H groups of g-C3N4.
N and C–N of heptazine-derived repeating units.37 A broad band obtained from 3000–3600 cm−1 is ascribed to vibrational stretching modes of the N–H groups of g-C3N4.
3.4 Optical characterization
UV-visible diffuse reflectance spectra were obtained to illustrate the band structure and optical absorption property of the materials (Fig. 2b and c). The bandgap can be derived from the Kubelka–Munk function:38 | (2) |
3.5 XPS analysis
The surface chemical composition and elemental state of individuals in the composite were studied by XPS. Fig. 3a shows the survey spectrum of composite TNZ-10–CN, which consists of C, N, O, Ti, and Zr. Fig. 3b–f illustrates the high-resolution XPS spectra of the corresponding C 1s, N 1s, O 1s, Ti 2p, and Zr 3d. The deconvoluted high-resolution XPS spectra of C 1s (Fig. 3b) show three peaks at 284.8 eV, 286.3 eV, and 288.7 eV. The peak at 284.8 eV corresponds to the sp2 hybridized C–C bond in g-C3N4 (CN). The peak at 286.3 eV is attributed to the C![[double bond, length as m-dash]](https://www.rsc.org/images/entities/char_e001.gif) N groups, and the peak centered at 288.7 eV is due to the sp2 hybridized C (N–C
N groups, and the peak centered at 288.7 eV is due to the sp2 hybridized C (N–C![[double bond, length as m-dash]](https://www.rsc.org/images/entities/char_e001.gif) N) in g-C3N4.40,41 In the N 1s spectra (Fig. 3c), the peak at 398.44 eV is attributed to the sp2 hybridized aromatic C–N
N) in g-C3N4.40,41 In the N 1s spectra (Fig. 3c), the peak at 398.44 eV is attributed to the sp2 hybridized aromatic C–N![[double bond, length as m-dash]](https://www.rsc.org/images/entities/char_e001.gif) C group. The peak at 398.94 eV is derived from tertiary N–(C)3 of the triazine CN unit, whereas the 400.05 eV peak is due to the C–N–H unit. The high-resolution O 1s curve (Fig. 3d) of the composite TNZ-10–CN is fitted into two peaks, whereby the peak at 529.68 eV is attributed to the Ti–O bond in the TiO2 lattice, and the peak at 531.35 eV is ascribed to the O–H bond. The Ti 2p spectrum (Fig. 3f) is fitted to two peaks, 464.23 eV and 458.51 eV, which are ascribed to the Ti 2p1/2 and Ti 2p3/2 spin–orbit peaks of TiO2, respectively.42 The deconvoluted high-resolution XPS peak centered at 181.73 eV is due to the Zr 3d5/2 spin–orbit peak of the substitutionally inserted Zr4+ ion (Fig. 3e). This peak falls between metallic Zr (179.0 eV) and the Zr 3d5/2 peak of ZrO2 (183.5 eV), and therefore, it can be concluded that the Zr4+ ions were substituted into the lattice of TiO2 by replacing Ti4+ ions, with an increase in dopant concentration, which justifies the observations of XRD and Raman spectroscopy.43
C group. The peak at 398.94 eV is derived from tertiary N–(C)3 of the triazine CN unit, whereas the 400.05 eV peak is due to the C–N–H unit. The high-resolution O 1s curve (Fig. 3d) of the composite TNZ-10–CN is fitted into two peaks, whereby the peak at 529.68 eV is attributed to the Ti–O bond in the TiO2 lattice, and the peak at 531.35 eV is ascribed to the O–H bond. The Ti 2p spectrum (Fig. 3f) is fitted to two peaks, 464.23 eV and 458.51 eV, which are ascribed to the Ti 2p1/2 and Ti 2p3/2 spin–orbit peaks of TiO2, respectively.42 The deconvoluted high-resolution XPS peak centered at 181.73 eV is due to the Zr 3d5/2 spin–orbit peak of the substitutionally inserted Zr4+ ion (Fig. 3e). This peak falls between metallic Zr (179.0 eV) and the Zr 3d5/2 peak of ZrO2 (183.5 eV), and therefore, it can be concluded that the Zr4+ ions were substituted into the lattice of TiO2 by replacing Ti4+ ions, with an increase in dopant concentration, which justifies the observations of XRD and Raman spectroscopy.43
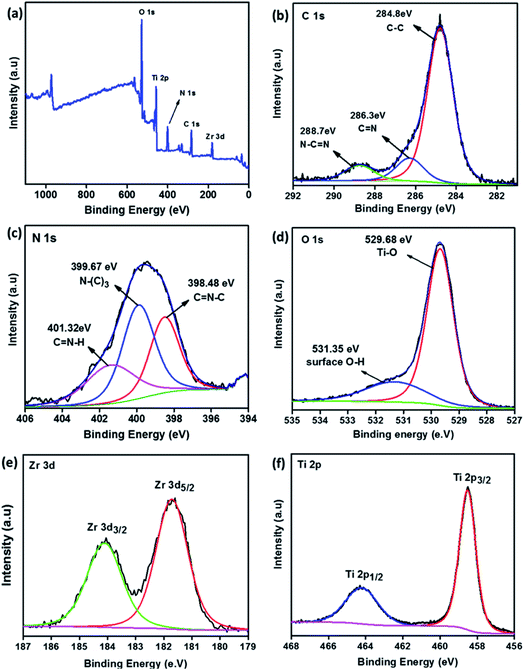 | ||
| Fig. 3 XPS spectra. (a) The survey spectrum of the composite TNZ-10–CN. High-resolution spectra of constituent elements: (b) C 1s, (c) N 1s, (d) O 1s, (e) Zr 3d, and (f) Ti 2p. | ||
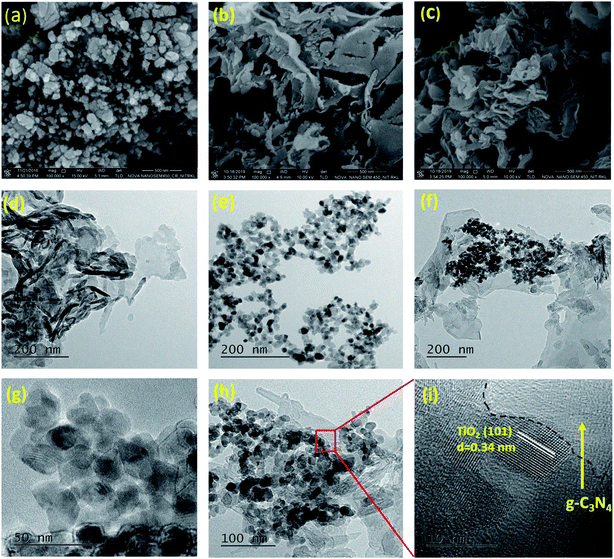
3.6 Morphological analysis
The structure and particle size of TNZ-10–CN and its reference samples were investigated by FESEM, TEM, and HR-TEM analysis (Fig. 4). TNZ-10 (Fig. 4a) is mainly composed of nanoparticles with a size range of 10–30 nm, whereas g-C3N4 has a sheet-like structure (Fig. 4b), but the decoration of TNZ-10 over the g-C3N4 nanosheet is not well documented from FESEM images (Fig. 4c). Therefore, TEM was performed to view the nanosheet with a higher rate of magnification. Fig. 4d–f displays the TEM image of g-C3N4, TNZ-10, and TNZ-10–CN, respectively. The TEM images show that the TNZ-10 nanoparticles are well-dispersed over the nanosheet, and the intimate contact between the nanoparticles with g-C3N4 results in heterojunctions that lead to high conductivity and charge separation efficiency.44 The HRTEM image of TNZ-10–CN and TNZ-10 depicts the distinct lattice fringes of TiO2 with a d-spacing of 0.34 nm corresponding to the TiO2 (101) planes.45The SAED pattern of g-C3N4 shows amorphous architecture, whereas TNZ-10 is polycrystalline with more prominent rings. The heterostructure of TNZ-10–CN exhibits a mixed character, as the pattern is more defused in comparison to TNZ-10 (Fig. S3a–c†). Furthermore, EDS mapping of TNZ-10–CN was performed for the confirmation of elemental composition (Ti, Zr, O, C, N) and their distribution throughout the composite (Fig. S3d–i†). Additionally, the EDAX study of the TNZ-10–CN heterostructure validated the presence of C, N, Ti, Zr, and O elements (Fig. S4†). The above results match the results from XRD as well as XPS. Both parent compounds make intimate contact, which significantly enhances the charge separation during the photo-catalytic oxidation process. The overall morphological analysis demonstrates that the TNZ-10–CN photocatalyst was successfully fabricated by a simple co-calcination process.
3.7 Surface area and pore size distribution
The N2 adsorption–desorption isotherms were obtained to investigate the pore size distribution and the corresponding specific surface area of the prepared sample (Fig. 5). All the samples exhibit isotherm IV with a type H3 hysteresis loop, illustrating that the sample g-C3N4, TNZ-10, and the composite TNZ-10–CN possess a mesoporous structure, which can also be established from the pore size distribution plot (Fig. 5b). The hysteresis loop displays an intra-aggregated pore distribution at low partial pressure (0.4 < P/P0 < 0.8), and at a higher partial pressure value, large pores stacked between secondary particles were observed. All samples displayed a pattern of bimodal pore distribution with a primary contribution in the range of 2–4 nm and a secondary contribution in a 8–12 nm range. The BET surface area of TNZ-10–CN was found to be 49.8 m2 g−1, which is higher than that of the individual constituents (g-C3N4 10.65 m2 g−1 and TNZ-10 8.03 m2 g−1). The apparent increase in the surface area provides more optimal catalytic active sites, which results in increased photocatalytic performance.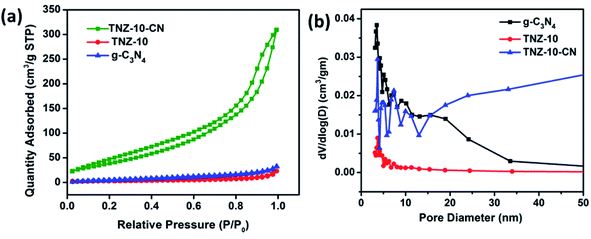 | ||
| Fig. 5 (a) Nitrogen physisorption isotherms and (b) pore size distributions calculated via the Barrett–Joyner–Halenda (BJH) method. | ||
3.8 Photoluminescence performance
To determine the efficient migration and separation of photogenerated electron–hole pairs, photoluminescence (PL) analysis was conducted for TNZ-10, g-C3-N4, and TNZ-10–CN (Fig. 6a). The intensity of the PL spectra primarily depends on the photogenerated electron–hole recombination rate. The lower the PL spectra intensity, the higher the separation efficiency.46 The emission peak centered at 455 nm corresponds to g-C3N4 with a narrow band gap of 2.85 eV, which indicates a higher carrier recombination rate. However, the TNZ-10–CN heterostructure shows a massive drop in emission intensity, which suggests greater separation and migration of electron–hole pairs, although the high band gap for TNZ-10 barely shows any emission peak in the range of 350–650 nm.47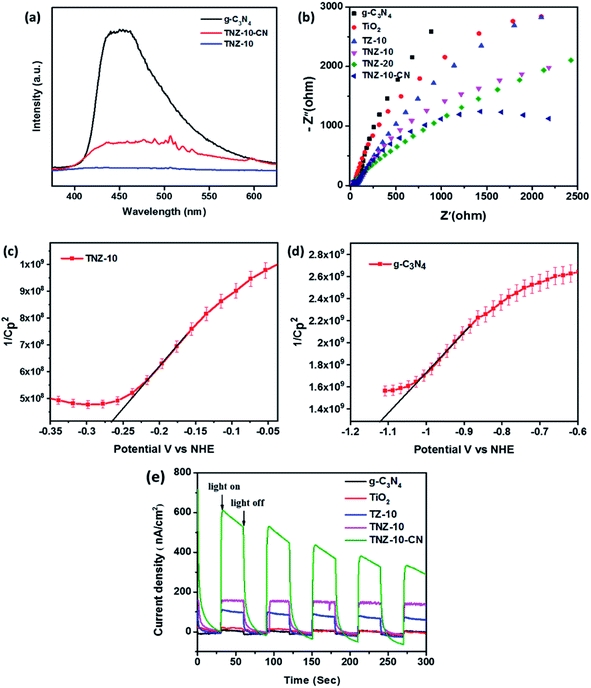 | ||
| Fig. 6 (a) PL spectra of pure g-C3N4, TNZ-10, and TNZ-10–CN, (b) EIS Nyquist plots, Mott–Schottky plots of (c) TNZ-10 and (d) g-C3N4, and (e) the photocurrent responses of the heterojunctions. | ||
3.9 Electrochemical impedance analysis (EIS)
EIS analysis (Nyquist plot) was performed to measure the extent of charge carrier migration and separation efficiency of photogenerated electron–hole couples. The graph displays a high-frequency semicircle section with a different arc radius. Evidently, the arc radius of the TNZ-10–CN composite as a working electrode is the lowest in comparison to that of its root materials. This indicates higher charge mobility and lower interfacial resistance of the composite (Fig. 6b), which implies a lower rate of recombination of excitons.48 A comparison of the EIS plots of TZ-10 and TNZ-10 reveals less resistance towards carrier mobility for the latter, as it has a smaller arc radius in comparison to the former, which explains how the presence of N, which is considered as a surface species, strengthens the separation efficiency. However, the position of N is at the surface and not in a lattice space, which has already been elucidated in the XRD and Raman analysis. The Mott–Schottky analysis was also carried out to determine the flat band position, as well as the type of semiconductor-based parent materials. The impedance studies were performed in the dark, and the flat band potential (Vfb) was measured using the following Mott–Schottky equation:49 | (3) |
As mentioned in Fig. 6e, the TNZ-10–CN heterojunction shows a higher current density response, and manifests superior separation and migration of electron–hole pairs, which subsequently results in increased photocatalytic activity. The presence of N as a carrier mobilizer and its relative catalytic activity can be summarised by comparing the TZ-10 and TNZ-10 samples, where the presence of N, embedded as a surface species, increases the photocurrent density and elucidates nitrogen's role in surface NOx (Fig. 6e). NOx also acts as an active catalytic site, and thus supports the overall redox process for the degradation of pollutants.
3.10 Photocatalytic activity and stability of TNZ-10–CN
A series of combinations was created by changing the dopant wt% and the weight ratio of the parent reference samples. The catalytic efficiency of the synthesized samples was evaluated by the degradation of bromoxynil (a very persistent herbicide) and Rh B, which was used as a probe pollutant for scavengers and the kinetics analysis. Fig. 7a and b shows that TNZ-10–CN exhibited the highest activity as compared to that of pure g-C3N4, TNZ-10, and their other combinations such as TNZ-20–CN and TNZ-30–CN (order: TNZ-10–CN > TNZ-20–CN > TiO2@g-C3N4 > TNZ-30–CN > TNZ-10 > g-C3N4). Pure g-C3N4 displayed a very poor degradation efficiency of approximately 24% under visible light due to its high carrier recombination rate, whereas TNZ-10 exhibited 36% activity, which was concluded from UV-DRS and the PL analysis. The optimum dopant concentration (Zr) was found to be 10 wt% in comparison to its other hybrids. The degradation kinetics of different samples were simulated by pseudo-first order kinetics. The rate constant (k) was calculated from eqn (4) given below: | (4) |
A comparative study between the doped and undoped systems of the same parent materials was also performed. The 10 wt% Zr-doped composite (TNZ-10–CN) performed with 5 times superior catalytic activity as compared to undoped TiO2@ g-C3N4. Furthermore, more optimal photocatalytic activity was observed for the TNZ-10–CN heterojunction in comparison to that of different TiO2/g-C3N4-based photocatalysts (Table 1). As for the rate constant (k value), a k value of 0.0512 min−1 was measured for the composite TNZ-10–CN as compared to the k values for TiO2@ g-C3N4, TNZ-20–CN, TNZ-10, and g-C3N4, which were 0.010 min−1, 0.011 min−1, 0.007 min−1, and 0.002 min−1, respectively (Fig. 7d). The stability and reusability of the TNZ-10–CN heterojunction was evaluated by conducting a catalytic cycle test using Rh B as a model pollutant. As shown in Fig. 7e, the catalyst displayed a lower photocatalytic performance of 82% after 5 catalytic cycles as compared to that of its first use.
| Catalyst | C cat (mg mL−1) | C dye (mg L−1) | Source | Rate | Reference |
|---|---|---|---|---|---|
| g-C3N4/TiO2 | 1.0 | Rh B, 10.0 | 500 W (λ > 420 nm) | 5.0 h, 84% | 54 |
| g-C3N4-P25 | 0.5 | MB, 3.0 | 500 W (λ > 420 nm) | 5.0 h, 84% | 55 |
| gC3N4/Ag/TiO2 | 1.0 | MO, 13.5 | 300 W (λ > 420 nm) | 6.0 h, 100% | 56 |
| TiO2/g-C3N4 | 1.0 | MO, 10.0 | 300 W (λ > 420 nm) | 90 min, 80% | 57 |
| g-C3N4/TiO2 | 1.0 | Rh B, 10.0 | 300 W (λ > 420 nm) | 50 min, 96% | 58 |
| CNNC/TiO2 | 1.0 | Rh B, 10.0 | 500 W (λ > 420 nm) | 60 min, 100% | 59 |
| TNZ-10–CN | 1.0 | Rh B, 20.0 | 250 W (λ > 420 nm) | 75 min, 98% | This work |
The defragmentation of bromoxynil was investigated using an HPLC-UV chromatogram. Initially, a 20 ppm bromoxynil solution (without the treatment of catalyst and light) was analyzed via HPLC, and after that, samples withdrawn at 20 min time intervals were analyzed. Blank bromoxynil exhibited two peaks at 220 nm and 317 nm wavelength, and at 2.23 min of retention time. Over time, new peaks at different retention times were observed, and the intensities of characteristic peaks of bromoxynil were decreased (Fig. S6†). After 80 min of treatment, a single peak below 200 nm was witnessed. The peaks at different wavelengths with respect to the retention time and their corresponding area percentages are shown in Fig. S6.† The 3D degradation pattern of bromoxynil is shown in Fig. S5a–d,† from which a clear defragmentation pattern of bromoxynil can be observed. The degradation data of both pollutants indicates that the synthesized catalyst TNZ-10–CN functions properly in terms of light harvesting and satisfactorily with respect to carrier splitting capability.
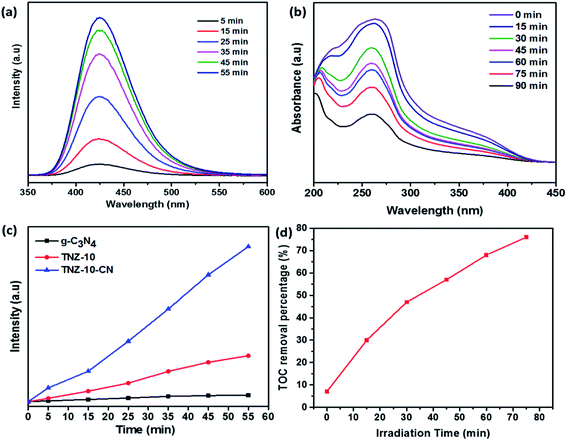
The total organic carbon (TOC) experiment was very effective for estimating the mineralization rate of bromoxynil. Fig. 9d shows the removal percentage of organic carbon of the pollutant treated with the catalyst after 75 min of irradiation time. The catalyst TNZ-10–CN attained 76.2% removal in 75 min.
The higher degradation efficiency of TNZ-10–CN was achieved at moderate pH towards bromoxynil. This can be clarified by the conviction that when the pH is lower than the dissociation constant (pKa = 4.1), the phenolic form is the principal one in the solution.53 Furthermore, the zero point charge of TNZ-10–CN was calculated to be 4.19 (Fig. S7a†). Hence, the surface charge of the photocatalytic system was positive at pH < 4.19. When the pH was lower than the dissociation constant (pKa = 4.1), the protonated bromoxynil and the positively charged surface established an electrostatic force of repulsion, which diminished the degradation efficiency. However, at a higher pH, the enhanced performance is due to the force of attraction between bromoxynil and the surface of the material. The above consideration provides a more optimal surface interaction between catalyst and pollutant molecules at moderate pH, which leads to higher catalytic activity (Fig. S7b†).
3.11 Photocatalytic H2 evolution performance and stability
The photocatalytic H2 evolution of the active composite TNZ-10–CN has shown superior activity (147.32 μmol h−1) compared to that of various combinations of its root constituents (Fig. 8a). Different Z- and N-doped heterojunctions, such as TNZ-10–CN and TNZ-20–CN, displayed a subtle difference in terms of H2 evolution activity, but beyond the optimum dopant (30 wt% of Zr) concentration, the H2 evolution tendency drastically diminished. This occurred because over a certain limit, doping theory collapses by creating a new phase, which significantly affects the light-harvesting ability. Hence, doping in a system creates a donor energy level below the conduction band, which is able to tune the band structure.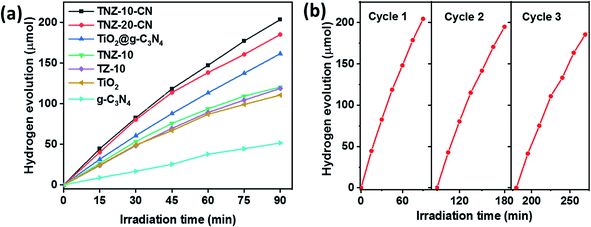 | ||
| Fig. 8 (a) Time course of H2 evolution per 100 mg of samples used. (b) Recycling efficiency testing of the photocatalyst TNZ-10–CN. | ||
This observation was verified by considering Zr- and N-doped TiO2 (TNZ-10), Zr-doped TiO2 (TZ-10), and TiO2 and their respective H2 evolution efficiencies (93.75 μmol h−1), (89.28 μmol h−1), and (87.05 μmol h−1). When blending the Zr- and N-doped TiO2 (TNZ) and g-C3N4 (CN) to construct the heterojunction TNZ-10–CN (value 10 represents the dopant concentration), an H2 evolution efficiency of 147.32 μmol h−1 was obtained, which is nearly 6 times higher than that of pristine g-C3N4 and 2 times higher than that of pure TiO2. However, the apparent quantum efficiency of the H2 conversion reaction increased to 0.86% (the detailed calculation is provided in the ESI†). This enhanced activity suggests that heterojunctions working synergistically will improve carrier separation and migration efficiency during overall photocatalytic activity, which was confirmed from PL and electrochemical impedance analyses. Moreover, the consistency of the photocatalyst plays an important role in predicting photocatalytic efficiency. As shown in Fig. 8b, the TNZ-10–CN sample exhibited a steady H2 evolution over three consecutive cycles for 3.5 h, without any appreciable deviation.
3.12 Photocatalytic mechanism
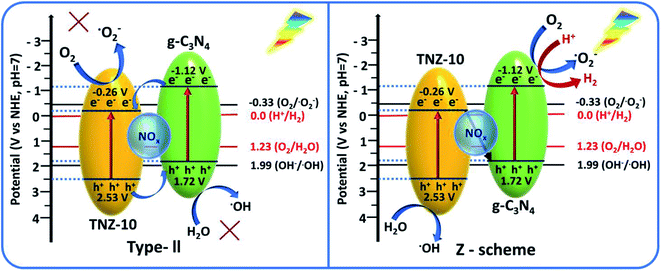
To comprehend the active oxygen process (AOP) mechanism of the TNZ-10–CN composite, the band edge alignments of individual constituents TNZ-10 and g-C3N4 were analyzed from UV-DRS and Mott–Schottky plots. From the energy level diagram (Fig. 10), it is evident that the conduction band (CB) edge of g-C3N4 is directly above the reduction potential of O2/O2−˙ (−0.33 V vs. NHE), while the CB potential of TNZ-10 is far below it. Thus, the band edge of g-C3N4 has the ability to generate O2−˙. Similarly, the valence band (VB) edge of TNZ-10 is at a suitable position to produce OH˙.From the scavenger study and reactive species trapping experiment, the composite TNZ-10–CN exhibited higher activity in terms of radical generation. The evidence of OH˙ generation was confirmed from the TA test. Fig. 9a shows that over time, the intensity of 2-hydroxy terephthalic acid (fluorescence wavelength at 425 nm) increases. From the comparative PL intensity graph (Fig. 9c), the heterostructure TNZ-10–CN exhibited the highest intensity as compared to that of its individual constituents, which validates the higher OH˙ radical generation ability of the composite. Additionally, from the NBT test, superoxide radical ions yield formazan derivatives in the reaction mixture, and the photo-generated O2−˙ decreases the absorption maxima of NBT molecules at 280 nm. The decrease in λmax at 280 nm indicates that O2−˙ generation has occurred (Fig. 9b).
By examining the band edge positions and radical-trapping experiments, two possible charge transfer mechanisms can be considered: direct Z-scheme or type-II heterojunction. The traditional type-II heterojunction exhibits a band-to-band carrier transfer mechanism, where the electrons on the CB of g-C3N4 should migrate to the CB of TNZ-10 to produce O2−˙ as anticipated, whereas the holes should migrate from the VB of TNZ-10 to the VB of g-C3N4. The resultant potentials of both electrons and holes after the separation and migration are not potentially favorable to produce O2−˙ and OH˙. However, the direct z-scheme arrangement of the TNZ-10–CN composite suggests that the electrons in the CB of TNZ-10 will tunnel through the junction to combine with the holes of g-C3N4 so that the resultant holes and electrons will gather at the VB of TNZ-10 and CB of g-C3N4, respectively.
From the transient photocurrent and EIS study, it is evident that the presence of N as a surface species (NOx) increases the electron–hole recombination at the depletion region, and provides a satisfactory agreement for the z-scheme mechanism. The inbuilt field developed in the depletion region can boost the recombination process of carriers, which facilitates the z-scheme mechanism for the photocatalytic process. As per the z-scheme representation, the gathered photo-generated electrons possess high reducibility (−1.12 V vs. NHE) that can easily reduce dissolved O2 to O2−˙ (−0.33 V vs. NHE) along with the generation of H2 from H+ (0.0 V vs. NHE) in the same aquatic environment. The residual holes at the VB edge of TNZ-10 possess the appropriate potential (2.53 V vs. NHE) to produce OH˙, which indicates the probability of a direct z-scheme mechanism. By considering the relative band edge position of the heterostructure and the relative standard redox potential of the active species OH˙ (1.99 V vs. NHE) and O2−˙ (−0.33 V vs. NHE), the following reaction pathway can be considered:
| TNZ-10-CN + hν → e− + h+ |
| e− + O2 → O2−˙ |
| O2−˙ + HO2→˙HO2 + HO− |
| ˙HO2 + OH2 → H2O2 + OH˙ |
| H2O2 + O2−˙ → OH˙ + HO− + O2 |
| OH˙ + pollutant → oxidation products |
| h+ + OH2 → OH˙ + H+ |
| h+ + pollutants → oxidation products |
The photo-induced holes accumulated in the VB edge of pure TNZ-10 are able to produce OH˙ radicals from OH− in the reaction mixture, while the electrons in g-C3N4 are able to produce O2−˙ radicals from dissolved O2. If the catalyst had followed the conventional band-to-band charge transfer mechanism (conventional type-II heterojunction), the generation of the active species would not have been possible. The reactive species (OH˙ and O2−˙) were compiled on the active sites of the photocatalyst, and were able to participate in the degradation process. Regarding H2 evolution, after overall charge separation and migration through the z-scheme, the resultant electrons compiled on the CB of g-C3N4 (−1.12 V vs. NHE) are at a favorable potential to undergo the hydrogen evolution reaction (0.0 V vs. NHE) using methanol as a hole scavenger (Fig. 10).
4. Conclusions
This work successfully tailored the band edge of TiO2 by doping Zr via substantially replacing Ti from its lattice point, as doping creates defect levels below the conduction band by reducing the overall band threshold. Co-doped N was fabricated as a surface species, which enhanced the carrier mobility throughout the surface and resulted in a preference for the recombination process at the depletion region with g-C3N4, in support of a z-scheme mechanism. To counterbalance the recombination process of individual materials (a consequence of the defect level), heterojunctions were fabricated over g-C3N4via a simple co-calcination method. Physicochemical evaluation revealed an intimate architecture, suitable band edge position, low interfacial charge resistance, and a reduced rate of recombination that synergistically enhanced the photocatalytic H2 generation along with the degradation process. Moreover, the redox potentials of the resultant carriers were able to generate both OH˙ and O2−˙ through a direct z-scheme mechanism, participating in the degradation of bromoxynil.Conflicts of interest
There are no conflicts to declare.Acknowledgements
The authors are thankful to the Science and Engineering Research Board, SERB, India for funding this research project (EMR/2017/000406). The authors are also thankful to the National Institute of Technology, Rourkela for providing the instrumental facilities.References
- W. J. Ong, L. L. Tan, Y. H. Ng, S. T. Yong and S. P. Chai, Chem. Rev., 2016, 116, 7159–7329 CrossRef CAS PubMed.
- X. Li, J. Yu and M. Jaroniec, Chem. Soc. Rev., 2016, 45, 2603–2636 RSC.
- J. Liu, Y. Liu, N. Liu, Y. Han, X. Zhang, H. Huang, Y. Lifshitz, S. T. Lee, J. Zhong and Z. Kang, Science, 2015, 347, 970–974 CrossRef CAS PubMed.
- X. Liu, J. Iocozzia, Y. Wang, X. Cui, Y. Chen, S. Zhao, Z. Li and Z. Lin, Energy Environ. Sci., 2017, 10, 402–434 RSC.
- Y. Li, Y. Bian, H. Qin, Y. Zhang and Z. Bian, Appl. Catal., B, 2017, 206, 293–299 CrossRef CAS.
- W. H. Leng, P. R. F. Barnes, M. Juozapavicius, B. C. O'Regan and J. R. Durrant, J. Phys. Chem. Lett., 2010, 1, 967–972 CrossRef CAS.
- D. Chatterjee and A. Mahata, J. Photochem. Photobiol., C, 2005, 6(2–3), 186–205 CrossRef CAS.
- D. Chatterjee and S. Dasgupta, J. Photochem. Photobiol., C, 2005, 6, 186–205 CrossRef CAS.
- H. Liu, G. Liu and X. Shi, Colloids Surf., A, 2010, 363, 35–40 CrossRef CAS.
- H. Hou, M. Shang, F. Gao, L. Wang, Q. Liu, J. Zheng, Z. Yang and W. Yang, ACS Appl. Mater. Interfaces, 2016, 8, 20128–20137 CrossRef CAS PubMed.
- J. Yang, X. Wang, J. Dai and J. Li, Ind. Eng. Chem. Res., 2014, 53, 12575–12586 CrossRef CAS.
- K. Li, S. Gao, Q. Wang, H. Xu, Z. Wang, B. Huang, Y. Dai and J. Lu, ACS Appl. Mater. Interfaces, 2015, 7, 9023–9030 CrossRef CAS PubMed.
- S. J. A. Moniz, S. A. Shevlin, D. J. Martin, Z. X. Guo and J. Tang, Energy Environ. Sci., 2015, 8, 731–759 RSC.
- J. Fu, J. Yu, C. Jiang and B. Cheng, Adv. Energy Mater., 2018, 8, 1–31 CAS.
- J. Zhang, X. Jin, P. I. Morales-Guzman, X. Yu, H. Liu, H. Zhang, L. Razzari and J. P. Claverie, ACS Nano, 2016, 10, 4496–4503 CrossRef CAS.
- Z. Huang, Q. Sun, K. Lv, Z. Zhang, M. Li and B. Li, Appl. Catal., B, 2015, 164, 420–427 CrossRef CAS.
- H. Yan and H. Yang, J. Alloys Compd., 2011, 509, 26–29 CrossRef.
- R. Guo, D. Zeng, Y. Xie, Y. Ling, D. Zhou, L. Jiang, W. Jiao, J. Zhao and S. Li, Int. J. Hydrogen Energy, 2020, 45, 22534–22544 CrossRef CAS.
- Y. Wang, X. Ding, P. Zhang, Q. Wang, K. Zheng, L. Chen, J. Ding, X. Tian and X. Zhang, Ind. Eng. Chem. Res., 2019, 58, 3978–3987 CrossRef CAS.
- S. Chen, Y. Qi, T. Hisatomi, Q. Ding, T. Asai, Z. Li, S. S. K. Ma, F. Zhang, K. Domen and C. Li, Angew. Chem., Int. Ed., 2015, 54, 8498–8501 CrossRef CAS.
- R. Hao, G. Wang, H. Tang, L. Sun, C. Xu and D. Han, Appl. Catal., B, 2016, 187, 47–58 CrossRef CAS.
- J. Yan, H. Wu, H. Chen, Y. Zhang, F. Zhang and S. F. Liu, Appl. Catal., B, 2016, 191, 130–137 CrossRef CAS.
- W. K. Jo and T. S. Natarajan, Chem. Eng. J., 2015, 281, 549–565 CrossRef CAS.
- W. K. Jo and N. C. S. Selvam, Chem. Eng. J., 2017, 317, 913–924 CrossRef CAS.
- D. Ma, J. Wu, M. Gao, Y. Xin and C. Chai, Chem. Eng. J., 2017, 316, 461–470 CrossRef CAS.
- Q. Wang, Y. Li, T. Hisatomi, M. Nakabayashi, N. Shibata, J. Kubota and K. Domen, J. Catal., 2015, 328, 308–315 CrossRef CAS.
- G. C. Wessler, T. Zhu, J. P. Sun, A. Harrell, W. P. Huhn, V. Blum and D. B. Mitzi, Chem. Mater., 2018, 30, 6566–6574 CrossRef CAS.
- P. Zhang, Y. Yu, E. Wang, J. Wang, J. Yao and Y. Cao, ACS Appl. Mater. Interfaces, 2014, 6, 4622–4629 CrossRef CAS.
- L. Ye, J. Liu, Z. Jiang, T. Peng and L. Zan, Appl. Catal., B, 2013, 142–143, 1–7 CAS.
- V. S. Santosh Kumar, T. Surendar, B. Kumar and A. Baruah, J. Phys. Chem. C, 2013, 8, 4284–4294 Search PubMed.
- P. D. Cozzoli, A. Kornowski and H. Weller, J. Am. Chem. Soc., 2003, 125, 14539–14548 CrossRef CAS PubMed.
- X. Wang, K. Maeda, X. Chen, K. Takanabe, K. Domen, Y. Hou, X. Fu and M. Antonietti, J. Am. Chem. Soc., 2009, 131, 1680–1681 CrossRef CAS PubMed.
- X. Wang, K. Maeda, A. Thomas, K. Takanabe, G. Xin, J. M. Carlsson, K. Domen and M. Antonietti, Nat. Mater., 2009, 8, 76–80 CrossRef CAS PubMed.
- J. Macan, A. Gajović and H. Ivanković, J. Eur. Ceram. Soc., 2009, 29, 691–696 CrossRef CAS.
- W. F. Zhang, Y. L. He, M. S. Zhang, Z. Yin and Q. Chen, J. Phys. D: Appl. Phys., 2000, 33, 912–916 CrossRef CAS.
- Y. Nan, D. Yang, Z. Tong, Y. Sun and Z. Jiang, Mater. Res. Bull., 2017, 93, 91–101 CrossRef CAS.
- J. Hong, X. Xia, Y. Wang and R. Xu, J. Mater. Chem., 2012, 22, 15006–15012 RSC.
- Y. Choi, H. Il Kim, G. H. Moon, S. Jo and W. Choi, ACS Catal., 2016, 6, 821–828 CrossRef CAS.
- J. Wang, Y. Yu, S. Li, L. Guo, E. Wang and Y. Cao, J. Phys. Chem. C, 2013, 117, 27120–27126 CrossRef CAS.
- X. Song, Y. Hu, M. Zheng and C. Wei, Appl. Catal., B, 2016, 182, 587–597 CrossRef CAS.
- W. J. Ong, L. L. Tan, S. P. Chai and S. T. Yong, Chem. Commun., 2015, 51, 858–861 RSC.
- S. Zhou, Y. Liu, J. Li, Y. Wang, G. Jiang, Z. Zhao, D. Wang, A. Duan, J. Liu and Y. Wei, Appl. Catal., B, 2014, 158–159, 20–29 CrossRef CAS.
- Z. Bastl, A. I. Senkevich, I. Spirovová and V. Vrtílková, Surf. Interface Anal., 2002, 34, 477–480 CrossRef CAS.
- Z. Wei, F. Liang, Y. Liu, W. Luo, J. Wang, W. Yao and Y. Zhu, Appl. Catal., B, 2017, 201, 600–606 CrossRef CAS.
- J. Zhou, T. Li, Z. Shu, Y. Tan, Z. Zhao and W. Wang, Appl. Catal., B, 2018, 230, 260–268 CrossRef.
- J. Long, H. Chang, Q. Gu, J. Xu, L. Fan, S. Wang, Y. Zhou, W. Wei, L. Huang, X. Wang, P. Liu and W. Huang, Energy Environ. Sci., 2014, 7, 973–977 RSC.
- C. Li, Z. Lou, Y. Yang, Y. Wang, Y. Lu, Z. Ye and L. Zhu, Langmuir, 2019, 35, 778–786 Search PubMed.
- A. S. Dezfuli, M. R. Ganjali, H. R. Naderi and P. Norouzi, RSC Adv., 2015, 5, 46050–46058 RSC.
- T. Giannakopoulou, I. Papailias, N. Todorova, N. Boukos, Y. Liu, J. Yu and C. Trapalis, Chem. Eng. J., 2017, 310, 571–580 CrossRef CAS.
- D. Xu, B. Cheng, S. Cao and J. Yu, Appl. Catal., B, 2015, 164, 380–388 CrossRef CAS.
- J. Luo, X. Zhou, L. Ma and X. Xu, Rational Construction of Z-Scheme Ag2CrO4/g-C3N4 Composites with Enhanced Visible-Light Photocatalytic Activity, Elsevier B.V., 2016, vol. 390 Search PubMed.
- S. Sakthivel and H. Kisch, Angew. Chem., Int. Ed., 2003, 42, 4908–4911 CrossRef CAS PubMed.
- P. Chelme-Ayala, M. G. El-Din and D. W. Smith, Water Res., 2010, 44, 2221–2228 CrossRef CAS PubMed.
- Z. Tong, D. Yang, T. Xiao, Y. Tian and Z. Jiang, Chem. Eng. J., 2015, 260, 117–125 CrossRef CAS.
- H. Zhu, D. Chen, D. Yue, Z. Wang and H. Ding, J. Nanopart. Res., 2014, 16, 1–10 CAS.
- Y. Chen, W. Huang, D. Hem, S. Yue and H. Huang, ACS Appl. Mater. Interfaces, 2014, 84, 203–211 Search PubMed.
- B. Zhang, Q. Wang, J. Zhuang, S. Guan and B. Li, J. Photochem. Photobiol., A, 2018, 362, 1–13 CrossRef CAS.
- J. Ma, X. Tan, T. Yu and X. Li, Int. J. Hydrogen Energy, 2016, 41, 3877–3887 CrossRef CAS.
- D. Yang, X. Zhao, Y. Chen, W. Wang, Z. Zhou, Z. Zhao and Z. Jiang, Ind. Eng. Chem. Res., 2019, 58, 5516–5525 CrossRef CAS.
Footnote |
| † Electronic supplementary information (ESI) available. See DOI: 10.1039/d1na00460c |
| This journal is © The Royal Society of Chemistry 2021 |


