 Open Access Article
On the myth of “red/near-IR carbon quantum dots” from thermal processing of specific colorless organic precursors†
Weixiong
Liang
a,
Ping
Wang
a,
Mohammed J.
Meziani
*b,
Lin
Ge
a,
Liju
Yang
 *c,
Amankumar K.
Patel
ab,
Sabina O.
Morgan
c and
Ya-Ping
Sun
 *a
*a
aDepartment of Chemistry and Laboratory for Emerging Materials and Technology, Clemson University, Clemson, South Carolina 29634, USA. E-mail: syaping@clemson.edu
bDepartment of Natural Sciences, Northwest Missouri State University, Maryville, Missouri 64468, USA. E-mail: meziani@nwmissouri.edu
cDepartment of Pharmaceutical Sciences, Biomanufacturing Research Institute and Technology Enterprise, North Carolina Central University, Durham, NC 27707, USA. E-mail: lyang@nccu.edu
First published on 10th June 2021
Abstract
Carbon dots were originally found and reported as surface-passivated small carbon nanoparticles, where the effective surface passivation was the chemical functionalization of the carbon nanoparticles with organic molecules. Understandably, the very broad optical absorptions of carbon dots are largely the same as those intrinsic to the carbon nanoparticles, characterized by progressively decreasing absorptivities from shorter to longer wavelengths. Thus, carbon dots are generally weak absorbers in the red/near-IR and correspondingly weak emitters with low quantum yields. Much effort has been made on enhancing the optical performance of carbon dots in the red/near-IR, but without meaningful success due to the fact that optical absorptivities defined by Mother Nature are in general rather inert to any induced alterations. Nevertheless, there were shockingly casual claims in the literature on the major success in dramatically altering the optical absorption profiles of “carbon dots” by simply manipulating the dot synthesis to produce samples of some prominent optical absorption bands in the red/near-IR. Such claims have found warm receptions in the research field with a desperate need for carbon dots of the same optical performance in the red/near-IR as that in the green and blue. However, by looking closely at the initially reported synthesis and all its copies in subsequent investigations on the “red/near-IR carbon dots”, one would find that the “success” of the synthesis by thermal or hydrothermal carbonization processing requires specific precursor mixtures of citric acid with formamide or urea. In the study reported here, the systematic investigation included precursor mixtures of citric acid with not only formamide or urea but also their partially methylated or permethylated derivatives for the carbonization processing under conditions similar to and beyond those commonly used and reported in the literature. Collectively all of the results are consistent only with the conclusion that the origins of the observed red/near-IR optical absorptions in samples from some of the precursor mixtures must be molecular chromophores from thermally induced chemical reactions, nothing to do with any nanoscale carbon entities produced by carbonization.
Introduction
Carbon dots (CDots)1–3 have emerged to represent a rapidly advancing and expanding research field, as made evident by the large and ever increasing number of relevant publications in the literature.3–16 Originally, CDots were prepared by the chemical functionalization of pre-processed and selected small carbon nanoparticles with organic molecules or polymers,1,17 which logically led to the classical definition on CDots as surface-functionalized (or more broadly as effectively surface-passivated) small carbon nanoparticles (Fig. 1).3,18 The optical absorptions of the carbon nanoparticles cover a broad spectral region including the visible, rather similar to those of carbon nanotubes (except for the bandgap transitions found in single-walled carbon nanotubes19,20) and graphene nanosheets due to their shared π-plasmon origins, which are all characterized by progressively decreasing absorptivities toward longer wavelengths.3 Therefore, the carbon nanoparticles are intrinsically weak optical absorbers in the red/near-IR, so are their derived CDots, because the surface functionalization of the carbon nanoparticles by colorless organic species does not alter their wavelength dependent optical absorptivities in any significant fashion according to the existing experimental evidence.21,22 Correspondingly, while the characteristically colorful fluorescence emissions of CDots at different excitation wavelengths do cover the red region, extending into the near-IR,1,23 their associated quantum yields are generally low to very low,23 representing a major disadvantage of CDots in some biomedical imaging and related applications. Thus, there have been extensive efforts in the research field on the search and development of “red/near-IR carbon dots”. By definition, such dots must be much more absorptive, namely with much higher optical absorptivities, in the red/near-IR spectral region than the carbon nanoparticles from which CDots are derived, and by extension also the other nanoscale carbon allotropies including carbon nanotubes and graphene nanosheets. This would clearly require some extraordinary exceptions to the established principles on electronic transitions in classical photophysics, as it is generally understood that optical absorptivities are fundamental parameters “given” by Mother Nature, hardly changeable in any substantial degree.24 Surprisingly, some research groups have declared the achievement of major successes in dramatically altering the optical absorption profiles of “carbon dots” by simply manipulating the dot synthesis to produce samples of some prominent optical absorption bands in the red/near-IR.25–29 Unfortunately, however, a fundamental problem with these shockingly casual claims is that whether their observed optical absorption bands are actually associated with any nanoscale carbon entities, which must be the key ingredient in any carbon-based quantum dots or the like, is questionable at best.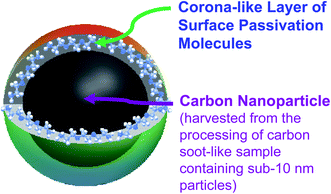 | ||
| Fig. 1 Cartoon illustration on the classically defined CDots obtained from the deliberate chemical functionalization of pre-existing carbon nanoparticles. | ||
On the preparation of dot samples in general, overwhelming majority of the syntheses reported in the literature have been based on the carbonization of organic precursors, often in “one-pot” thermal or hydrothermal processing, mostly under conditions such as 200 °C or lower in temperature for a few hours or less.30–37 With colorless organic molecules as precursors, such as commonly used mixtures of citric acid and amino molecules or oligomers (oligomeric polyethylenimine or PEI, as an example), the carbonization processing typically yields colored samples of fluorescence emissions resembling those of the classically defined CDots (Fig. 1).36,37 The spectroscopic evidence has generally been considered as sufficient for labeling the carbonized samples as carbon dots (or carbon nano-dots or various other naming variations), though the validity of such practice has raised serious concerns in recent studies, including the experimental evidence on molecular chromophores in the samples being primarily or majorly responsible for the spectroscopic results.38–42 Since by definition the purpose of carbonization is to carbonize the organic precursors, namely to produce carbon nanoparticle-like entities (or denoted as nanoscale carbon domains in some publications3,37), the optical absorptions of the samples thus prepared should in the best case be the same as or similar to those of the pre-existing carbon nanoparticles, which are again characterized by progressively decreasing absorptivities toward longer wavelengths in the visible.36 While fluorescence emissions in the red (extending into the near-IR) could be obtained with excitations at nearby wavelengths, the corresponding fluorescence quantum yields are always low, similar to what have been observed with the classically defined CDots.23 For the dot structures derived from both the pre-existing carbon nanoparticles and the carbonization, the apparent “deficiency” in the red/near-IR spectral region must be due to the law of Mother Nature that dictates the electronic transitions in the underlying nanoscale carbon entities.
Against such a backdrop, however, it was reported that strongly red/near-IR absorptive “carbon dots” could be produced by the same carbonization processing but only with the picking of a few specific colorless organic precursors.25–29 The keywords here are “picking”, “a few”, and “specific”, as the reported syntheses have so far been limited to a handful of specific organic mixtures as colorless precursors, mostly citric acid with formamide or urea, which are chemically equivalent in terms of the amide moiety (one in the former versus two symmetrically in the latter).25–29 Since thermally induced carbonization is a process generally considered as random and chaotic, the high selectivity and specificity with respect to the picking of precursors should have triggered alarms or at least suspicions on the true nature and outcome of the thermal or hydrothermal processing intended for carbonization. Nevertheless, the urge to move carbon-based quantum dots into the red/near-IR spectral region must have gotten in the way of rigorously validating the claims on the making of “red/near-IR carbon dots”. While most of the theoretical and mechanistic efforts have been on rationalizing such dots, some others have apparently had serous reservations on the existence of the claimed “red/near-IR carbon dots”, probably too good to be true/real.41,43,44
Here we report a systematic investigation on the mixtures of citric acid with urea or formamide or with their partially methylated or permethylated derivatives for the carbonization processing under conditions similar to and beyond those commonly used and reported in the literature. Collectively all of the results are consistent only with the conclusion that the origins of the observed red/near-IR optical absorptions in samples from some of the precursor mixtures must be molecular chromophores from thermally induced chemical reactions, nothing to do with any nanoscale carbon entities produced by carbonization.
Results and discussion
In literature reports,25–29 mixtures of citric acid with urea or formamide (Fig. 2) have been among a handful of colorless organic precursors for thermal or hydrothermal processing into samples of significant red/near-IR absorption bands. In this work the same mixtures were investigated systematically under processing conditions similar to and more aggressive than those reported in the literature. Other related precursor mixtures of citric acid with partially methylated or permethylated urea or formamide derivatives (Fig. 2) were also systematically investigated for comparison.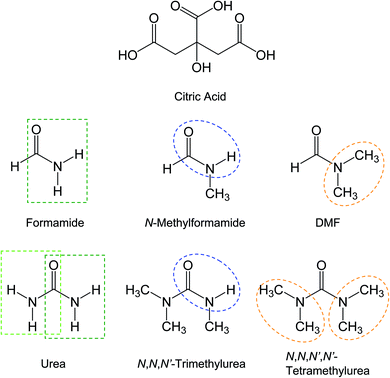 | ||
| Fig. 2 Molecular structures of the molecules involved in the thermal processing, with the key functional groups highlighted. | ||
Thermal processing of precursor mixtures and spectroscopic results
Citric acid (CA)–urea
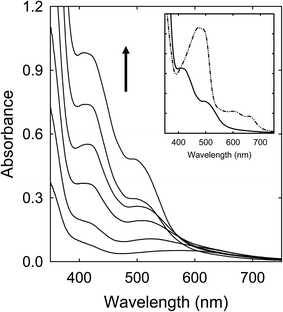
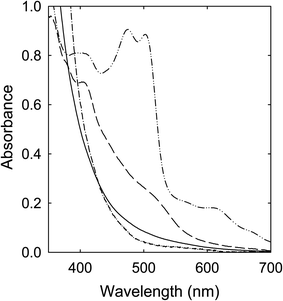
Solutions of the CA–urea mixture in DMF (clear and colorless in appearance) were heated with stirring at 100 °C (6–72 h), 135 °C (6 h), and 160 °C (6 h), and the solutions all became dark red in color, including the one processed at 100 °C for 72 h, mostly consistent with what have been reported in the literature.28,29 Their corresponding optical absorption spectra are compared in Fig. 3. The similar spectral profiles for the samples obtained from the treatments at 135 °C and 160 °C suggest that the underlying species responsible for the red appearance could be produced at processing temperatures significantly lower than the 160 °C popular in studies reported in the literature.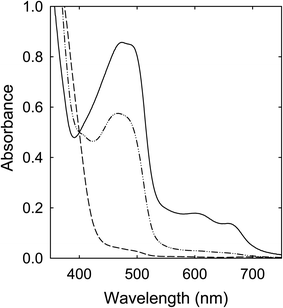 | ||
| Fig. 3 Optical absorptions of samples from the CA–urea mixture processed for 6 h at 100 °C (dash), 135 °C (dash-dot-dot), and 160 °C (solid). | ||
Citric acid (CA)–N,N,N′-trimethylurea (TriMU)
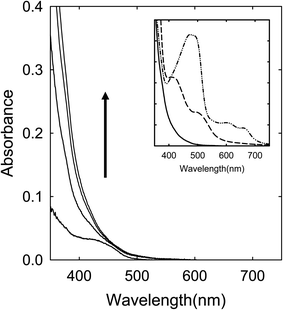
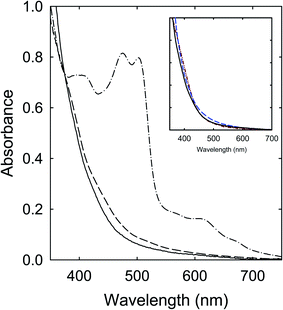
A solution of the CA–TriMU in DMF was heated with stirring at 160 °C for up to 6 h, and the solution became dark red in color in the end. Shown in Fig. 4 are corresponding absorption spectra. The absorptions are overall much lower than those of the CA–urea samples obtained from comparable processing conditions, especially for the missing of the absorption bands in the red spectral region (Fig. 4).Citric acid (CA)–N,N,N′,N′-tetramethylurea (TetraMU)
A solution of the CA––TetraMU in DMF was heated with stirring at 160 °C for up to 6 h. The solution color did not change in any dramatic fashion, becoming only light yellow even after the thermal processing for 6 h. The corresponding absorption spectrum is apparently featureless in the visible spectral region (Fig. 5), similar to that of the small carbon nanoparticles in well functionalized CDots.22Citric acid (CA)–formamide (FA)
A solution of the CA–FA mixture in DMF was heated with stirring at 160 °C for 6 h, in which the solution also became dark red in color in the end. Shown in Fig. 6 is the corresponding absorption spectrum, whose profile is apparently comparable with that of the sample from the similarly processed CA–urea mixture.Citric acid (CA)–N-methylformamide (MFA)
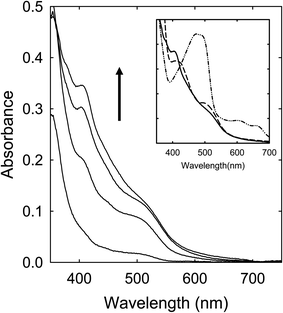
A solution of the CA–MFA mixture in DMF was heated with stirring at 160 °C for up to 6 h, during which the solution turned to dark red in color, suggesting significant absorptions over the visible spectrum. However, the observed absorption spectra are again different from those of the sample solutions from the CA–FA mixture as precursor, missing the red band features found in the latter (Fig. 7).Citric acid (CA)–DMF
A solution of CA in DMF was heated with stirring at 160 °C for 6 h, and the solution color was little changed, only turning light yellow in the end. The corresponding absorption spectrum is shown in Fig. 8. As also compared in the figure, the spectral profile is rather similar to that of the sample solution from the processing of the CA–TetraMU mixture, both of which are comparable with that of the small carbon nanoparticles in well functionalized CDots.22Implications of the spectroscopic comparisons
The results presented and discussed above on the spectroscopic comparisons for samples from the thermal processing of different precursor mixtures are hardly random, exhibiting instead clear and dramatic dependencies on the chemical structures of the precursor organic molecules, namely the different urea and formamide derivatives. Such dependencies counter the purpose and principles of the thermal carbonization, which should by no means be so sensitive to the relatively minor variations in chemical structures of the precursor organic molecules, suggesting that the samples from the processing are much more likely dominated by products from chemical reactions for at least the observed spectroscopic results in the visible spectrum at longer wavelengths including the red/near-IR absorption features.Citric acid (CA) with three carboxyl groups is thermally not so stable, understandably popular as a precursor for carbonization in many studies reported in the literature. However, for urea, formamide (FA), or their derivatives in the precursor mixtures, the thermal processing outcomes are obviously dependent sensitively on specific chemical structures of the amide moieties identified in Fig. 2, suggesting that the thermally induced processes relevant to the observed red/near-IR absorption features of the products thus produced must be dominated by chemical reactions instead of the intended carbonization. The chemical reactions are likely rather similar between CA–urea and CA–FA mixtures, yielding species of comparable absorption spectral features (Fig. 6). What is shared by urea and FA in terms of chemical functionalities is that they both contain unsubstituted amide groups, as highlighted in Fig. 2. In that sense, urea is chemically equivalent to symmetrically fused two FA molecules. At the other extreme with all of the amide moieties methylated in N,N,N′N′-tetramethylurea (TetraMU) and DMF (N,N-dimethylformamide), the same thermal processing conditions could not produce any species of red/near-IR absorptions at all, yielding instead samples of absorptions similar to those of pre-existing carbon nanoparticles (Fig. 8). The clear correlation between the unsubstituted amide groups in urea and FA and the observed red/near-IR absorptions points to dye-like products formed in the thermally induced chemical reactions of CA with urea or FA, namely that the specific chemical reactions require the unsubstituted amide groups (Fig. 2).
For urea and FA derivatives of one unsubstituted amide group (TriMU and MFA, respectively) in the precursor mixtures, the thermal processing could yield products of similarly enhanced absorptions in the visible spectrum, but only to about 600 nm (Fig. 4 and 7), without the red/near-IR absorption bands/features found for the products from the CA–urea and CA–FA precursor mixtures discussed above. Nevertheless, all of these results suggest that unsubstituted amide groups (-CONH, as identified in Fig. 2) must be critical in their thermally induced chemical reactions with CA to yield dye-like products of significant absorptions at longer wavelengths in the visible spectrum, extending into the near-IR for some of the products (Fig. 6). Such absorptions are responsible for the dark red appearance of their corresponding solutions after the thermal processing, apparently prompted the claims in the literature on the successful preparation of “red carbon quantum dots” or “red/near-IR carbon quantum dots”.25–29 However, with the complete absence of such absorptions in samples from CA mixtures with TetraMU or DMF (Fig. 8), in which the amide groups are fully methylated (Fig. 2), the specific molecular structural dependence of thermal processing outcomes is indicative of thermally induced chemical reactions, rather than the commonly perceived carbonization. Obviously there are no justifications at all for any thermally induced carbonization to be highly sensitive to the –CONH moiety in urea, FA, and their derivatives as organic molecular precursors. Logically, the chemical reactions must have produced molecular products, some of which contain red or red/near-IR chromophores, but certainly nothing to do with any carbonization-generated “carbon quantum dots”.
On the comparison between the samples from CA–urea and CA–FA mixtures as precursors, their optical absorptions share similar spectral features that are responsible for the observed dark red solution color, again consistent with the formation of similar underlying red/near-IR chromophores in thermally induced chemical reactions, not any carbon-based/derived quantum dots by the intrinsically chaotic and indiscriminative carbonization. In fact, the intended carbonization for the thermal processing, which at up to 160 °C for a few hours could not be as significant or substantial as claimed in some literature reports, might produce relatively small amounts of nanoscale carbon domains as a part of the complicated product mixtures in the resulting samples. The optical absorptions of the nanoscale carbon domains thus produced are generally rather similar to those of pre-existing carbon nanoparticles.22
Carbonization conditions and outcomes
Among the precursor mixtures in this work (Fig. 2), those of CA with TetraMU and DMF that do not contain unsubstituted amide groups could not participate in the thermally induced chemical reactions to form the dark red colored chromophores. Instead, their products from the thermal processing would reflect mostly the outcomes of the limited carbonization due to the relatively mild processing conditions. The observed absorptions are largely similar between the products from CA–TetraMU and CA–DMF (Fig. 8) and also comparable to those of the small carbon nanoparticles in well functionalized CDots, where the well functionalization eliminates a major portion of the light scattering found in suspensions of the carbon nanoparticles. For the other precursor mixtures (Fig. 2), the contributions due to the actual carbonization can become more prominent and eventually dominant as more aggressive thermal processing conditions are applied.41For the CA–FA mixture as an example, the carbonization could be enhanced significantly by increasing the thermal processing temperature to 260 °C or 300 °C, yielding samples that were generally less soluble. The insoluble precipitants appeared black, suggesting high carbon contents. For the supernatants, the measured optical absorptions are similar in profile to those of the samples from the processing of CA–TetraMU and CA–DMF mixtures at 160 °C for 6 h, and again comparable with those of the pre-existing small carbon nanoparticles (Fig. 9). The similarity and comparability are understandable, as the thermal carbonization must be indiscriminative, generally independent of the precise chemical structures of the organic precursors used for the carbonization.
Logically, the dependence on the thermal processing conditions for the mixtures containing the unsubstituted amide groups is such that at lower processing temperatures, probably up to around 200 °C, the dominating reactions in the mixtures must be chemical in nature to produce organic chromophores of absorptions in the visible spectrum, including the red/near-IR for some products. The intended carbonization is secondary at best under the relatively mild processing conditions,37–41 but does play a role in complicating the product mixtures and hindering the separation and isolation of the organic chromophores in the product mixtures, as discussed in more detail below. With more aggressive processing conditions at higher temperatures, the carbonization apparently becomes more significant, carbonizing not only the precursor mixtures, but also the initially produced organic chromophores (thus eliminating their corresponding absorptions). The observed optical absorptions converge to those of the pre-existing carbon nanoparticles that are well dispersed and mostly free from scattering effects (Fig. 9), as one would expect. For the precursor mixtures with TetraMU and DMF, their lack of unsubstituted amide groups makes them incapable of the chemical reactions, thus only relatively minor carbonization at the lower processing temperatures. Their similar visible absorptions for all samples from different processing conditions should have been expected, as such absorptions are due to nanoscale carbon domains or entitles that are likely smaller but not fundamentally different from the pre-existing small carbon nanoparticles in terms of the underlying optical transitions.
Complex product mixtures and separation effort
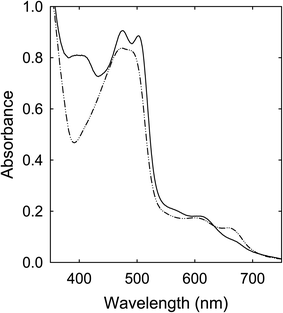
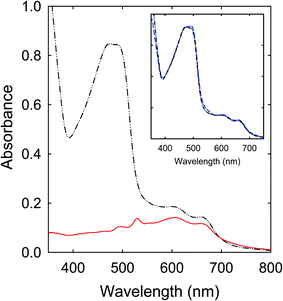
The spectroscopy results presented and discussed above are on as-produced samples without any post-production treatments for the purpose of not to introduce any unintended changes to the samples. Since the precursor mixtures are all colorless, the optical absorption results in the visible spectrum are therefore free from any contributions from unreacted molecules in the precursor mixtures, namely that the observed visible absorptions are due entirely to contributions by the produced organic chromophores and various populations of nanoscale carbon domains or entities.The samples from the thermally induced chemical reactions of CA with urea, FA, or their derivatives of unsubstituted amide groups are understandably complex due to the intrinsically non-selective nature of the processing conditions originally intended for carbonization. For the samples obtained from the processing at 160 °C for a few hours, which are representative in terms of the observed strong visible absorptions at longer wavelengths, the removal of unreacted precursor molecules and other species from the as-processed samples had little effects on the observed optical absorption spectra. More specifically on the sample from the CA–urea precursor mixture as an example, the as-processed sample could be cleaned via anti-solvent precipitation, from the original concentrated DMF solution into dichloromethane (DCM) as the anti-solvent. The visible absorptions of the cleaned sample are essentially the same as those of the as-processed sample (Fig. 10). Further fractionation and separation efforts on the cleaned sample revealed that it was a complex mixture of colored species that are collectively responsible for the observed visible absorptions.
In the fractionation via precipitation from a concentrated DMF solution into methanol as anti-solvent, the fraction insoluble in methanol could be identified as being nearly entirely responsible for the observed red/near-IR absorption features (Fig. 10), namely the same absorptions that have prompted the perception and claim of “red/near-IR carbon quantum dots” in the literature.25–29 These “magic dots” of red/near-IR absorptions and emissions were supposed to be produced in carbonization under conditions such as the commonly employed and reported thermal treatments at 160 °C for a few hours. In reality, however, these absorptions could not have been due to entities containing carbon nanoparticles, which represent the key ingredient and structural element of any carbon “quantum” dots, because the well established optical absorptions of the pre-existing carbon nanoparticles at shorter wavelengths are largely absent (Fig. 10). Rather, the observed red/near-IR absorption features must be associated with molecular chromophores from the thermally induced chemical reactions, which are likely mixtures by themselves and also in complex mixtures with other species, including some nanoscale carbon domains or entities from the limited carbonization.
GC-MS results of the methanol soluble fraction suggested complex mixtures, so did the results from 1H and 13C NMR characterizations. The separation of the fractions on thin-layer chromatography plates each yielded a large number of poorly separated components, again suggesting complex mixtures. While in principle the mixtures could be separated for the identification of individual compounds, a likely complication in these mixtures was the consequence of carbonization, not substantial but nevertheless present in the thermal processing, producing nanoscale carbon domains or entities that would essentially serve the function of crosslinking agents to link multiple organic species in the mixtures. Evidence for the presence of such “polymeric” species included the significant broadening in some of the NMR peaks. The separation and identification of the organic molecular chromophores formed in the thermally induced chemical reactions clearly represent an intrinsically challenging task, somewhat beyond the scope of this work that is to show that the observed red/near-IR absorption features could not be due to any “red/near-IR carbon quantum dots” from the thermal processing.
More discussion and conclusion
On the samples from the thermal processing of the various colorless organic precursor mixtures in this work, our focus on optical absorptions at longer wavelengths in the visible spectrum is deliberate, even though these samples are also emissive in the similar spectral region, as our purpose is to eliminate the need to deal with photoexcited states and related complications. By definition, therefore, the real red/near-IR carbon dots, if existed, should be carbon dots of substantially more optically absorptive in the red/near-IR spectral region than their counterparts that do not. More clearly, the red/near-IR absorptions must be due to the intrinsic optical transitions of the nanoscale carbon domains or entities in the dots, not due to any organic dyes or similar molecular chromophores in the dot structures. Red dyes (or molecular chromophores in general) incorporated, doped, or modified dot-like carbon nanostructures are by no means red carbon dots, just like in the case of colloidal TiO2 that similar red dye modifications obviously do not make “red TiO2 nanoparticles”. It should be pointed out that for carbon dots (or classically defined CDots illustrated in Fig. 1), their optical absorptions are always similar to those of the core carbon nanoparticles in the dots, demonstrating their high stabilities in optical absorptivities against changes due to structural and other modifications such as the carbon nanoparticle surface functionalization by the commonly used organic species. In fact, the general lack of means to alter optical absorptivities dramatically, except for in some limited cases relatively meaningful changes associated with making forbidden transitions more allowed, is consistent with the general knowledge and principles in photophysics. With respect to the repeated claims of “red/near-IR carbon dots” in the literature, however, there has been a surprisingly lack of considerations in the reported studies on why and how the simple and specific organic precursor mixtures processed under relatively mild thermal conditions could produce the presumed “carbon nanomaterials” of so dramatically different optical transitions from those of the pre-existing carbon nanoparticles (or other nanoscale carbon allotropes including carbon nanotubes and graphene nanosheets). A similarly simple and also much more logical explanation is that the observed red/near-IR absorption features are due to molecular chromophores in the thermally processed samples, namely that the chromophores are formed in the chemical reactions under processing conditions intended for carbonization.Among various theoretical and mechanistic rationale in the literature on the claimed “red/near-IR carbon quantum dots”, some did question or postulate the involvement of molecular chromophores for their being responsible for the observed red/near-IR absorptions.41,43,44 As discussed above, however, carbon dots containing red molecular chromophores are hardly red carbon dots. In fact, there have been studies in which red/near-IR organic dyes were explicitly included in the precursor mixtures for carbonization to obtain dot samples that are strongly absorptive in the red/near-IR spectral region.45–47 These are again red/near-IR dyes incorporated or modified dot structures, not red/near-IR dots. The difference of those samples from the samples obtained from the thermal processing of CA–urea mixtures, for example, is that in the former the dye incorporation or modification is deliberate and explicit, while in the latter the dye-like species are produced in the processing, creating the elusion of new dot structures that are genuinely absorptive strongly in the red/near-IR. The latter is also much less tunable or controllable, making no sense at all.
In conclusion, the red/near-IR absorptive samples from the thermal or hydrothermal processing of a handful of specific organic precursor mixtures, such as citric acid with formamide or urea, should not be claimed as “red/near-IR carbon dots” at all, because they are not theoretically or practically. These samples are complex mixtures containing some limited nanoscale carbon domains or entities, molecular chromophores or organic dye-like species formed in thermally induced chemical reactions, and other organic species that have survived the mild carbonization conditions. The effort on the separation, isolation, and identification of the molecular chromophores/dyes in the samples was unsuccessful in this work due to challenges associated with the complexity and more so with the expected crosslinking in the sample mixtures. More studies are needed to address the challenges, which may prove to be very tough.
Experimental section
Materials
Citric acid (CA), formamide (FA), and DMF were purchased from VWR, urea (>98.3%), N-methylformamide (MFA, 99%), and N,N,N′-trimethylurea (TriMU) from Alfa Aesar, and N,N,N′,N′-tetramethylurea (TetraMU) from TCI. Water was deionized and purified in a Millipore Direct Q Water Purification System.Measurement
Optical absorption spectra were recorded on a Shimadzu UV-2501 spectrophotometer. NMR measurements were performed on a Bruker NEO 500 MHz NMR spectrometer equipped with a Prodigy nitrogen-cooled cryoprobe. Gas chromatography-mass spectrometry (GC-MS) analyses were carried out on a Shimadzu GCMS-QP2010 SE instrument.CA–urea
CA (1 g) and urea (2 g) were dissolved in DMF (10 mL) in a glass vial under mild sonication (VWR 250D ultrasonic cleaner). The resulting colorless solution was transferred to a two-neck round bottom flask (25 mL), with one neck fitted with a glass condenser and the other for purging with nitrogen, in an oil bath pre-heated to 100 °C, 135 °C or 160 °C. After stirring for 6 h under nitrogen protection, the solution was cooled back to ambient temperature for characterization and measurements.For the anti-solvent precipitation from DMF into dichloromethane (DCM), the as-processed sample solution in DMF was concentrated to around 5 mL, and then slowly dropped into DCM (100 mL) in an Erlenmeyer flask with vigorous stirring. The resulting mixture was vacuum-filtrated through a 0.22 μm membrane filter, and the filter cake was collected and washed with DCM three times.
Similarly for the anti-solvent precipitation into methanol, the concentrated sample solution in DMF was slowly dropped into ice cold methanol (100 mL) in an Erlenmeyer flask with vigorous stirring. The mixture was vacuum-filtrated through a 0.22 μm membrane filter, and the filter cake was collected and washed with cold methanol three times.
CA–TriMU and CA–TetraMU
CA (1 g) and TriMU (2 g) were dissolved in DMF (10 mL) in a glass vial under mild sonication (VWR 250D ultrasonic cleaner). The solution was transferred to a two-neck round bottom flask in an oil bath pre-heated to 160 °C. The thermal reaction with stirring was for up to 6 h, during which a few drops of the reaction mixture were taken every hour for absorption measurement. After 6 h, the final solution was cooled back to ambient temperature for characterization and measurements.The CA–TetraMU mixture in DMF solution was prepared and processed in the same way under the same conditions.
CA–FA
CA (0.5 g) was dissolved in DMF (10 mL) in a glass vial at 40 °C under mild sonication (VWR 250D ultrasonic cleaner), and to the solution was added FA (5 mL) with some more sonication. The resulting mixture was transferred to a two-neck round bottom flask in an oil bath pre-heated to 160 °C, and stirred for 6 h under nitrogen protection, followed by the cooling of the solution back to ambient temperature for characterization and measurements.The same precursor mixture of CA–FA was loaded into a stainless steel tube reactor (1.9 cm OD and 30 cm long). The sealed reactor was heated in a tube furnace at 260 °C or 300 °C for 2 h. Post-processing, the reaction mixture in the reactor back at ambient temperature was collected, including the washing of the reactor with water. The aqueous mixture thus obtained was centrifuged at 1000 g to collect the supernatant for characterization and measurements.
CA–MFA
CA (0.5 g) was dissolved in DMF (7.6 mL) at 40 °C under mild sonication (VWR 250D ultrasonic cleaner), and to the solution was added MFA (7.4 mL). The resulting mixture was transferred to a two-neck round bottom flask in an oil bath pre-heated to 160 °C, and stirred for 6 h under nitrogen protection. During the reaction a small aliquot (∼50 μL) of the solution was taken every hour for absorption measurement. At the conclusion of the reaction, the final solution was cooled back to ambient temperature for characterization and measurements.CA in DMF
The solution of CA (1 g) in DMF (10 mL) was stirred in a two-neck round bottom flask under nitrogen protection in an oil bath at 160 °C for 6 h. During the reaction, a few drops of the solution were taken every hour for absorption measurement. At the conclusion of the reaction, the final solution was cooled back to ambient temperature for characterization and measurements.Conflicts of interest
There are no conflicts to declare.Acknowledgements
Financial support from NSF (1855905, 1701399, and 1701424) is gratefully acknowledged. A. K. P. was a participant of Palmetto Academy, a summer undergraduate research program of the South Carolina Space Grant Consortium.References
- Y.-P. Sun, B. Zhou, Y. Lin, W. Wang, K. A. S. Fernando, P. Pathak, M.J. Meziani, B. A. Harruff, X. Wang, H. Wang, P. G. Luo, H. Yang, M. E. Kose, B. Chen, L. M. Veca and S.-Y. Xie, Quantum-Sized Carbon Particles for Bright and Colorful Photoluminescence, J. Am. Chem. Soc., 2006, 128, 7756–7757 Search PubMed.
- Y.-P. Sun, Fluorescent Carbon Nanoparticles. US Pat. 7,829,772 B2, 2010 Search PubMed.
- Y.-P. Sun, Carbon Dots - Exploring Carbon at Zero-Dimension. Springer International Publishing, 2020 Search PubMed.
- P. G. Luo, S. Sahu, S.-T. Yang, S. K. Sonkar, J. Wang, H. Wang, G. E. LeCroy, L. Cao and Y.-P. Sun, Carbon “Quantum” Dots for Optical Bioimaging, J. Mater. Chem. B, 2013, 1, 2116–2127 Search PubMed.
- C. Ding, A. Zhu and Y. Tian, Functional Surface Engineering of C-Dots for Fluorescent Biosensing and in Vivo Bioimaging, Acc. Chem. Res., 2014, 47, 20–30 Search PubMed.
- P. G. Luo, F. Yang, S.-T. Yang, S. K. Sonkar, L. Yang, J. J. Broglie, Y. Liu and Y.-P. Sun, Carbon-Based Quantum Dots for Fluorescence Imaging of Cells and Tissues, RSC Adv., 2014, 4, 10791–10807 Search PubMed.
- S. Y. Lim, W. Shen and Z. Gao, Carbon Quantum Dots and Their Applications, Chem. Soc. Rev., 2015, 44, 362–381 Search PubMed.
- K. A. S. Fernando, S. Sahu, Y. Liu, W. K. Lewis, E. A. Guliants, A. Jafariyan, P. Wang, C. E. Bunker and Y.-P. Sun, Carbon Quantum Dots and Applications in Photocatalytic Energy Conversion, ACS Appl. Mater. Interfaces, 2015, 7, 8363–8376 Search PubMed.
- G. E. LeCroy, S.-T. Yang, F. Yang, Y. Liu, K. A. S. Fernando, C. E. Bunker, Y. Hu, P. G. Luo and Y.-P. Sun, Functionalized Carbon Nanoparticles: Syntheses and Applications in Optical Bioimaging and Energy Conversion, Coord. Chem. Rev., 2016, 320, 66–81 Search PubMed.
- Z. Peng, X. Han, S. Li, A. O. Al-Youbi, A. S. Bashammakh, M. S. El-Shahawi and R. M. Leblanc, Carbon Dots: Biomacromolecule Interaction, Bioimaging and Nanomedicine, Coord. Chem. Rev., 2017, 343, 256–277 Search PubMed.
- G. A. M. Hutton, B. C. M. Martindale and E. Reisner, Carbon Dots as Photosensitisers for Solar-Driven Catalysis, Chem. Soc. Rev., 2017, 46, 6111–6123 Search PubMed.
- D. Xu, Q. Lin and H.-T. Chang, Recent Advances and Sensing Applications of Carbon Dots, Small Methods, 2020, 4, 1900387 Search PubMed.
- R. Das, R. Bandyopadhyay and P. Pramanik, Carbon Quantum Dots from Natural Resource: A Review, Mater. Today Chem., 2018, 8, 96–109 Search PubMed.
- J. Du, N. Xu, J. Fan, W. Sun and X. Peng, Carbon Dots for In Vivo Bioimaging and Theranostics, Small, 2019, 15, 1805087 Search PubMed.
- Y. Li, X. Xu, Y. Wu, J. Zhuang, X. Zhang, H. Zhang, B. Lei, C. Hu and Y. Liu, A Review on the Effects of Carbon Dots in Plant Systems, Mater. Chem. Front., 2020, 4, 437–448 Search PubMed.
- Indriyati, I. Primadona, F. A. A. Permatasari, M. A. Irham, D. E. M. nasir and F. Iskandar, Recent Advances and Rational Design Strategies of Carbon Dots towards Highly Efficient Solar Evaporation, Nanoscale, 2021, 13, 7523–7532 Search PubMed.
- L. Cao, X. Wang, M. J. Meziani, F. Lu, H. Wang, P. G. Luo, Y. Lin, B. A. Harruff, L. M. Veca, D. Murray, S.-Y. Xie and Y.-P. Sun, Carbon Dots for Multiphoton Bioimaging, J. Am. Chem. Soc., 2007, 129, 11318–11319 Search PubMed.
- L. Cao, M. J. Meziani, S. Sahu and Y.-P. Sun, Photoluminescence Properties of Graphene versus Other Carbon Nanomaterials, Acc. Chem. Res., 2013, 46, 171–180 Search PubMed.
- S. M. Bachilo, M. S. Strano, C. Kittrell, R. H. Hauge, R. E. Smalley and R. B. Weisman, Structure-Assigned Optical Spectra of Single-Walled Carbon Nanotubes, Science, 2002, 298, 2361 Search PubMed.
- S. Niyogi, M. A. Hamon, H. Hu, B. Zhao, P. Bhowmik, R. Sen, M. E. Itkis and R. C. Haddon, Chemistry of Single-Walled Carbon Nanotubes, Acc. Chem. Res., 2002, 35, 1105–1113 Search PubMed.
- G. E. LeCroy, S. K. Sonkar, F. Yang, L. M. Veca, P. Wang, K. N. Tackett, J.-J. Yu, E. Vasile, H. Qian, Y. Liu, P. J. Luo and Y.-P. Sun, Toward Structurally Defined Carbon Dots as Ultracompact Fluorescent Probes, ACS Nano, 2014, 8, 4522–4529 Search PubMed.
- L. Ge, N. Pan, J. Jin, P. Wang, G. E. LeCroy, W. Liang, L. Yang, L. R. Teisl, Y. Tang and Y.-P. Sun, Systematic Comparison of Carbon Dots from Different Preparations-Consistent Optical Properties and Photoinduced Redox Characteristics in Visible Spectrum and Structural and Mechanistic Implications, J. Phys. Chem. C, 2018, 122, 21667–21676 Search PubMed.
- G. E. LeCroy, F. Messina, A. Sciortino, C. E. Bunker, P. Wang, K. A. S. Fernando and Y.-P. Sun, Characteristic Excitation Wavelength Dependence of Fluorescence Emissions in Carbon Quantum Dots, J. Phys. Chem. C, 2017, 121, 28180–28186 Search PubMed.
- N. J. Turro, V. Ramamurthy and J. C. Scaiano, Modern Molecular Photochemistry of Organic Molecules, University Science Books, Sausalito, CA, 2010 Search PubMed.
- L. Pan, S. Sun, A. Zhang, K. Jiang, L. Zhang, C. Dong, Q. Huang, A. Wu and H. Lin, Truly Fluorescent Excitation-Dependent Carbon Dots and Their Applications in Multicolor Cellular Imaging and Multidimensional Sensing, Adv. Mater., 2015, 27, 7782–7787 Search PubMed.
- S. Sun, L. Zhang, K. Jiang, A. Wu and H. Lin, Toward High-Efficient Red Emissive Carbon Dots: Facile Preparation, Unique Properties, and Applications as Multifunctional Theranostic Agents, Chem. Mater., 2016, 28, 8659–8668 Search PubMed.
- H. Ding, J.-S. Wei, N. Zhong, Q.-Y. Gao and H.-M. Xiong, Highly Efficient Red-Emitting Carbon Dots with Gram-Scale Yield for Bioimaging, Langmuir, 2017, 33, 12635–12642 Search PubMed.
- D. Chen, W. Wu, Y. Yuan, Y. Zhou, Z. Wan and P. Huang, Intense Multi-State Visible Absorption and Full-Color Luminescence of Nitrogen-Doped Carbon Quantum Dots for Blue-Light-Excitable Solid-State-Lighting, J. Mater. Chem. C, 2016, 4, 9027–9035 Search PubMed.
- S. Qu, D. Zhou, D. Li, W. Ji, P. Jing, D. Han, L. Liu, H. Zeng and D. Shen, Toward Efficient Orange Emissive Carbon Nanodots through Conjugated sp2-Domain Controlling and Surface Charges Engineering, Adv. Mater., 2016, 28, 3516–3521 Search PubMed.
- Y. Dong, R. Wang, H. Li, J. Shao, Y. Chi, X. Lin and G. Chen, Polyamine-Functionalized Carbon Quantum Dots for Chemical Sensing, Carbon, 2012, 50, 2810–2815 Search PubMed.
- X. Zhai, P. Zhang, C. Liu, T. Bai, W. Li, L. Dai and W. Liu, Highly Luminescent Carbon Nanodots by Microwave-Assisted Pyrolysis, Chem. Commun., 2012, 48, 7955–7957 Search PubMed.
- P. C. Hsu and H. T. Chang, Synthesis of High-Quality Carbon Nanodots from Hydrophilic Compounds: Role of Functional Groups, Chem. Commun., 2012, 48, 3984–3986 Search PubMed.
- J. Liu, X. Liu, H. Luo and Y. Gao, One-Step Preparation of Nitrogen-Doped and Surface-Passivated Carbon Quantum Dots with High Quantum Yield and Excellent Optical Properties, RSC Adv., 2014, 4, 7648–7654 Search PubMed.
- C. Wang, Z. Xu and C. Zhang, Polyethyleneimine-Functionalized Fluorescent Carbon Dots: Water Stability, pH Sensing, and Cellular Imaging, ChemNanoMat, 2015, 1, 122–127 Search PubMed.
- C. S. Stan, C. Albu, A. Coroaba, M. Popa and D. Sutiman, One Step Synthesis of Fluorescent Carbon Dots through Pyrolysis of N-hydroxysuccinimide, J. Mater. Chem. C, 2015, 3, 789–795 Search PubMed.
- X. Hou, Y. Hu, P. Wang, L. Yang, M. M. Al Awak, Y. Tang, F. K. Twara, H. Qian and Y.-P. Sun, Modified Facile Synthesis for Quantitatively Fluorescent Carbon Dots, Carbon, 2017, 122, 389–394 Search PubMed.
- P. Wang, M. J. Meziani, Y. Fu, C. E. Bunker, X. Hou, L. Yang, H. Msellek, M. Zaharias, J. P. Darby and Y.-P. Sun, Carbon Dots versus Nano-Carbon/Organic Hybrids – Dramatically Different Behaviors in Fluorescence Sensing of Metal Cations with Structural and Mechanistic Implications, Nanoscale Adv., 2021, 3, 2316–2324 Search PubMed.
- Y. Xiong, J. Schneider, E. V. Ushakova and A. L. Rogach, Influence of Molecular Fluorophores on the Research Field of Chemically Synthesized Carbon Dots, Nano Today, 2018, 23, 124–139 Search PubMed.
- S. Khan, A. Sharma, S. Ghoshal, S. Jain, M. K. Hazra and C. K. Nandi, Small Molecular Organic Nanocrystals Resemble Carbon Nanodots in Terms of Their Properties, Chem. Sci., 2018, 9, 175–180 Search PubMed.
- V. Hinterberger, C. Damm, P. Haines, D. M. Guldi and W. Peukert, Purification and Structural Elucidation of Carbon Dots by Column Chromatography, Nanoscale, 2019, 11, 8464–8474 Search PubMed.
- W. Liang, L. Ge, X. Hou, X. Ren, L. Yang, C. E. Bunker, C. M. Overton, P. Wang and Y.-P. Sun, Evaluation of Commercial “Carbon Quantum Dots” Sample on Origins of Red Absorption and Emission Features, C – J. Carbon Res., 2019, 5, 70 Search PubMed.
- W. Liang, C. E. Bunker and Y.-P. Sun, Carbon Dots: Zero-Dimensional Carbon Allotrope with Unique Photoinduced Redox Characteristics, ACS Omega, 2020, 5, 965–971 Search PubMed.
- E. V. Kundelev, N. V. Tepliakov, M. Y. Leonov, V. G. Maslov, A. V. Baranov, A. V. Fedorov, I. D. Rukhlenko and A. L. Rogach, Toward Bright Red-Emissive Carbon Dots through Controlling Interaction among Surface Emission Centers, J. Phys. Chem. Lett., 2020, 11, 8121–8127 Search PubMed.
- B. Zhi, X. Yao, M. Wu, A. Mensch, Y. Cui, J. Deng, J. J. Duchimaza-Heredia, K. J. Trerayapiwat, T. Niehaus, Y. Nishimoto, B. P. Frank, Y. Zhang, R. E. Lewis, E. A. Kappel, R. J. Hamers, H. D. Fairbrother, G. Orr, C. J. Murphy, Q. Cui and C. L. Haynes, Multicolor Polymeric Carbon Dots: Synthesis, Separation and Polyamide-Supported Molecular Fluorescence, Chem. Sci., 2021, 12, 2441–2455 Search PubMed.
- Y.-P. Sun, P. Wang, Z. Lu, Y. Fan, J. M. Mohammed, G. E. LeCroy, Y. Liu and H. Qian, Host-Guest Carbon Dots for Enhanced Optical Properties and Beyond, Sci. Rep., 2015, 5, 12354 Search PubMed.
- P. Wang, J. H. Liu, H. Gao, Y. Hu, X. Hou, G. E. LeCroy, C. E. Bunker, Y. Liu and Y.-P. Sun, Host–Guest Carbon Dots as High-Performance Fluorescence Probes, J. Mater. Chem. C, 2017, 5, 6328–6335 Search PubMed.
- G. E. LeCroy, P. Wang, C. E. Bunker, K. A. S. Fernando, W. Liang, L. Ge, M. Reibold and Y.-P. Sun, Hybrid Carbon Dots Platform Enabling Opportunities for Desired Optical Properties and Redox Characteristics by-Design, Chem. Phys. Lett., 2019, 724, 8–12 Search PubMed.
Footnote |
| † Electronic supplementary information (ESI) available. See DOI: 10.1039/d1na00286d |
| This journal is © The Royal Society of Chemistry 2021 |

