 Open Access Article
From nanoaggregates to mesoscale ribbons: the multistep self-organization of amphiphilic peptides
Grazia M. L.
Messina†
 a,
Claudia
Mazzuca†
 b,
Monica
Dettin
c,
Annj
Zamuner
c,
Benedetta
Di Napoli
b,
Giorgio
Ripani
b,
Giovanni
Marletta
b,
Monica
Dettin
c,
Annj
Zamuner
c,
Benedetta
Di Napoli
b,
Giorgio
Ripani
b,
Giovanni
Marletta
 *a and
Antonio
Palleschi
 *b
*b
aLaboratory for Molecular Surfaces and Nanotechnology (LAMSUN), Department of Chemical Sciences, University of Catania, CSGI, Viale A. Doria 6, I-95125 Catania, Italy. E-mail: gmarletta@unict.it
bDepartment of Chemical Science and Technologies, University of Rome “Tor Vergata”, Via della Ricerca Scientifica 1, 00133 Rome, Italy. E-mail: antonio.palleschi@uniroma2.it
cDepartment of Industrial Engineering, University of Padova, Padova, Italy
First published on 27th April 2021
Abstract
This paper reports atomic force microscopy results and molecular dynamics simulations of the striking differences of long-term self-organization structures of negatively charged (AcA4)2KD (double tail) and AcA4D (single tail) peptides, respectively, forming micrometer-long, linearly ordered ribbon-like structures and nanometer-sized, unstructured, round-shaped aggregates. The subsequent formation steps of the long-range nanoribbons, experimentally observed only for the “double tail” (AcA4)2KD peptide, are analyzed in detail, showing that the initial “primary” unstructured round-shaped aggregates progressively evolve into longer nanofilaments and into micrometer-long, network-forming nanoribbon moieties. In particular, the long-range self-organization of the “double tail” peptides appears to be closely related to electrostatically driven diffusional motions of the primary aggregates and nanofilaments. The diffusional freedom degrees are prompted by the formation of a dynamic ternary air/liquid/substrate interface, due to the water evaporation process from the ultrathin films of the peptide solution cast onto a solid mica substrate. Overall, the initial aggregation of unstructured round-shaped moieties, for both the peptides, can be seen as an entropy-driven process, involving the intra- and intermolecular interactions of hydrophobic parts of the peptides, while the further formation of long nanoribbons, only for “double tail” peptides, can be viewed in terms of an enthalpy-driven process, mainly due to the predominant electrostatic interactions between the charged heads of the interacting peptides. The role of the solid–liquid interface, as the locus of the enthalpy-driven linear organization, is also highlighted.
1. Introduction
The arrangement of adsorbed molecules and macromolecules at interfaces determines the functional performances of the final interfacial constructs. This is particularly important for biointerfaces, where the effective bioactivity of the biomolecules, towards the biological medium in contact, is fully determined by the many factors driving folding or unfolding, orientation and proper exposure of epitopes, and density and packing mode of the adsorbed biomolecules.1–3As a matter of fact, the formation of complex hierarchically self-organized bioactive structures is completely determined by the manifold and dynamic interactions occurring in very thin layers at the interfaces between biomolecules, surfaces and solvents. In this framework, peptide-based materials have attracted a great deal of interest over the past few decades, due to their wide application as basic components for complex products such as highly biocompatible scaffolds for tissue engineering,4–9 efficient tools for protein and enzyme immobilization technologies,10,11 constructs for affinity purification, biosensors and protein chips.12,13
All these potential applications are closely related to the versatility of peptides, deriving from the fine modulation of their structure, owing to a suitable combination of the appropriate building amino acids and related properties, such as stimuli responsiveness and chemical and biological modularity, which in turn prompt their recognition by living organisms as compatible biosystems.5,6,10,14–16
An important class of these materials is represented by the amphiphilic peptides, easily constructed by binding together hydrophobic and hydrophilic amino acid residues, including various possible structures linking charged heads to nonpolar tails and alternating positive/negative or polar/nonpolar repeat units.
The self-assembly of these molecules in aqueous solution can be tuned by changing the pH or temperature, by adding ions or simply by evaporating the solvent. Amphiphilic peptides, indeed, according to the selected conditions, have been shown to self-assemble into several classes of highly ordered systems, including 1D-cylindrical nanostructures and nanowires, 2D-ribbons, highly ordered nanotube structures,17 stripes, sheets, large membranes, 3D-nanotubules, and so on.18–21 It is important to note that these ordered structures imply, in general, very asymmetric linear dimensions, being limited to a few nanometers in diameter, but ranging from tens up to hundreds or thousands of nanometers in length.5,21–27
Furthermore, the self-organization processes and the nanostructure formation are known to heavily depend on the balance between several classes of interactions, such as hydrophobic (pH dependent), electrostatic, inter- or intramolecular hydrogen bonds and dispersive van der Waals forces.28–31 In particular, for amphiphilic peptides a major factor driving the self-assembly process has been shown to involve the interplay of hydrophobic and electrostatic interactions.5,22–24,32–34 In fact, by changing the length of the hydrophobic region or modifying the charge of the hydrophilic region it is possible to tune the morphology of peptide self-assemblies through a synergistic combination of these two driving forces.10,14,25 Last, but not least, an often neglected aspect of particular importance involves the dynamic aspect of aggregation, i.e., the evolution of the aggregation/organization processes of biomolecules from the early interactions in water solution/dispersion up to the final self-organized structures at the liquid–solid interfaces.
In spite of the wide range of potential applications of self-assembled peptides, only a few computational studies on the detailed formation processes have been performed, with a concomitant substantial lack of theoretical insight about them.10,35 Furthermore, the role of interfaces in the self-assembling mechanism has not been specifically addressed,5,34,36–41 so that a ubiquitous process such as solvent evaporation from ultrathin films of peptides cast on solid surfaces has not been theoretically taken into account.
The present paper, therefore, aims to study the self-assembly behavior of (i) a single tail alanine-based peptide, expected to behave as a good surfactant,33 and (ii) a double tail alanine–lysine peptide, reproducing, to the best, the peculiar amphipathic structure of phospholipids. Accordingly, we paid particular attention to the “history” of the early interaction events of aggregation/organization of these two peptide sequences from the bulk solution to their landing at liquid–solid interfaces, which is responsible for the further organization at the mesoscopic scale.6
In particular, the behavior of the two peptides leading to self-organization at the interface between mica and an ultrathin film of evaporating peptide solution has been investigated by means of Atomic Force Microscopy (AFM), and detailed Molecular Dynamics (MD) simulations have been performed to describe the peptide arrangements occurring on the surface. In this context, the AFM data for the single and double tail peptides show strikingly different features at the solid surfaces, as far as the first ones give only unstructured aggregates, while the second ones form micrometer long, nanometer-wide ribbons. Furthermore, a new MD simulation protocol, here presented for the first time, has been developed in order to closely simulate the experimental conditions, taking explicitly into account the evaporation process.
2. Results and discussion
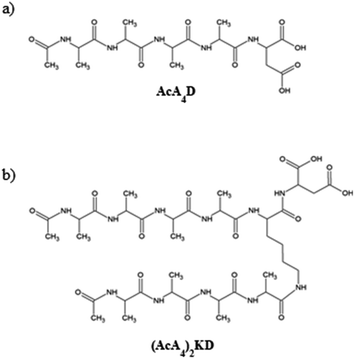
In order to understand the self-organization of the negatively charged peptides of interest, the study is focused on their behavior at a basic pH, when the mica surfaces are also negatively charged, as it has been reported from ζ-potential data for highly basic solutions.42As mentioned above, the two peptides investigated in this paper have a marked amphiphilic character, as they are formed by a hydrophilic anionic head, i.e., aspartic acid, and one or two hydrophobic tails. In detail, the C-terminal end of both peptides is uncapped, carrying two negatively chargeable carboxylic acid groups. Hence, as AcA4D is formed by a negatively charged aspartic acid unit (D) and four alanine residues (A), it may carry a maximum of 2 negative charges at a pH value above the pKa of the carboxylic acid (pKa ∼ 3.7), with the two charges being localized on the C-terminus of aspartic acid (see Scheme 1a). The same behavior is expected for (AcA4)2KD (see Scheme 1b). Accordingly, we have performed all the experimental measurements at pH = 11 to ensure that they are in the fully deprotonated form. Accordingly, the MD simulations were also performed using peptides in the fully deprotonated form.
The respective peculiar organization of the two peptides at the steady state, i.e., on the final “dry” surfaces (see below), has been studied at the nanoscale by using atomic force microscopy, while the behavior of each type of peptide, in terms of molecule–molecule and molecule–surface interactions at the liquid/solid interfaces, has been analyzed by means of MD simulation.
2.1. Atomic force microscopy analysis
Peptide solutions were deposited on freshly cleaved mica substrates, taking advantage of their atomically flat and uniform morphology, by incubating the mica surfaces in diluted peptide solutions (10−5 M) for 30 minutes and then by gently drying the wet surfaces in air. The AFM analyses, therefore, have been performed on “dry” surfaces, this term meaning that we assume that residual water is still present at the sampled interfaces, both as hydration molecules and ultrathin water layers.Fig. 1 and 2 show representative AFM images, selected from at least 3 repeat experiments in different sample zones, for (AcA4)2KD and AcA4D, respectively. The images clearly show that, in spite of their reciprocal structural similarity, very long and remarkably linear fiber-like structures are predominantly formed throughout the whole mica surface for the (AcA4)2KD peptides (Fig. 1), while in the case of AcA4D only apparently unstructured round-shaped aggregates are observed (Fig. 2). These different structures appear to be the result of the long-term complex processes occurring at the dynamic ternary air/liquid film/substrate interfaces, basically involving the water evaporation process from the ultrathin films of the peptide solution cast onto the solid mica substrate.
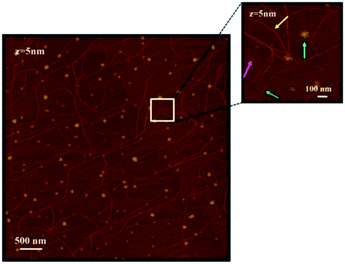 | ||
| Fig. 1 AFM images of (AcA4)2KD on a mica substrate. The high magnification inset shows the various coexisting nanostructures (for the meaning of the arrows see the text). | ||
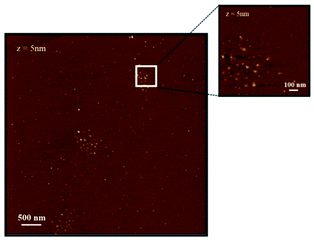 | ||
| Fig. 2 AFM images of AcA4D on a mica substrate, showing that for these peptides only circular spots of aggregated peptides are found. | ||
However, in view of the interest in highly ordered peptide structures, we have focused the discussion on the remarkable fiber network structures formed by (AcA4)2KD peptides, extending from the nano- to mesoscale (Fig. 1). In detail, in this case various types of fiber-like structures can be seen, ranging from very small isolated round-shaped aggregates (magenta arrow in the inset), to short “protofibrils” (green arrow in the inset) and to relatively large, micrometer-long fiber-like structures (yellow arrow in the inset). It is to be noted that these latter structures are apparently formed due to the joining of several single fibers, globally forming an extended network as seen in Fig. 1. It is also worth mentioning that in the same figure, round-shaped nanostructures, similar to those found for AcA4D, can also be seen (cyan arrow in the inset), appearing, however, to be in general not related to the fiber-like network development. Section analysis (not reported here), after appropriate statistical data treatment, showed that all these structures have a remarkably uniform, average thickness of 0.9–1.1 ± 0.1 nm. Therefore, we have to consider all the above fiber-like nanostructures as thin nanoribbons of variable width and length.
As to the width, finally, three basic sets could be roughly identified, respectively, consisting of “large size” ribbons, with an experimental average width of 31.7 ± 0.1 nm, “medium” ones, with an experimental average width of 14.4 ± 1.4 nm and “small” ones, with an average width of 11.3 ± 1.2 nm. Using the correction procedure for tip–fibril convolution (see “Atomic force microscopy” in the Experimental section), the effective corrected widths weff for the three sets of structures are as follows: for “small size” ribbons, the weff is 2.8 ± 0.3 nm; for “medium” ones, the weff is 5.6 ± 0.5 nm; and for “large” ones, the weff is 22.8 ± 0.7 nm (see Table 1). It is important to note that, as reported in Section 4.1.4, the thickness values remained unaffected by the correction procedure.
| Stripe set | Height (nm) | Widthexp (nm) | Widtheff (nm) |
|---|---|---|---|
| Large | 1.1 ± 0.1 | 31.7 ± 1.0 | 22.8 ± 0.7 |
| Medium | 1.1 ± 0.1 | 14.5 ± 1.4 | 5.6 ± 0.5 |
| Small | 0.9 ± 0.1 | 11.3 ± 1.2 | 2.8 ± 0.3 |
As a whole, the observed formation of large and highly extended ribbon networks suggests that these nanostructures are the product of both multiple lateral and longitudinal aggregation of elementary building blocks, e.g., as the observed small protofibrils and nanofilaments, respectively, indeed may self-assemble by diffusion on the surface.
In this context, the micrometer lengths observed for “medium” and “large size” nanoribbons suggest that the longitudinal growth is by far the most effective process, likely depending on the surface features.
AFM results basically raise the crucial problem of unraveling the factors driving the observed self-organization behavior, i.e., the very long, narrow and flat nanoribbon networks in the case of (AcA4)2KD and isolated, round-shaped, unstructured nanoaggregates for AcA4D. In order to tackle this problem, detailed molecular dynamics simulations have been performed.
2.2. Molecular dynamics simulations
The molecular dynamics simulation has been performed by explicitly taking into account the peculiar evolution of the dynamic ternary interface system formed by an initial liquid thin film deposited onto the mica substrate, i.e., including the water evaporation from the initially cast drop. Accordingly, the whole process has been analyzed in three steps, the first one dealing with peptide–peptide interactions in water and related early aggregation processes; the second one simulating, by means of a new original methodology, the evaporation process of the solution film and the consequent progressive approach of the early aggregates to the surface; and the last one taking into account the dynamics of the peptides at the very interface with the mica charged surface.The simulation of peptide–peptide interactions in water, i.e., the first step, has been performed by considering for each peptide non-interacting molecules, randomly inserted in the simulation box. Several simulation runs have been performed by varying the number of peptides in the box, to evaluate the behavior of peptides upon increasing the concentration (see Materials and methods above).
In particular, simulations involving up to 20 peptides for AcA4D or 10 for (AcA4)2KD showed that the peptides tend to remain either isolated or to form small dynamic aggregates, rarely containing more than 6 peptides. The formation of these small aggregates is basically caused by the electrostatic repulsions between the charged groups on the C-terminus of the biomolecules.
As the concentration increases, i.e., by increasing the number of molecules in the simulation box, different aggregates are formed both for AcA4D and (AcA4)2KD peptides. In particular, indeed, AcA4D peptides form bigger aggregates of almost round shape with negative surface charges (due to the outward-oriented carboxylate oxygens), which hinder both the further entry of charged peptides and the coalescence of nearby aggregates. In general, the largest aggregates do not include more than 22–24 peptides and their dimensions do not exceed a diameter of 2 nm (Fig. 3A) for a simulation involving 30 to 50 molecules in the box.
 | ||
| Fig. 3 Aggregates of 22 AcA4D (A) and 20 (AcA4)2KD, lateral (B) and longitudinal (C) views. In red are represented the carboxylate oxygens. | ||
Unlike the above case, for (AcA4)2KD, when the number of peptides in the box is higher than 10, the amount of molecules assembling into aggregates starts to grow, finally involving, due to the balance between the electrostatic repulsion and hydrophobic effect, no more than 20–22 peptides in these larger aggregates (Fig. 3B and C). In this case, a prolate shape (major axis of about 6 nm and minor axis of about 2 nm) characterizes the aggregates, with the negative charges more localized on their lateral and external surface, whereas the intermolecular interactions between the hydrophobic tails tend to concentrate them inside the aggregates (Fig. 3B and C).
It is to be noted that in the case of (AcA4)2KD, a substantial contribution to the intermolecular interaction comes from the laterally substituted lysine, absent in AcA4D. This fact implies that the lateral chains are constrained to assume an asymmetric orientation due to hydrogen bonds (HBs) and steric hindrance, promoting the prolate aggregation for (AcA4)2KD, instead of the round-shaped one. This finding suggests that the largest prolate aggregates are the asymmetrical “primary” building blocks, able to create at first short nanofilaments and, finally, long nanoribbons, according to an alignment process along the longitudinal direction favored by the presence of lateral negative charges.
The (AcA4)2KD aggregates show also a remarkably high value of the S function (S = 2.20 ± 0.06), due to the high relative strength of hydrophobic intra- and intermolecular interactions between the hydrophobic groups, which in turn reflects their stronger compactness and stability.
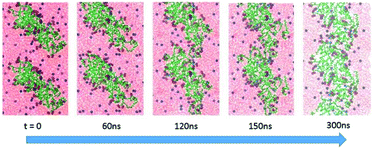
Due to the above results, we have taken into account the critical role played by the evaporation driving the “steady state structure” of the peptide aggregates. In order to tackle this problem, a new strategy of MD simulations, based on the progressive removal of water molecules from the simulation box, has been developed. It is noteworthy that during the first step of the evaporation process, up to 100 ns of simulation, the initially formed smaller aggregates for both peptides maintain their identity and dimensions, remaining far apart from the others, due to the presence of solvation water and repulsion of the negative charges at the aggregate surfaces. These results exclude any early coalescence of the initial small aggregates due to the increase of peptide concentration in solution, because of the evaporation process.
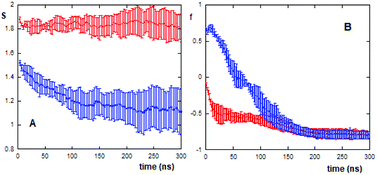
In this context, it is possible to follow, by calculating the S values as a function of the evaporation time (Fig. 4A), the different compactness and stability of (AcA4)2KD and AcA4D aggregates during their approaching and final landing on the mica substrates.
As shown in the figure, for (AcA4)2KD (20 peptides in the simulation box) the S function remains constant during the whole evaporation process, suggesting that the aggregates maintain a compact and stable arrangement. This “stability” of the S value does not imply, however, constancy in the overall features of these aggregates. In fact, as shown in Fig. 4B, the orientational order parameters of the carboxylate oxygens (fox) as well as those of the Cα atoms (fc) tend to decrease during the evaporation, until the peptides come into close contact with the mica surface (after about 100 ns). In detail, while the charged groups are initially randomly distributed along the Z axis, as fox is close to zero, near the surface they appear to be parallel to mica (fox = −0.9). Similarly, the Cα atoms also undergo a shift from an arrangement predominantly aligned along the Z axis (fc ∼ 1) to a nearly perpendicular one (fc = −0.8).
On the other hand, in the case of AcA4D (40 peptides in the simulation box), the aggregates tend to lose their compactness, as shown by the sudden decrease of the S value with evaporation, but still remain in the aggregated form (S > 1 always). A careful inspection of the S trend for AcA4D peptides indicates that the aggregate rearrangement occurs until peptides are in closest contact with surfaces, and again after about 100 ns, the aggregates remain compact for longer times.
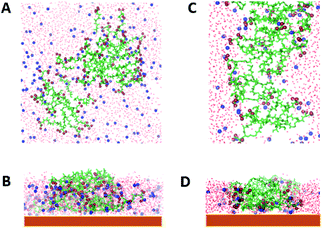
It is important to note that for (AcA4)2KD, at the end of the evaporation process on average, fc is close to fox indicating that the aggregate is embedded in the remaining layer of water on the mica surface (Fig. 5C and D).
Moreover, as shown in Fig. 5A and B, AcA4D aggregates on mica are almost spherical in shape with the hydrophobic groups inside and the charged ones homogeneously distributed at the outer surface.
All these results rule out the formation of peptide multilayers on mica, in excellent agreement with the experimental AFM data (see above), rather forming different species of aggregates with an average thickness of about 1–2 nm (Table 1).
An analysis of the water residence times (τ) during the evaporation process supports the above reported results. This analysis takes into account that at the beginning of the evaporation process, both AcA4D and (AcA4)2KD peptides are mostly localized at the water–air interface and in bulk solution, while only very few molecules are positioned nearby the mica surface, with a slight predominance of AcA4D molecules (data not shown).
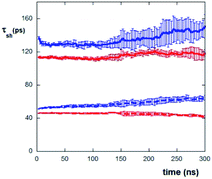
Hence, one expects that the residence time of the water molecules nearby the mica surface is influenced by the evaporation process, as it induces the progressive increase of concentration at the mica surface. Accordingly, we have evaluated the τ values of water molecules in the first and second layers (each 4 Å thick) on the mica surface as a function of evaporation times (see Fig. 6). It appears clearly that mica has an important effect on “freezing” the water molecules. In fact, the values of τ for both the peptides are in the range of about 110–150 ps within the first layer (up to 4 Å) and about 40–60 ps within the second layer (from 4 to 8 Å) from mica, while the average permanence residence time of “free” water molecules (i.e., in bulk solution) is about 4–5 ps (as obtained by simulating a system constituted by only water molecules without the peptides and mica).
It is also to be noted that in the case of AcA4D, the water residence time is always slightly greater than the one observed for (AcA4)2KD. This effect can be explained in terms of the slight loss of the AcA4D aggregate compactness, seen above, which in turn leads to a greater structuring of the surrounding water molecules, with respect to the water organization for the highly stable (AcA4)2KD aggregates. In this context, unlike for (AcA4)2KD, water molecules are found also inside AcA4D aggregates, suggesting the occurrence of a higher cage effect of water for AcA4D (data not shown).
Finally, at the end of the evaporation (i.e., at a constant number of water molecules in the simulation box), it is found that the large (AcA4)2KD aggregates, landed on mica surfaces, can diffuse through the surface, with a diffusion coefficient (D = 2.9 ± 0.1 μm2 s−1) prompted by the residual water film adsorbed on the mica surface.
More important, the MD simulation showed that these diffusional movements lead, on a sufficiently long time scale, to the formation of highly asymmetric linear ribbon-like aggregates, in agreement with the AFM findings, with dimensions progressively evolving from the initial nanometer to micrometer length. Indeed, Fig. 7 shows how elongated (AcA4)2KD aggregates (which we indicate here as “nanofilaments”) can be formed when the prolate, compact “building blocks” formed in solution (see above), upon lying on the mica surface, join with each other by their short sides, with a propagating add-on mechanism able to form micrometer-long-ribbons constituted by a large number of prolate building blocks. The proposed mechanism may thus satisfactorily explain the formation of the peculiar micrometer long ribbons, characteristic of (AcA4)2KD peptides, experimentally observed by means of AFM (see above, in the Experimental section).
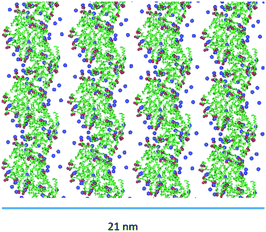
MD simulations also allow accounting for the “width families” of the ribbons experimentally observed by AFM. Indeed, the factors involved in the mechanism for the longitudinal growth are also valid for the lateral aggregation.
Indeed, the negative charges of the (AcA4)2KD aggregates, mainly positioned on the longer lateral moieties of them, are shielded by the Na+ present in the water, which can thus mediate, by means of electrostatic interaction, a limited further lateral alignment of the single and multiple nanofilaments to form the final nanoribbons. As shown, in Fig. 8, indeed, the larger experimental width value (22.8 ± 0.7 nm) is consistent with the alignment of 4 nanofilaments. Finally, it must be stressed that the overall MD results for AcA4D peptides are in nice agreement with the fact that, unlike the (AcA4)2KD case, ribbon-like structures were not experimentally observed (Section 2.1).
Overall, the formation of nanoribbon networks could be basically described as resulting from an interplay between entropic and enthalpic effects arising from the release of the water molecules involved in the cage structure around the hydrophobic groups. The removal of the water molecules favors the approaching of building blocks, improving the interaction between the hydrophobic parts of the peptides (hydrophobic effect). Furthermore, such water molecules could improve the enthalpy contribution due to their transfer in an environment containing Na+ ions and charged carboxylates.
In addition, electrostatic interactions between the charged heads of the interacting peptides, as well as the apparent “confinement” of sodium ions involved in attractive charged bridges between nanofilaments, must be taken into account.
Therefore, the overall assembly process implies the matching of thermodynamic state functions, influenced by the presence of the solid–liquid interface, which appears as the stabilization factor of the most ordered long-term equilibrium state, depending on the respective molecular structure.
3. Conclusion
The paper deals with the striking difference between the mesoscopic self-organized structures of two similar peptides, i.e., the “double tail” (AcA4)2KD and “single tail” AcA4D, respectively, forming in the first case very long and linear ribbon-like structures and in the second one isolated and unstructured round-shaped aggregates.In particular, the present paper is focused on the multistep process of formation of the experimentally observed long-range nanoribbons for the “double tail” (AcA4)2KD peptide. Indeed, this self-assembling process is shown to involve at first the formation of unstructured “primary” round-shaped aggregates, which in turn form short and narrow linear assemblies (i.e., nanofilaments), which are the building blocks to finally yield micrometer long nanoribbons. It is important to point out that while the formation of unstructured “primary” round-shaped aggregates occurs for both peptides, only the “double tail” systems are able to evolve up to long range self-organized structures, including networks of nanoribbons.
In detail, the progressively more complex structures of “double tail” peptides appear to be strictly connected to the peculiar features of the dynamic ternary air/liquid/substrate interface, due to the water evaporation process from the ultrathin films of the peptide solution cast onto the solid mica substrate. In this dynamic framework, indeed, the diffusional motion of the primary aggregates and nanofilaments is the assembly leading factor.
The formation of the primary aggregates and the further growth of long range assemblies obey to an entangled entropic and enthalpic effects due to the interaction of hydrophobic parts and of strong electrostatic interactions between the charged heads of the peptides, during the formation of larger aggregates. These interactions cause a concomitant decrease of water molecules involved in the cage structure and a rearrangement of sodium ions involved in attractive, positively charged interchain bridges between nanofilaments.
4. Experimental methods
4.1. Materials
The solid support resin HMP was purchased from Applied Biosystems (Waltham, MA, USA). The Fmoc protected amino acids were from Novabiochem (Merck Millipore, Burlington, MA, USA). The coupling reagents HBTU and HOBt were from Novabiochem. DIEA, DMAP and piperidine were from Biosolve (Leenderweg, Valkenswaard, The Netherlands). Triethoxysilane (TES), DCC and TFA were from Sigma-Aldrich (Steinheim, Germany). Solvents such as DMF, N-methyl-2-pyrrolidone (NMP), and DCM were from Biosolve.![[thin space (1/6-em)]](https://www.rsc.org/images/entities/char_2009.gif) :
:![[thin space (1/6-em)]](https://www.rsc.org/images/entities/char_2009.gif) 2.5
2.5![[thin space (1/6-em)]](https://www.rsc.org/images/entities/char_2009.gif) :
:![[thin space (1/6-em)]](https://www.rsc.org/images/entities/char_2009.gif) 2.5; v/v/v) for 90 minutes at room temperature and under magnetic stirring. The crude product was precipitated with ethyl ether, filtered, dissolved in water and lyophilized. The purification was initially carried out using a Delta Pak column (Waters, 15 μm, 100 Å, 7.8 × 300 mm) under the following conditions: eluent A, 0.05% TFA in water; eluent B, 0.05% TFA in acetonitrile; gradient, 2% B for 15 min, then from 2% B to 6% B in 16 min, flow rate, 4 mL min−1; detector at 214 nm. The purified product was characterized through analytical reversed-phase (RP)-HPLC and the resulted homogeneity was 96.3% under the following conditions: column, Luna C18 (5 μm, 100 Å, 4.6 × 250 mm, Phenomenex), flow rate 1 mL min−1; eluent A, 0.05% TFA in water; eluent B, 0.05% TFA in acetonitrile; gradient, from 5% B to 15% B in 20 min; detector at 214 nm. Its retention time was 22.13 min. ESI-ToF mass analysis (Mariner Applied Biosystems System 5220) confirmed the identity of the product (theor. mass: 459.46 Da, exp. mass: 460.21 Da). Capillary electrophoresis (Applied Biosystems 270 E) analysis clearly revealed the presence of a secondary product, whose presence affects the purity grade of the target peptide (93.18%). The capillary electrophoresis analysis was carried out under the following conditions: a fused-silica capillary of 72 cm; buffer, 50 mM phosphate buffer pH 7; temperature, 30 °C; voltage, 15 kV; detector, 214 nm. Consequently, a further purification step was necessary. The peptide, previously purified through RP-HPLC, was loaded onto an anion exchange column (AP-1, 8 μm, 1000 Å, 10 × 100 mm, Waters) under the following conditions: eluent A, 20 mM Tris HCl buffer, pH 8.3; eluent B, 20 mM Tris HCl, 1 M NaCl buffer, pH 8.3; gradient, 100% A for 20 min, from 0% B to 100% B in 50 min; detector, 214 nm. After desalting, the purified peptide showed a homogeneity of 100%.
2.5; v/v/v) for 90 minutes at room temperature and under magnetic stirring. The crude product was precipitated with ethyl ether, filtered, dissolved in water and lyophilized. The purification was initially carried out using a Delta Pak column (Waters, 15 μm, 100 Å, 7.8 × 300 mm) under the following conditions: eluent A, 0.05% TFA in water; eluent B, 0.05% TFA in acetonitrile; gradient, 2% B for 15 min, then from 2% B to 6% B in 16 min, flow rate, 4 mL min−1; detector at 214 nm. The purified product was characterized through analytical reversed-phase (RP)-HPLC and the resulted homogeneity was 96.3% under the following conditions: column, Luna C18 (5 μm, 100 Å, 4.6 × 250 mm, Phenomenex), flow rate 1 mL min−1; eluent A, 0.05% TFA in water; eluent B, 0.05% TFA in acetonitrile; gradient, from 5% B to 15% B in 20 min; detector at 214 nm. Its retention time was 22.13 min. ESI-ToF mass analysis (Mariner Applied Biosystems System 5220) confirmed the identity of the product (theor. mass: 459.46 Da, exp. mass: 460.21 Da). Capillary electrophoresis (Applied Biosystems 270 E) analysis clearly revealed the presence of a secondary product, whose presence affects the purity grade of the target peptide (93.18%). The capillary electrophoresis analysis was carried out under the following conditions: a fused-silica capillary of 72 cm; buffer, 50 mM phosphate buffer pH 7; temperature, 30 °C; voltage, 15 kV; detector, 214 nm. Consequently, a further purification step was necessary. The peptide, previously purified through RP-HPLC, was loaded onto an anion exchange column (AP-1, 8 μm, 1000 Å, 10 × 100 mm, Waters) under the following conditions: eluent A, 20 mM Tris HCl buffer, pH 8.3; eluent B, 20 mM Tris HCl, 1 M NaCl buffer, pH 8.3; gradient, 100% A for 20 min, from 0% B to 100% B in 50 min; detector, 214 nm. After desalting, the purified peptide showed a homogeneity of 100%.
![[thin space (1/6-em)]](https://www.rsc.org/images/entities/char_2009.gif) :
:![[thin space (1/6-em)]](https://www.rsc.org/images/entities/char_2009.gif) 2.5
2.5![[thin space (1/6-em)]](https://www.rsc.org/images/entities/char_2009.gif) :
:![[thin space (1/6-em)]](https://www.rsc.org/images/entities/char_2009.gif) 2.5; v/v/v) for 90 minutes at room temperature and under magnetic stirring. The crude product was precipitated with ethyl ether, filtered, dissolved in water and lyophilized. The purification was initially carried out using a Delta Pak column (Waters, 15 μm, 100 Å, 7.8 × 300 mm) under the following conditions: eluent A, 0.05% TFA in water; eluent B, 0.05% TFA in acetonitrile; gradient, 100% A for 10 min, from 0% B to 3% B in 3 min, from 3% B to 15% B in 36 min, from 15% B to 30% B in 15 min, from 30% B to 35% B in 15 min; flow rate, 4 mL min−1; detector at 214 nm. The purified product was characterized through analytical RP-HPLC and the resulted homogeneity was 73.23% under the following conditions: column, Luna C18 (5 μm, 100 Å, 4.6 × 250 mm, Phenomenex), flow rate 1 mL min−1; eluent A, 0.05% TFA in water; eluent B, 0.05% TFA in acetonitrile; gradient, from 5% B to 20% B in 30 min; detector at 214 nm. Its retention time was 25.20 min. ESI-ToF mass analysis (Mariner Applied Biosystems System 5220) confirmed the identity of the product (theor. mass: 913.97 Da, exp. mass: 913.46 Da). Capillary electrophoresis analysis clearly showed the presence of a secondary product, whose presence affects the purity grade of the target peptide (84.86%). The capillary electrophoresis (Applied Biosystems 270 E) analysis was carried out under the following conditions: a fused-silica capillary of 72 cm; buffer, 50 mM phosphate buffer pH 7; temperature, 30 °C; voltage, 15 kV; detector, 214 nm. Consequently, a further purification step was necessary. The peptide, previously purified through RP-HPLC, was loaded onto an anion exchange column (AP-1, 8 μm, 1000 Å, 10 × 100 mm, Waters) under the following conditions: eluent A, 20 mM Tris HCl buffer, pH 8.3; eluent B, 20 mM Tris HCl, 1 M NaCl buffer, pH 8.3; gradient, 100% A for 20 min, from 0% B to 100% B in 50 min; detector, 214 nm. After desalting, the purified peptide had a homogeneity of 98.66%.
2.5; v/v/v) for 90 minutes at room temperature and under magnetic stirring. The crude product was precipitated with ethyl ether, filtered, dissolved in water and lyophilized. The purification was initially carried out using a Delta Pak column (Waters, 15 μm, 100 Å, 7.8 × 300 mm) under the following conditions: eluent A, 0.05% TFA in water; eluent B, 0.05% TFA in acetonitrile; gradient, 100% A for 10 min, from 0% B to 3% B in 3 min, from 3% B to 15% B in 36 min, from 15% B to 30% B in 15 min, from 30% B to 35% B in 15 min; flow rate, 4 mL min−1; detector at 214 nm. The purified product was characterized through analytical RP-HPLC and the resulted homogeneity was 73.23% under the following conditions: column, Luna C18 (5 μm, 100 Å, 4.6 × 250 mm, Phenomenex), flow rate 1 mL min−1; eluent A, 0.05% TFA in water; eluent B, 0.05% TFA in acetonitrile; gradient, from 5% B to 20% B in 30 min; detector at 214 nm. Its retention time was 25.20 min. ESI-ToF mass analysis (Mariner Applied Biosystems System 5220) confirmed the identity of the product (theor. mass: 913.97 Da, exp. mass: 913.46 Da). Capillary electrophoresis analysis clearly showed the presence of a secondary product, whose presence affects the purity grade of the target peptide (84.86%). The capillary electrophoresis (Applied Biosystems 270 E) analysis was carried out under the following conditions: a fused-silica capillary of 72 cm; buffer, 50 mM phosphate buffer pH 7; temperature, 30 °C; voltage, 15 kV; detector, 214 nm. Consequently, a further purification step was necessary. The peptide, previously purified through RP-HPLC, was loaded onto an anion exchange column (AP-1, 8 μm, 1000 Å, 10 × 100 mm, Waters) under the following conditions: eluent A, 20 mM Tris HCl buffer, pH 8.3; eluent B, 20 mM Tris HCl, 1 M NaCl buffer, pH 8.3; gradient, 100% A for 20 min, from 0% B to 100% B in 50 min; detector, 214 nm. After desalting, the purified peptide had a homogeneity of 98.66%.
The concentration used for the self-organization on surfaces is about 10–5 M. The peptide solution was incubated on mica for 30 minutes at pH = 11. After that, the peptide solution was removed and the samples were dried in air. Afterwards the samples were investigated by atomic force microscopy in tapping mode in air.
The actual dimensions of the assembled peptide structures were calculated from the raw data by taking into account the tip–sample convolution effects, according to the Canet-Ferrer method,43 under the assumption that the tip radius is larger than the structure height. All width and height measurements were performed along two cross sections of each assembled structure in a 1 × 1 μm2 imaging area and the average and standard deviation were reported for all the samples (see below).
In particular, the AFM raw data were corrected by taking into account the tip–fibril convolution effects, which arise from the finite dimensions of the AFM tip which determine the extension of the surface area interacting with it. The correction procedure is based on the assumption that the AFM measurements depend essentially on the tip radius and the height h of the object.43 In the present case, we have used a model specifically defined for flat structures, as indeed are the observed peptide ribbons. In particular, rectangular shaped ribbons have been considered, with the tip radius being much bigger than the height. This yields the following correction (eqn (1) and (2)):
 | (1) |
 | (2) |
![[thin space (1/6-em)]](https://www.rsc.org/images/entities/char_2009.gif) 000 water molecules. After solvating, Na+ ions were added to neutralize the peptide charges.
000 water molecules. After solvating, Na+ ions were added to neutralize the peptide charges.
The evaporation process was simulated, starting from the final steps of the above reported simulations, doubling the box dimension along the Z axis (that is the axis perpendicular to the mica surface). A Montecarlo approach to remove water molecules was used considering a probability directly related to their distance from mica. It was obtained by eliminating, for each step performed, a small percentage (not exceeding the 1.5%) of the actual water molecules. Furthermore, a relaxation of 2 ns (i.e. 106 MD steps) was performed for each step in order to bring the system into a state of equilibrium. This procedure allowed the end of the evaporation process to be reached in about 150–200 ns, and consequently the remaining 150–100 ns refer to the diffusion of the peptide aggregates together with Na+ ions and water solvation molecules on the mica surface.
The final number of the water molecules was obtained by multiplying the number of peptides for the average number of water molecules present in the first shell of solvation (20 for one AcA4D, and 40 for one (AcA4)2KD) plus 8 water molecules for each Na+ ion added in the simulation box.
The mica surface, placed at the bottom of the simulation box, was reproduced according to a model consisting of a grid of charged spheres so as to obtain a surface charge density equal to the experimental value of −0.0217e Å−2,44 and a Z Lennard-Jones wall potential (ε = 0.5 kJ mol−1, and σ = 0.4 nm) was placed at the bottom of the simulation box.
Five repetitions of each simulation of 300 ns were performed.
To evaluate the hydrophobicity the S function (eqn (1))45 was used, which quantifies the number of contacts between every side chain heavy atom of hydrophobic residues (methyl of Ala plus methylene of Lys in the case of (AcA4)2KD). The function is defined as (eqn (3)):
 | (3) |
The residence time (τ) was obtained by calculating how long the water molecules remain in a layer of assigned thickness parallel to the surface of the mica.
The orientation order parameters, fox (for the carboxylate oxygens) and fc (for Cα atoms), have been obtained using 3 < cos 2α > −1, where α is the angle that the vector, from the center of mass to a given atom of the group considered, forms with the Z axis. Therefore, if f = 0, then all the vectors are randomly oriented with respect to the Z axis; in contrast, if f = 2 or −1, they are parallel or perpendicular to this axis, respectively.
All the simulations were performed with software Gromacs, version 5.1.2 (ref. 46) and with the force field gromos53a6,47 modified with the atom types of the charged groups and atom types of the wall potential (see above). The model for the water molecule was SPC and a time step of 2 fs was used. Periodic boundary conditions were applied only on the XY direction due to the wall potential. A cut-off approach was used for both Coulomb and van der Waals non-bonded interactions with the Potential-shift-Verlet modifier with rcut = 1.4 nm. The weak coupling algorithm for our NVT simulation was a temperature coupling velocity-rescale48 with a time constant of 0.6 ps and a reference temperature of 300 K. No pressure coupling was applied. All bonds were constraints using the LINCS constraint-algorithm49 except during equilibration (time step of 0.5 fs) and annealing steps. A freeze group was applied to the dummy charges placed on the bottom in X, Y and Z dimensions. Diffusion coefficients were calculated by means of the msd GROMACS tool.
Author contributions
The manuscript was written through contributions of all authors. All authors have given approval to the final version of the manuscript.Abbreviations
| AFM | Atomic force microscopy |
| MD | Molecular dynamics |
| AcA4D: peptide with sequence | Ac-Ala-Ala-Ala-Ala-Asp-OH |
| (AcA4)2KD: peptide with sequence | (Ac-Ala-Ala-Ala-Ala)2-Lys-Asp-OH |
Conflicts of interest
There are no conflicts to declare.Acknowledgements
G. Marletta and G. M. L. Messina gratefully acknowledge the partial financial contribution of the PON “BONE++” (ARS01_00693 – MUR 2020–2022) and the Projects PIACERI “Starting Grant”(University of Catania – 2020–2022).References
- K. C. Jena and D. K. Hore, Phys. Chem. Chem. Phys., 2010, 12, 14383–14404 RSC.
- Y. Hirano and D. Mooney, Adv. Mater., 2004, 16, 17–25 CrossRef CAS.
- S. V. Patwardhan, G. Patwardhan and C. C. Perry, J. Mater. Chem., 2007, 17, 2875–2884 RSC.
- N. Habibi, N. Kamaly, A. Memic and H. Shafiee, Nano Today, 2016, 11(1), 41–60 CrossRef CAS PubMed.
- G. M. L. Messina, B. Di Napoli, M. De Zotti, C. Mazzuca, F. Formaggio, A. Palleschi and G. Marletta, Langmuir, 2019, 35(14), 4813–4824 CrossRef CAS PubMed.
- C. Mazzuca, B. Di Napoli, F. Biscaglia, G. Ripani, S. Rajendran, A. Braga, C. Benna, S. Mocellin, M. Gobbo, M. Meneghetti and A. Palleschi, Nanoscale Adv., 2019, 1(5), 1970–1979 RSC.
- M. Dettin, A. Zamuner, G. Iucci, G. M. L. Messina, C. Battocchio, G. Picariello, G. Gallina, G. Marletta, I. Castagliuolo and P. Brun, J. Pept. Sci., 2014, 20, 585–594 CrossRef CAS PubMed.
- P. Brun, A. Zamuner, A. Peretti, J. Conti, G. M. L. Messina, G. Marletta and M. Dettin, Sci. Rep., 2019, 9, 5583–5595 CrossRef PubMed.
- M. Dettin, A. Zamuner, M. Roso, A. Gloria, G. Iucci, G. M. L. Messina, U. D'Amora, G. Marletta, M. Modesti, I. Castagliuolo and P. Brun, PLoS One, 2015, 10(9), e0137505–e0137528 CrossRef PubMed.
- F. Qiu, Y. Chen, C. Tang and X. Zhao, Int. J. Nanomed., 2018, 13, 5003–5022 CrossRef CAS PubMed.
- Y. Kumada, Y. Tokunaga, H. Imanaka, K. Imamura, T. Sakiyama, S. Katoh and K. Nakanishi, Biotechnol. Prog., 2006, 22, 401–405 CrossRef CAS PubMed.
- K. Enander, L. Choulier, A. L. Olsson, D. A. Yushchenko, D. Kanmert, A. S. Klymchenko, A. P. Demchenko, Y. Mèly and D. Altschuh, Bioconjugate Chem., 2008, 19, 1864–1870 CrossRef CAS PubMed.
- R. J. Yoo and S. Choi, BioChip J., 2016, 10, 88–94 CrossRef CAS.
- M. J. Pender, L. A. Sowards, J. D. Hartgerink, M. O. Stone and R. R. Naik, Nano Lett., 2006, 6(1), 40–44 CrossRef CAS PubMed.
- A. Zamuner, M. Cavo, S. Scaglione, G. M. L. Messina, R. Russo, A. Gloria, G. Marletta and M. Dettin, Materials, 2016, 9, 727–745 CrossRef PubMed.
- N. Giamblanco, G. Zhavnerko, N. Tuccitto, A. Licciardello and G. Marletta, Soft Matter, 2012, 8, 8370–8378 RSC.
- A. Aggeli, I. A. Nyrkova, M. Bell, R. Harding, L. Carrick, T. C. B. McLeish, A. N. Semenov and N. Boden, Proc. Natl. Acad. Sci. U. S. A., 2001, 98(21), 11857–11862 CrossRef CAS PubMed.
- X. Zhao and S. Zhang, Chem. Soc. Rev., 2006, 35, 1105–1110 RSC.
- N. Amdursky, M. Molotskii, E. Gazit and G. Rosenman, J. Am. Chem. Soc., 2010, 132, 15632–15636 CrossRef CAS PubMed.
- S. Zhang, Protein Sci., 2020, 29(11), 1–23 Search PubMed.
- H. Jiang and S. I. Stupp, Langmuir, 2005, 21, 5242–5246 CrossRef CAS PubMed.
- S. Li, A. K. Mehta, A. N. Sidorov, T. M. Orlando, Z. Jiang, N. R. Anthony and D. G. Lynn, J. Am. Chem. Soc., 2017, 138(10), 3579–3586 CrossRef PubMed.
- W. S. Childers, A. K. Mehta, R. Ni, J. V. Taylor and D. G. Lynn, Angew. Chem., Int. Ed., 2010, 49(24), 4104–4107 CrossRef CAS PubMed.
- S. Lee, T. H. Trinh, M. Yoo, J. Shin, H. Lee, J. Kim, E. Hwang, Y. B. Lim and C. Ryou, Int. J. Mol. Sci., 2019, 20(23), 5850 CrossRef CAS PubMed.
- C. Guo, Y. Luo, R. Zhou and G. Wei, ACS Nano, 2012, 6(5), 3907–3918 CrossRef CAS PubMed.
- S. Vauthey, S. Santoso, H. Gong, N. Watson and S. Zhang, Proc. Natl. Acad. Sci. U. S. A., 2002, 99(8), 5355–5360 CrossRef CAS PubMed.
- W. S. Childers, R. Ni, A. K. Mehta and D. Lynn, Curr. Opin. Chem. Biol., 2009, 13(5–6), 652–659 CrossRef CAS PubMed.
- B. H. Northrop, Y. Zheng, K. Chi and P. J. Stang, Acc. Chem. Res., 2009, 42, 1554–1563 CrossRef CAS PubMed.
- A. Keller, M. Fritzsche, Y. P. Yu, Q. Liu, V. Li, M. Dong and F. Besenbacher, ACS Nano, 2011, 4, 2770–2778 CrossRef PubMed.
- W. S. Y. Wong, M. L. David, R. Nisbet, V. S. J. Craig, Z. Wang and A. Tricoli, Sci. Adv., 2016, 2, e1600417–1600426 CrossRef PubMed.
- T. Mecca, G. M. L. Messina, G. Marletta and F. Cunsolo, Chem. Commun., 2013, 49, 2530–2532 RSC.
- A. Nagai, Y. Nagai, H. Qu and S. Zhang, J. Nanosci. Nanotechnol., 2007, 7, 1–7 CrossRef PubMed.
- S. Yadav, A. K. Sharma and P. Kumar, Front. Bioeng. Biotechnol., 2020, 8, 127 CrossRef PubMed.
- R. J. Mart, R. D. Osborne, M. M. Stevens and R. V. Ulijn, Soft Matter, 2006, 2, 822–835 RSC.
- S. Gudlur, P. Sukthankar, J. Gao, L. A. Avila, Y. Hiromasa, J. Chen, T. Iwamoto and J. M. Tomich, PLoS One, 2012, 7(9), e45374 CrossRef CAS PubMed.
- G. M. L. Messina, M. De Zotti, R. Lettieri, E. Gatto, M. Venanzi, F. Formaggio, C. Toniolo and G. Marletta, RSC Adv., 2016, 6, 46984–46993 RSC.
- A. Karakecili, G. M. L. Messina, M. C. Yurtsever, M. Gümüsderelioglu and G. Marletta, Colloids Surf., B, 2014, 123, 39–48 CrossRef CAS PubMed.
- S. A. Onaizi and S. S. J. Leong, Biotechnol. Adv., 2011, 29, 67–74 CrossRef CAS PubMed.
- H. Hasan, R. J. Crawford and E. P. Ivanova, Trends Biotechnol., 2013, 31, 295–314 CrossRef PubMed.
- G. M. L. Messina, G. Bocchinfuso, N. Giamblanco, C. Mazzuca, A. Palleschi and G. Marletta, Nanoscale, 2018, 10(16), 7544–7554 RSC.
- F. Biscaglia, S. Rajendran, P. Conflitti, C. Benna, R. Sommaggio, L. Litti, S. Mocellin, G. Bocchinfuso, A. Rosato, A. Palleschi, D. Nitti, M. Gobbo and M. Meneghetti, Adv. Healthcare Mater., 2017, 6(23), 1700596 CrossRef PubMed.
- P. G. Hartley, I. Larson and P. J. Scales, Langmuir, 1997, 13, 2207–2214 CrossRef CAS.
- J. Canet-Ferrer, E. Coronado, A. Forment-Aliaga and E. Pinilla-Cienfuegos, Nanotechnology, 2014, 25, 395703–395712 CrossRef PubMed.
- P. Mulheran and K. Kubiak, Mol. Simul., 2009, 35(7), 561–566 CrossRef CAS.
- M. Han, J. Xu, Y. Ren and J. Li, J. Mol. Graphics Modell., 2016, 68, 114–127 CrossRef CAS PubMed.
- M. J. Abraham, T. Murtola, R. Schuolz, S. Pall, J. C. Smith, B. Hess and E. Lindahl, SoftwareX, 2015, 1–2, 19–25 CrossRef.
- C. Oostenbrink, A. Villa, A. E. Mark and W. F. van Gunsteren, J. Comput. Chem., 2004, 25(13), 1656–1676 CrossRef CAS PubMed.
- G. Bussi, D. Donadio and M. Parrinello, J. Chem. Phys., 2007, 126, 014101 CrossRef PubMed.
- B. Hess, H. Bekker, H. J. C. Berendsen and J. G. E. M. Fraaije, J. Comput. Chem., 1997, 18, 1463–1472 CrossRef CAS.
Footnote |
| † These authors contributed equally. |
| This journal is © The Royal Society of Chemistry 2021 |

