 Open Access Article
Hydrothermally activated TiO2 nanoparticles with a C-dot/g-C3N4 heterostructure for photocatalytic enhancement†
Zhong-yi
Chen
a,
Tian-hao
Ji
 *a,
Zhe-mi
Xu
a,
Peiyuan
Guan
 *b and
Da-jian
Jv
a
aChemistry and Material Engineering College, Beijing Technology and Business University, Beijing 100048, China. E-mail: jitianhao@th.btbu.edu.cn
bSchool of Materials Science and Engineering, University of New South Wales, Sydney 2052, Australia. E-mail: peiyuan.guan@student.unsw.edu.au
First published on 25th May 2021
Abstract
Dye degradation via photocatalysis technology has been investigated intensively to tackle environmental issues and energy crisis concerns. In this study, a newly designed ternary photocatalyst was facilely prepared by a simple one-pot hydrothermal process by directly mixing TiO2 nanoparticles with carbon dots (C-dots) and graphitic carbon nitride (g-C3N4). The optimized precursor treatments and heterostructure components show significantly enhanced photodegradation activity towards organic dyes Rhodamine B (RhB) and methylene blue (MB). Excellent photocatalytic activities were achieved owing to the better attachment of anatase-type TiO2 nanoparticle-aggregations to the C-dots/g-C3N4 (CC) nanocomposite, which impressively displays superhydrophilicity by employing the hydrothermal activation process. FT-IR spectra revealed that the hydrothermal treatment could remarkably increase the coupling interactions between TiO2 nanoparticles and the CC nanosheets within the ternary catalyst, enhancing the photocatalytic activity. Thus, it was concluded that this ternary photocatalyst is highly suitable for the remediation of dye-contaminated wastewater.
1. Introduction
Due to the rapidly growing population and industrialization, the release of contaminants into water bodies has become one of the most important sources threatening and deteriorating the quality of life for all species severely. Over the last two decades, TiO2-based photocatalysts have attracted considerable research interests as one of the most essential and promising materials to address global energy and environmental issues.1–3 In general, TiO2 has shown non-toxicity, long-term stability, strong oxidizing capacity, etc., and thus, it has demonstrated a high potential to degrade a wide range of organic materials, including dyes. However, pure TiO2 suffers from a wide bandgap (∼3.2 eV), which can only be excited under UV irradiation. Therefore, the low utilization of the solar spectrum (∼3% solar spectrum falls within UV range) broadly limits pure TiO2 in the photocatalytic degradation of dyes.4,5 To overcome the shortcomings, numerous modification and optimization strategies have been proposed. Among them, combining other photocatalytic materials with TiO2 to form a heterogeneous composite to enhance the photocatalytic performances synergistically showed a promising future.In recent years, both carbon dots (C-dots) and graphitic carbon nitride (g-C3N4) have received wide attention in photocatalysis due to their excellent optical properties and biocompatibility.6–8 As an attractive visible-light-induced photocatalyst, g-C3N4 not only has a relatively narrow bandgap (2.7 eV) for light absorption and shows excellent stability, but also its simple synthesis procedure and low cost make it ideal for photocatalytic pollutant degradation.9,10 C-dots have been widely used as light absorbers and electron acceptors (or transporters) to couple with photocatalyst nanoparticles due to the quantum effects that endow them with unique optical and electronic properties.11–13 Since both g-C3N4 and C-dots are composed of graphitic carbon (sp2 hybridized) with a similar π–π conjugation structure, combining these two materials has been proved to display better photoactivity than pure g-C3N4 as expected.14 For example, Zhang et al. prepared a C-dot/g-C3N4 (CC) composite via an “impregnation-thermal” method. They demonstrated that the existing C-dots enhanced the production of electron–hole pairs by light-irradiation, which increased the reaction rate for phenol photodegradation compared with pristine g-C3N4.15 Fang et al. obtained CC hybrids, which exhibited better photodegradation of Rhodamine B under UV irradiation than pristine g-C3N4.16 Tang et al. also studied the photocatalysis of Staphylococcus aureus on CC compared with pure g-C3N4in vitro and revealed that the complex might destroy the cell membranes under visible light.17
Currently, TiO2 nanostructure-supported ternary composites assisted by CC hybrids were proposed for the photodegradation of organic compounds. However, the investigation of this heterostructure is still rare. To extend the boundary of this type of material for application in the area of dye photodegradation, Zhao et al. prepared a ternary composite using mesoporous g-C3N4 following the successive impregnation of C-dots and TiO2 nanoparticles, and demonstrated that the hybrids exhibited much higher photocatalytic degradation of gaseous benzene than bulk g-C3N4.18 In this study, a series of TiO2/C-dots/g-C3N4 heterostructure photocatalysts were successfully synthesized via a facile hydrothermal method. The morphologies of the as-prepared ternary photocatalysts were carefully characterized. Their photocatalytic behavior was periodically measured by the photodegradation of Rhodamine B (RhB) and methylene blue (MB) under UV irradiation. The outcomes revealed that the newly designed ternary photocatalysts had superior separation and transfer efficiency in photo-generated electrons and holes than pure TiO2 or g-C3N4 under the same conditions. This study aims to gain insight into the photocatalytic mechanism in the heterostructure scheme.
2. Experimental section
2.1 Materials
All chemicals used in the experiments were analytically pure and used without further purification. TiO2 powder (P-25) was purchased from Beijing Setree Technology Development Co., Ltd. Monohydrated citric acid, ethylenediamine, melamine, tetracycline, Rhodamine B and methylene blue were purchased from Sinopill Beijing Chemical Reagent Co., Ltd.2.2 Sample preparation
The preparation procedures of each raw material are based on our previous report and are available detailed in the ESI.† For the “one-pot” preparation method, P-25, C-dots, and g-C3N4 with a mass ratio of 1![[thin space (1/6-em)]](https://www.rsc.org/images/entities/char_2009.gif) :
:![[thin space (1/6-em)]](https://www.rsc.org/images/entities/char_2009.gif) 3
3![[thin space (1/6-em)]](https://www.rsc.org/images/entities/char_2009.gif) :
:![[thin space (1/6-em)]](https://www.rsc.org/images/entities/char_2009.gif) 10 were first weighed, and then the mixture was added into a Teflon-lined autoclave containing 50 mL D.I. water. The mixture was stirred for half an hour before hydrothermal-heating at 180 °C for 20 h. After centrifugal washing with D.I. water and vacuum drying processes, the product is denoted as TCC-1. Following a “two-step” preparation method, the CC was first obtained via a hydrothermal process. After naturally cooling to room temperature, P-25 powder was added to the CC suspension. Subsequently, the mixture was ultrasonically treated for 15 min, followed by stirring for 10 h. The cleaned and dried product is denoted as TCC-2. TCC-2 was redispersed into 50 mL D.I. water and hydrothermally treated at 180 °C for 20 h again; the final product is denoted as TCC-3. Note that all samples were derived from the same feed ratio.
10 were first weighed, and then the mixture was added into a Teflon-lined autoclave containing 50 mL D.I. water. The mixture was stirred for half an hour before hydrothermal-heating at 180 °C for 20 h. After centrifugal washing with D.I. water and vacuum drying processes, the product is denoted as TCC-1. Following a “two-step” preparation method, the CC was first obtained via a hydrothermal process. After naturally cooling to room temperature, P-25 powder was added to the CC suspension. Subsequently, the mixture was ultrasonically treated for 15 min, followed by stirring for 10 h. The cleaned and dried product is denoted as TCC-2. TCC-2 was redispersed into 50 mL D.I. water and hydrothermally treated at 180 °C for 20 h again; the final product is denoted as TCC-3. Note that all samples were derived from the same feed ratio.
2.3 Characterization
X-ray powder diffraction (XRD) analysis was performed on a Bruker AXS-D2 diffractometer equipped with monochromatic high-intensity Cu Kα radiation (λ = 0.154056 nm). High-resolution transmission electron microscope (HRTEM) images were performed on a JEM-2100 Plus using an acceleration voltage of 200 kV. UV-Vis absorption analysis was conducted on a Shimadzu SolidSpec-3700 instrument. Photoluminescence (PL) spectra were measured on a Hitachi F-7000 using a UV-Vis spectrophotometer with a Xe lamp as the excitation light source. Fourier transmission infrared (FT-IR) spectra were recorded on an Avatar 360 FT-IR spectrometer.2.4 Photocatalytic degradation
The photocatalytic activities were operated under ultraviolet irradiation from a high-pressure mercury lamp (365 nm, 15 W) by the photodegradation of RhB and MB in D.I. water. The aqueous system containing RhB or MB (1.0 × 10⁻⁵ M, 100 mL) and photocatalyst (10.0 mg) was first magnetically stirred in dark for 30 min to reach the balance of absorption and then exposed to UV light at room temperature for different time periods. During the photocatalytic reaction, the RhB or MB concentration was monitored by a WFJ-2000 spectrophotometer (the fixed measurement wavelength of RhB or MB solution is 554 nm and 662 nm, respectively).3. Results and discussion
TCC-1 was first obtained using a “one-pot” hydrothermal route, using the green and straightforward preparation process for a ternary heterostructure photocatalyst. The existence of C-dots can improve the dispersion of g-C3N4 and increase the deposition content of TiO2 NPs.19 To elucidate the effects of the hydrothermal treatment, TCC-2 and TCC-3 were also yielded without and with the hydrothermal process, respectively. The schematic of the preparation processes is shown in Fig. 1.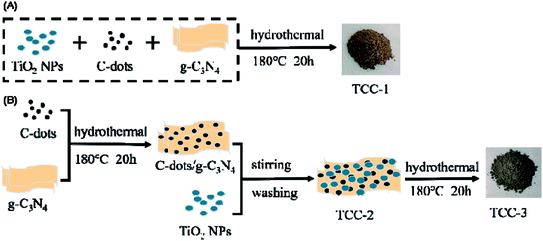 | ||
| Fig. 1 Schematic of the preparation processes of the ternary composites TiO2/C-dots/g-C3N4. (A) “One-pot” hydrothermal process; (B) “two-step” hydrothermal process. | ||
3.1 Structure analysis
TEM images were captured to obtain the morphologies of as-fabricated photocatalysts. S-Fig. 1 (ESI†) presents the TEM images of C-dots and g-C3N4. It can be seen that the average size of the monodispersed C-dots is roughly 3 nm. The as-prepared g-C3N4 exhibits a typical 2D multi-layered structure, and the length of g-C3N4 is mainly in the range of 50–300 nm. TEM measurement results of TCC-1, as shown in Fig. 2, demonstrate that the g-C3N4 nanosheets in the composite mainly have a length of 100–200 nm, which is consistent with the pure g-C3N4. TiO2 nanoparticles with a size range of 20–30 nm well-disperse in the whole area. The HRTEM image in Fig. 2(B) exhibits the resolved lattice fringes of d ≈ 0.35 nm that corresponds to the (101) crystallographic place of the anatase phase of TiO2 in P-25. It should be noted that there is a thin layer observed on the surface of the TiO2 nanoparticles, as shown by the red arrow in Fig. 2(B), supporting the above conclusion on the protective effects of C-dots. This observation suggests that all three materials have well-mixed conjunctions in the composite, which can help achieve improved photo-generated electron–hole separation and enhanced photocatalytic efficiency.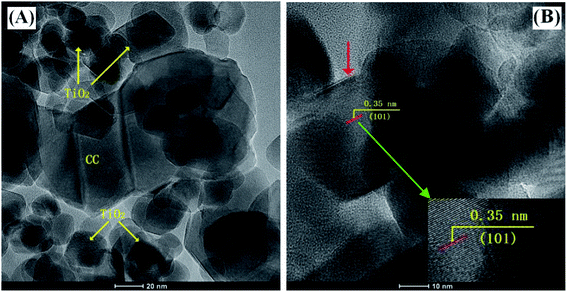 | ||
| Fig. 2 (A) TEM images of the one-pot hydrothermally treated TCC-1 hybrids. (B) HRTEM micrograph of TCC-1 (the red arrow points to the c-dots attached on TiO2 particles). | ||
XRD patterns of each sample were acquired, as shown in Fig. 3. The blackline in Fig. 3(A) displays two distinctive diffraction peaks at 13.1° and 27.6°, corresponding to the (100) and (002) crystal plane of g-C3N4.20 The XRD pattern of CC is mainly consistent with that of g-C3N4 and demonstrates almost the same peaks owing to the little content of the C-dots in the CC composite. Interestingly, the prominent peak of CC shifting to the right may be attributed to the close contact between C-dots and g-C3N4via the π–π conjugation.21 The characteristic peaks at 25.3°, 37.7°, 48.1°, 54.0°, 55.1° and 62.7° in each pattern from Fig. 3(B) correspond to the anatase phase of TiO2. The peak located at 27.4° is the rutile phase of TiO2, coinciding with the (002) crystal plane of g-C3N4. By comparison of XRD results between the precursor mixture and hydrothermally treated ones, a hindered g-C3N4 signal can be observed. This effect is basically due to the large number of P-25, and C-dots are also uniformly distributed on the g-C3N4 nanosheets, as proved by TEM images.
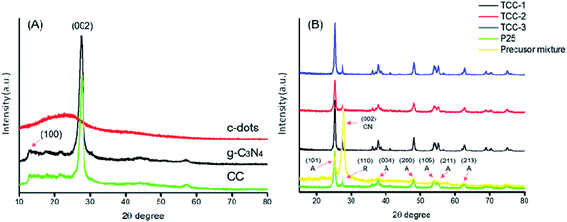 | ||
| Fig. 3 XRD patterns of (A) each precursor (CC, g-C3N4 and C-dots) and (B) as-prepared photocatalyst (A: anatase; R: rutile; CN: g-C3N4). | ||
FT-IR spectra were recorded at room temperature to detect the chemical bonding and composition information of each sample; the results are shown in Fig. 4. Peaks appear around 3000 cm−1 belonging to the N–H stretching vibrations at the aromatic ring defect sites in g-C3N4.22 Other identifiable peaks for g-C3N4 in the range of 1200–1640 cm−1 are attributed to the typical stretching vibrations of the C–N and C![[triple bond, length as m-dash]](https://www.rsc.org/images/entities/char_e002.gif) N heterocycles.23 The spectra of CC and TCC-2 are very similar to that of the pure g-C3N4, agreeing with the previous report;18 however, TCC-1 and TCC-3 illustrate different FT-IR spectra. Because of the coupling effects of TiO2 on the bond vibrations of the organic material CC, the absorption peaks of TCC-1, TCC-2, and TCC-3 in the wavenumber range of 1000–1800 cm−1 exhibit very weak phenomena, and particularly for TCC-1 and TCC-3, the number of the peaks shown are less, inferring that the hydrothermal treatment remarkably increases the coupling interaction of TiO2 with organic materials.
N heterocycles.23 The spectra of CC and TCC-2 are very similar to that of the pure g-C3N4, agreeing with the previous report;18 however, TCC-1 and TCC-3 illustrate different FT-IR spectra. Because of the coupling effects of TiO2 on the bond vibrations of the organic material CC, the absorption peaks of TCC-1, TCC-2, and TCC-3 in the wavenumber range of 1000–1800 cm−1 exhibit very weak phenomena, and particularly for TCC-1 and TCC-3, the number of the peaks shown are less, inferring that the hydrothermal treatment remarkably increases the coupling interaction of TiO2 with organic materials.
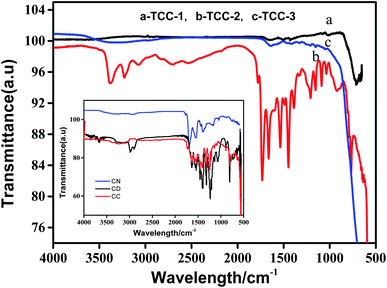 | ||
| Fig. 4 FT-IR spectra of TCC-1, TCC-2 and TCC-3 (inset is the FT-IR spectra of C-dots, CC and g-C3N4). | ||
The chemical composition and elemental status of C, N, and Ti in the as-synthesized TCC-1 photocatalyst were further analyzed by XPS. Fig. 5(A) illustrates that the survey spectrum, in which the main photoelectron peaks include binding energies of 285 eV (C 1s), 400 eV (N 1s), 458 eV (Ti 2p) and 530 eV (O 1s), respectively. The high-resolution C 1s spectrum of TCC-1 (Fig. 5(B)) can be separated into four peaks: 284.51 eV, 285.24 eV, 286.28 eV, and 287.91 eV, respectively. The former three peaks correspond to C-dots in the TCC-1 composites, and the one at 287.91 eV is the sp2-hybridized carbon, which is attributed to the N–C![[double bond, length as m-dash]](https://www.rsc.org/images/entities/char_e001.gif) N regulation of the g-C3N4.24,25Fig. 5(C) shows the high-resolution N 1s spectrum. Two peaks are observed at 399.02 eV and 400.13 eV. The former little peak is ascribed to the N bonded to H atoms, and the dominant peak is the bridging N atom N(C)3 or sp2 bonded nitrogen in a thiazine ring.26,27 Moreover, it can be seen from Fig. 5(D) that the peaks of Ti 2p1/2 and Ti 2p3/2 are observed at 464.5 eV and 458.8 eV, corresponding to the Ti4+ in TiO2.28 For comparison, S-Fig. 2 (ESI†) displays the XPS analyses of g-C3N4 and CC composites. It can also be seen that both g-C3N4 and CC composite contain no Ti element, and the hybrid material CC is composed of C and N with more complicated chemical states, which confirms the co-existence of C-dots and g-C3N4 after the hydrothermal treatment.
N regulation of the g-C3N4.24,25Fig. 5(C) shows the high-resolution N 1s spectrum. Two peaks are observed at 399.02 eV and 400.13 eV. The former little peak is ascribed to the N bonded to H atoms, and the dominant peak is the bridging N atom N(C)3 or sp2 bonded nitrogen in a thiazine ring.26,27 Moreover, it can be seen from Fig. 5(D) that the peaks of Ti 2p1/2 and Ti 2p3/2 are observed at 464.5 eV and 458.8 eV, corresponding to the Ti4+ in TiO2.28 For comparison, S-Fig. 2 (ESI†) displays the XPS analyses of g-C3N4 and CC composites. It can also be seen that both g-C3N4 and CC composite contain no Ti element, and the hybrid material CC is composed of C and N with more complicated chemical states, which confirms the co-existence of C-dots and g-C3N4 after the hydrothermal treatment.
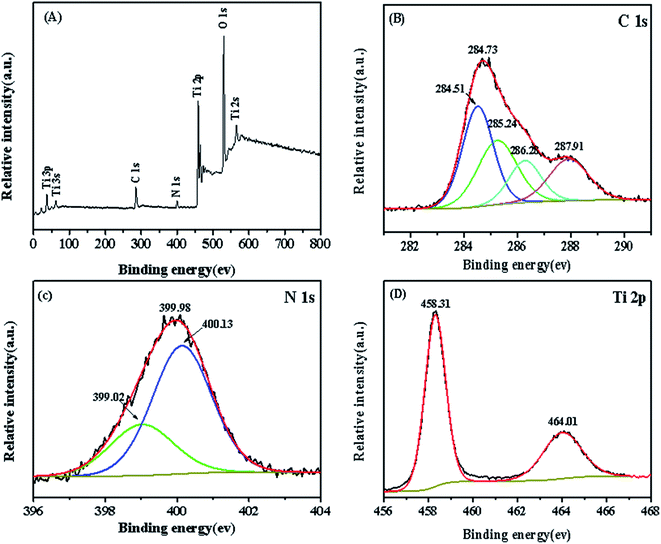 | ||
| Fig. 5 (A) XPS spectrum of TCC-1 and high-resolution XPS spectra of (B) C 1s, (C) N 1s and (D) Ti 2p for TCC-1. | ||
3.2 Photocatalysis performance
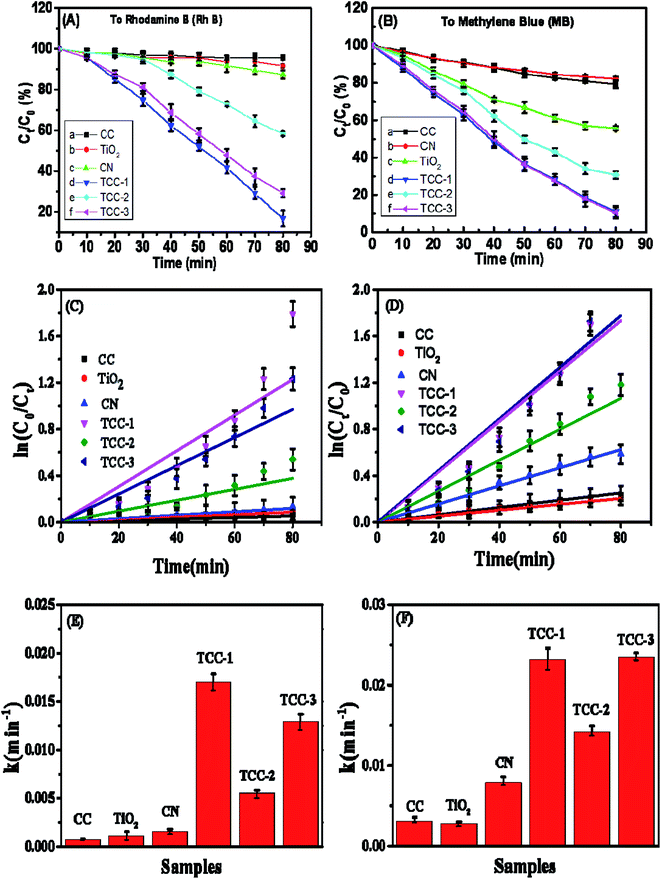
Two types of commonly used dyes (RhB and MB) aqueous solutions were selected for the determination of the photocatalytic performance of the as-prepared samples.29 For comparison, the photocatalytic activities of g-C3N4, P-25 nanoparticles and CC have also been measured under the same photodegradation conditions. The photocatalytic results of these samples can be found in Fig. 6(A) and (B). For the RhB photodegradation experiments, after 80 min UV irradiation, the “one-pot” hydrothermally treated TCC-1 shows the highest photodegradation efficiency (83.3%). It should be noted that the photodegradation rate of TCC-1 to RhB is better than that of the TCC-3 and may be due to product loss during washing. Moreover, for such two photocatalysts, with prolonged exposure time from 0 to 80 min, the Ct/C0 values of MB show a similar change trend and almost consistently decrease from 1 to ca. 0.11. Fundamentally, the rate constant k in the reaction kinetics indicates the photocatalytic activity of the photocatalysts. The RhB and MB photodecomposition curves are well-fitted with pseudo-first-order kinetics in our experiments (Fig. 6(C) and (D)). The k values in different processes were calculated by the equation ln(C0/Ct) = kt, and the results are available in Fig. 6(E) and (F). The k values of the as-prepared hybrid photocatalysts (TCC) are all higher than that of the raw materials (TiO2 and g-C3N4). For the RhB photodegradation, the one-pot hydrothermally treated sample TCC-1 indicates the highest kinetic constants of 0.0169 min−1, which is approximately 3 times and 1.3 times higher than TCC-2 (0.0055 min−1) and TCC-3 (0.0129 min−1), respectively. Similarly, both TCC-1 (0.0231 min−1) and TCC-3 (0.0233 min−1) show an acceleration of the photocatalytic reaction by significantly enhancing MB photodegradation under the same irradiation conditions. Such results prove the importance of hydrothermal treatments in accelerating photocatalytic reactions.It should be that the precursors CC and TiO2 NPs exhibited weak photodegradation activities, which could be interpreted that the photodegradation behaviors resulted mainly from the disparity of electron–hole separation, and partly from the enhanced hydrophilicity generated by the hydrothermal treatment. The superhydrophilicity of TCC-1 was proved by the contact angle analysis presented in ESI (S-Fig. 3†).
The electrochemical analyses were employed further to examine the photogenerated carrier transfer and separation behaviors. Fig. 7(A) demonstrates that the one-pot hydrothermally activated sample TCC-1 presents the minimum impedance in the electrochemical impedance spectroscopy (EIS) spectra, indicating that the electrons are easy to transfer on the TCC-1 sample with the help of C-dots. In order to further prove the lower recombination rate of photogenerated electrons and holes on our newly designed composites, transient photocurrent intensity response measurements were conducted in a 0.5 M Na2SO4 aqueous solution. The photocurrent intensity versus time results are shown in Fig. 7(B). The TCC-1 sample exhibits the highest photocurrent density, approximately reached 1.2 μA cm−2, followed by TCC-3 (∼1.0 μA cm−2) and TCC-2 (∼0.8 μA cm−2). Both EIS and photocurrent results matched with that of photocatalytic efficiency preformation of these samples, which prove that the hydrothermal treatment process improves the photocatalytic activity of the composite photocatalysts by reducing the recombination of photogenerated carriers. In this case, more efforts on optimizing the photocatalyst preparation conditions are expected to further improve the photocatalytic performance.
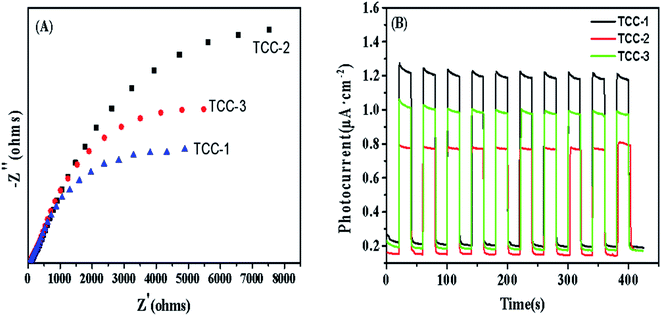 | ||
| Fig. 7 (A) Electrochemical impedance spectroscopy (EIS) and (B) the transient photocurrent responses of samples TCC-1, TCC-2, and TCC-3. | ||
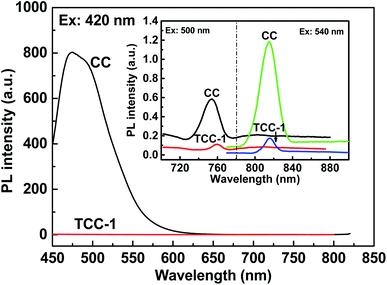
In general, g-C3N4 suffered from the low efficient separation of photo-generated electrons and holes, and thus, the PL analysis was employed to investigate the separation efficiency of photo-generated carriers.30 It is well-known that there is a negative relationship between the PL intensity and photocatalytic activity, i.e., a lower PL intensity that suggests better separation efficiency for photo-excited electron–hole pairs, implies a higher photocatalytic behavior. The PL spectra of hydrothermal fabricated CC and TCC-1 are shown in Fig. 8 under the excitation wavelength of 420 nm, 500 nm and 540 nm.
At 420 nm, the CC presents a broad PL emission peak (∼470 nm). This intense emission peak is attributed to the band–band PL phenomenon with the energy of light approximately equal to the band-gap energy of pristine g-C3N4.31 The PL signal of TCC-1 demonstrates that the recombination of photo-generated electrons and holes is suppressed after loading a small amount of P-25, indicating that the separation of photo-generated electrons and holes in the ternary hybrid is more efficient than in g-C3N4. Thus, it is understandable that the ternary heterostructure photocatalyst indicates superior photocatalytic activity than others. It is notable that at 500 nm and 540 nm, the PL spectrum of the TCC-1 shows weak peaks compared with CC. The low PL intensity of the TiO2-composed photocatalyst is probably because of the low amount of photo-generated electron–hole pairs under the same irradiation conditions. This phenomenon suggests that electron–hole separation behaviors exist and produce numerous separated electrons and holes, remarkably enhancing photocatalytic activity, which may be attributed to the effective charge transfer between g-C3N4 and TiO2 with the assistance of C-dots.32
3.3 Photocatalytic mechanism
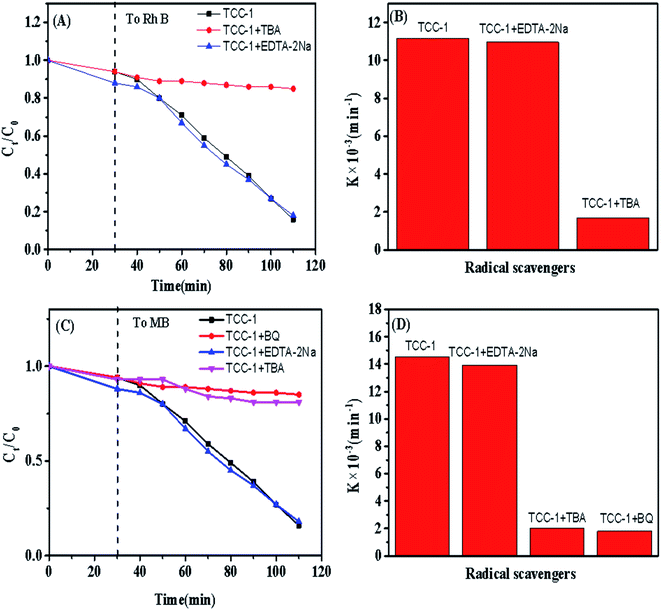
It is widely accepted that the photocatalysis of solid material is directly affected by the efficient separation of photo-generated electron–hole pairs. Reasonably coupled different photocatalysts exhibit a higher level of electron–hole separation.33,34 Although some studies have verified that a ternary photocatalyst shows remarkably high photocatalysis,35 few reported that such ternary composite photocatalytic performance could further be activated and enhanced via a hydrothermal reaction. For TCC-1 and TCC-3, owing to the strengthened coupling interactions between TiO2 NPs and CC resulted from the hydrothermal treatment, the electron–hole separation efficiency has been deeply enhanced, causing a higher photodegradation level to MB molecules. Besides, the hydrothermal treatment has been proved beneficial for generating superhydrophilic surfaces to the hybrids that could enhance the photodegradation rate of RhB and MB by the effective absorption of dye on the surface of photocatalysts.1According to previous studies,9,36 the photodegradation of RhB can be divided into two types: (1) ˙O2− radicals-induced cleavage of the whole conjugated chromophore structure; or (2) hole (h+)/˙OH induced formation of stepwise N-deethylated intermediates.37 Therefore, it can be deduced that ˙O2− and h+ are responsible for the degradation of RhB or MB. To further confirm the deduction of active species, a series of controlled radical trapping experiments have been performed in our study by introducing radical scavengers in the system. As shown in Fig. 9, the degradation efficiency of RhB or MB is remarkably suppressed by addition of tert-butyl alcohol (TBA), which is known as an effective ˙OH radical scavenger.38 A similar and apparent inhibition phenomenon for the photocatalytic reaction was also observed when p-benzoquinone (p-BQ) acts as a scavenger for ˙O2− radicals.39 It is interesting to find that BQ is not suitable as an additive in the RhB degradation process due to its intrinsic color insolution, which may lead to an increase in the transmittance. In addition, the addition of disodium ethylene diamine tetra-acetate dehydrate (EDTA-2Na) to scavenge for h+, exhibits rare effects on photocatalytic efficiency. These outcomes reveal that the hybrid photocatalyst allows for the in situ generation of ˙OH and ˙O2− radicals, which further react with RhB and MB molecules to arouse the degradation effect.
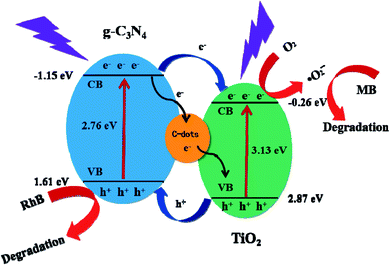
Based on the above-mentioned characteristic results, a plausible mechanism for the photodegradation of RhB or MB is provided and demonstrated in Fig. 10. Under UV irradiation, g-C3N4 and TiO2 adsorb photons and electrons are excited. A number of the photo-generated electrons easily transfer from the valence band (VB) of g-C3N4 (−1.15 eV) to the conduction band (CB) of TiO2 (−0.26 eV) as the VB edge potential of g-C3N4 is more negative than that of TiO2. Under the powerful driving force caused by the differences in the CB edge potentials between g-C3N4 and TiO2, the photo-generated electron–hole pairs on the g-C3N4 surface are efficiently separated. In addition, with highly electronic conductive C-dots that are well contacted with g-C3N4 and TiO2, the electrons are readily transferred to the C-dots first, consequently forming an electron bank. Simultaneously, as for the strong hydrophilicity on the surface of TCC-1, RhB or MB could effectively be adsorbed onto the catalyst surface, thus facilitating the advanced oxidation process (AOP). The photo-induced h+ is also a critical species for the decomposition of RhB. Owing to the VB potential of TiO2 (2.87 eV), which is higher than that of ˙OH/OH− (1.99 eV), the h+ on the VB of g-C3N4 is sufficient to oxidize the adsorbed OH− to ˙OH, and therefore as a highly reactive species, the ˙OH is confirmed to photodegrade RhB or MB in aqueous solution on the surface of TiO2.
4. Conclusion
Through two hydrothermal preparation processes, namely “one-pot” and “two-step,” a series of ternary heterostructure photocatalysts were synthesized successfully. The configuration of the as-fabricated composites was characterized by TEM, XRD and FT-IR analyses. Significantly, the “one-pot” prepared composite was very simple, directly produced under low-temperature hydrothermal conditions in an aqueous mixture system composed of TiO2 nanoparticles, C-dots, g-C3N4. It is confirmed that the hydrothermal treatment strengthened the bond of each component, complexing them more strongly. The coupling interaction among TiO2, C-dots and g-C3N4 enhanced the photo-generated electron–hole pair separation efficiency compared to pure P-25 and g-C3N4, further increasing their photodegradation activity to the organic dye RhB or MB under UV irradiation. The PL measurements also confirmed the lower recombination rate of charges in the TCC-1 heterostructure. A possible photocatalysis mechanism was proposed in this study. Our experiments may provide a new method to design and synthesize high-efficient photocatalysts for degradation applications.Conflicts of interest
There are no conflicts to declare.Acknowledgements
The research work was supported by the funding of the Agricultural Environmental Monitoring Station of Beijing (No. 19000531813, 19000551279 and 19000551347) and Chemistry and Material Engineering College in BTBU.References
- A. Ajmal, I. Majeed, R. N. Malik, H. Idriss and M. A. Nadeem, RSC Adv., 2014, 4, 37003–37026 Search PubMed.
- K. P. O. Mahesh and D. H. Kuo, Appl. Surf. Sci., 2015, 357, 433–438 Search PubMed.
- C. Tan and W. X. Wang, Environ. Pollut., 2017, 231, 311–318 Search PubMed.
- E. Bizani, K. Fytianos, I. Poulios and V. Tsiridis, J. Hazard. Mater., 2006, 136, 85–94 Search PubMed.
- K. Lee, H. Yoon, C. Ahn, J. Y. Park and S. K. Jeon, Nanoscale, 2019, 11, 7025–7040 Search PubMed.
- Y. L. Chen and X. Bai, Catalysts, 2020, 10, 10010142 Search PubMed.
- A. J. Du, S. Sanvito, Z. Li, D. W. Wang, Y. Jiao, T. Liao, Q. Sun, Y. H. Ng, Z. H. Zhu, R. Amal and S. C. Smith, J. Am. Chem. Soc., 2012, 134, 4393–4397 Search PubMed.
- X. C. Wang, S. Blechert and M. Antonietti, ACS Catal., 2012, 2, 1596–1606 Search PubMed.
- N. Syed, J. F. Huang, Y. Q. Feng, X. Wang and L. Y. Cao, Front. Chem., 2019, 7, 00713 Search PubMed.
- R. A. Senthil, J. Theerthagiri, A. Selvi and J. Madhavan, Opt. Mater., 2017, 64, 533–539 Search PubMed.
- W. J. Liu, C. Li, Y. J. Ren, X. B. Sun, W. Pan, Y. H. Li, J. P. Wang and W. J. Wang, J. Mater. Chem. B, 2016, 4, 5772–5788 Search PubMed.
- S. J. Zhu, Q. N. Meng, L. Wang, J. H. Zhang, Y. B. Song, H. Jin, K. Zhang, H. C. Sun, H. Y. Wang and B. Yang, Angew. Chem., Int. Ed., 2013, 52, 3953–3957 Search PubMed.
- T. H. Ji, P. D. Fan, X. L. Li, Z. P. Mei, Y. Y. Mao and Y. Q. Tian, RSC Adv., 2019, 9, 10645–10650 Search PubMed.
- M. J. Krysmann, A. Kelarakis, P. Dallas and E. P. Giannelis, J. Am. Chem. Soc., 2012, 134, 747–750 Search PubMed.
- H. Zhang, L. X. Zhao, F. L. Geng, L. H. Guo, B. Wan and Y. Yang, Appl. Catal., B, 2016, 180, 656–662 Search PubMed.
- S. Fang, Y. Xia, K. L. Lv, Q. Li, J. Sun and M. Li, Appl. Catal., B, 2016, 185, 225–232 Search PubMed.
- C. Y. Tang, C. Liu, Y. Han, Q. Q. Guo, W. Ouyang, H. J. Feng, M. Z. Wang and F. Xu, Adv. Healthcare Mater., 2019, 8, 1801534 Search PubMed.
- C. X. Zhao, H. Jia, W. Jin, F. Li, H. Li and W. Chen, Funct. Mater. Lett., 2019, 12, 19500863 Search PubMed.
- Y. Li, X. H. Feng, Z. X. Lu, H. Yin, F. Liu and Q. J. Xiang, J. Colloid Interface Sci., 2018, 513, 866–876 Search PubMed.
- S. W. Cao, J. X. Low, J. G. Yu and M. Jaroniec, Adv. Mater., 2015, 27, 2150–2176 Search PubMed.
- Z. Yang, M. H. Xu, Y. Liu, F. J. He, F. Gao, Y. J. Su, H. Wei and Y. F. Zhang, Nanoscale, 2014, 6, 1890–1895 Search PubMed.
- J. F. Lei, Y. Chen, F. Shen, L. Z. Wang, Y. Liu and J. L. Zhang, J. Alloys Compd., 2015, 631, 328–334 Search PubMed.
- K. Dai, L. H. Lu, C. H. Liang, Q. Liu and G. P. Zhu, Appl. Catal., B, 2014, 156–157, 331–340 Search PubMed.
- Z. Zhou, J. Wang, J. Yu, Y. Shen, Y. Li, A. Liu, S. Liu and Y. Zhang, J. Am. Chem. Soc., 2015, 137, 2179–2182 Search PubMed.
- Y. Li, X. Feng, Z. Lu, H. Yin, F. Liu and Q. Xiang, J. Colloid Interface Sci., 2018, 513, 866–876 Search PubMed.
- S. Zhang, J. Li, X. Wang, Y. Huang, M. Zeng and J. Xu, J. Mater. Chem. A, 2015, 3, 10119–10126 Search PubMed.
- T. Y. Ma, Y. Tang, S. Dai and S. Z. Qiao, Small, 2014, 10, 2382–2389 Search PubMed.
- M. Liu, H. Li and W. Wang, Catal. Today, 2016, 264, 236–242 Search PubMed.
- G. Palanisamy, K. Bhuvaneswari, G. Bharathi, D. Nataraj and T. Pazhanivel, Chemistryselect, 2018, 3(32), 9422–9430 Search PubMed.
- F. Jiang, T. T. Yan, H. Chen, A. W. Sun, C. M. Xu and X. Wang, Appl. Surf. Sci., 2014, 295, 164–172 Search PubMed.
- Y. G. Li, X. L. Wei, H. J. Li, R. R. Wang, J. Feng, H. Yun and A. N. Zhou, RSC Adv., 2015, 5, 14074–14080 Search PubMed.
- R. R. Hao, G. H. Wang, H. Tang, L. L. Sun, C. Xu and D. Y. Han, Appl. Catal., B, 2016, 187, 47–58 Search PubMed.
- S. P. Manalu, T. S. Natarajan, M. D. Guzman, Y. F. Wang, T. C. Chang, F. C. Yen and S. J. You, Green Process. Synth., 2018, 7, 493–505 Search PubMed.
- N. Shehzad, M. Zafar, M. Ashfaq, A. Razzaq, P. Akhter, N. Ahmad, A. Hafeez, K. Azam, M. Hussain and W. Y. Kim, Crystals, 2020, 10, 100923 Search PubMed.
- K. Bhuvaneswari, G. Palanisamy, T. Pazhanivel, T. Maiyalagan and G. Bharathi, Chemistryselect, 2019, 4(11), 2982–2990 Search PubMed.
- B. Chai, J. T. Yan, C. L. Wang, Z. D. Ren and Y. C. Zhu, Appl. Surf. Sci., 2017, 391, 376–383 Search PubMed.
- N. Lu, C. Y. Wang, B. Sun, Z. M. Gao and Y. Su, Sep. Purif. Technol., 2017, 186, 226–232 Search PubMed.
- C. Han, M. Q. Yang, N. Zhang and Y. J. Xu, J. Mater. Chem. A, 2014, 2, 19156–19166 Search PubMed.
- J. Wu, N. Qin and D. Bao, Nano Energy, 2018, 45, 44–51 Search PubMed.
Footnote |
| † Electronic supplementary information (ESI) available. See DOI: 10.1039/d1na00213a |
| This journal is © The Royal Society of Chemistry 2021 |

