
 Open Access Article
 This Open Access Article is licensed under a Creative Commons Attribution-Non Commercial 3.0 Unported Licence
Optimal centrifugal isolating of liposome–protein complexes from human plasma†
Luca
Digiacomo‡
a,
Francesca
Giulimondi‡
a,
Anna Laura
Capriotti
b,
Susy
Piovesana
b,
Carmela Maria
Montone
b,
Riccardo Zenezini
Chiozzi
c,
Aldo
Laganà
b,
Morteza
Mahmoudi
 d,
Daniela
Pozzi
a and
Giulio
Caracciolo
*a
d,
Daniela
Pozzi
a and
Giulio
Caracciolo
*a
aDepartment of Molecular Medicine, Sapienza University of Rome, Viale Regina Elena 291, 00161, Rome, Italy. E-mail: giulio.caracciolo@uniroma1.it
bDepartment of Chemistry, Sapienza University of Rome, P.le A. Moro 5, 00185, Rome, Italy
cBiomolecular Mass Spectrometry and Proteomics, Bijvoet Center for Biomolecular Research, Utrecht Institute for Pharmaceutical Sciences Utrecht University, Heidelberglaan 8, 3584 CS Utrecht, The Netherlands
dDepartment of Radiology, Precision Health Program, Michigan State University, MI, USA
First published on 17th May 2021
Abstract
In the past few years, characterization of the protein corona (PC) that forms around liposomal systems has gained increasing interest for the development of novel therapeutic and diagnostic technologies. At the crossroads of fast-moving research fields, the interdisciplinarity of protein corona investigations poses challenges for experimental design and reporting. Isolation of liposome–protein complexes from biological fluids has been identified as a fundamental step of the entire workflow of PC characterization but exact specifications for conditions to optimize pelleting remain elusive. In the present work, key factors affecting precipitation of liposome–protein complexes by centrifugation, including time of centrifugation, total sample volume, lipid![[thin space (1/6-em)]](https://www.rsc.org/images/entities/char_2009.gif) :protein ratio and contamination from biological NPs were comprehensively evaluated. Here we show that the total amount of isolated liposome–protein complexes and the extent of contamination from biological NPs may vary with influence factors. Our results provide protein corona researchers with precise indications to separate liposome–protein complexes from protein-rich fluids and include proper controls, thus they are anticipated to catalyze improved consistency of data mining and computational modelling of protein corona composition.
:protein ratio and contamination from biological NPs were comprehensively evaluated. Here we show that the total amount of isolated liposome–protein complexes and the extent of contamination from biological NPs may vary with influence factors. Our results provide protein corona researchers with precise indications to separate liposome–protein complexes from protein-rich fluids and include proper controls, thus they are anticipated to catalyze improved consistency of data mining and computational modelling of protein corona composition.
Introduction
The past decade has witnessed fast advance in nanoparticle (NP) research, driven by many biomedical applications.1 However, despite the large amount of preclinical data, clinical application of NPs is very far from being established. Recent research has highlighted that poor knowledge of the bio–nano interactions between NPs and the physiological environment (e.g. blood, saliva, gastric fluids, interstitial fluids etc.) is one of the principal reasons why few NP systems have entered clinical use.2,3 Upon exposure to biological fluids, NPs associate to proteins leading to formation of a coating referred to as “protein corona”4–6 (PC). The concept of protein binding to NPs is known for decades7–12 and some authors pose terminology issues promoting a return to previous nomenclature. Nevertheless, the biological relevance of the protein corona has long been underestimated. It is this restructured bio-interface that is responsible for activation of cellular pathways13,14 (e.g. cytokine release), intracellular trafficking15 and numerous other impacts. Ultimately, the protein corona controls NP immune response, toxicity, and biodistribution.16 Among the myriad NP-based drug delivery systems reported so far, liposomes are the most widely investigated ones for clinical use.17,18 The wide knowledge of biophysics and biochemistry of membrane lipids19,20 has been translated into the development of several liposomal formulations benefitting many people around the globe. Liposomes are lipid bilayer vesicles around 100–150 nm in size and, hereafter, we will call liposome–protein corona21 the protein coating that surrounds them following exposure to biological fluids. A long-lasting liposome–protein corona with receptor-binding sites could act as a personalized “endogenous trigger” promoting favorable interaction with target cells. This opens the exciting possibility to manipulate protein corona by liposome design.22 While not being an easy task, it could represent a turning point in the development of novel liposome-based strategies for personalized nanomedicines.Over the last decade we have started to understand that several overlooked factors associated with the liposome–protein corona have long limited translation of liposome technology from benchtop to bedside.21,23,24 Although many relevant aspects of the liposome–protein corona have been clarified,25–28 there are still concerns to be addressed. Among them, separation of liposome–protein complexes from biological fluids has been identified as a fundamental step of the entire workflow of PC characterization. Commonly used isolation methods including size-exclusion chromatography (SEC), membrane ultrafiltration and centrifugation have been recently reviewed.29–31 While the first two methods have been shown to be prone to protein contamination,32 proper evaluation of factors affecting precipitation of liposome–protein complexes by centrifugation remains elusive. Experimental approaches based on centrifugation to study the PC of inorganic NPs were the first to be established.6 These methods were subsequently extended to liposomes and other lipid-based systems. However, even the field of inorganic NPs has yet to adopt a best practice approach mainly due to the enormous variability in nanomaterial characteristics.33 In particular, variations in material density make it impossible to provide an exact specification for centrifugation factors (e.g. time and speed) to optimize the pelleting of the nanomaterials with their associated proteins. Likewise, a systematic study of the factors influencing protein corona isolation from liposomes has not been reported so far thus impairing reproducibility and consistency among laboratories. To fulfil this gap, in the present work, via rational experimental design, key factors affecting isolation of liposome–protein complexes by centrifugation were comprehensively evaluated. These included time of incubation, total sample volume and lipid:protein ratio. The lipid amount in the supernatants was quantified by fluorescence measurements, while the protein composition of the coronas was determined by one-dimensional (1D) gel electrophoresis and liquid-chromatography tandem mass spectrometry (LC-MS/MS) experiments. In an attempt to generalize results, we extended our investigation to a wide range of lipid systems used in drug and gene delivery, i.e. un-PEGylated and PEGylated liposomes and cationic liposome/DNA complexes (lipoplexes). Our results indicate that the total amount of isolated proteins and the contamination from biological NPs may change with the influence factors, but the corona composition is only dependent on the liposomes' synthetic identity and the protein source. Reviewing the literature and the concerns associated with other isolation methods, it is clear that centrifugation should be the technique of choice for studies on the liposome–protein corona.
Results and discussion
As a first step of our study, we investigated the effect of centrifugation time, total sample volume and human plasma (HP) concentration on the absolute amount of pelleted sample. To this end, we prepared a fluorescence-labeled liposomal formulation made of the cationic lipid 1,2-dioleoyl-3-trimethylammonium propane (DOTAP) and the zwitterionic lipid 1,2-dioleoyl-sn-glycero-3-phosphoethanolamine (DOPE) (1:1 molar ratio). This formulation was chosen as it is a gold-standard for both gene34 and drug35 delivery applications. DOTAP–DOPE liposomes were incubated with HP for 1 hour at 37 °C, at three different HP concentration: 5%, 50% and 80% of the total sample volume, which was fixed to 50 μL, 100 μL and 200 μL respectively.
Protein corona isolation was performed by centrifuging all the samples for 15 minutes or 60 minutes at 4 °C, 21400g. This centrifugation speed corresponds to the highest speed of many benchtop centrifuge models and has been used in numerous previous investigations.36 After centrifugation, supernatants were collected and subjected to fluorescence measurements to quantify the residual amount of non-pelleted lipids.
As measured fluorescence depends on the sample volume, three distinct calibration curves for each total sample volume (i.e. 50 μL, 100 μL and 200 μL) were obtained (Fig. 1a). Recovery rate of lipids in the supernatant was represented by percentage ratio of the amount of lipid after precipitation to its initial amount (before precipitation) (Fig. 1b).
 | ||
| Fig. 1 (a) Calibration curves for the measurements of lipid concentration by fluorescence experiments. (b) Measured recovery rates of lipids in the supernatant represented by percentage ratio of the lipid amount after precipitation to its initial amount (before precipitation). | ||
The lowest recovery rate of lipid in the supernatant (i.e. the highest efficacy of pelleting) was achieved when liposomes were exposed to low protein concentration (5% HP). This peculiar behavior is in agreement with the presence of large liposome–protein aggregates in solution at low HP concentration. In a previous publication,26 Giulimondi et al. have demonstrated that around 5% HP cationic liposome–protein complexes reach their isoelectric point. When neutrally charged complexes collide, short-range van der Waals forces dominate over electrostatic repulsions and induce formation of large-size aggregates. Such big clusters are more easily pelleted by centrifugation. Conversely, in solutions at 50% HP and 80% HP, the lipid amount in the supernatant ranged from 12% to 52% and followed general trends. As shown in Fig. 1b, increasing centrifugation time and decreasing sample volume generally led to smaller lipid recovery in the supernatant, i.e. to larger pelletizing of liposome–protein complexes. These findings clearly indicate that the amount of pelleted liposome–protein complexes is dependent on the technical parameters of the centrifugal procedure. Then, the question immediately arose whether the experimental protocol of centrifugation had an impact also on the corona composition. As relevance in characterization of protein corona has increased, the field has introduced a set of experimental methods to characterize it. This assortment of specializations poses concerns to investigation design and reporting.37 This is a point of great general interest as systematic changes in corona composition produced by the experimental protocol would make it impossible to compare results from different studies.
To address this issue, we studied the protein patterns of each sample by 1D SDS–PAGE. As a representative example, Fig. 2 summarizes the electrophoretic outcome for liposome–protein complexes obtained exposing liposomes to intermediate protein concentration (i.e. HP 50%). As shown in Fig. 2a (uncropped gel image is provided Fig. S1 in the ESI†), the lane intensity increased with total sample volume and centrifugation time and exhibited a very good correlation with the pelleted lipid amount evaluated by fluorescence measurements (Fig. 2b). This clearly indicates that the ratio of lipid to protein pelleted by centrifugation stays constant under different centrifugation conditions. The total lane intensities are also reported in the top panels of Fig. 2c, along with the corresponding intensity curves. An increasing trend of the intensity signal as function of the total sample volume can be recognized. However, the shape of the intensity curves seems to be the same for all the samples. This is confirmed by normalizing the curves, to obtain the molecular weight distributions of corona proteins (Fig. 2d). Interestingly, the observed increasing trend for the original intensity curves was found for the integral areas within different ranges of molecular weights between 20 kDa to 300 kDa (Fig. 2e). Conversely, no significant difference was found for the integral areas of the normalized patterns (Fig. 2f). Taken together, these results show that protein corona composition is not dependent on the centrifugation factors. This was confirmed for both low (i.e. 5% HP) and high (i.e. 80% HP) protein concentration (Fig. S1 in the ESI†). To our knowledge, this is the first demonstration that pelletizing liposome–protein complexes under different centrifuge conditions leads to the same protein corona composition.
 | ||
| Fig. 2 (a) Cropped 1D SDS–PAGE image of the PC isolated from DOTAP–DOPE 1:1 (mol mol−1) after incubation with HP (50% vol) and centrifugation under the indicated conditions of sample volume and centrifugation time. (b) Correlation analysis between total lane intensity from 1D SDS–PAGE and recovered lipid amount in pellets, measured by fluorescence experiments. (c) Total lane intensity (bar) and absolute intensity profiles for each lane. (d) Corresponding normalized profiles. Integral areas within the specified molecular weight ranges for (e) absolute and (f) normalized profiles. For each MW range, integral area distributions are reported as grey boxplots. Despite huge differences in the absolute integral areas among the explored centrifugation conditions, the corresponding analysis on normalized profiles reveals no significant differences, thus indicates that the PC composition did not depend on centrifugation factors. | ||
Numerous previous investigations have clarified that protein binding to liposomes is controlled by several concomitant factors such as lipid composition,38 surface properties,39 incubation time,40 protein source41,42 and concentration.43 Among them, electrostatic attraction between proteins and lipids seems to be the dominant interaction. Thus, the effect of surface charge of liposomes on the efficacy of pelletizing was investigated next. Membrane charge density of lipid vesicles can be easily tuned by adjusting molar fraction of cationic lipids in the lipid bilayer.44 Fine-tuning molar fraction of DOTAP, we prepared (i) low charged liposomes (i.e. DOTAP–DOPE 1:3 (mol mol−1)) and (ii) highly charged liposomes (i.e. DOTAP–DOPE 3:1 (mol mol−1)).
As shown in Fig. S2,† the recovery rate of lipid in the supernatant was roughly the same for highly- and low charged liposomes. This result indicates that the efficacy of pelleting liposome–protein complexes is not affected by membrane charge density of liposomes. 1D SDS–PAGE experiments allowed us investigating the composition of the liposome–protein corona. Gel images corresponding to liposome–protein complexes for DOTAP–DOPE 1:1 (mol mol−1), DOTAP–DOPE 1:3 (mol mol−1) and DOTAP–DOPE 3:1 (mol mol−1) are shown in Fig. S1, S3 and S4† respectively. For each formulation, high correlation coefficients between the recovery rate of lipids in the pellet fluorescence and total lane intensity were measured (Fig. 3a–c). Average protein patterns for the three liposomal formulations upon incubation with human plasma at 5%, 50% and 80% HP are shown in Fig. 3d, e and f, respectively. We observe that protein patterns depended both on the employed formulation and protein concentration. This finding is in full agreement with previous results showing that the nanoparticle–protein corona is simultaneously shaped by (i) NPs' physiochemical properties and (ii) the protein source. However, for each combination of liposomal formulation and HP concentration, corona composition was not affected by the centrifugation protocol (Fig. S3 and S4†).
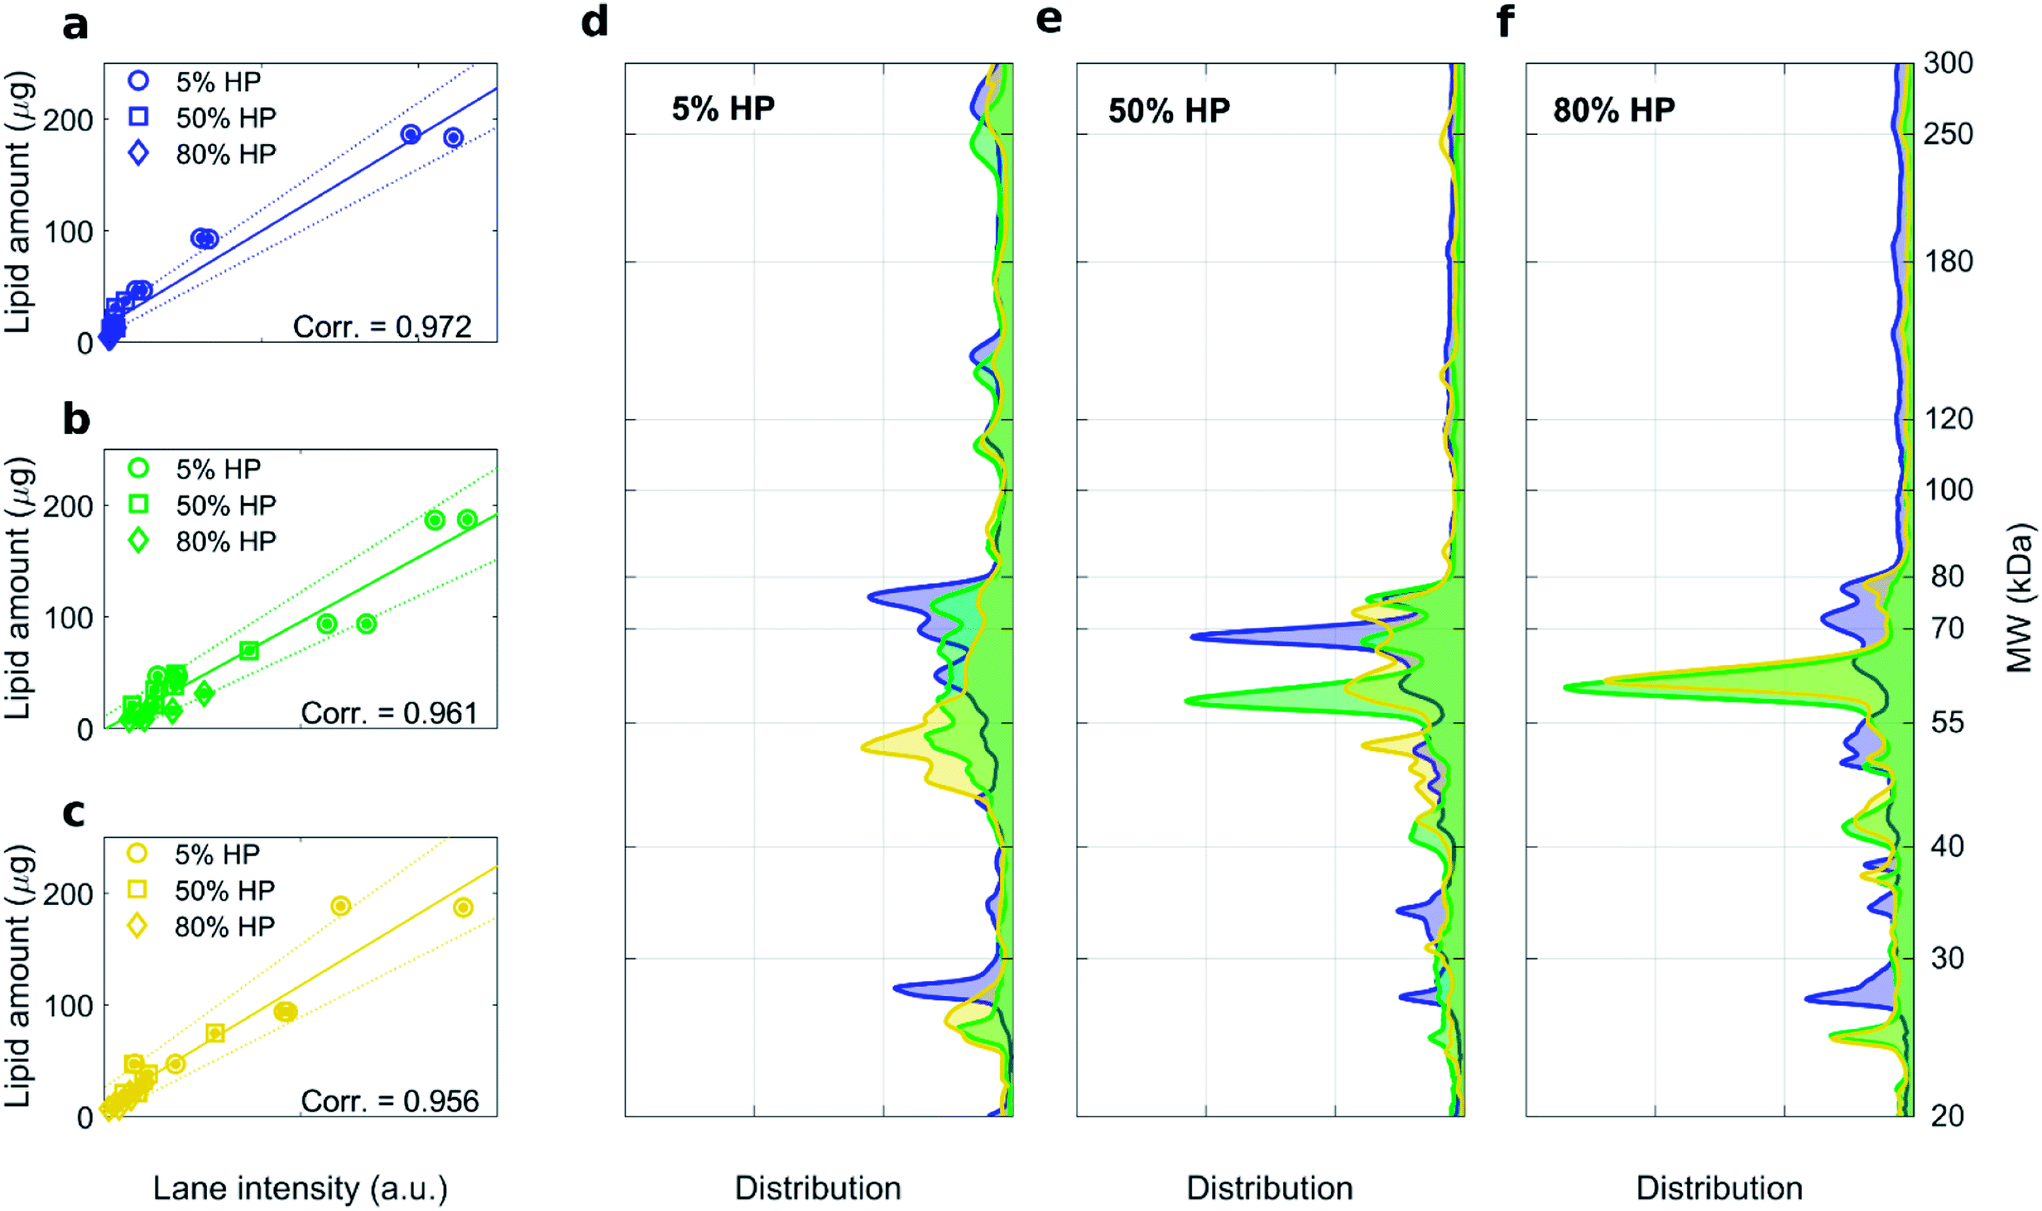 | ||
| Fig. 3 1D SDS–PAGE analysis of the PC isolated from DOTAP–DOPE 1:3 (mol mol−1) (blue), DOTAP–DOPE 1:1 (mol mol−1) (green), DOTAP–DOPE 3:1 (mol mol−1) (yellow) under different centrifugation conditions (gel images are provided in Fig. S3, S1 and S4 in the ESI,† respectively). (a–c) Correlation analysis between total lane intensity from 1D SDS–PAGE and recovered lipid amount in pellets, measured by fluorescence experiments. (d–f) Average normalized 1D SDS–PAGE profiles grouped by HP concentration. | ||
As the protein corona affects manifold biological processes involved in the targeted delivery of nanomedicines, we included in our analysis two more relevant nanodelivery systems: PEGylated liposomes and PEGylated liposome/DNA complexes (lipoplexes). Grafting PEG to liposome surface represents one of the most used and effective surface functionalization to reduce protein binding, avoid opsonization and prolong bloodstream circulation of liposomes in vivo. On the other hand, PEGylated lipoplexes have been the object of numerous investigations for gene delivery purposes over the last two decades including cancer gene therapy.45
Fig. 4a depicts the recovery rates of lipid in pellets after incubation with HP followed by sample centrifugation, as a polar plot for unPEGylated DOTAP–DOPE liposomes, PEGylated DOTAP–DOPE liposomes and DOTAP–DOPE/DNA lipoplexes. Each radius of the plot represents one experimental condition, whereas the distance from the centre quantifies the relative lipid content in pellets to the original amount (i.e. pre-centrifuge), i.e. the bigger the distance from the centre, the higher the amount of pelleted liposomes with their associated proteins. The lipid content in pellets for the PEGylated liposome (violet) was much less abundant than that corresponding to the un-PEGylated formulation (green) as PEG reduced the adsorption of proteins. On the other hand, the pelleting of PEGylated lipoplexes (red) was intermediate with respect to the other two formulations. This suggests that plasma proteins bind specifically to plasmid DNA. This observation is in agreement with previous investigations that compared the protein profiles adsorbed to cationic liposomes and lipoplexes with the same lipid composition.46 Proteomics data showed that some complement proteins such as C5, C7 and C8 were exclusively found in the protein corona of lipoplexes. According to literature, this was attributed to the existence of a domain with DNA-binding activity in the complement proteins.47 1D SDS–PAGE experiments (gel images are provided in Fig. S1, S5 and S6†) confirmed that the protein corona is simultaneously shaped by physical–chemical properties of lipid vesicles and HP concentration (Fig. 4b). For small plasma concentration (5% HP), protein patterns are almost superimposed over the entire MW domain, but a peculiar peak within 20–30 kDa is exhibited by lipoplexes (red curve). A further peak at 30 kDa characterized its profile at 50% HP, whereas the main band for unPEGylated (green curve) and PEGylated (violet curve) liposomes was located at about 60 kDa and was much more prominent for the unPEGylated formulation. At 80% HP, that band represented the dominant peak for unPEGylated liposomes, whose pattern clearly differed from the other two, which in turn were found to be quite similar to each other. Second and foremost, electrophoretic results demonstrated that centrifugation only affected the total protein amount bound to vesicles but had no appreciable effect on the corona composition (Fig. S5 and S6 in the ESI†). As a next step, we performed nano liquid chromatography tandem mass spectrometry (nano LC-MS/MS) experiments to provide quantitative information on the protein corona composition (protein lists are reported in Table S1 in the ESI†). For each of the three formulations, we compared protein patterns isolated under the two experimental conditions leading to (i) the highest (i.e. total volume 50 μL and 60 min centrifugation time) and (ii) the lowest pelleting capacity (i.e. 200 μL total sample volume and 15 min centrifugation time). Results are represented as “Volcano plots” (Fig. 5), which aim to quantify the differences in relative protein abundances (RPA) of each single protein after corona isolation under the two explored experimental conditions. Proteins with similar RPA (i.e. p ≥ 0.05 or |log2(fold change)| ≤ 1) are indicated as grey dots and their cumulative RPA overcame 90% of the corona composition for all the studied formulations. Interestingly, this “overlap” percentage reached about 95% for PEGylated liposomes (Fig. 5b) and PEGylated lipoplexes (Fig. 5c). Corona proteins exhibiting relevant differences (i.e. p < 0.05 and |log2(fold change)| > 1) are indicated as colored dots, their cumulative RPA and total number are reported within the corresponding outer regions. Their contributions to the corona composition were found particularly small for PEGylated liposomes (Fig. 5b) and PEGylated lipoplexes (Fig. 5c), as they were always less than 4%. This value reached 8.4% for the unPEGylated formulation (Fig. 5a) and represented the highest portion of dissimilarity between the two experimental conditions of corona isolation. Of note, this portion is distributed over a remarkable number of protein (n = 59), thus the average RPA of the single proteins populating that region was quite small and read about 0.14%. In conclusion, nano LC-MS/MS experiments totally confirmed the findings of 1D SDS–PAGE demonstrating that the vast majority of the corona composition is not affected by the centrifugation protocol.
 | ||
| Fig. 4 (a) Polar plots of recovery rates of lipids in the pellets for unPEGylated DOTAP:DOPE liposomes, PEGylated liposome and PEGylated lipoplex. The percentage ratio of the lipid amount after precipitation to its initial amount (before precipitation) is represented by the distance from the center, for each of the investigated centrifugation conditions (radii of the polar plot). (b) 1D SDS–PAGE normalized profiles of the PC isolated from unPEGylated liposome, PEGylated liposome and PEGylated lipoplex at different HP concentration: 5% HP, 50% HP, 80% HP. For each experimental condition DOTAP and DOPE were mixed in equimolar ratio (i.e. 1:1 mol mol−1). | ||
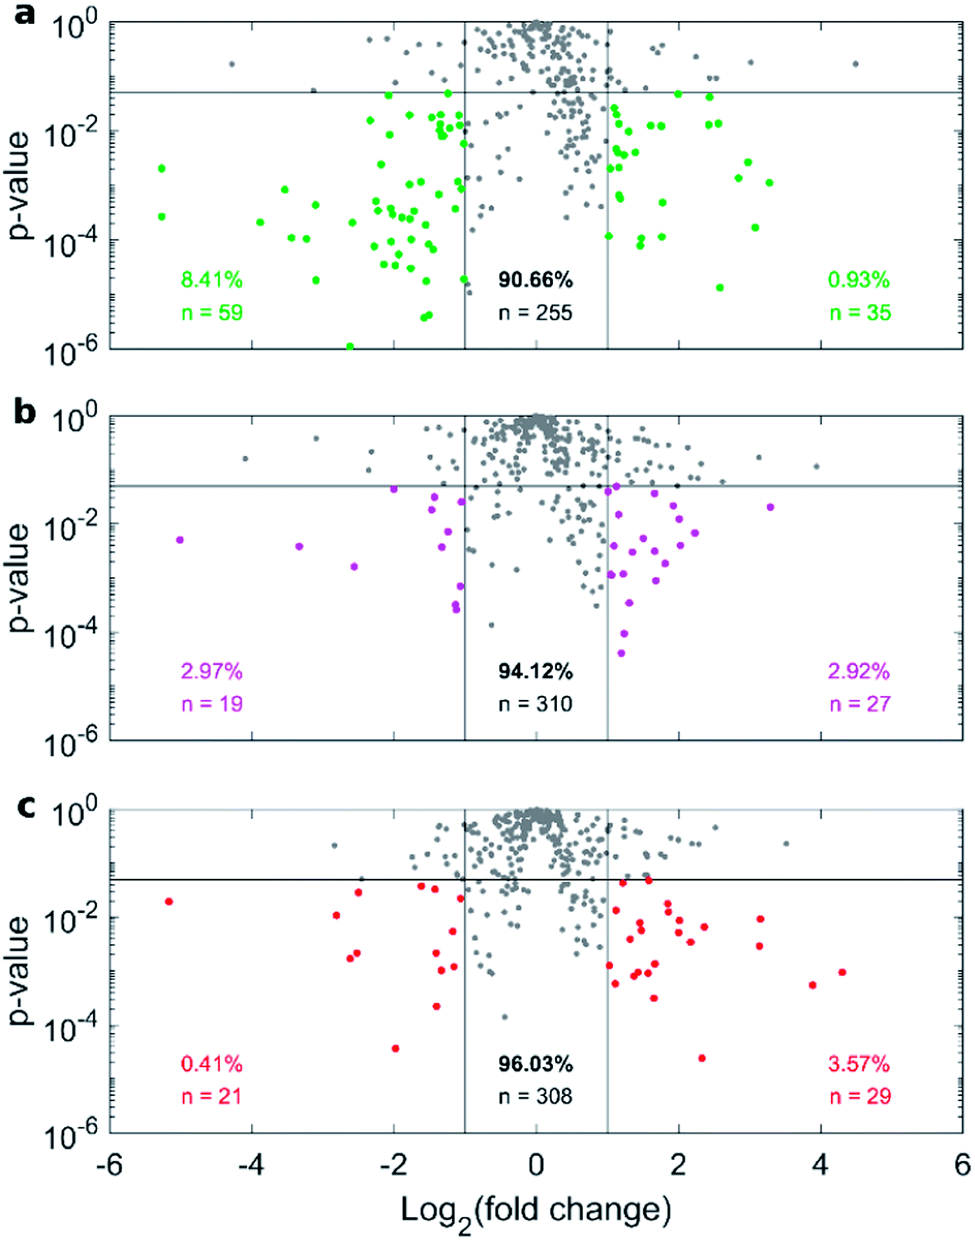 | ||
| Fig. 5 Nano liquid chromatography tandem mass spectrometry (nano LC-MS/MS) experiments. Volcano plots depicting the RPA-ratio between the two explored centrifugation conditions (i.e. total volume 50 μL, 60 min centrifugation time and total volume 200 μL and 15 min centrifugation time) as logarithmic fold change, vs. the corresponding p-value from Student's t test, for (a) DOTAP:DOPE liposomes, (b) PEGylated liposome and (c) PEGylated lipoplex. Proteins exhibiting relevant differences (p < 0.05 and |log2(fold change)| > 1) are indicated as colored dots, their cumulative RPA and total number are reported within the corresponding outer regions. Cumulative RPA and total number of proteins with similar abundances between the explored conditions (i.e. p ≥ 0.05 or |log2(fold change)| ≤ 1, grey dots) are reported in the central region. | ||
As recently pointed out experimental methods commonly used to isolate liposomes from biological fluids may be susceptible to protein contamination arising from unbound proteins and biological NPs.48 This could be caused by overlooked technical reasons and could help to rationalize data of different laboratories. It has been also postulated that different types of biological NPs present in human blood such as extracellular vesicles (EV) and lipoproteins need be properly considered in research field of bio–nano interactions. Fig. 6a shows a representative SDS–PAGE outcome of proteins isolated from liposome-free human plasma (indicated as “HP”) and liposomal samples (total volume 50 μL) isolated from DOTAP–DOPE 3:1 (mol mol−1), DOTAP–DOPE 1:1 (mol mol−1), DOTAP–DOPE 1:3 (mol mol−1), PEGylated DOTAP–DOPE 1:1 (mol mol−1) and PEGylated lipoplex, after 60 min centrifugation. Other two combinations of sample volumes and centrifugation times were studied, and results are reported in the ESI (Fig. S7 and S8†).
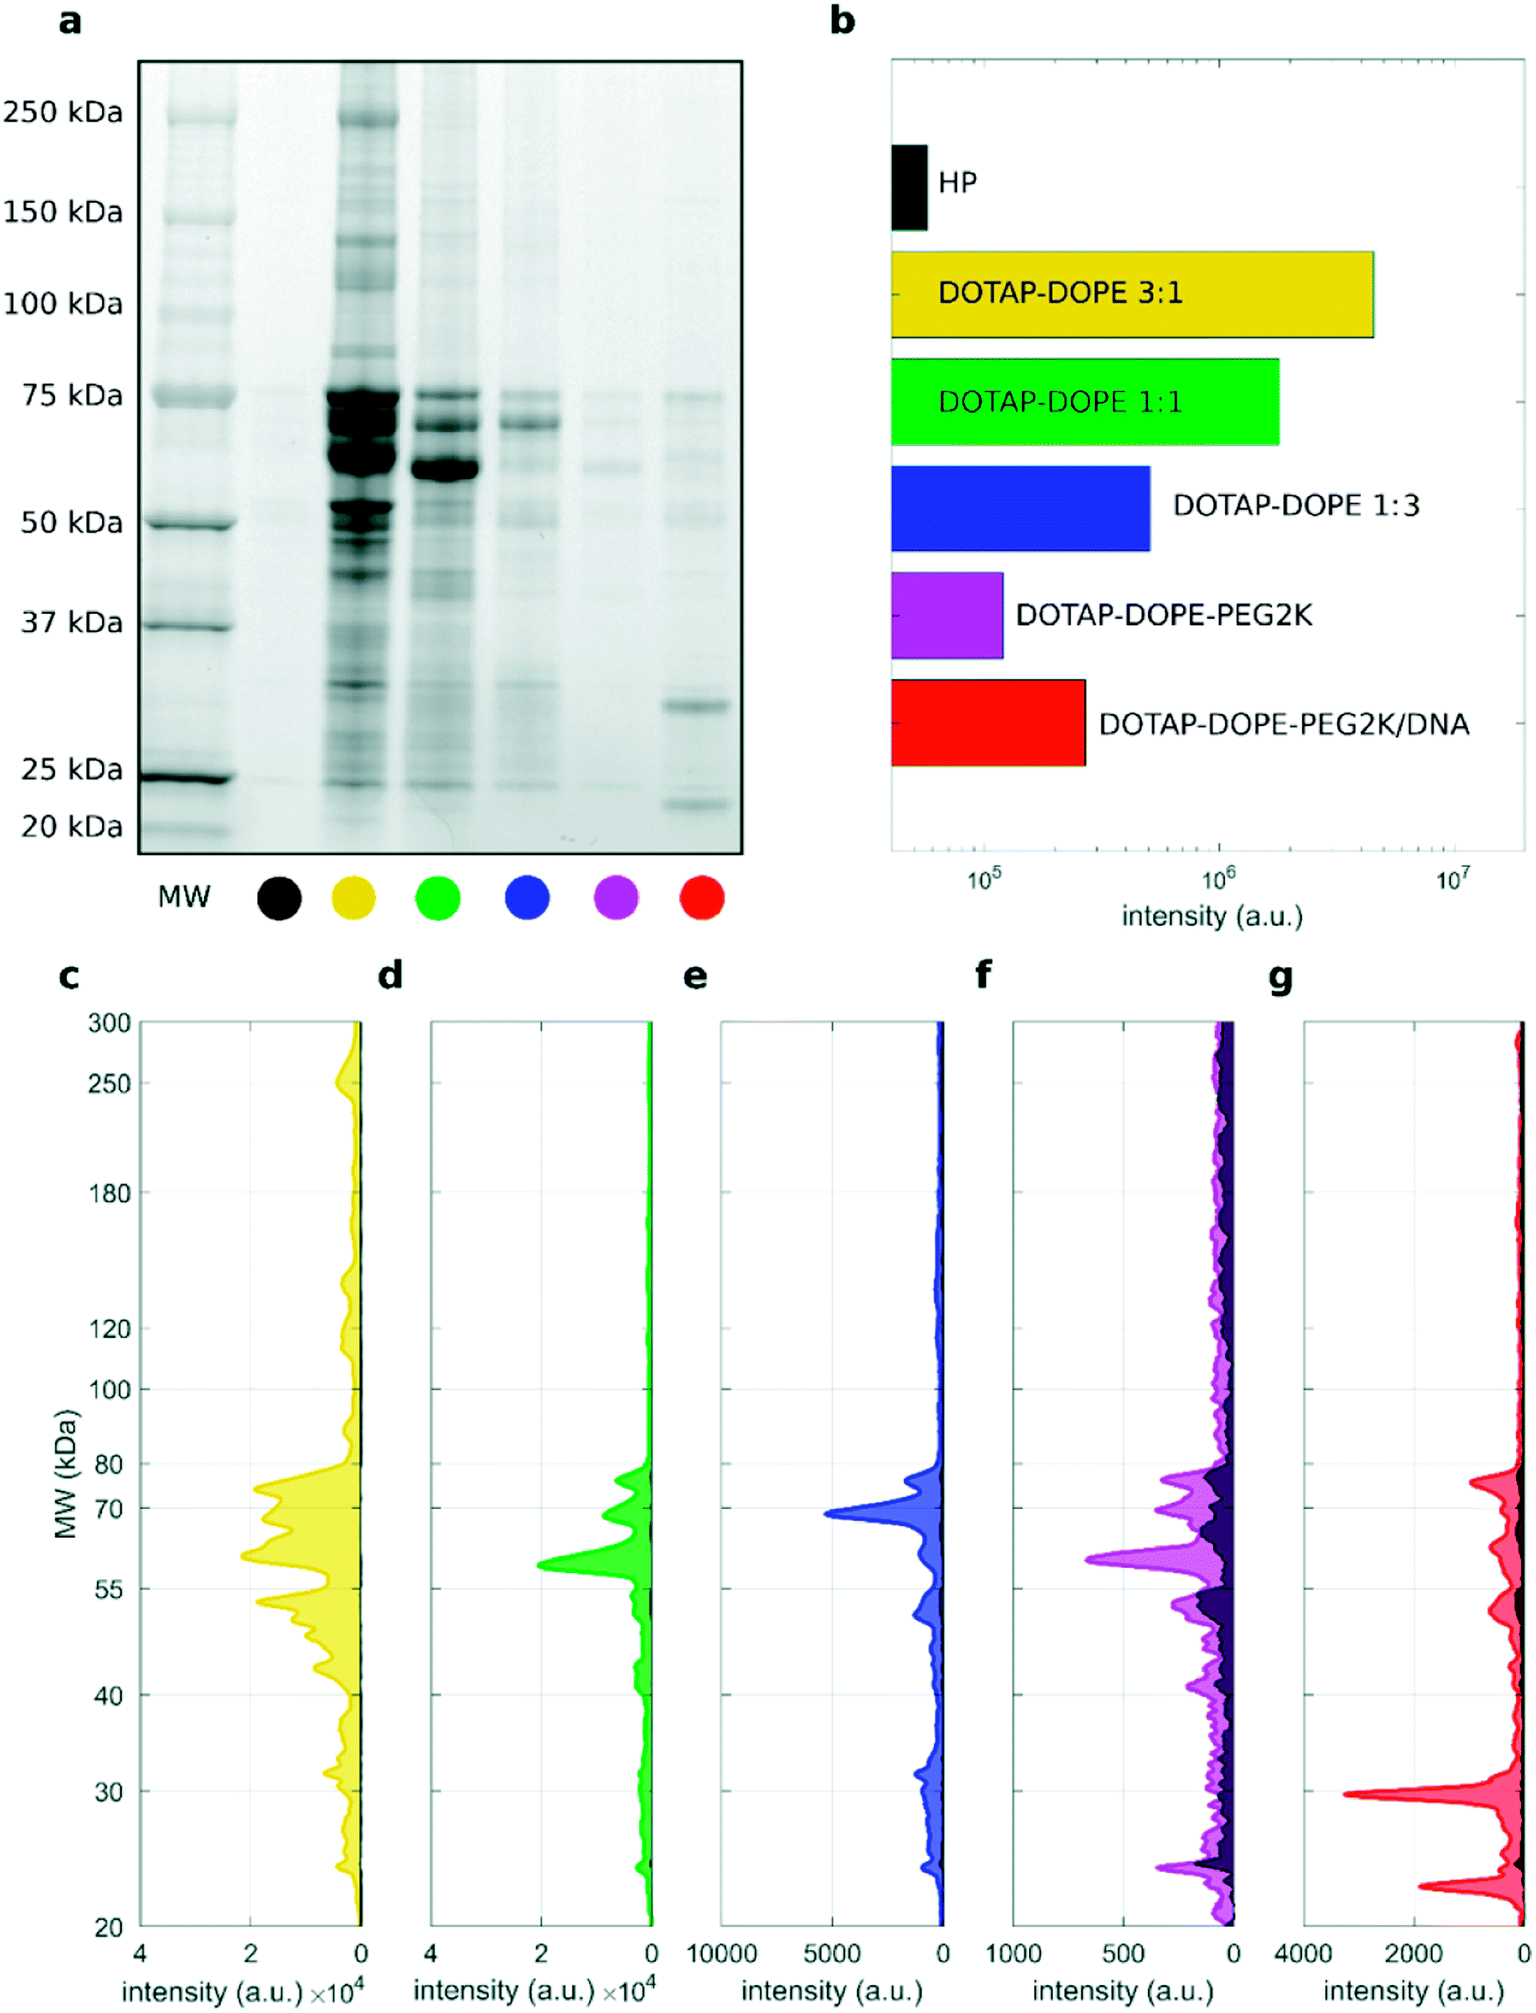 | ||
| Fig. 6 (a) 1D SDS–PAGE image of PC for human plasma (HP) and liposomal formulations upon incubation with HP (50% vol), total volume = 50 μL and centrifugation time = 60 min. (b) Total lane intensity for each lane. (c–g) Corresponding absolute intensity profiles for the liposomal formulations, whereas the absolute profile of HP is superimposed as black shaded area. | ||
These three combinations of total sample volume and centrifugations time were chosen as they represent the conditions leading to highest (total volume 50 μL and 60 min centrifugation time), intermediate (total volume 50 μL and 15 min centrifugation time) and lowest (total volume 200 μL and 15 min centrifugation time) pelleting capacity. As a representative example of the comparison between the protein patterns of the investigated samples and the HP reference, we provide the corresponding absolute total lane intensity (Fig. 6b) and intensity profiles (Fig. 6c–g). The absolute profile of HP is superimposed to those of liposomal formulations as a black shaded area, in each panel. The gel image and the corresponding densitometric analysis indicate that the protein content of the “HP blank” sample (black shaded area) is negligible with respect to that truly associated to cationic unPEGylated liposomes and to PEGylated lipoplexes (Fig. 6c–e and g). These results are a direct evidence that the centrifugation-based isolation method resulted in minor, if any, contamination by unbound proteins and protein aggregates. However, the “HP blank” signal represented a small but considerable fraction of the protein patterns for non-loaded PEGylated liposomes (Fig. 6f). This is likely due to the lower recovery capacity by centrifugation for PEGylated liposomes than that achieved for the other systems (lipid recovery rates for PEGylated liposomes after centrifugation under all the studied conditions are reported in Fig. S9†). As a consequence, the HP baseline signal contributes more to the PC pattern. Adjusting the centrifugation protocol to enhance the recovery rates for PEGylated liposomes would be necessary to reduce the effects of plasma contamination and assess more accurately the PC composition. These trends are confirmed also for the other explored centrifugation conditions: total volume 50 μL, centrifugation time 15 min, and total volume 200 μL, centrifugation time 15 min (Fig. S7 and S8,† respectively).
Conclusions
The liposome–protein corona is rapidly emerging as a key bio-entity with implications in several research fields spanning from targeted drug delivery to early cancer detection. As a consequence, establishing a best practice approach is a mandatory step to increase reproducibility of data and consistency among laboratories. In this study, through performing a carefully designed isolation of liposome–protein complexes, we demonstrated that the total amount of pelleted complexes and the contamination from biological NPs may change with the key factors that have an influence on centrifugation, but the corona composition is mainly dependent on the liposomes' synthetic identity and the protein source. Additionally, with the ongoing accumulation of knowledge in this area, we provided valuable references for researchers working in this area, especially when comparison of distinct coronas is a crucial step. Reviewing the literature and the concerns associated with other isolation methods, centrifugation should be the technique of choice for studies on the liposome–protein corona. Although evaluating the role of centrifuge speed falls beyond the scope of the present investigation, it was possible to demonstrate that decreasing centrifuge speed reduces the ability of isolating liposome–protein complexes by centrifugation (Fig. S10 in the ESI†) with minor effect, if any, on protein corona composition. A systematic evaluation of this effect will be the subject of future studies. Finally, we would like to emphasize that for robust reproducibility of protein–liposome complexes, other influential factors, summarized in ref. 49–51 (e.g., the role of protein source and spectrum of disease, that the donors may have) should be considered in detail.Experimental details
Preparation of liposome and lipoplexes
Cationic 1,2-dioleoyl-3-trimethylammonium-propane (DOTAP), neutral 1,2-dioleoyl-sn-glycero-3-phosphoethanolamine (DOPE) and 1,2-distearoyl-sn-glycero-3-phosphoethanolamine-N-[methoxy(polyethylene glycol)-2000] (DOPE-PEG2k) were purchased from Avanti Polar Lipids (Alabaster, AL). Texas Red™ 1,2-dihexadecanoyl-sn-glycero-3-phosphoethanolamine (Texas Red™ DHPE) was purchased from Thermo Fischer Scientific (USA). Lipid mixtures were obtained to prepare different liposomes, according to Table S1.† Each of the liposomal formulations was synthesized with addition of Texas Red™ DHPE (fluorescent lipid/total lipid = 4/1000 mol mol−1). Then, each mixture was dissolved in chloroform, and the solvent was evaporated under vacuum for 2 h. Lipid films were hydrated with ultrapure water to a final lipid concentration of 1 mg mL−1 and finally extruded 20 times through a 0.1 μm polycarbonate filter with the Avanti Mini-Extruder (Avanti Polar Lipids, Alabaster, AL).Incubation with human plasma and protein corona isolation
Human plasma (HP) was purchased from Sigma Aldrich (St. Louis, MI, USA). Plasma powder was reconstituted to indicated volume on label with Milli-Q® H2O (Merck, USA). Liposome–protein complexes (and lipoplexes–protein complexes) were prepared by incubating the appropriate amount of the liposomal formulations with HP at 37 °C for 1 hour at the following HP concentrations: 5%, 50%, and 80% (% vol). To study potential effects of the isolation protocols on the resulting protein corona, the protein corona of liposomes and lipoplexes was isolated by centrifuging different sample total volumes (i.e. 50 μL, 100 μL and 200 μL), for different times (i.e. 15 min and 60 min), at 4 °C, and 21400g. Pellets were then washed three times with PBS to remove unbound and loosely bound proteins (the “soft corona”) and finally obtain the so-called “hard corona”.
Fluorescence measurements
Lipid concentration in the supernatants, after protein corona isolation by centrifugation, was assessed by fluorescence measurements with a GloMax plate reader (Promega, USA), excitation wavelength = 520 nm and emission filter 580–640 nm. For each of the explored conditions of sample volume, a calibration curve was preliminary traced and then used to relate the measured fluorescence intensity to the unknown lipid concentration in the sample.1D SDS–PAGE experiments
After corona isolation by centrifugation, liposome–protein complexes and lipoplex–protein complexes were resuspended in 20 μL of Laemmli Loading buffer 1× and boiled for 10 min at 100 °C. Each sample was loaded on a gradient polyacrylamide gel stain free (4–20% TGX precast gels, BioRad) and run at 100 V for about 150 min. Finally, gel images were acquired with a ChemiDoc™ gel imaging system (Bio-Rad, CA, USA) and processed by means of custom MatLab scripts (MathWorks, Natick, MA, USA).The image processing procedure aims to evaluate the one-dimensional intensity distribution function of each sample, to obtain the corresponding one-dimensional molecular weight (MW) distribution. It is developed as follows. (i) On each of the gel images, background was preliminary removed to prevent unwanted baselines affect the resulting curves. (ii) The sampled intensity of the original image was converted into a new two-variable function where the vertical displacement was related to protein MWs (ladder lanes) and the intensity value was proportional to the detected protein amount. (iii) The projection of the two-variable function over a plane orthogonal to the image represented the absolute intensity profile of the generic lane. (iv) That intensity profile was finally normalized to 1 to obtain the corresponding protein pattern. Step (iii) and step (iv) were repeated for each lane of the studied gel. Further details can be found elsewhere.52
Nano liquid chromatography tandem mass spectrometry (nano LC-MS/MS) experiments
All chemicals, reagents and organic solvents of the highest grade available were purchased from Sigma-Aldrich (St. Louis, MO, USA) unless otherwise stated. Trifluoroacetic acid (TFA) was supplied by Romil Ltd (Cambridge). Mass grade water and acetonitrile were purchased from VWR International (Milan, Italy). Bond elut C18 EWP cartridges (50 mg) were purchased from Agilent (Santa Clara, USA). Trypsin was provided by Promega (Madison, WI, USA).Shotgun proteomics sample preparation
Protein pellets were prepared as previously described.53 Briefly, they were dissolved in 50 μL of 8 mol L−1 urea in 50 mmol tris(hydroxymethyl)aminomethane hydrochloride (Tris–HCl) buffer (pH = 7.8). After complete solubilisation, protein samples were reduced with 2 μL of 200 mmol L−1 dithiothreitol for 1 h at 37 °C and alkylated with 8 μL of 200 mmol L−1 2-iodoacetamide for 1 h in the dark at room temperature. The alkylation was quenched with further 8 μL of 200 mmol L−1 dithiothreitol. The urea concentration was then diluted to 1 mol L−1 with 50 mmol L−1 Tris–HCl buffer (pH = 7.8) before overnight tryptic digestion with 2 μg of trypsin at 37 °C. The enzymatic reaction was stopped by adding TFA to reach pH 2.5. The resulting peptide mixtures were purified by solid-phase extraction on Bond elut C18 EWP cartridges, evaporated to dryness and dissolved in 100 μL of 0.1% formic acid.Shotgun proteomics analysis
Peptide samples were analysed by nanoHPLC-MS/MS as previously described (La Barbera et al., Analytical and Bioanalytical Chemistry, 410(3), 1177–1185), on a Ultimate 3000 nanoHPLC system coupled to Orbitrap Elite (Thermo Scientific). The same configuration described previously was used for peptide on-line enrichment, separation and MS/MS acquisition, in the range 380–2000 m/z. Briefly, samples (20 μL) were injected and on-line preconcentrated on a 300 μm i.d. × 5 mm Acclaim PepMap 100 C18 μ-column (Thermo Scientific) using water/acetonitrile, 99:1 (v/v) containing 0.1% (v/v) TFA at a flow rate of 10 μL min−1. Peptides were then separated on an EASY-Spray column (50 cm × 75 μm i.d. PepMap C18, 2 μm particles, 100 Å pore size; Thermo Scientific) at 200 nL min−1 and at 40 °C. A 166 min-long multistep gradient was used for peptide separation, using water (phase A) and acetonitrile (phase B) both with 0.1% formic, as follows: 1% B for 5 min; 1–5% B in 2 min; 5–35% B in 90 min. The column was then washed at 90% B for 20 min and equilibrated at 1% B for 45 min. Full scan spectra were acquired at 30000 resolution (full width at half maximum at m/z 400) and MS/MS spectra were acquired in top 10 data-dependent mode at 15000 resolution rejecting singly and unassigned charge states and fragmenting precursor ions by higher-energy collisional dissociation with 35% normalized collision energy, isolation window of 2 m/z, and dynamic exclusion (repeat count of 1, repeat duration of 30 s, exclusion duration of 70 s). For each sample, three technical replicates were performed.
The acquired raw MS/MS data files from Xcalibur software (version 2.2 SP1.48, Thermo Fisher Scientific) were searched against Swiss-Prot human database by MaxQuant search engine, (v1.6.3.4)54 with the automatic setting for tryptic label free analysis. Fully tryptic digestion mode with maximum of two missed cleavages, multiplicity 1, minimum length of six amino acids and peptide tolerance of 20 ppm in first search and 4.5 ppm in the main search were set. For the modifications we set carbamidomethylation on cysteine as fixed, oxidation of methionine, acetylation of protein N-termini, and deamidation of glutamine and asparagine as variable. Recalibration and match between runs (with automatic settings) was enabled; protein identification were accepted with at least one unique + razor peptides for protein group and false discovery rate was set at 0.01 for peptide-spectrum matches, peptides and proteins identifications.
For data analysis, we used the raw intensity from MaxQuant output “proteinGroups.txt”. First, we deleted entries belonging to reverse, only identified by site and Contaminants (only the hit not deriving from the Human fasta file). Then the intensity of each protein was divided by its mass in Dalton and subsequently normalized to the sum of all the intensities of the same file; the normalized numbers were then used for the next analysis and graphs.
Author contributions
Conceptualization: L. D., D. P., G. C.; Data curation: F. G., L. D., S. P., C. M. M.; Formal analysis: R. Z. C., L. D.; Funding acquisition: D. P., G. C.; Investigation: F. G., L. D., S. P., C. M. M.; Project administration: A. L., A. L. C., M. M., D. P., G. C.; Resources: A. L., A. L. C., D. P., G. C.; Software: L. D., R. Z. C., Supervision: A. L., A. L. C., M. M., D. P., G. C.; Validation: F. G., S. P., C. M. M.; Visualization: L. D., F. G.; Writing—original draft: L. D., F. G., G. C.; Writing—review and editing: L. D., F. G., M. M., P. D., G. C. All authors have read and agreed to the published version of the manuscript.Funding sources
The research leading to these results has received funding from AIRC under IG 2017 – ID. 20327 project – P. I. Giulio Caracciolo. Luca Digiacomo is a recipient of a FIRC/AIRC fellowship (ID 24143; 2019).Conflicts of interest
There are no conflicts to declare.Acknowledgements
AIRC Foundation is gratefully acknowledged for supporting research.References
- J. Liu, R. Zhang and Z. P. Xu, Small, 2019, 1900262 CrossRef.
- C. D. Walkey and W. C. W. Chan, Chem. Soc. Rev., 2012, 41, 2780–2799 RSC.
- G. Caracciolo, O. C. Farokhzad and M. Mahmoudi, Trends Biotechnol., 2017, 35, 257–264 CrossRef CAS.
- T. Cedervall, I. Lynch, S. Lindman, T. Berggård, E. Thulin, H. Nilsson, K. A. Dawson and S. Linse, Proc. Natl. Acad. Sci. U. S. A., 2007, 104, 2050–2055 CrossRef CAS.
- M. Lundqvist, J. Stigler, G. Elia, I. Lynch, T. Cedervall and K. A. Dawson, Proc. Natl. Acad. Sci. U. S. A., 2008, 105, 14265–14270 CrossRef CAS PubMed.
- T. Cedervall, I. Lynch, M. Foy, T. Berggård, S. C. Donnelly, G. Cagney, S. Linse and K. A. Dawson, Angew. Chem., Int. Ed., 2007, 46, 5754–5756 CrossRef CAS.
- F. Bonté and R. Juliano, Chem. Phys. Lipids, 1986, 40, 359–372 CrossRef.
- A. Chonn, S. Semple and P. Cullis, J. Biol. Chem., 1992, 267, 18759–18765 CrossRef CAS.
- M. Lück, B. R. Paulke, W. Schröder, T. Blunk and R. Müller, J. Biomed. Mater. Res., 1998, 39, 478–485 CrossRef.
- S. M. Moghimi and J. Szebeni, Prog. Lipid Res., 2003, 42, 463–478 CrossRef CAS.
- M. Lundqvist, I. Sethson and B.-H. Jonsson, Langmuir, 2004, 20, 10639–10647 CrossRef CAS PubMed.
- C. Salvador-Morales, E. Flahaut, E. Sim, J. Sloan, M. L. H. Green and R. B. Sim, Mol. Immunol., 2006, 43, 193–201 CrossRef CAS PubMed.
- A. Lesniak, A. Salvati, M. J. Santos-Martinez, M. W. Radomski, K. A. Dawson and C. Åberg, J. Am. Chem. Soc., 2013, 135, 1438–1444 CrossRef CAS PubMed.
- M. Bramini, D. Ye, A. Hallerbach, M. Nic Raghnaill, A. Salvati, C. Åberg and K. A. Dawson, ACS Nano, 2014, 8, 4304–4312 CrossRef CAS PubMed.
- L. Digiacomo, F. Cardarelli, D. Pozzi, S. Palchetti, M. Digman, E. Gratton, A. Capriotti, M. Mahmoudi and G. Caracciolo, Nanoscale, 2017, 9, 17254–17262 RSC.
- L. Digiacomo, D. Pozzi, S. Palchetti, A. Zingoni and G. Caracciolo, Wiley Interdiscip. Rev.: Nanomed. Nanobiotechnol., 2020, 12, e1615 RSC.
- M. Teixeira, C. Carbone and E. Souto, Prog. Lipid Res., 2017, 68, 1–11 CrossRef CAS PubMed.
- L. Belfiore, D. N. Saunders, M. Ranson, K. J. Thurecht, G. Storm and K. L. Vine, J. Controlled Release, 2018, 1–13 CrossRef CAS PubMed.
- M. S. Webb and B. R. Green, Biochim. Biophys. Acta, Bioenerg., 1991, 1060, 133–158 CrossRef CAS.
- D. Simberg, S. Weisman, Y. Talmon and Y. Barenholz, Crit. Rev. Ther. Drug Carrier Syst., 2004, 21, 62 CrossRef PubMed.
- G. Caracciolo, Nanomedicine, 2015, 11, 543–557 CrossRef CAS PubMed.
- G. Caracciolo, D. Pozzi, A. Capriotti, C. Cavaliere, S. Piovesana, H. Amenitsch and A. Laganà, RSC Adv., 2015, 5, 5967–5975 RSC.
- M. Hadjidemetriou, Z. Al-Ahmady, M. Mazza, R. F. Collins, K. Dawson and K. Kostarelos, ACS Nano, 2015, 9, 8142–8156 CrossRef CAS PubMed.
- M. Hadjidemetriou, Z. Al-Ahmady and K. Kostarelos, Nanoscale, 2016, 8, 6948–6957 RSC.
- D. Chen, N. Parayath, S. Ganesh, W. Wang and M. Amiji, Nanoscale, 2019, 11(40), 18806–18824 RSC.
- F. Giulimondi, L. Digiacomo, D. Pozzi, S. Palchetti, E. Vulpis, A. L. Capriotti, R. Z. Chiozzi, A. Laganà, H. Amenitsch and L. Masuelli, Nat. Commun., 2019, 10, 1–11 CrossRef PubMed.
- M. Hadjidemetriou, Z. Al-Ahmady, M. Buggio, J. Swift and K. Kostarelos, Biomaterials, 2019, 188, 118–129 CrossRef CAS PubMed.
- M. Hadjidemetriou, S. McAdam, G. Garner, C. Thackeray, D. Knight, D. Smith, Z. Al-Ahmady, M. Mazza, J. Rogan, A. Clamp and K. Kostarelos, Adv. Mater., 2019, 31, 1803335 CrossRef PubMed.
- A. L. Capriotti, G. Caracciolo, C. Cavaliere, V. Colapicchioni, S. Piovesana, D. Pozzi and A. Laganà, Chromatographia, 2014, 77, 755–769 CrossRef CAS.
- G. Cinar, C. Englert, U. S. Schubert and I. Nischang, Nanoscale, 2020, 12, 22462–22466 RSC.
- L. Böhmert, L. Voß, V. Stock, A. Braeuning, A. Lampen and H. Sieg, Nanoscale Adv., 2020, 2, 563–582 RSC.
- K. Kristensen, T. B. Engel, A. Stensballe, J. B. Simonsen and T. L. Andresen, J. Controlled Release, 2019, 307, 1–15 CrossRef CAS PubMed.
- A. J. Chetwynd, K. E. Wheeler and I. Lynch, Nano Today, 2019, 28, 100758 CrossRef CAS PubMed.
- D. Pozzi, G. Caracciolo, R. Caminiti, S. C. De Sanctis, H. Amenitsch, C. Marchini, M. Montani and A. Amici, ACS Appl. Mater. Interfaces, 2009, 1, 2237–2249 CrossRef CAS PubMed.
- S.-S. Kim, A. Rait, E. Kim, J. DeMarco, K. F. Pirollo and E. H. Chang, Cancer Lett., 2015, 369, 250–258 CrossRef CAS PubMed.
- S. Palchetti, D. Pozzi, A. L. Capriotti, G. La Barbera, R. Z. Chiozzi, L. Digiacomo, G. Peruzzi, G. Caracciolo and A. Laganà, Colloids Surf., B, 2017, 153, 263–271 CrossRef CAS PubMed.
- M. Faria, M. Björnmalm, K. J. Thurecht, S. J. Kent, R. G. Parton, M. Kavallaris, A. P. Johnston, J. J. Gooding, S. R. Corrie and B. J. Boyd, Nat. Nanotechnol., 2018, 13, 777 CrossRef CAS PubMed.
- G. Caracciolo, D. Pozzi, A. L. Capriotti, C. Cavaliere, S. Piovesana, H. Amenitsch and A. Laganà, RSC Adv., 2015, 5, 5967–5975 RSC.
- D. Pozzi, V. Colapicchioni, G. Caracciolo, S. Piovesana, A. L. Capriotti, S. Palchetti, S. De Grossi, A. Riccioli, H. Amenitsch and A. Laganà, Nanoscale, 2014, 6, 2782–2792 RSC.
- A. L. Barrán-Berdón, D. Pozzi, G. Caracciolo, A. L. Capriotti, G. Caruso, C. Cavaliere, A. Riccioli, S. Palchetti and A. Laganaì, Langmuir, 2013, 29, 6485–6494 CrossRef PubMed.
- G. Caracciolo, D. Caputo, D. Pozzi, V. Colapicchioni and R. Coppola, Colloids Surf., B, 2014, 123, 673–678 CrossRef CAS PubMed.
- G. Caracciolo, D. Pozzi, A. L. Capriotti, C. Cavaliere, S. Piovesana, G. La Barbera, A. Amici and A. Laganà, J. Mater. Chem. B, 2014, 2, 7419–7428 RSC.
- G. Caracciolo, D. Pozzi, A. L. Capriotti, C. Cavaliere, P. Foglia, H. Amenitsch and A. Laganà, Langmuir, 2011, 27, 15048–15053 CrossRef CAS PubMed.
- I. Koltover, T. Salditt and C. Safinya, Biophys. J., 1999, 77, 915–924 CrossRef CAS.
- C.-K. Chen, P.-K. Huang, W.-C. Law, C.-H. Chu, N.-T. Chen and L.-W. Lo, Int. J. Nanomed., 2020, 15, 2131 CrossRef CAS PubMed.
- A. L. Capriotti, G. Caracciolo, G. Caruso, P. Foglia, D. Pozzi, R. Samperi and A. Laganà, Proteomics, 2011, 11, 3349–3358 CrossRef CAS PubMed.
- J.-S. Zhang, F. Liu, C. C. Conwell, Y. Tan and L. Huang, Mol. Ther., 2006, 13, 429–437 CrossRef CAS.
- J. B. Simonsen and R. Münter, Angew. Chem., Int. Ed., 2020, 12584–12588 CrossRef CAS PubMed.
- M. Mahmoudi, Trends Biotechnol., 2018, 36, 755–769 CrossRef CAS PubMed.
- S. Laurent, C. Burtea, C. Thirifays, F. Rezaee and M. Mahmoudi, J. Colloid Interface Sci., 2013, 392, 431–445 CrossRef CAS PubMed.
- M. J. Hajipour, S. Laurent, A. Aghaie, F. Rezaee and M. Mahmoudi, Biomater. Sci., 2014, 2, 1210–1221 RSC.
- L. Digiacomo, S. Palchetti, F. Giulimondi, D. Pozzi, R. Zenezini Chiozzi, A. L. Capriotti, A. Laganà and G. Caracciolo, Lab Chip, 2019, 19(15), 2557–2567 RSC.
- G. Caracciolo, R. Safavi-Sohi, R. Malekzadeh, H. Poustchi, M. Vasighi, R. Zenezini Chiozzi, A. L. Capriotti, A. Laganà, M. Hajipour, M. Di Domenico, A. Di Carlo, D. Caputo, H. Aghaverdi, M. Papi, V. Palmieri, A. Santoni, S. Palchetti, L. Digiacomo, D. Pozzi, K. S. Suslick and M. Mahmoudi, Nanoscale Horiz., 2019, 4(5), 1063–1076 RSC.
- S. Tyanova, T. Temu and J. Cox, Nat. Protoc., 2016, 11, 2301–2319 CrossRef CAS PubMed.
Footnotes |
| † Electronic supplementary information (ESI) available. See DOI: 10.1039/d1na00211b |
| ‡ Equal contribution. |
| This journal is © The Royal Society of Chemistry 2021 |