 Open Access Article
Creative Commons Attribution 3.0 Unported Licence
Kinetic and mechanistic analysis of NH3 decomposition on Ru(0001), Ru(111) and Ir(111) surfaces†
Xiuyuan
Lu
a,
Jing
Zhang
ab,
Wen-Kai
Chen
 b and
Alberto
Roldan
 *a
*a
aCardiff Catalysis Institute, School of Chemistry, Cardiff University, Main Building, Park Place, Cardiff, CF10 3AT, UK. E-mail: roldanmartineza@cardiff.ac.uk
bCollege of Chemistry, Fuzhou University, Fuzhou, Fujian 350116, China
First published on 9th February 2021
Abstract
We investigated the catalytic NH3 decomposition on Ru and Ir metal surfaces using density functional theory. The reaction mechanisms were unraveled on both metals, considering that, on the nano-scale, Ru particles may also present an fcc structure, hence, leading to three energy profiles. We implemented thermodynamic and kinetic parameters obtained from DFT into microkinetic simulations. Batch reactor simulations suggest that hydrogen generation starts at 400 K, 425 K and 600 K on Ru(111), Ru(0001) and Ir(111) surfaces, respectively, in excellent agreement with experiments. During the reaction, the main surface species on Ru are NH, N and H, whereas on Ir(111), it is mainly NH. The rate-determining step for all surfaces is the formation of molecular nitrogen. We also performed temperature-programmed reaction simulations and inspected the desorption spectra of N2 and H2 as a function of temperature, which highlighted the importance of N coverage on the desorption rate.
1. Introduction
Current environmental concerns are drawing the attention of all communities to exploit resources with low or even zero carbon emission.1 Molecular hydrogen is recognized as an energy vector to drive sustainable growth; nevertheless, it presents high risks and cost associated with its transport and storage.2 Alternatively, ammonia (NH3) is a suitable carbon-free molecule to store H2, as its decomposition produces only H2 and N2.3,4 It is easy to transport and store as it is liquid at room temperature under low pressure. Every year, around 150 million tons of NH3 is synthesized and traded around the world.5 Indeed, the high hydrogen content of NH3 (17.64 wt%) makes it more attractive than bulk commodities such as methanol (12.50 wt%), ethanol (13.04 wt%), formic acid (4.35 wt%) and acetic acid (6.66 wt%). Although the decomposition of NH3 is an endothermic process, the oxidation of the produced H2 (as fuels) is highly exothermic, making this reaction worthwhile.6 The presence of a catalyst can facilitate the NH3 decomposition, and therefore, detailed investigations on mechanisms and their limitations are of paramount importance to develop selective and efficient catalysts.Extensive studies have shed light on the ammonia decomposition mechanisms on various metals, such as Fe,7–9 Ni,10–13 Co,14,15 Cu(111),16 Pd(111),17 Pt,18 Rh(111),19 Ru(0001)20–27 and Ir.28–32 Boisen employed a model describing the catalytic trends over transition metal catalysts and found Ru to be the most active metal for this reaction.33 Egawa et al. investigated the desorption and kinetic process of NH3 decomposition on Ru surfaces using electron spectroscopy and diffraction techniques.34 They observed that the reaction takes place from 400 K reaching an equilibrium of H2 and NH3 in the gas phase at around 500 K, while the formation rate of N2 peaks at 570 K according to the thermal-desorption spectra. Mortensen et al. applied supersonic molecular beam techniques to study the dissociation of ammonia also on the Ru(0001) surface and proposed a mechanism dominated by the diffusion of intermediate species.35 The fcc structure of Ru also plays a crucial role in the hydrogen evolution reaction. Hanyu et al. described the compensation effect on 2 nm fcc Ru supported nanoparticles, where the turnover frequency (TOF) for ammonia borane hydrolysis reached 0.72 mol m−2 h−1 (more than 90% of the theoretical value) at 15 °C.36
Although Ru shows good activity for catalyzing this process, its scarcity makes its large scale implementation prohibitive unless it is used as dispersed fine nanoparticles. On the other hand, the price of Ir is relatively low, and it is currently employed to decompose similar molecules (e.g. N2H4) as propeller fuel in spaceships.37 George et al. reported that Ir catalysts have several orders of magnitude higher activity to decompose NH3 than other transition metals such as Pd, Pt and Rh at 750 K.38 Santra et al. carried out a temperature-programmed reaction study on Ir(100) and found that the associative nitrogen desorption is the crucial step for continuous and efficient ammonia decomposition.29 Huang et al. arrived at the same conclusion using computational methods on Ir(111) and Ir(110).31 They also suggested that the competition between desorption and dissociation can be tuned via the control of pressure and temperature during the reaction.
In order to develop more efficient catalysts, many experimental studies of ammonia decomposition on Ru and Ir catalysts focused on the relationship between the composition and atomicity of catalysts and product yields. Both temporal analysis of products (TAP)39,40 and steady-state isotopic transient kinetic analysis (SSITKA)41–43 can be applied to study the characteristics of the active sites and provide information on the adsorptions and reactions. García et al. carried out multi-pulse TAP experiments to understand the main mechanistic features involved in the catalytic decomposition of NH3 over carbon-supported Ru and Ir catalysts.32 The results suggested that the surface life-time of N species on the Ir surface is shorter than that on the Ru surface, leading to faster N2 desorption. John and co-workers found that NHx species are the primary surface intermediates in the temperature range from 623 K to 673 K (204 kPa) and adsorbate N is the most abundant intermediate from 623 K to 773 K using SSITKA.42 To date, a systematic and detailed comparison of the exact mechanism and microkinetic model for NH3 decomposition on Ru and Ir supported nanoparticles is scarce in the literature, especially including the model describing the Ru fcc surface, which is observed in the Ru nanoparticle size range of 2.0–5.5 nm.44
Due to the complexity and difficulty in observing the adsorbed reaction intermediates, many aspects concerning the reaction processes at the atomic level remain unclear. For this reason, we have performed a density functional theory (DFT) investigation providing accurate information on all reaction species during ammonia decomposition on hcp Ru(0001), fcc Ru(111) and fcc Ir(111) and make a comparison with former data. We extended these results with microkinetic simulations, including batch reactor and temperature-programmed desorption simulations, hence, providing rates and selectivity information as a function of the catalysts' nature and closing the gap between modelling and experiments.
2. Computational details
2.1 DFT calculations
We employed the Vienna Ab initio Simulation Package (VASP) to simulate the NH3 decomposition reactions on Ru (hcp and fcc) and Ir metal catalysts.45,46 The spin-polarized revised Perdew–Burke–Ernzerhof (rPBE) method of the generalized gradient approximation (GGA) was adopted to describe the exchange–correlation with a plane-wave kinetic cutoff energy of 500 eV.47 Non-spherical contributions to atomic cores from the gradient corrections were represented by the projector augmented wave (PAW).48–50 The zero-damping DFT-D3 method was used to describe long-range interactions.51 The optimized convergence threshold of internal forces and electronic relaxation was set to 0.02 eV Å−1 and 10−5 eV, respectively. A 3 × 3 × 1 k-spacing Monkhorst–Pack grid sampled the Brillouin zone with a smearing broadening of 0.2 eV.The optimized bulk lattice parameters are shown in Table 1. All surfaces were represented by a p(4 × 4) supercell slab model with five atomic layers, where the top three layers were fully relaxed and the bottom two were fixed at the optimized bulk lattice. We added 15 Å of vacuum perpendicular to the slab to avoid any spurious interaction with periodic images. Dipole correction perpendicular to the surface was applied upon the adsorption of any species. The molecular adsorption energies are defined using eqn (1), and the relative energies along the energy profiles are calculated using eqn (2).
| Eads = Esystem − Esurface − Emolecule | (1) |
 | (2) |
The reaction energy (Er) is given by the energy difference of the final state (FS) and the initial state (IS) (eqn (3)). When the Er value is negative, it means an exothermic step. The transition states (TS) were determined using the climb-image nudged elastic band (ci-NEB) combined with the improved dimer method (IDM) and ensuring a unique imaginary frequency along the reaction coordinate.58–60 We defined the forward and reverse activation barriers (Ea) as the energy difference between the TS and IS and between the TS and FS, respectively (eqn (4) and (5)).
| Er = EFS − EIS | (3) |
| Eforwarda = ETS − EIS | (4) |
| Ereversea = ETS − EFS | (5) |
2.2 Microkinetic simulations
We constructed a kinetic model of the NH3 decomposition reaction based on a microcanonical ensemble within the transition state theory (TST) framework, which employs the Eyring and Evans and Polanyi approximation to compute the reaction constants of all surface elementary reactions (eqn (S24), (S26) and (S27) in the ESI†).61–63 Although the TST has weaknesses, it is widely used to provide useful information on the design of catalysts.64,65 Some of the TST weaknesses are that it assumes (i) no quantum tunnelling, (ii) the intermediates are long-lived to follow the Boltzmann distribution of energy, and (iii) all the species reaching the transition state evolve only to products. In the used model, the lateral adsorbate–adsorbate interactions are assumed to be negligible, i.e. low coverage, and mass transfer and diffusion do not limit the process kinetics. The partition functions to describe the thermodynamic properties as functions of temperature are listed in the ESI, eqn (S1)–(S12).† We have used numerical methods to solve the set of differential equations describing the relationship between the species, pressure and coverage, and time (listed in the ESI†).3. Results and discussion
3.1 Surface species
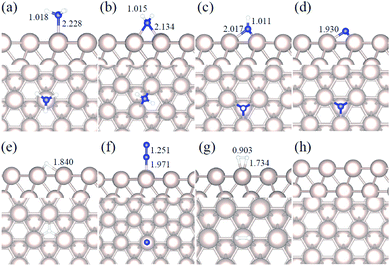
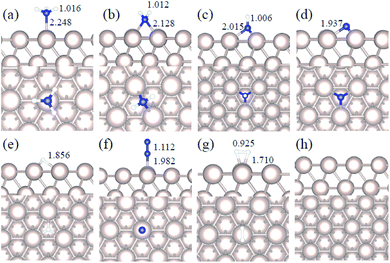
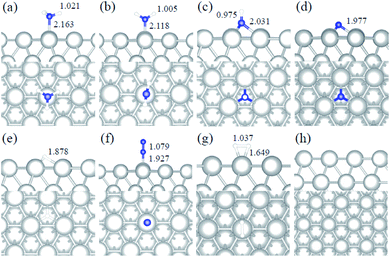
We studied all the non-equivalent adsorptions and configurations of surface species on Ru(0001), Ru(111) and Ir(111) in order to derive the reaction mechanism. Table 2 summarizes the most favorable adsorption properties of NHx (x = 1–3), and atomic and molecular hydrogen and nitrogen. The adsorption modes are presented in Fig. 1, 2 and 3, respectively, for Ru(0001), Ru(111) and Ir(111). To investigate adsorbate's electrostatic structure, density of states (DOS) study and Bader charge analysis were carried out.66 The interaction of N lone pair of electrons with the dz2 orbital of the metals dominates the NH3 adsorption, with a charge transfer of 0.13 and 0.23 e− from the Ru and Ir surface, respectively. The bond formation can also be observed at the projected density of states. The pz and dz2 orbitals of N and the metals nicely overlap (ESI Fig. S11–S13†), over a broader energy range on Ir than on Ru. The capacity of Ir to provide more electron density to the bond with N than Ru is able to stabilize the NH2 intermediate on the top site while on Ru it falls to a bridge position. These adsorption trends are consistent with experimental findings using the scanning tunnelling microscopy method.22| Species | Favorable site | E ads (eV) | E zpeads (eV) | d N–H (Å) | d TM–N (Å) | ||||||||||
|---|---|---|---|---|---|---|---|---|---|---|---|---|---|---|---|
| a | b | c | a | b | c | a | b | c | a | b | c | a | b | c | |
| NH3 | T | T | T | −0.98 | −0.88 | −1.19 | −0.94 | −0.84 | −1.13 | 1.018 | 1.016 | 1.021 | 2.228 | 2.248 | 2.163 |
| NH2 | B | B | T | −0.48 | −0.30 | −0.32 | −0.61 | −0.44 | −0.43 | 1.015 | 1.012 | 1.005 | 2.134 | 2.128 | 2.118 |
| NH | hcp | hcp | fcc | −0.46 | −0.24 | 0.09 | −0.76 | −0.53 | −0.19 | 1.011 | 1.006 | 0.975 | 2.017 | 2.015 | 2.031 |
| N | hcp | hcp | fcc | −0.85 | −0.84 | 0.11 | −0.83 | −0.82 | 0.11 | — | — | — | 1.930 | 1.937 | 1.977 |
| H | fcc | fcc | fcc | −0.56 | −0.41 | −0.33 | −0.53 | −0.39 | −0.34 | — | — | — | — | — | — |
| N2 | T | T | T | −0.06 | −0.55 | −0.38 | −0.01 | −0.50 | −0.31 | — | — | — | 1.971 | 1.982 | 1.927 |
| H2 | T | T | T | −0.40 | −0.35 | −0.36 | −0.35 | −0.28 | −0.32 | — | — | — | — | — | — |
Generally, ammonia decomposition intermediates over Ru(0001) and Ru(111) present very similar behavior, except that the adsorption of N2 on Ru(111) is more favorable, attributed to the meta-stability of the fcc phase.
Ir(111) has the strongest NH3 adsorption compared with the Ru surfaces as it favors the electron back-donation with the adsorbed species. Along with the dehydrogenation of ammonia, the coordination of N with metal atoms increases, i.e. the adsorption site changes from top to bridge to hollow, and the perpendicular distance between N atoms and the surface decreases. These findings indicate that the interaction of N atoms with surfaces is strengthened with each dehydrogenation.
3.2 Reaction thermochemistry
We calculated the reaction energies (ΔGr) (Fig. 4) and the activation energies (ΔGa) as a function of temperature (Fig. 5) for each reaction step in the ammonia dehydrogenation (R1, R3 and R5 in Table 3) and in the N2 and H2 formations (R7 and R9 in Table 3). NH3 decomposition is thermodynamically favorable on Ru, but on Ir(111), it is limited by the dehydrogenation of NH3 (R1) and NH (R5). In particular, R1 presents a substantial activation energy, which aligns with the stability of the NH3 molecule over the surface. The most endothermic processes on Ru surfaces are the formations of N2 (R7) and H2 (R9). Indeed, the nitrogen recombination has been identified as the rate-determining step in both Ru(0001) and Ir(111).67,68 Interestingly, in Fig. 5, the activation energy for hydrogen evolution (R9) on Ru(111) is practically half of that on Ru(0001) and only slightly higher than on Ir(111). Such an energy difference explains the divergent results when comparing the H2 formation rates, i.e. Ru loading beyond a certain amount decreases the catalytic activity since it reduces the Ru fcc phase.69 Therefore, to improve the catalytic activity at low temperature, tuning the morphology of the catalyst is crucial. | ||
| Fig. 4 Free energy difference (ΔGr) of the elementary steps in ammonia dehydrogenation (R1–R5) and N2 and H2 formations (R7 and R9) as a function of temperature. | ||
 | ||
| Fig. 5 Activation energy (ΔGa) of the elementary steps in ammonia dehydrogenation (R1–R5) and N2 and H2 formations (R7 and R9) as a function of temperature. | ||
We have selected three different temperatures (i.e. 300, 600 and 900 K) and calculated the energetic profiles of the stoichiometric reaction (NH3 → 0.5N2 + 1.5H2), see Fig. S6–S8 in the ESI† where TS1, TS2 and TS3 are the transition states of the ammonia dehydrogenation process, and TS4 and TS5 are the transition states for the atomic recombination of nitrogen and hydrogen, respectively.
3.3 Reaction constants
We have derived the rate law's pre-exponential factors and reaction constants for every N–H dissociative step and adsorbate recombination based on the reaction energy profiles, see Table 3. Fully aligned with the discussion above is that the formation of adsorbate N2 has the smallest reaction constant indicating that it is the rate-determining step. Comparing the reaction constants for adsorbate N2 formation (R7) and its dissociation (R8), we can conclude that on Ru, the equilibrium is shifted towards the adsorbed atomic species; in contrast, it is shifted towards N2 on Ir. This result highlights the ability of Ir catalysts to promote N2 desorption.3.4 Microkinetics
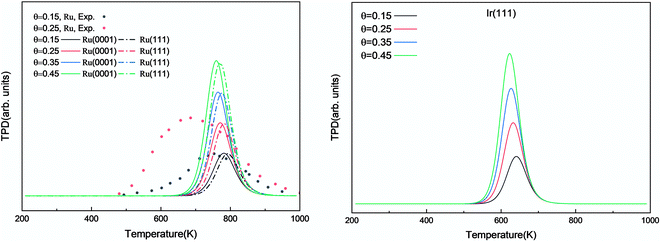 | ||
| Fig. 6 Simulated N2 TPD spectra on Ru(0001) and Ru(111) (left) and on Ir(111) (right) at different initial coverages (θ in ML) with a heating rate of 1 K min−1. The experimental data were extracted from ref. 70. | ||
The simulated H2 TPD patterns of Ru and Ir(111) surfaces are plotted in Fig. 7. The simulated data of Ru(0001) at 0.20 ML coverage fit the experimental research very well. However, at an H2 coverage of 0.45 ML, the experimental signal falls between the simulated patterns of hcp and fcc Ru surfaces, indicating the importance of nanoparticles' size and uniformity in the experiment. The match between simulation and experiments also implies a low effect of H coverage on the H adsorption energy. We can conclude that although the ammonia dehydrogenation on Ir is not as favorable as on Ru, the more favorable desorption of products makes it a suitable catalyst.
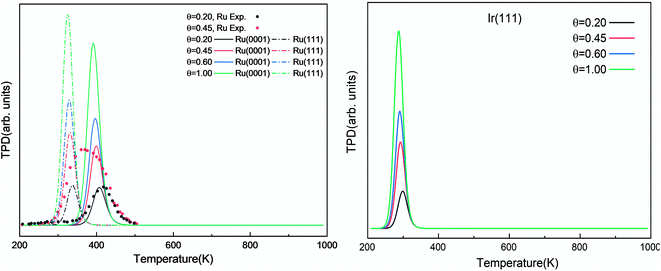 | ||
| Fig. 7 Simulated H2 TPD spectra on Ru(0001) and Ru(111) (left) and Ir(111) (right) at different initial coverages (θ in ML) with a heating rate of 1 K min−1. The experimental data were extracted from ref. 72. | ||
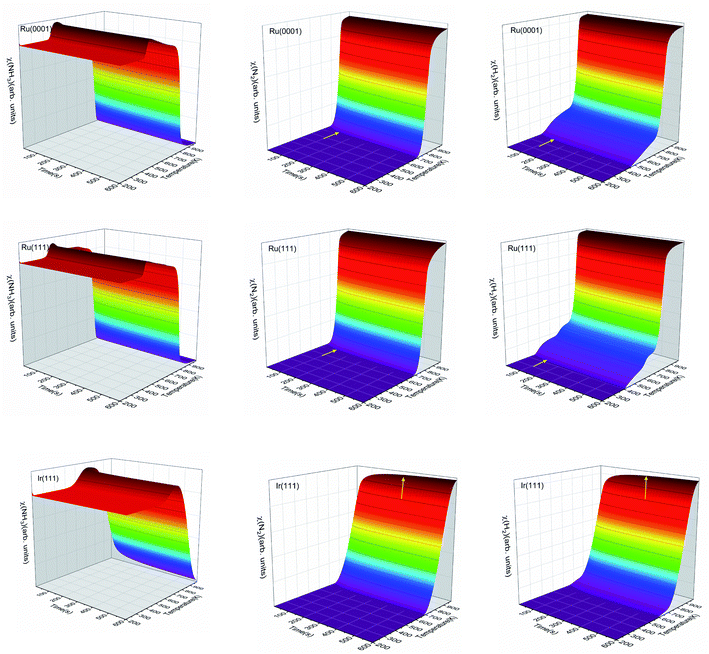
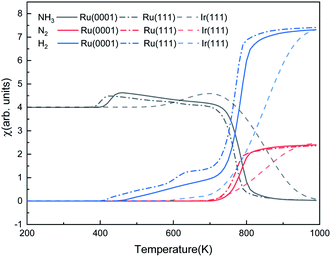
Fig. 9 shows the steady-state reaction details by depicting the NH3, N2, and H2 contents at 600 s as functions of temperature for the three surfaces. Ru(0001) has similar catalytic behavior to Ru(111): after a relatively slow evolution, the H2 production increases dramatically from 700 K and reaches a plateau at around 900 K. However, the H2 production on Ru(111) takes place at 400 K, while on Ru(0001), it is at 425 K. Our simulation results suggest that ammonia dissociates on Ir(111) at above 500 K. These results are consistent with the low- and high-temperature profiles for the decomposition of hydrazine (N2H4) on Ir(111), i.e. at temperatures below 500 K, the products of hydrazine decomposition are mainly NH3 and N2; however, NH3, N2 and H2 are observed above 500 K.73,74
We also made a comparison between experimental and simulated ammonia conversion on Ru catalysts, Fig. 10.69 Below 770 K, the results of Ru(111) fit the experimental data well, since above that temperature, the existing fcc Ru moieties may reconstruct to hcp and sinter to larger structures.75 Notice that Ru hcp fits better at high temperature. However, the NH3 conversion in the simulated process increases faster than the experimental one. This discrepancy between simulations and experiments may be due to the coverage effect of N, i.e. the NH3 decomposition reaction becomes more favorable at high N coverages as discussed in the TPD section.
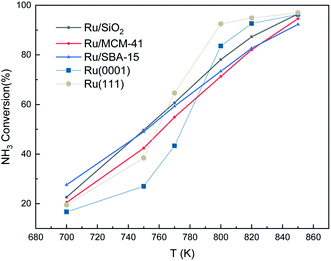 | ||
Fig. 10 Ammonia conversion (in %) over supported Ru catalysts. Experimental trends were obtained from ref. 69. The initial simulated conditions are an NH3![[thin space (1/6-em)]](https://www.rsc.org/images/entities/char_2009.gif) : :![[thin space (1/6-em)]](https://www.rsc.org/images/entities/char_2009.gif) surface ratio of 5 surface ratio of 5![[thin space (1/6-em)]](https://www.rsc.org/images/entities/char_2009.gif) : :![[thin space (1/6-em)]](https://www.rsc.org/images/entities/char_2009.gif) 1. The reaction time is 600 s. 1. The reaction time is 600 s. | ||
The predominant species on the surfaces at the steady-state (time is 600 s) within a temperature range of 200–1000 K are plotted in Fig. 11. Ru surfaces have a wider variety of surface species than Ir(111). As shown in Fig. 11, NH3, NH, N and H are the main predominant species with high coverages on Ru surfaces during the NH3 decomposition process. On Ru(0001), H is the dominant species at 430–535 K, and at 700 K, atomic N accumulates on the surface and replaces NH as the main surface species. The notable species on Ru(111) during the reaction are NH and N at 445–600 K and 600–850 K, respectively. Since Ru(111) has a lower ΔGr for H2 evolution (R9) than Ru(0001), H is the predominant species on Ru(111) at a narrow temperature range of 410–445 K. In contrast, the Ir(111) surface presents considerable contents (>0.1 ML) of only NH3 and NH as the dissociation of NH3 starts at 500 K; NH is the predominant species on the surface in the temperature range of 550–760 K with a maximum coverage of 0.17 ML at 680 K. Owing to the low ΔGa of R7, atomic N does not accumulate on the Ir(111) surface.
4. Conclusions
We carried out a mechanistic investigation of NH3 decomposition on hcp Ru, fcc Ru and fcc Ir using DFT-D3. The most favorable adsorption sites range from NH3 being on top, to bridge, and to hollow sites, with every dehydrogenation strengthening the N bonding to the surface. The energy profiles show that the rate-limiting step is the atomic nitrogen recombination on all the surfaces studied, and although the NH3 dehydrogenation on Ir(111) is not as favorable as on Ru, the N2 desorption indicates that it is a promising catalyst candidate. We derived the free energies of each gas-phase and surface species between 200 and 1000 K by including entropic and specific heat contributions to the DFT energy. We implemented these free energies in a microkinetic model where the TPD experiment showed that both Ru surfaces, i.e. (0001) and (111), have similar desorption properties. The simulated TPD also proved to be useful in assessing the importance of N coverage on the model, i.e. the desorption shifts to lower temperatures with increasing N coverage. Batch reaction simulations described the reaction processes with the increase in temperature and time and indicated that Ru(111) produces H2 at a lower temperature than Ru(0001). On the Ir(111) surface, the dehydrogenation starts at higher temperatures than on Ru, but the desorption of N2 takes place at a lower temperature. The comparison between these results and experiments demonstrates that microkinetic simulations based on DFT results are a useful tool to investigate heterogeneous catalytic reactions and design novel catalysts.Conflicts of interest
There are no conflicts to declare.Acknowledgements
X. Lu thanks the China Scholarship Council and Cardiff University for the overseas student scholarship. We are grateful for the funding from the Engineering & Physical Sciences Research Council (EP/P005845/1), through our membership of the UK's HPC Materials Chemistry Consortium, which is funded by EPSRC (EP/L000202, EP/R029431), and this work used the UK Materials and Molecular Modelling Hub for computational resources, MMM Hub, which is partially funded by EPSRC (EP/P020194). We also acknowledge HPC Wales and the Advanced Research Computing @ Cardiff (ARCCA) at Cardiff University for the computing time on their facilities. All data created during this research are openly available from the University of Cardiff Research Portal orca websites http://doi.org/10.17035/d.2020.0121965596.References
- F. Schüth, R. Palkovits, R. Schlögl and D. S. Su, Energy Environ. Sci., 2012, 5, 6278–6289 RSC.
- A. Valera-Medina and R. Banares-Alcantara, Techno-economic challenges of green ammonia as an energy vector, Academic Press, 2020 Search PubMed.
- K. E. Lamb, M. D. Dolan and D. F. Kennedy, Int. J. Hydrogen Energy, 2019, 44, 3580–3593 CrossRef CAS.
- S. Mukherjee, S. V. Devaguptapu, A. Sviripa, C. R. Lund and G. Wu, Appl. Catal., B, 2018, 226, 162–181 CrossRef CAS.
- Nitrogen Statistics and Information, https://www.usgs.gov/centers/nmic/nitrogen-statistics-and-information, accessed August 9, 2020.
- A. K. Hill and L. Torrente-Murciano, Appl. Catal., B, 2015, 172, 129–135 CrossRef.
- X. Duan, G. Qian, X. Zhou, Z. Sui, D. Chen and W. Yuan, Appl. Catal., B, 2011, 101, 189–196 CrossRef CAS.
- R.-J. Lin, F.-Y. Li and H.-L. Chen, J. Phys. Chem. C, 2011, 115, 521–528 CrossRef CAS.
- S. C. Yeo, S. S. Han and H. M. Lee, J. Phys. Chem. C, 2014, 118, 5309–5316 CrossRef CAS.
- I. Nakamura and T. Fujitani, Appl. Catal., A, 2016, 524, 45–49 CrossRef CAS.
- A. S. Chellappa, C. M. Fischer and W. J. Thomson, Appl. Catal., A, 2002, 227, 231–240 CrossRef CAS.
- B. Diawara, L. Joubert, D. Costa, P. Marcus and C. Adamo, Surf. Sci., 2009, 603, 3025–3034 CrossRef CAS.
- J. Zhang, H. Xu and W. Li, Appl. Catal., A, 2005, 296, 257–267 CrossRef CAS.
- J. Ji, X. Duan, G. Qian, X. Zhou, G. Tong and W. Yuan, Int. J. Hydrogen Energy, 2014, 39, 12490–12498 CrossRef CAS.
- L. Torrente-Murciano, A. K. Hill and T. E. Bell, Catal. Today, 2017, 286, 131–140 CrossRef CAS.
- Z. Jiang, P. Qin and T. Fang, Chem. Phys., 2014, 445, 59–67 CrossRef CAS.
- Z. Jiang, P. Qin and T. Fang, Appl. Surf. Sci., 2016, 371, 337–342 CrossRef CAS.
- D. G. Löffler and L. D. Schmidt, J. Catal., 1976, 41, 440–454 CrossRef.
- M. L. Wagner and L. D. Schmidt, Surf. Sci., 1991, 257, 113–128 CrossRef CAS.
- A. Hellman, K. Honkala, I. N. Remediakis, A. Logadottir, A. Carlsson, S. Dahl, C. H. Christensen and J. K. Nørskov, Surf. Sci., 2009, 603, 1731–1739 CrossRef CAS.
- A. Logadottir and J. K. Nørskov, J. Catal., 2003, 220, 273–279 CrossRef CAS.
- S. Maier, I. Stass, J. I. Cerda and M. Salmeron, J. Phys. Chem. C, 2012, 116, 25395–25400 CrossRef CAS.
- L. Li, Z. H. Zhu, Z. F. Yan, G. Q. Lu and L. Rintoul, Appl. Catal., A, 2007, 320, 166–172 CrossRef CAS.
- H. Mortensen, L. Diekhöner, A. Baurichter, E. Jensen and A. C. Luntz, J. Chem. Phys., 2000, 113, 6882–6887 CrossRef CAS.
- S. R. Deshmukh, A. B. Mhadeshwar and D. G. Vlachos, Ind. Eng. Chem. Res., 2004, 43, 2986–2999 CrossRef CAS.
- S.-F. Yin, B.-Q. Xu, C.-F. Ng and C.-T. Au, Appl. Catal., B, 2004, 48, 237–241 CrossRef CAS.
- S. Dahl, J. Sehested, C. J. H. Jacobsen, E. Törnqvist and I. Chorkendorff, J. Catal., 2000, 192, 391–399 CrossRef CAS.
- W. Huang, C. Cheng and E. Feng, Surf. Sci., 2013, 616, 29–35 CrossRef CAS.
- A. K. Santra, B. K. Min, C. W. Yi, K. Luo, T. V. Choudhary and D. W. Goodman, J. Phys. Chem. B, 2002, 106, 340–344 CrossRef CAS.
- X.-Z. Xiao, Y.-L. Cao and Y.-Y. Cai, Surf. Sci., 2011, 605, 802–807 CrossRef CAS.
- W. Huang, W. Lai and D. Xie, Surf. Sci., 2008, 602, 1288–1294 CrossRef CAS.
- F. R. García-García, A. Guerrero-Ruiz, I. Rodríguez-Ramos, A. Goguet, S. O. Shekhtman and C. Hardacre, Phys. Chem. Chem. Phys., 2011, 13, 12892–12899 RSC.
- A. Boisen, S. Dahl, J. K. Nørskov and C. H. Christensen, J. Catal., 2005, 230, 309–312 CrossRef CAS.
- C. Egawa, T. Nishida, S. Naito and K. Tamaru, J. Chem. Soc., Faraday Trans. 1, 1984, 80, 1595–1604 RSC.
- H. Mortensen, L. Diekhöner, A. Baurichter, E. Jensen and A. C. Luntz, J. Chem. Phys., 2000, 113, 6882–6887 CrossRef CAS.
- H. Ma and C. Na, ACS Catal., 2015, 5, 1726–1735 CrossRef CAS.
- G. Schulz-Ekloff and R. Hoppe, Catal. Lett., 1990, 6, 383–387 CrossRef CAS.
- G. Papapolymerou and V. Bontozoglou, J. Mol. Catal. A: Chem., 1997, 120, 165–171 CrossRef CAS.
- D. Constales, G. S. Yablonsky, V. Galvita and G. B. Marin, Chem. Eng. Sci., 2011, 66, 4683–4689 CrossRef CAS.
- J. T. Gleaves, G. Yablonsky, X. Zheng, R. Fushimi and P. L. Mills, J. Mol. Catal. A: Chem., 2010, 315, 108–134 CrossRef CAS.
- J. U. Nwalor and J. G. Goodwin, Top. Catal., 1994, 1, 285–293 CrossRef CAS.
- J. U. Nwalor, J. G. Goodwin Jr and P. Biloen, J. Catal., 1989, 117, 121–134 CrossRef CAS.
- A. M. Efstathiou and X. E. Verykios, Appl. Catal., A, 1997, 151, 109–166 CrossRef CAS.
- W. Fu, W. Chen, G. Qian, D. Chen, W. Yuan, X. Zhou and X. Duan, React. Chem. Eng., 2019, 4, 316–322 RSC.
- T. Bucko, J. Hafner, S. Lebegue and J. G. Angyán, J. Phys. Chem. A, 2010, 114, 11814–11824 CrossRef CAS.
- G. Kresse and J. Furthmüller, Comput. Mater. Sci., 1996, 6, 15–50 CrossRef CAS.
- B. Hammer, L. B. Hansen and J. K. Nørskov, Phys. Rev. B: Condens. Matter Mater. Phys., 1999, 59, 7413 CrossRef.
- J. P. Perdew, K. Burke and M. Ernzerhof, Phys. Rev. Lett., 1996, 77, 3865 CrossRef CAS.
- G. Kresse and D. Joubert, Phys. Rev. B: Condens. Matter Mater. Phys., 1999, 59, 1758 CrossRef CAS.
- P. E. Blöchl, O. Jepsen and O. K. Andersen, Phys. Rev. B: Condens. Matter Mater. Phys., 1994, 49, 16223 CrossRef.
- S. Grimme, S. Ehrlich and L. Goerigk, J. Comput. Chem., 2011, 32, 1456–1465 CrossRef CAS.
- C. Stampfl and M. Scheffler, Phys. Rev. B: Condens. Matter Mater. Phys., 1996, 54, 2868 CrossRef CAS.
- J. W. Arblaster, Platinum Met. Rev., 2013, 57, 127–136 CrossRef CAS.
- K. Persson, Materials Data on Ru by Materials Project, 2020, DOI:10.17188/1309980.
- L. Liu, M. Yu, B. Hou, Q. Wang, B. Zhu, L. Jia and D. Li, Nanoscale, 2019, 11, 8037–8046 RSC.
- K. Persson, Materials Data on Ir by Materials Project, 2020, DOI:10.17188/1186086.
- J. W. Arblaster, Platinum Met. Rev., 2010, 54, 93–102 CrossRef CAS.
- D. Sheppard, P. Xiao, W. Chemelewski, D. D. Johnson and G. Henkelman, J. Chem. Phys., 2012, 136, 074103 CrossRef.
- A. Ghasemi, P. Xiao and W. Gao, J. Chem. Phys., 2019, 151, 054110 CrossRef.
- P. Xiao, D. Sheppard, J. Rogal and G. Henkelman, J. Chem. Phys., 2014, 140, 174104 CrossRef.
- M. G. Evans and M. Polanyi, Trans. Faraday Soc., 1935, 31, 875–894 RSC.
- H. Eyring, Chem. Rev., 1935, 17, 65–77 CrossRef CAS.
- H. Eyring, J. Chem. Phys., 1935, 3, 107–115 CrossRef CAS.
- K. J. Laidler and M. C. King, J. Phys. Chem., 1983, 87, 2657–2664 CrossRef CAS.
- S. S. Tafreshi, A. Roldan and N. H. De Leeuw, Faraday Discuss., 2017, 197, 41–57 RSC.
- G. Henkelman, A. Arnaldsson and H. Jónsson, Comput. Mater. Sci., 2006, 36, 354–360 CrossRef.
- S. Maier, I. Stass, J. I. Cerda and M. Salmeron, J. Phys. Chem. C, 2012, 116, 25395–25400 CrossRef CAS.
- W. Huang, C. Cheng and E. Feng, Surf. Sci., 2013, 616, 29–35 CrossRef CAS.
- X.-K. Li, W.-J. Ji, J. Zhao, S.-J. Wang and C.-T. Au, J. Catal., 2005, 236, 181–189 CrossRef CAS.
- S. Dahl, E. Törnqvist and I. Chorkendorff, J. Catal., 2000, 192, 381–390 CrossRef CAS.
- L. Diekhöner, H. Mortensen, A. Baurichter and A. C. Luntz, J. Vac. Sci. Technol., A, 2000, 18, 1509–1513 CrossRef.
- J. T. Yates Jr, C. H. F. Peden, J. E. Houston and D. W. Goodman, Surf. Sci., 1985, 160, 37–45 CrossRef.
- S. J. Cho, J. Lee, Y. S. Lee and D. P. Kim, Catal. Lett., 2006, 109, 181–186 CrossRef CAS.
- X. Lu, S. Francis, D. Motta, N. Dimitratos and A. Roldan, Phys. Chem. Chem. Phys., 2020, 22, 3883–3896 RSC.
- K. Kusada, Creation of New Metal Nanoparticles and Their Hydrogen-Storage and Catalytic Properties, Springer, 2014, pp. 59–67 Search PubMed.
Footnote |
| † Electronic supplementary information (ESI) available. See DOI: 10.1039/d1na00015b |
| This journal is © The Royal Society of Chemistry 2021 |

