 Open Access Article
Multi-scale analysis of radio-frequency performance of 2D-material based field-effect transistors†
A.
Toral-Lopez
 *a,
F.
Pasadas
 b,
E. G.
Marin
a,
A.
Medina-Rull
 a,
J. M.
Gonzalez-Medina
c,
F. G.
Ruiz‡
a,
D.
Jiménez
b and
A.
Godoy‡
a,
J. M.
Gonzalez-Medina
c,
F. G.
Ruiz‡
a,
D.
Jiménez
b and
A.
Godoy‡
 *a
*a
aDepartamento de Electrónica, Facultad de Ciencias, Universidad de Granada, 18071, Granada, Spain
bDepartament d’Enginyeria Electrònica, Universitat Autònoma de Barcelona, 08193, Bellaterra, Spain
cGlobal TCAD Solutions GmbH., Bösendorferstraße 1/12, 1010, Vienna, Austria
First published on 12th March 2021
Abstract
Two-dimensional materials (2DMs) are a promising alternative to complement and upgrade high-frequency electronics. However, in order to boost their adoption, the availability of numerical tools and physically-based models able to support the experimental activities and to provide them with useful guidelines becomes essential. In this context, we propose a theoretical approach that combines numerical simulations and small-signal modeling to analyze 2DM-based FETs for radio-frequency applications. This multi-scale scheme takes into account non-idealities, such as interface traps, carrier velocity saturation, or short channel effects, by means of self-consistent physics-based numerical calculations that later feed the circuit level via a small-signal model based on the dynamic intrinsic capacitances of the device. At the circuit stage, the possibilities range from the evaluation of the performance of a single device to the design of complex circuits combining multiple transistors. In this work, we validate our scheme against experimental results and exemplify its use and capability assessing the impact of the channel scaling on the performance of MoS2-based FETs targeting RF applications.
1 Introduction
The emergence of two-dimensional (2D) crystals has raised the expectations for radio-frequency (RF) electronics to move into the THz range. This territory is especially suitable for graphene thanks to its high mobility and saturation velocity which provide an excellent basis for RF operation. In fact, graphene field-effect transistors (GFETs) with several hundreds of GHz cut-off frequencies (fT) have already been demonstrated.1,2 Their maximum-oscillation frequency (fmax), however, is still low, ≤200 GHz,3–5 due to the high output conductance produced by the absence of a bandgap.6 Other 2D materials (2DMs) are postulated as candidates to overcome this problem, being MoS2, with a bandgap sizable with the number of stacked layers, one of the most appealing and studied alternatives.7–13The possibility to transfer 2DMs in almost any substrate expands the range of applications with respect to conventional RF technologies. Indeed, measurements of MoS2 devices fabricated on flexible substrates show values of fT = 13.5 GHz and fmax = 10.5 GHz,12 not that far from RF performances achieved with the same material on rigid oxides, fT = 42 GHz and fmax = 50 GHz.12 Better RF performance would be achievable as further improvements come in MoS2 and other promising 2DMs such as PdSe2![[thin space (1/6-em)]](https://www.rsc.org/images/entities/char_2009.gif) 14 or PtSe2.15 In this regard, while 2D semiconductors are constrained by a lower fT than graphene (due to the superior carrier mobility and saturation velocity of the latter), they are not limited by the gapless band-structure that impacts the current saturation in GFETs leading to a reduced voltage and power gain.6 Indeed, GFETs have behaved rather poor in terms of fmax,6 limiting the highest operating frequency of power amplifiers. It is in this field where more research is required to shed light on the potential of MoS2 and other TMDs to develop improved RF applications.16
14 or PtSe2.15 In this regard, while 2D semiconductors are constrained by a lower fT than graphene (due to the superior carrier mobility and saturation velocity of the latter), they are not limited by the gapless band-structure that impacts the current saturation in GFETs leading to a reduced voltage and power gain.6 Indeed, GFETs have behaved rather poor in terms of fmax,6 limiting the highest operating frequency of power amplifiers. It is in this field where more research is required to shed light on the potential of MoS2 and other TMDs to develop improved RF applications.16
In this arena, with the 2D RF technology readiness in its early infancy, the computational tools able to support and rationalize the experimental activities are more essential than ever so as to: (i) interpret the experimental measurements; (ii) gain understanding to improve the capabilities of the devices; (iii) assess their performance and benchmark them against conventional technologies; (iv) explore new device designs; and (v) foresee the RF limits of novel technologies.
In this context, this work presents a multi-scale scheme17 that combines numerical simulations with a small-signal model to analyze the RF performance of 2DM-based FETs. The fully detailed behavior of the device in the static operation regime obtained from the numerical simulator is combined with a small-signal model specifically developed for 2DM-based FETs.18 Thus, we are able to extend the analysis from a device to a circuit level. To this purpose, we first introduce the theoretical basis of the calculations. Then, the multi-scale method is validated against the dc and high-frequency measurements of MoS2 transistors reported in (ref. 7). Finally, fT and fmax are evaluated for different gate lengths to analyze the RF potential performance of MoS2 transistors, and then the main conclusions of the work are outlined.
2 Methods
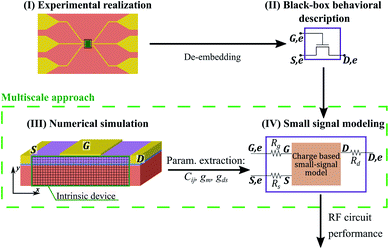
The multi-scale approach proposed in this work combines (i) the numerical self-consistent solution of the coupled Poisson and continuity equations, including interface traps, carrier velocity saturation and short-channel effects; and (ii) the small-signal compact model that allows for the analysis of multiple interconnected devices in arbitrary designs, and their linear response to complex dynamical inputs.With the purpose of tightening the approach to the state-of-the-art, and make realistic prospects for that technology, the studied architecture can be taken from an experimental setup of a particular 2DM-based device. Then, a self-consistent numerical simulation in the static regime is carried out, providing detailed information of the main electrostatic and transport physical magnitudes governing the transistor response, including the intrinsic device and the parasitic elements involved to contact it. Next, the intrinsic magnitudes can be extracted and fed into the small-signal model, so to have a distilled description of the device physics. The extrinsic and parasitic elements are thus isolated, and can be later reintroduced in the small-signal model, becoming external, technology-dependent parameters to the core model. That approach enables to project the RF performance of the devices and materials regardless the current technology constraints and provides a flexible and at the same time robust description. The overall picture of the proposed procedure is shown in Fig. 1. The stages are described in more detail hereunder.
2.1 Self-consistent numerical simulator (device level)
The impact of non-idealities is also included in the simulations. In particular, three remarkable effects are considered: interface traps, electric field dependent mobility and access and contact resistances. The impact of the gate electric field on the mobility might be also of relevance as it has been studied in (ref. 19 and 20) but requires a detailed analysis of the scattering processes in MoS2. For the former, an arbitrary energetic profile for either donors or acceptors traps can be defined to evaluate the surface charge density associated with a certain interface as a function of the electrostatic potential and Fermi level (see S4 at ESI†). As for the mobility, we consider the electric field induced degradation (see S5 at ESI†), following the expression proposed in (ref. 21).
When analyzing a device, the numerical modeling described above is applied to the complete structure, as depicted in Fig. 1, which comprises channel plus access regions and contact resistances. This enables a full self-consistent solution of the electrostatic and transport dependencies in the device. Then, the contact resistances, that are bias independent, are removed with the aim of simulating the intrinsic device and extract its small-signal parameters as explained in the following.
Then, we compute the reference-independent dynamic description of a three-terminal device by calculating the intrinsic capacitances, Cij, as the charge derivative at terminal i with respect to a varying voltage applied to terminal j, assuming that the bias at any other terminal remains constant:
 | (1) |
2.2 Small-signal model (circuit level)
The small-signal equivalent circuit of a 2DM-based FET is shown in Fig. 2.24 It allows to treat the current and charge variations due to a time-varying input signal in terms of linear circuit elements, i.e. conductance, and capacitance elements (see ESI†). Two main features must be highlighted: (i) the metal contact resistances are included, an aspect of utmost importance when dealing with low dimensional FETs25 and (ii) the small-signal model guarantees charge conservation and takes into account non-reciprocal capacitances. The latter is not considered in Meyer26 and Meyer-like capacitance models making them inaccurate when trying to predict the RF performance of GFETs, where the impact of transcapacitances is critical. Indeed, the analysis of the intrinsic capacitances of a MoS2 FET addressed in (ref. 18) shows that reciprocity between Cgd and Cdg cannot be assumed for all transistor operation regions. Such an equivalent circuit combined with our detailed self-consistent physics-based simulator allows the accurate electrical simulation of 2DM-based FETs for linear RF applications.27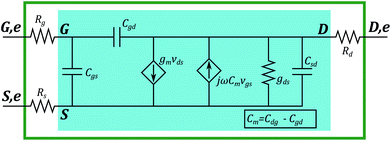 | ||
| Fig. 2 Small-signal equivalent circuit suited to 2DM-based FETs.24 The equivalent circuit of the intrinsic device is framed in blue. The small-signal elements are: gm = ∂IDS/∂Vgs transconductance; gDS = ∂IDS/∂VDS output conductance; and Cgs, Cgd, Csd, and Cdg intrinsic capacitances. Rg is the gate resistance and Rd and Rs account for the contact resistances of the drain and source, respectively. They connect the intrinsic (noted G, D and S) and extrinsic (G,e, D,e and S,e) gate, drain and source terminals. | ||
Considering the equivalent circuit shown in Fig. 2 as a two-port network connected in a common-source configuration allows the assessment of two main figures of merit for RF devices: the cut-off frequency, fT, and the maximum oscillation frequency, fmax, evaluated from the current and power gain, respectively.
3 Results and discussion
Before projecting the potential performance of MoS2 FETs for RF applications, the multi-scale scheme is validated against the experimental data reported in (ref. 7). The device is a monolayer MoS2 FET with 30 nm-thick top gate oxide (HfO2) and a 270 nm-thick substrate (SiO2). The total length of the device is Lch = 340 nm, with a 240 nm-long channel plus two access regions 50 nm-long each. The measured contact resistance and electron mobility are 2 kΩ μm and 85 cm2 V−1 s−1, respectively.With the intention of emulating the effect of the contact resistances (RC) in the numerical simulations, two doped regions are added at both edges of the semiconductor layer and its doping is modified to adjust RC = Rs = Rd to the reported experimental value (2 kΩ μm). Interface traps are a relevant magnitude in MoS2 devices, as it is discussed in (ref. 28 and 29), although more effort is still required to achieve a deeper and more comprehensive understanding. However, as the detailed distribution of interface traps is not the main goal of this work, we have considered a constant energetic profile in both interfaces of the channel that provides the best agreement with the experimental data.30 In particular, we set two energetic profiles: (i) at the top gate insulator interface, a constant energetic profile of donors traps with Dit = 1012 cm−2 eV−1 is considered from mid-gap up to 0.57 eV towards the conduction band edge; and (ii) at the substrate interface, a constant energetic profile also of donor traps from midgap to the conduction band edge (i.e. 0.9 eV above midgap) is considered with Dit = 2.5 × 1011 cm−2 eV−1. The channel is undoped with electron mobility μ = 85 cm2 V−1 s−1, saturation velocity vsat = 2.8 × 106 cm s−1, electron effective mass m* = 0.61 m0 and bandgap width Eg = 1.8 eV. The experimental data and the simulation results are depicted in Fig. 3, showing a very good agreement with the bias point employed in the RF experimental characterization, VGS,e = −3 V and VDS,e = 2 V, marked by a square. Remarkably, at this bias point the resistance associated with the access regions (as computed from the self-consistent simulations), have comparable values to RC, reaching Rs,acc = 3.3 kΩ μm and Rd,acc = 3.1 kΩ μm at the source and drain ends, respectively and being rather bias dependent. This point highlights the strong impact that these gate-underlapped areas can produce on the RF performance of the device.31
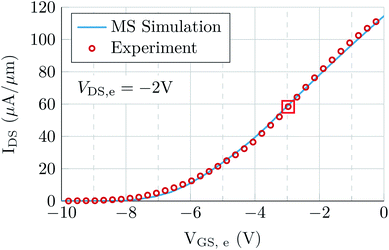 | ||
| Fig. 3 Experimental data of a MoS2 FET reported in (ref. 7) (symbols) and results from the numerical solver (line). The operating point for RF experimental measurements is indicated by a square. | ||
Using these results, we can assess the proposed approach by confronting the RF figures of merit resulting from it with those experimentally characterized and reported in (ref. 7). To this purpose, the values of the small-signal parameters of the device are first extracted following the procedure previously described and fed into the small-signal model (Table 1).
| Parameter | Value | Parameter | Value |
|---|---|---|---|
| g m | 0.0828 mS μm−1 | g DS | 0.5047 mS μm−1 |
| C gd | 0.280 fF μm−1 | C dg | 0.442 fF μm−1 |
| C sd | −0.071 fF μm−1 | C gs | 0.604 fF μm−1 |
The current gain (h21) and the Mason's unilateral gain (U) obtained from the multi-scale scheme, i.e. combining the small-signal-model and numerical-solver analysis, are depicted in Fig. 4 along with the experimental data,7 demonstrating an excellent correspondence and holding the soundness of the theoretical procedure. fT and fmax, obtained from the numerical calculations, marked within the figures, are also shown in very close agreement with the reported measurements: fT = 2.63 GHz and fmax = 2.16 GHz.
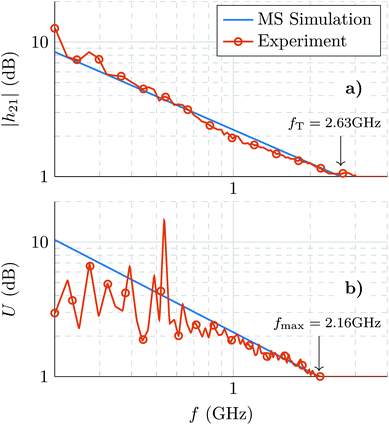 | ||
| Fig. 4 (a) Current gain h21 and (b) Mason's unilateral gain U calculated using the multi-scale (MS) approach (blue lines) and compared against the experimental values extracted from (ref. 7) (red lines with symbols). The arrows indicate the values of fT and fmax. | ||
Once the multi-scale approach is validated, we exemplify its utility by proceeding with a projective analysis of the potential of MoS2 FETs for RF applications; in particular extracting fT and fmax for devices with channel lengths ranging from 10 μm down to 50 nm. In order to focus on the material intrinsic capabilities and to reduce the role of extrinsic resistive elements in the predicted behavior, the 2D-FET is improved by reducing the access regions length to 5 nm and setting contact resistances to 100 Ω μm, which is the desirable value for 2DMs to compete on the RF arena25 and not so far from the minimum value achieved experimentally, 240 Ω μm,32 and well above the theoretical limit of 30 Ω μm.33
Fig. 5 shows fT as a function of the gate length, Lg. Each marker of the solid curves corresponds to the result achieved from the application of the multi-scale procedure to a device with a particular Lg under a given VDS and considering the VGS bias that causes the maximum transconductance. Along with these results, we show the physical limit represented by vsat/2πLg, i.e. the inverse of the minimum transit time of charge carriers in the channel, that also serves as a guide for the eyes of the 1/Lg scaling; and the 1/Lg2 trend that conventionally commands the performance in longer channels. We also show, for the sake of comparison, the results for different experimental devices based on graphene, MoS2 and III–V compounds taken from the literature (solid and hollow symbols).6,9,12,34–41
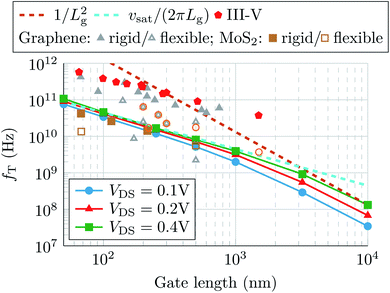 | ||
| Fig. 5 Cut-off frequency fT as a function of the gate length for different drain biases (solid lines with markers). The 1/Lg2 trend and the physical limit (that also serves as a guideline for the 1/Lg scaling) are also depicted (dashed lines). Solid and hollow markers correspond to experimental works.6,9,12,34–41 | ||
According to Fig. 5, a change in the scaling trend of MoS2fT, from 1/Lg2 for long channels to 1/Lg for short channels can be expected. This can be explained due to the fT rough dependence on ∼gm/2π(Cgs + Cgd). For long channels, gm is proportional to 1/Lg, and (Cgs + Cgd) to Lg, resulting in a trend ∼1/Lg2; while for short channels gm saturates and fT scales only with the capacitive response, to 1/Lg. The transition from 1/Lg2 to 1/Lg is observed in MoS2 still for long channels, i.e. Lg ≈ 1 μm due to gm early saturation.6 The vsat impact is also revealed in the dependence of fT on VDS: when the channel length is scaled, the performance is barely improved with VDS, as it approaches the physical limit, i.e., the carrier drift velocity cannot increase any further with the electric field. The values predicted are in good agreement with experimental state-of-the-art RF measurements of MoS2 devices, demonstrating the prediction capability of the presented tool, that can be exploited to study any candidate in the 2DM realm. The experimental results shown for graphene and III–V compounds contextualize the progresses already achieved by MoS2 electronics and the limitations associated to its lower saturation velocity.
Concerning fmax, Fig. 6 plots it as a function of Lg for different VDS biases, together with the 1/Lg and  lines used as a guide for the eyes, and the experimental results from different technologies. For long channel devices, fmax varies with 1/Lg as fmax depends roughly on
  considering that the gate resistance Rg si proportional to 1/Lg.42 For short channel devices, Lg < 500 nm, the trend changes from 1/Lg to
  , showing a small over-increment at the limit of the diffusive regime, as it has also been predicted for GFETs in (ref. 43). Although the experimental values correspond to diverse technologies and measured under different operating bias points, the measurements show good agreement with our predictions. More importantly, MoS2 FETs demonstrate to be competitive or even to overcome graphene devices performance for the smaller channel lengths, thanks to their larger output conductance, postulating MoS2 as a worthy 2D alternative for RF power circuits, being nevertheless still far from consolidated III–V architectures.
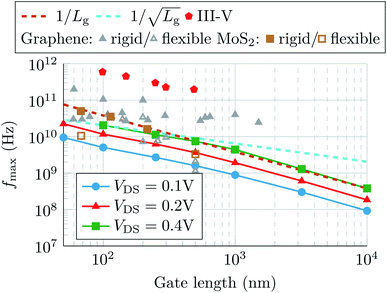 | ||
Fig. 6 Maximum oscillation frequency fmax as a function of the gate length for different drain biases (solid lines with markers). The 1/Lg and  trends are indicated by dashed lines. Solid and hollow markers correspond to experimental works.6,9,12,34–41 trends are indicated by dashed lines. Solid and hollow markers correspond to experimental works.6,9,12,34–41 | ||
4 Conclusion
We reported a multi-scale approach that combines small-signal and numerical simulations in order to describe in detail the behavior of 2DM-based devices for RF applications. Both levels of abstraction are precisely combined, so the main features included in the Poisson-drift-diffusion system are extended to circuit level simulations. The proposed scheme was validated against experimental data, showing an excellent agreement with dc and RF measurements. The multi-scale simulation tool was then employed to project the impact of channel length scaling on the RF performance of a MoS2 based FET with improved extrinsic behavior by considering a reduction in the contact resistance and shorter gate under-lapped access regions, so to understand and assess the intrinsic limits of the 2DMs. The resulting fTvs. Lg curves show a change in their trend from 1/Lg2 to 1/Lg and a saturated behavior with respect to VDS for low Lg, due to the constraining saturation velocity. When comparing the results with those achieved in experimental devices, the reduction of the access regions and contact resistances implies an increase of almost 10-fold in fT with respect to the experimental sample.7,10 On the other hand, the fmaxvs. Lg curves present a scaling-trend varying from 1/Lg to , that is impacted by the up-scaling of the gate resistance. An improvement of the RF performance of MoS2-based devices could be achieved by enhancing the crystal transport properties, e.g., higher mobility and saturation velocity. Hence, the multi-level approach presented here constitutes a versatile platform for evaluating the impact of scaling on the RF performance of any 2D material based FET. In addition to channel scaling, the capabilities of this approach can be extended to asses the impact of surface defects and even mechanical strain in devices fabricated on flexible substrates. Furthermore, it enables the design and assessment of sophisticated RF circuits based on such devices.
Conflicts of interest
Authors do not have conflicts of interest to declare.Acknowledgements
A. Toral-Lopez acknowledges the FPU program (FPU16/04043). E. G. Marin acknowledges Juan de la Cierva Incorporación IJCI-2017-32297 (MINECO/AEI). This work has received funding from the European Unions Horizon 2020 Research and Innovation Programme under grant agreements No. GrapheneCore2 785219 and No. GrapheneCore3 881603, and from Ministerio de Ciencia, Innovación y Universidades under grant agreement RTI2018-097876-B-C21 (MCIU/AEI/FEDER, UE), TEC2017-89955-P (MINECO/AEI/FEDER, UE), and TEC2015-67462-C2-1-R (MINECO). This article has been partially funded by the European Regional Development Funds (ERDF) allocated to the Programa Operatiu FEDER de Catalunya 2014–2020, with support of the Secretaria d’Universitats i Recerca of the Departament d’Empresa i Coneixement of the Generalitat de Catalunya for Emerging Technology Clusters to carry out valorization and transfer of research results. GraphCAT project 001-P-001702.References
- R. Cheng, J. Bai, L. Liao, H. Zhou, Y. Chen, L. Liu, Y.-C. Lin, S. Jiang, Y. Huang and X. Duan, Proc. Natl. Acad. Sci. U. S. A., 2012, 109, 11588–11592 CrossRef CAS PubMed.
- L. Liao, Y.-C. Lin, M. Bao, R. Cheng, J. Bai, Y. Liu, Y. Qu, K. L. Wang, Y. Huang and X. Duan, Nature, 2010, 467, 305–308 CrossRef CAS.
- Y. Wu, X. Zou, M. Sun, Z. Cao, X. Wang, S. Huo, J. Zhou, Y. Yang, X. Yu, Y. Kong, G. Yu, L. Liao and T. Chen, ACS Appl. Mater. Interfaces, 2016, 8, 25645–25649 CrossRef CAS.
- Z. Feng, C. Yu, J. Li, Q. Liu, Z. He, X. Song, J. Wang and S. Cai, Carbon, 2014, 75, 249–254 CrossRef CAS.
- Z. Guo, R. Dong, P. S. Chakraborty, N. Lourenco, J. Palmer, Y. Hu, M. Ruan, J. Hankinson, J. Kunc, J. D. Cressler, C. Berger and W. A. de Heer, Nano Lett., 2013, 13, 942–947 CrossRef CAS.
- F. Schwierz, Proc. IEEE, 2013, 101, 1567–1584 CAS.
- D. Krasnozhon, D. Lembke, C. Nyffeler, Y. Leblebici and A. Kis, Nano Lett., 2014, 14, 5905–5911 CrossRef CAS PubMed.
- Q. Gao, Z. Zhang, X. Xu, J. Song, X. Li and Y. Wu, Nat. Commun., 2018, 9 Search PubMed.
- H.-Y. Chang, M. N. Yogeesh, R. Ghosh, A. Rai, A. Sanne, S. Yang, N. Lu, S. K. Banerjee and D. Akinwande, Adv. Mater., 2015, 28, 1818–1823 CrossRef.
- A. Sanne, R. Ghosh, A. Rai, M. N. Yogeesh, S. H. Shin, A. Sharma, K. Jarvis, L. Mathew, R. Rao, D. Akinwande and S. Banerjee, Nano Lett., 2015, 15, 5039–5045 CrossRef CAS.
- A. Sanne, S. Park, R. Ghosh, M. N. Yogeesh, C. Liu, L. Mathew, R. Rao, D. Akinwande and S. K. Banerjee, npj 2D Mater. Appl., 2017, 1 CAS.
- R. Cheng, S. Jiang, Y. Chen, Y. Liu, N. Weiss, H. C. Cheng, H. Wu, Y. Huang and X. Duan, Nat. Commun., 2014, 5, 1–9 Search PubMed.
- M. Belete, S. Kataria, U. Koch, M. Kruth, C. Engelhard, J. Mayer, O. Engström and M. C. Lemme, ACS Appl. Nano Mater., 2018, 1, 6197–6204 CrossRef CAS PubMed.
- A. D. Bartolomeo, A. Pelella, X. Liu, F. Miao, M. Passacantando, F. Giubileo, A. Grillo, L. Iemmo, F. Urban and S.-J. Liang, Adv. Funct. Mater., 2019, 29, 1902483 CrossRef.
- F. Urban, F. Gity, P. K. Hurley, N. McEvoy and A. D. Bartolomeo, Appl. Phys. Lett., 2020, 117, 193102 CrossRef CAS.
- F. Schwierz, J. Pezoldt and R. Granzner, Nanoscale, 2015, 7, 8261–8283 RSC.
- E. G. Marin, M. Perucchini, D. Marian, G. Iannaccone and G. Fiori, IEEE Trans. Electron Devices, 2018, 65(10), 4167–4179 CAS.
- F. Pasadas, E. G. Marin, A. Toral-Lopez, F. G. Ruiz, A. Godoy, S. Park, D. Akinwande and D. Jiménez, npj 2D Mater. Appl., 2019, 3, 47 CrossRef.
- A. D. Bartolomeo, L. Genovese, F. Giubileo, L. Iemmo, G. Luongo, T. Foller and M. Schleberger, 2D Materials, 2017, 5, 015014 CrossRef.
- P. C. Feijoo, F. Pasadas, J. M. Iglesias, E. M. Hamham, R. Rengel and D. Jimenez, IEEE Trans. Electron Devices, 2019, 1–7 Search PubMed.
- P. C. Feijoo, D. Jiménez and X. Cartoixà, 2D Materials, 2016, 3, 025036 CrossRef.
- F. Pasadas and D. Jimenez, IEEE Trans. Electron Devices, 2016, 63, 2936–2941 CAS.
- D. Ward and R. Dutton, IEEE J. Solid-State Circuits, 1978, 13, 703–708 Search PubMed.
- F. Pasadas, W. Wei, E. Pallecchi, H. Happy and D. Jimenez, IEEE Trans. Electron Devices, 2017, 64, 4715–4723 CAS.
- D. Jena, K. Banerjee and G. H. Xing, Nat. Mater., 2014, 13, 1076–1078 CrossRef CAS PubMed.
- J. E. Meyer, MOS models and circuit simulation, RCA Rev., 1971, 32, 42–63 Search PubMed.
- A. Toral-Lopez, F. Pasadas, E. G. Marin, A. Medina-Rull, F. J. G. Ruiz, D. Jimenez and A. Godoy, 2019 International Conference on Simulation of Semiconductor Processes and Devices (SISPAD), 2019, pp. 1–4 Search PubMed.
- R. Dagan, Y. Vaknin and Y. Rosenwaks, Nanoscale, 2020, 12, 8883–8889 RSC.
- C. Kim, I. Moon, D. Lee, M. S. Choi, F. Ahmed, S. Nam, Y. Cho, H.-J. Shin, S. Park and W. J. Yoo, ACS Nano, 2017, 11, 1588–1596 CrossRef CAS PubMed.
- M. Takenaka, Y. Ozawa, J. Han and S. Takagi, IEEE Int. Electron Devices Meet., 2016, 139–142 Search PubMed.
- A. Toral-Lopez, E. G. Marin, A. Medina, F. G. Ruiz, N. Rodriguez and A. Godoy, Nanomaterials, 2019, 9, 1027 CrossRef CAS PubMed.
- R. Kappera, D. Voiry, S. E. Yalcin, B. Branch, G. Gupta, A. D. Mohite and M. Chhowalla, Nat. Mater., 2014, 13, 1128–1134 CrossRef CAS PubMed.
- A. Allain, J. Kang, K. Banerjee and A. Kis, Nat. Mater., 2015, 14, 1195–1205 CrossRef CAS PubMed.
- S. Park, S. H. Shin, M. N. Yogeesh, A. L. Lee, S. Rahimi and D. Akinwande, IEEE Electron Device Lett., 2016, 37, 512–515 CAS.
- J. Lee, T.-J. Ha, H. Li, K. N. Parrish, M. Holt, A. Dodabalapur, R. S. Ruoff and D. Akinwande, ACS Nano, 2013, 7, 7744–7750 CrossRef CAS PubMed.
- C. Sire, F. Ardiaca, S. Lepilliet, J.-W. T. Seo, M. C. Hersam, G. Dambrine, H. Happy and V. Derycke, Nano Lett., 2012, 12, 1184–1188 CrossRef CAS PubMed.
- N. Petrone, I. Meric, T. Chari, K. L. Shepard and J. Hone, IEEE J. Electron Devices Soc., 2015, 3, 44–48 Search PubMed.
- J. Lee, K. N. Parrish, S. F. Chowdhury, T.-J. Ha, Y. Hao, L. Tao, A. Dodabalapur, R. S. Ruoff and D. Akinwande, Int. Electron Devices Meet., 2012, 14.6.1–14.6.4 Search PubMed.
- S. Park and D. Akinwande, IEEE Int. Electron Devices Meet., 2017, 5.2.1–5.2.4 Search PubMed.
- W. Wei, E. Pallecchi, M. Belhaj, A. Centeno, Z. Amaia, D. Vignaud and H. Happy, 2016 11th European Microwave Integrated Circuits Conference (EuMIC), 2016, pp. 165–168 Search PubMed.
- C.-H. Yeh, Y.-W. Lain, Y.-C. Chiu, C.-H. Liao, D. R. Moyano, S. S. H. Hsu and P.-W. Chiu, ACS Nano, 2014, 8, 7663–7670 CrossRef CAS PubMed.
- S. Sze and K. Ng, Physics of Semiconductor Devices, Wiley, 2006 Search PubMed.
- P. C. Feijoo, F. Pasadas, J. M. Iglesias, M. J. Martín, R. Rengel, C. Li, W. Kim, J. Riikonen, H. Lipsanen and D. Jiménez, Nanotechnology, 2017, 28, 485203 CrossRef PubMed.
Footnotes |
| † Electronic supplementary information (ESI) available. See DOI: 10.1039/d0na00953a |
| ‡ Pervasive Electronics Advanced Research Laboratory, CITIC, Universidad de Granada, 18071, Granada, Spain. |
| This journal is © The Royal Society of Chemistry 2021 |

