 Open Access Article
A “concentration-induced self-assembly” strategy for AgxH3−xPMo12O40 nanorods: synthesis, photoelectric properties and photocatalytic applications†
Xinxin
Wang
,
Yuting
Song
,
Fengyan
Li
 *,
Wenjuan
Xu
,
Yue
Zheng
and
Lin
Xu
 *
*
Key Laboratory of Polyoxometalates Science of Ministry of Education, College of Chemistry, Northeast Normal University, Changchun 130024, P. R. China. E-mail: linxu@nenu.edu.cn; lify525@nenu.edu.cn; Fax: +86-431-85099765; Tel: +86-431-85098760
First published on 26th November 2020
Abstract
Polyoxometalates (POMs) as molecule-based metal oxides have exhibited significant application in catalysis and materials science, but the synthesis of pristine POM nanomaterials still remains a challenge. In this work, we find a novel strategy of concentration-induced self-assembly for gaining pristine POM nanorods AgxH3−xPMo12O40 (denoted as AgHPMo12), which are synthesized only from both POMs and silver ion Ag+ in an aqueous solution at room temperature. The controllable concentrations of the cationic and anionic components in the aqueous solution become the critical factor for the successful synthesis. In addition, the photoelectric properties of AgHPMo12 nanorods were investigated as compared to those of AgHPMo12 particles, indicating a superior photoelectric performance of AgHPMo12 nanorods to AgHPMo12 particles. Furthermore, AgHPMo12 nanorods/phthalocyanine heterojunction photocatalysts were prepared for evaluating photocatalytic degradation of tetracycline hydrochloride, showing an efficient photocatalytic performance due to the advantages of the nanorods and type II heterostructure.
1. Introduction
As a well-known large family of transition metal oxide clusters, polyoxometalates (POMs) have recently attracted considerable attention due to their varieties of molecular structures, special properties and wide application in catalysis, medicine, materials science, electrocatalysis and solar cells.1–3,5 Specifically, POMs as molecule-based metal oxides have been demonstrated to possess semiconductor characteristics in both the solid state and solution.6,7 In general, POMs are easily soluble in water and some polar organic solvents, so POM-based photocatalytic functions are usually performed in homogeneous solutions.8–10 Homogeneous photocatalytic processes using POMs as molecular catalysts have been well documented, such as water splitting and the degradation of indigo dye.11,12 Although POMs as molecular catalysts exhibit good photocatalytic activity in homogeneous systems, the separation of catalysts from the reaction process and the solution stability of catalysts both become major problems for practical applications.Heterogeneous photocatalysis has currently become a widely used technique for various applications of renewable energy, organic synthesis and environmental pollution treatment.13–15 In view of its practical applications, heterogeneous photocatalysis is usually preferable due to the advantages of easy catalyst separation, being recyclable, and tunable active sites using the morphology and porosity. Therefore, in the past several decades, much effort was made to develop POM-based composite catalysts for heterogeneous photocatalysis. Yang and coworkers reported the preparation of nanoporous H3PW12O40/TiO2 composite catalysts for the photocatalytic degradation of dye pollutants, and the as-prepared photocatalyst exhibited visible-light photocatalytic activity to decompose ten kinds of organic dyes in aqueous systems.16 Zhao et al. successfully prepared a covalent combination of POM [PW11O39] clusters with macroporous graphitic carbon nitride through an organic linker strategy, and the hybrid catalyst g-C3N4-PW11 exhibited efficient catalytic performance for light-driven H2O2 production from H2O and O2.17
In heterogeneous photocatalytic reactions, nanoscale catalysts are more favorable because the nanometer dimensions allow photogenerated carriers to more easily reach the catalyst surface due to the decreased distance to the surface. Meanwhile, nanocatalysts have a much greater surface-to-volume ratio compared to bulk materials. Since photocatalytic reactions occur at the surface of catalysts, this means that a given mass of nanocatalysts will provide more reactive sites than the same mass of bulk materials. In nanoscale photocatalysts, one-dimensional (1D) morphologies provide a direct electrical pathway for photogenerated electrons so as to increase the electron transport rate; this certainly suppresses the electron–hole recombination as well as increases the photocatalytic activity. Nanorods as 1D nanomaterials have been well developed for use in different areas, such as functional components and catalysts.18–20 The elongated shape of nanorods should be favorable to charge separation after the electron transfer. For instance, time-resolved microwave conductivity measurements have revealed that TiO2 nanorods possess a rather long lifetime for photogenerated electrons, which might be ascribed to facile electron transport in the 1D morphology.21 Furthermore, when nanorods were aligned along the electric field direction, electrons and holes were pulled in opposite directions, towards the ends of the rods.22 The aforementioned results indicate that the design and preparation of new semiconductor nanorods should be highly desirable for photocatalytic applications.
Since POM clusters are mostly over 1 nm in diameter, POMs are generally considered as nano-molecules soluble in aqueous solutions. Therefore, the development of solid POM nanomaterials has been lagging behind, and the exploration of POM nanomaterials has become a current challenge. So far, a few studies have been conducted to develop solid POM nanomaterials. Misono et al. reported that polyoxotungstate (NH4)3PW12O40 nanoparticles were synthesized by homogeneous precipitation from an aqueous solution using hydrolysis of urea at 373 K.23 Wang and co-workers reported the preparation of Ag4SiW12O40 nanorods, hollow particles, microtubes and 3D-ordered tube systems by using the surfactant-assisted method, in which polyethylene glycol was used as a template and silver ion Ag+ was the counterion.24
In this work, we develop a novel strategy of concentration-induced self-assembly to synthesize AgxH3−xPMo12O40 (AgHPMo12) nanorods, and the pristine POM nanorods are synthesized only using both POMs and silver ion Ag+ in an aqueous solution at room temperature. And the photoelectric properties of AgHPMo12 nanorods were investigated as compared to those of AgHPMo12 particles, indicating a superior photoelectric performance of AgHPMo12 nanorods to AgHPMo12 particles. To evaluate the photocatalytic activity, AgHPMo12 nanorods/copper phthalocyanine (CuPc) heterojunction photocatalysts were prepared for photocatalytic degradation of tetracycline hydrochloride which can cause potential risk in living ecosystems through drinking water and the food chain. Due to the advantages of the nanorods and type II heterostructure, AgHPMo12 nanorods/CuPc nanocatalysts exhibited an efficient photocatalytic performance in the proof-of-concept experiments.
2. Experimental section
2.1. Materials
Silver nitrate (AgNO3), sodium sulfate (Na2SO4), phosphomolybdic acid (H3PMo12O40), tetracycline hydrochloride and anhydrous ethanol were purchased from Sinopharm Chemical Reagent Co. Ltd. (Shanghai, China). Cationic phthalocyanine Alcian blue-tetrakis(methyl pyridinium)chloride (CuPc) was purchased from Chroma. Terpineol was purchased from Aldrich. The water used in all the experiments was deionized to a resistivity of 18 MΩ cm−1. All purchased chemicals were used without further purification.2.2. Preparation of AgHPMo12 particles
First, phosphomolybdic acid was dried at 150 °C for 12 h to remove the crystallization water. Then, 20 ml of deionized water was placed in a beaker, to which 1 mmol phosphomolybdic acid was added. 5 mmol silver nitrate was then added. After stirring for 10 min at room temperature, a yellow precipitate was immediately formed. The obtained samples were filtered under reduced pressure, washed with deionized water three times and then dried at 50 °C. After the above procedures, AgxH3−xPMo12O40 (denoted as AgHPMo12) particles were obtained.2.3. Preparation of AgHPMo12 nanorods
1 mmol dehydrated phosphomolybdic acid was dissolved in 100 ml deionized water; then 5 mmol silver nitrate was added and reacted for 10 min under vigorous stirring. In contrast to the formation of AgHPMo12 particles, the yellow solution was still clear and transparent. After 5 hours, the flocculent precipitatate was separated from the solution. The precipitate was gathered by centrifugation and washed with water three times, followed by drying at 50 °C in an oven.2.4. Preparation of AgHPMo12 nanorods/CuPc
Hydrosoluble Alcian blue (0.02 g) in 30 ml deionized water was homogenized in an ultrasonic bath. Subsequently, the obtained AgHPMo12 nanorods (0.2 g) were scattered in it. After stirring for 30 min and ultrasonicating for 60 min, the compound precipitant was washed with water three times. After drying at 50 °C overnight, the AgHPMo12 nanorods/CuPc composite was obtained.2.5. Preparation of the photoanodes
Appropriate pastes of the AgHPMo12 particles, AgHPMo12 nanorods and AgHPMo12 nanorods/CuPc using terpineol and ethanol were prepared by a previously reported procedure.25 Then, the paste was coated onto a clean ITO-coated glass substrate to form a membrane via silkscreen printing and stoved at 80 °C for 10 min. Next, the ITO substrates decorated with different films were sintered at 150 °C for 60 min to enhance the interactions between the film and substrate. The thickness of the AgHPMo12 nanorods/CuPc composite film was about 8 μm (Fig. S2†).2.6. Characterization
The infrared spectrum (IR) was recorded with a Nicolet Magna 560 FT-IR Spectrometer. Field-emission scanning electron microscopy (FESEM, Hitachi SU-8010) was used to observe the surface and cross-section morphology. The element analysis for these samples was performed by using an energy dispersive spectrometer (EDS, Oxford X-MaxN80) attached to the FESEM. The UV-vis diffuse reflectance spectra were recorded with a UV-vis-NIR spectrophotometer (Varian). The photocurrent–time (I–t) curves, Mott–Schottky plots and electrochemical impedance spectra (EIS) were obtained at room temperature using a CHI660C electrochemical workstation (Shanghai Chenhua Instrument Corp, China) with a filtered 500 W xenon lamp (Beijing Perfectlight Technology Corp, China) under standard conditions (AM 1.5G, 100 mW cm−2). The EIS was acquired under xenon lamp irradiation (amplitude: 10 mV; frequency: 0.1 Hz to 100 kHz).3. Results and discussion
3.1. Nanomaterial synthesis
In the procedure of preparing the AgHPMo12 nanorods, the concentration of Ag+ and [PMo12O40]3− has a great influence on the morphology of the precipitate. During the preparation of AgHPMo12 nanomaterials, two distinct morphologies were fabricated through controlling the rate of precipitation. When 1 mmol phosphomolybdic acid and 5 mmol silver nitrate were mixed in 20 mL deionized water, the rapid precipitation of AgHPMo12 is inclined to form irregular particle shapes, while with a lower concentration of Ag+ and [PMo12O40]3− (1 mmol phosphomolybdic acid and 5 mmol silver nitrate in 100 mL deionized water), the AgHPMo12 nanorods were fabricated. In these two cases, the precipitate formed by Ag+ and PMo12O403− was not in the common molar ratio of 3![[thin space (1/6-em)]](https://www.rsc.org/images/entities/char_2009.gif) :
:![[thin space (1/6-em)]](https://www.rsc.org/images/entities/char_2009.gif) 1. Instead, it formed the composition of AgxH3−xPMo12O40 because some of the Ag+ ions were substituted by H+.
1. Instead, it formed the composition of AgxH3−xPMo12O40 because some of the Ag+ ions were substituted by H+.
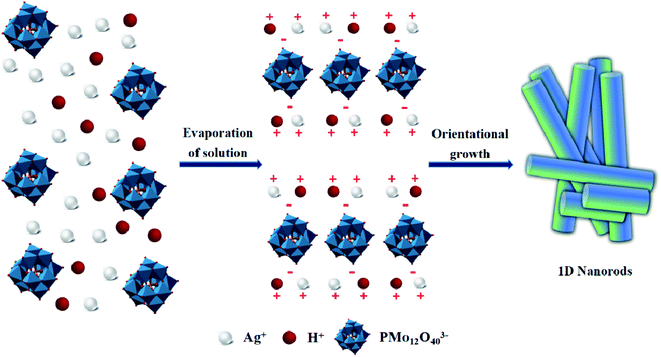
From the compared experimental results, we infer a plausible mechanism for the formation of AgHPMo12 nanorods as follows, in which the concentrations of the cationic and anionic components in solution become the critical factor. It was well known that under the conventional conditions the mixing of Ag+ and [PMo12O40]3− ions in an aqueous solution generally leads to precipitation due to a very low solubility product constant. At the conventional concentrations, through a supersaturation state in which the concentration exceeds the equilibrium value, rapid precipitation with the morphology of particles is prone to occur. In contrast, at very low concentrations, a supersaturation state cannot exist, and thus no precipitation appears in the solution. With slow evaporation of the aqueous solution to gradually increase concentration, a self-organizing process of AgHPMo12 nanorods occurs along with a spontaneous directional growth, which shows a decrease in the Gibbs free energy and is driven by both the electrostatic interaction and the matched concentration. The directional growth of these nanorods under evaporation of the solution is shown in Fig. 1.
To confirm the molecular composition of AgxH3−xPMo12O40, it was used for photocatalytic degradation of methylene blue and rhodamine B and obvious adsorption occurred during the photocatalytic process. AgHPMo12 could dissociate H+ in the solution, causing PMo12O403− to be exposed on the surface of the nanorods, which would result in the precipitate covered with negative charges thus adsorbing cationic dyes. Hence, AgHPMo12 in deionized water could dissociate H+ and make the solution acidic. To further prove this, AgHPMo12 nanorods (0.1 g) were dissolved in 30 mL water and stirred vigorously for 1 h, and the pH of the mixture was 4.06. Acidity of the solution was the forceful evidence to affirm the composition of AgxH3−xPMo12O40, where some Ag+ was substituted by H+. Alcian blue, a kind of typical cationic dye of cationic copper(II) phthalocyanine, has shown superior photovoltaic and electrochemical characteristics by virtue of its highly delocalized cyclic π-electron systems.26 The AgHPMo12 nanorods/CuPc composites exactly utilize intensive electrostatic adsorption to combine the AgHPMo12 nanorods and cationic CuPc together, and this combination is quite stable. To verify the stability of the composite, 0.1 g AgHPMo12 nanorods/CuPc was dispersed in 50 mL deionized water and stirred for 12 h, and the absorbance of the supernatant was measured using a UV-Vis spectrophotometer. The results demonstrate that there are no peaks for the two components, which proves the stability of the AgHPMo12 nanorods/CuPc composite. The preparation processes of the AgHPMo12 particles, AgHPMo12 nanorods, and AgHPMo12 nanorods/CuPc samples are illustrated in Fig. 2. In addition, we have also made another attempt to replace Ag+ with NH4+ using the same method of concentration-induced self-assembly. We found that the formation of (NH4)3PMo12O40 nanoparticles with a regular dodecahedron structure could be achieved preliminarily. These results indicate that the concentration-induced self-assembly is an effective strategy to synthesize pristine POM nanomaterials. Based on these research results, we will continue to explore the effects of concentrations and counter cations on the morphology of POM nanomaterials, and the systematic design and experimental investigation are in progress by our group.
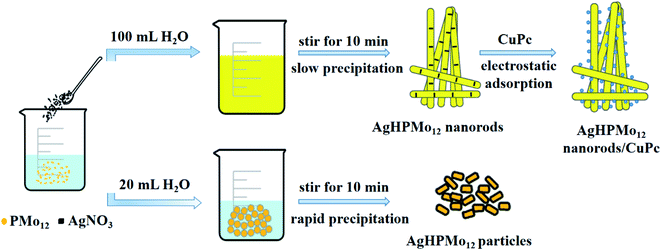 | ||
| Fig. 2 Schematic process for the preparation of AgHPMo12 particles, AgHPMo12 nanorods and AgHPMo12 nanorods/CuPc. | ||
3.2. IR spectroscopy and XRD analysis of materials
The IR spectra were used to examine the structural stability of the AgHPMo12 nanorods. Fig. S7† shows the IR spectra of pure CuPc, AgHPMo12 nanorods and the AgHPMo12 nanorods/CuPc. For the AgHPMo12 nanorods/CuPc composites, the characteristic peaks at 1605, 1409, and 1192 cm−1 could be attributed to υas (C![[double bond, length as m-dash]](https://www.rsc.org/images/entities/char_e001.gif) N), υas (C
N), υas (C![[double bond, length as m-dash]](https://www.rsc.org/images/entities/char_e001.gif) C), and υas (Ar–H) in CuPc, respectively.27 The PMo12 is a Keggin structure, and the four characteristic bands at 1059, 953, 855 and 758 cm−1 are assigned to the υas (P–Oa), υas (Mo–Od) υas (Mo–Ob–Mo), and υas (Mo–Oc–Mo), respectively. The AgHPMo12 nanorods/CuPc curves exhibited characteristic bands for the AgHPMo12 nanorods and CuPc, suggesting that the Keggin structure of the AgHPMo12 nanorods was retained in the nanocomposites.
C), and υas (Ar–H) in CuPc, respectively.27 The PMo12 is a Keggin structure, and the four characteristic bands at 1059, 953, 855 and 758 cm−1 are assigned to the υas (P–Oa), υas (Mo–Od) υas (Mo–Ob–Mo), and υas (Mo–Oc–Mo), respectively. The AgHPMo12 nanorods/CuPc curves exhibited characteristic bands for the AgHPMo12 nanorods and CuPc, suggesting that the Keggin structure of the AgHPMo12 nanorods was retained in the nanocomposites.
The phase identification of the AgHPMo12 nanorods was carried out by X-ray diffraction (XRD) (Fig. S6†). The peaks of 13.40°, 17.80°, 27.10°, 28.51°, 30.56°, 32.50°, 35.12° and 47.91° (marked with #) can be indexed to the diffraction planes of AgHPMo12 (JCPDS no. 39-0045) (200), (210), (220), (103), (203), (321), (501) and (414), respectively. The AgHPMo12 nanorods exhibit sharp and intense diffraction peaks, indicating an enhancement in crystallinity.
3.3. Morphology and composition
The morphology of AgHPMo12 particles, AgHPMo12 nanorods and AgHPMo12 nanorods/CuPc was explored in detail by scanning electron microscopy (SEM). Fig. 3a shows the SEM diagrams of AgHPMo12 particles, which indicates that the as-prepared AgHPMo12 particle sample has irregular particles. As shown in Fig. 3b and c, the AgHPMo12 nanorod samples are composed of nanorods with a uniform shape and size. The average diameter of the nanorods is about 30 ± 10 nm, and their length is as long as 1–3 μm in size. Through electrostatic adherence interactions, AgHPMo12 nanorods/CuPc has been formed. As shown in Fig. 3d, it could be seen that many small CuPc nanoparticles are deposited in situ, and are uniformly anchored on the surface of AgHPMo12 nanorods. In Fig. S1(b and c†), the HRTEM image reveals the existence of crystal lattices of AgHPMo12 nanorods, and the lattice diffraction fringe with a lattice plane distance of 0.290 nm can be ascribed to AgHPMo12 nanorods. The SAED pattern in Fig. S1(d†) shows concentric diffraction rings, indicating that AgHPMo12 nanorods are polycrystalline with a high crystallinity. From a photocatalytic point of view, such polycrystalline AgHPMo12 nanorods, together with their one-dimensional morphology, should be favorable for the separation and transfer of the photogenerated holes and electrons. The compositions of AgHPMo12 nanorods and AgHPMo12 nanorods/CuPc were also proved via EDX analysis (Fig. S3†). Fig. 3e and f reveal the signals of Ag, P, Mo and O elements, indicating the existence of AgHPMo12. Fig. 3f shows the signals of C, N and Cu elements, which demonstrate the existence of CuPc. Owing to different morphologies and dimensions, AgHPMo12 nanorods and AgHPMo12 appear in different colors (Fig. S5†).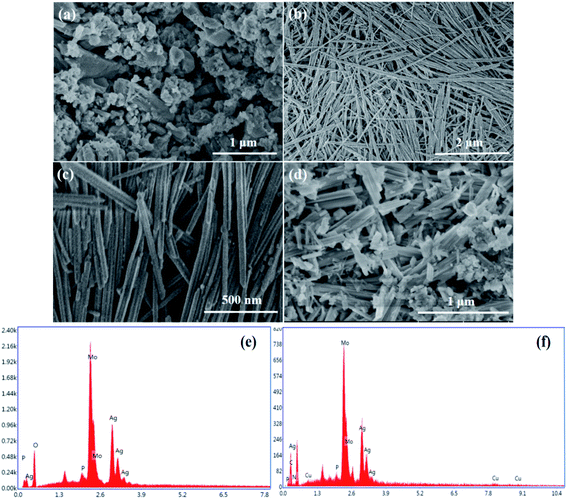 | ||
| Fig. 3 The morphology of AgHPMo12 particles (a), AgHPMo12 nanorods (b, c) and AgHPMo12 nanorods/CuPc (d). EDX image of the AgHPMo12 nanorod sample (e) and AgHPMo12 nanorods/CuPc (f). | ||
3.4. Optical properties and band structure
UV-vis diffuse reflectance spectroscopy is an important analytical tool for characterizing the optical properties of AgHPMo12 nanorods. Fig. 4a shows the UV-vis spectrum of pure AgHPMo12 nanorods. The sample shows broad absorption bands in the UV region. In addition, it is a very convenient and reliable method to obtain the optical band gap (Eg).28Eg (Fig. 4b) was determined by extrapolation from the linear portion of the absorption edge in a plot of the Kubelka–Munk function F against energy E:| E = 1240/λ, | (1) |
 | (2) |
| ENHE = EAg/AgCl + 0.197 | (3) |
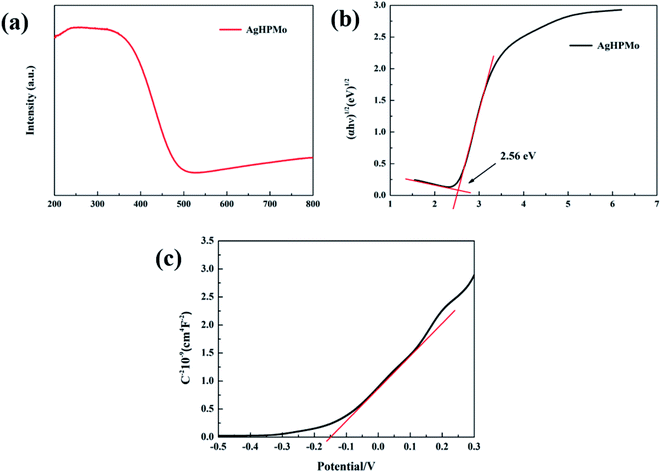 | ||
| Fig. 4 (a) UV-Vis absorption spectra of the AgHPMo12 nanorods; (b) the curves of (ahν)1/2versus hν for the AgHPMo12 nanorods. (c) The Mott–Schottky plot for AgHPMo12 nanorods. | ||
Therefore, the ECB of AgHPMo12 nanorods could be calculated from the Mott–Schottky plot of AgHPMo12 nanorods, and is about −0.14 eV. In addition, the valence band (VB) edge and conduction band (CB) edge position of AgHPMo12 nanorods could be calculated according to an empirical eqn (4)
| ECB = EVB − Eg | (4) |
3.5. Photoelectrochemical properties
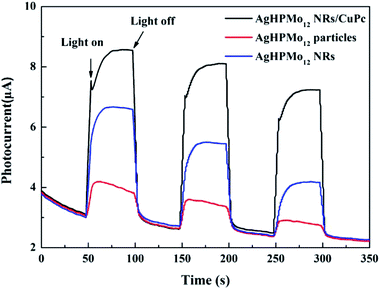
Photoelectrochemical experiments were performed in a three-electrode cell with a sample film electrode as the working electrode, platinum wire as the counter electrode, and Ag/AgCl (saturated KCl solution) as the reference. The electrolyte solution is 0.5 M Na2SO4 during each measurement. The transient photocurrent test can effectively evaluate the light absorption and conversion capacity of photocatalytic materials.30 It was carried out for several on–off cycles with no constant bias. As seen in Fig. 5, all the samples show an obvious photocurrent response under the alternate illumination of a xenon lamp for 50 s. Among all the prepared samples, the AgHPMo12 nanorods/CuPc sample displayed the strongest transient photocurrent intensity. The order of photocurrent intensity is as follows: AgHPMo12 nanorods/CuPc > AgHPMo12 nanorods >AgHPMo12 particles. This indicates that the formation of the AgHPMo12 nanorods/CuPc heterostructure could slow down the recombination speed of photoinduced electrons and holes. In addition, compared with AgHPMo12 particles, AgHPMo12 nanorods have higher photoactivity and separation efficiency of the photogenerated electron–hole pairs due to their direct electrical pathway for the photogenerated electrons. What's more, the introduction of the CuPc effectively solves the problem of fast recombination of the photo-generated charges in the POMs to a certain degree.To further explore the transfer resistance and separation efficiency of charge carriers, EIS measurements of AgHPMo12 particles, AgHPMo12 nanorods and AgHPMo12 nanorods/CuPc electrodes were obtained in the frequency scan from 0.1 Hz to 100 kHz under illumination. The EIS data were detected by using a three-electrode cell system, where the charge transfer kinetics on the working electrode could be demonstrated by the arc in Nyquist plots.31Fig. 6 reveals the interfacial electronic transfer rate of each sample, which is almost consistent with the order of photocurrent intensity. It is shown that the semi-arc of the nanorod sample is smaller than that of particles and the interfacial electron transfer rate for the nanorods is faster than that of particles. The AgHPMo12 nanorods/CuPc sample shows the smallest radius, implying the minimum electron transfer resistance and the fastest interfacial electron transfer rate. In other words, the addition of CuPc into the AgHPMo12 nanorod film can effectively delay the rapid recombination of the photoelectron–hole pairs. In addition, the electrical conductivities of AgHPMo12 particles and nanorods are also investigated (Fig. S8 and Table S1†), considering that the electrical conductivity may be a factor affecting the photoelectric properties of the solid materials. The electrical conductivity of AgHPMo12 nanorods is obviously higher than that of AgHPMo12 particles, suggesting that the charge-transfer pathways in AgHPMo12 nanorods are superior to those in AgHPMo12 particles.
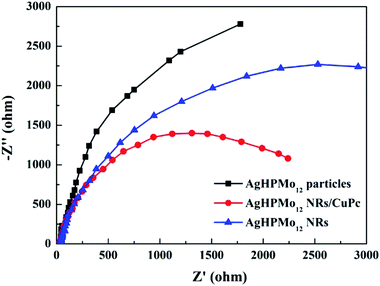 | ||
| Fig. 6 Electrochemical impedance spectra of the AgHPMo12 particle electrode, the AgHPMo12 nanorod electrode and the AgHPMo12 nanorods/CuPc electrode under simulated sunlight. | ||
3.6. Photocatalytic activity
As the second most used antibiotic, tetracycline has been used as a broad-spectrum antibacterial agent for human and animal health, leading to a large amount of residues in aquatic and soil environments, which in turn threatens human health for appearance of drug-resistant bacteria and clinical side effects on the liver and kidneys. Therefore, it is essential to exploit cost-efficient and feasible treatment approaches to remove these contaminations in aquatic environments. The photocatalytic degradation of tetracycline hydrochloride (TH) was selected as the model to assess the photocatalytic performance of these samples. The photocatalyst (50 mg) was dispersed in 50 mL TH solution (20 mg L−1), and the suspension solution was stirred in the dark to achieve the adsorption–desorption equilibrium. The photocatalytic experiments were carried out using a 500 W xenon lamp (simulated sunlight). The incident intensity of the light was 100 mW cm−2. It was turned on for 30 min prior to irradiation to guarantee a stable light intensity. Then the photocatalytic degradation experiment of TH was conducted for 180 min under irradiation. At an interval of 30 min, 4 mL of the suspension was collected and centrifuged to remove the particles, and then the supernatant liquid was analyzed on a UV-Vis spectrophotometer (Fig. S4†). As shown in Fig. 7, the degradation rate of TH with different samples is as follows: AgHPMo12 nanorods/CuPc > AgHPMo12 nanorods >AgHPMo12 particles. AgHPMo12 nanorods/CuPc exhibits the best degradation ability to TH than the others. The degradation rate of TH over AgHPMo12 particles and AgHPMo12 nanorods is only 29% and 40%, respectively, while the degradation rate on the AgHPMo12 nanorods/CuPc sample reached 61%. Compared with that of AgHPMo12 particles, the increased catalytic performance of AgHPMo12 nanorods might due to that the elongated shape of nanorods should be favorable to charge separation after the electron transfer. The 1D structure is beneficial for the photocatalytic degradation, while the photogenerated electrons of AgHPMo12 particles have a lower transfer rate and a higher recombination rate, which is not conducive to the photocatalytic degradation of the TH. In addition, AgHPMo12 nanorods/CuPc exhibits the highest degradation efficiency for TH degradation, indicating the existence of the synergistic effect between AgHPMo12 nanorods and CuPc.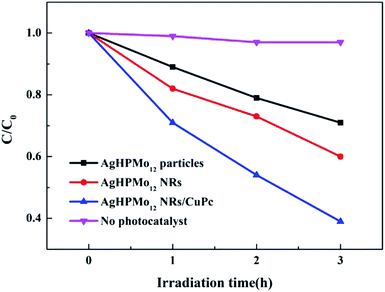 | ||
| Fig. 7 Photocatalytic degradation of tetracycline hydrochloride (TH) using AgHPMo12 particles, AgHPMo12 nanorods and AgHPMo12 nanorods/CuPc samples as photocatalysts. | ||
3.7. Photocatalytic mechanism
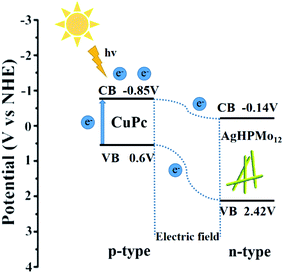
On the basis of the above results, the possible mechanisms for the photodegradation of TH over these samples have been proposed. The band gap Eg of AgHPMo12 is estimated to be 2.56 eV from the UV-vis diffuse reflectance spectra of AgHPMo12 nanorods. The CB value of AgHPMo12 could be estimated according to the Mott–Schottky test result of AgHPMo12 nanorods, and it is about −0.14 eV. Therefore, the VB value of AgHPMo12 is 2.42 eV (E(VB) = E(CB) + Eg). Compared with AgHPMo12 particles, AgHPMo12 nanorods have a higher photocatalytic degradation rate of TH. Nanorods with regular and uniform shapes are more sensitive to light and transfer electrons and holes more effectively. The photocatalytic mechanism for the photochemical processes is shown in Fig. 8. It is important to discuss the mechanism of the enhanced photocatalytic activity of AgHPMo12 nanorods/CuPc. The conduction band (CB) level of CuPc is −0.85 V vs. NHE. CuPc is a p-type semiconductor32 and AgHPMo12 is a typical n-type semiconductor as seen from the Mott–Schottky plot. When CuPc comes into contact with AgHPMo12 nanorods to form a p–n heterojunction, the potential of the CuPc layer is higher than that of the AgHPMo12 layer, and the electrons from the CuPc are transferred to the AgHPMo12 through the preformed electron delivery channel, resulting in the region of AgHPMo12 to be negatively charged, and CuPc to be positively charged. At the same time, the energy band of CuPc moves down and the band of AgHPMo12 moves up in the process until the Fermi energy levels reach equilibrium. An internal electric field directed from CuPc to AgHPMo12 is simultaneously established. Under irradiation, the CuPc molecules as photosensitizers absorb visible light, on account of the presence of the internal electric field, and the photoinduced electrons transfer from the conduction band (CB) of CuPc into the CB of AgHPMo12. However, the h+ can only stay on the VB of CuPc, because the VB potential of CuPc is higher than that of AgHPMo12. This process increases the efficient dissociation of excited electron–hole pairs. The excited electrons and holes migrate to the surface and react with absorbed electron donors and electron acceptors, respectively. The h+ can partially oxidize TH and achieve effective degradation of the tetracycline antibiotic.4. Conclusion
In summary, we have developed a new approach of concentration-induced self-assembly to synthesize pristine POM nanorods AgHPMo12. The synthesis approach is easy and environment-friendly, and only depends on the mixing of [PMo12O40]3− anions and Ag+ cations in an aqueous solution at room temperature. The concentrations of the cationic and anionic components in solution play a key role in the formation of AgHPMo12 nanorods. Through a slow evaporation of the aqueous solution to increase the concentration, a spontaneous directional growth of AgHPMo12 nanorods occurs; this growth process causes a decrease in Gibbs free energy and is driven by both the electrostatic interaction and the matched concentration. In addition, the investigation on the photoelectric properties of AgHPMo12 nanorods demonstrates a superior photoelectric performance of AgHPMo12 nanorods to AgHPMo12 particles, suggesting that the 1D morphology provides a direct electrical pathway for the photogenerated electron transport. Furthermore, AgHPMo12 nanorods/CuPc heterojunction photocatalysts were prepared for evaluating the photocatalytic activity, and the photocatalytic degradation of tetracycline hydrochloride was carried out. Because of the advantages of the nanorods and type II heterostructure, AgHPMo12 nanorods/CuPc nanocatalysts exhibited an efficient photocatalytic performance. These results provide a new insight into exploration of effective methods to prepare pristine POM nanomaterials for practical applications.Conflicts of interest
There are no conflicts to declare.Acknowledgements
The authors are thankful for the financial support from the Natural Science Foundation of China (Grant No. 21671035 and 22071018).References
- H. N. Miras, J. Yan, D.-L. Long and L. Cronin, Chem. Soc. Rev., 2012, 41, 7403–7430 RSC.
- S.-S. Wang and G.-Y. Yang, Chem. Rev., 2015, 115, 4893–4962 CrossRef CAS.
- A. Bijelic, M. Aureliano and A. Rompel, Angew. Chem., Int. Ed., 2019, 58, 2980–2999 CrossRef CAS.
- M. Xu, T. Wang, F. Li, W. Xu, Y. Zheng and L. Xu, Chem. Commun., 2020, 56, 1097–1100 RSC.
- T. Wang, T. Ji, W. Chen, X. Li, W. Guan, Y. Geng, X. Wang, Y. Li and Z. Kang, Nano Energy, 2020, 68, 104349 CrossRef CAS.
- A. Hiskia, A. Mylonas and E. Papaconstantinou, Chem. Soc. Rev., 2001, 30, 62–69 RSC.
- W. Chen, L. Huang, J. Hu, T. Li, F. Jia and Y.-F. Song, Phys. Chem. Chem. Phys., 2014, 16, 19668–19673 RSC.
- S. J. Folkman, J. Soriano-Lopez, J. R. Galán-Mascarós and R. G. Finke, J. Am. Chem. Soc., 2018, 140, 12040–12055 CrossRef CAS.
- Y.-L. Shi, W. Qiu and Y. Zheng, J. Phys. Chem. Solids, 2006, 67, 2409–2418 CrossRef CAS.
- E. Gkika, A. Troupis, A. Hiskia and E. Papaconstantinou, Appl. Catal., B, 2006, 62, 28–34 CrossRef CAS.
- Z. Huang, Z. Luo, Y. V. Geletii, J. W. Vickers, Q. Yin, D. Wu, Y. Hou, Y. Ding, J. Song, D. G. Musaev, C. L. Hill and T. Lian, J. Am. Chem. Soc., 2011, 133, 2068–2071 CrossRef CAS.
- S. Fujimoto, J. M. Cameron, R.-J. Wei, K. Kastner, D. Robinson, V. Sans, G. N. Newton and H. Oshio, Inorg. Chem., 2017, 56, 12169–12177 CrossRef CAS.
- A. D. Handoko, S. N. Steinmann and Z. W. Seh, Nanoscale Horiz., 2019, 4, 809–827 RSC.
- T. P. Yoon, M. A. Ischay and J. Du, Nat. Chem., 2010, 2, 527–532 CrossRef CAS.
- X. Pan, M.-Q. Yang, X. Fu, N. Zhang and Y.-J. Xu, Nanoscale, 2013, 5, 3601–3614 RSC.
- Y. Yang, Q. Wu, Y. Guo, C. Hu and E. Wang, J. Mol. Catal. A: Chem., 2005, 225, 203–212 CrossRef CAS.
- S. Zhao, X. Zhao, H. Zhang, J. Li and Y. Zhu, Nano Energy, 2017, 35, 405–414 CrossRef CAS.
- M. Samadi, M. Zirak, A. Naseri, M. Kheirabadi, M. Ebrahimi and A. Z. Moshfegh, Res. Chem. Intermed., 2019, 45, 2197–2254 CrossRef CAS.
- F. Cheng, H. Wang, Z. Zhu, Y. Wang, T. Zhang, Z. Tao and J. Chen, Energy Environ. Sci., 2011, 4, 3668–3675 RSC.
- X. Zhang, F. Cheng, J. Yang and J. Chen, Nano Lett., 2013, 13, 2822–2825 CrossRef CAS.
- Y. Yamazaki, K. Azami, R. Katoh and S. Yamazaki, ACS Appl. Nano Mater., 2018, 1, 5927–5935 CrossRef CAS.
- E. Rothenberg, M. Kazes, E. Shaviv and U. Banin, Nano Lett., 2005, 5, 1581–1586 CrossRef CAS.
- T. Ito, K. Inumaru and M. Misono, Chem. Mater., 2001, 13, 824–831 CrossRef CAS.
- Z. Kang, E. Wang, M. Jiang, S. Lian, Y. Li and C. Hu, Eur. J. Inorg. Chem., 2003, 2003, 370–376 CrossRef.
- D. Karimian, B. Yadollahi, M. Zendehdel and V. Mirkhani, RSC Adv., 2015, 5, 76875–76882 RSC.
- Z. Sun, S. Fang, F. Li, L. Xu, Y. Hu and J. Ren, J. Photochem. Photobiol., A, 2013, 252, 25–30 CrossRef CAS.
- V. Zucolotto, M. Ferreira, M. R. Cordeiro, C. J. L. Constantino, W. C. Moreira and O. N. Oliveira, Sens. Actuators, B, 2006, 113, 809–815 CrossRef CAS.
- U. Pal, D. Samanta, S. Ghorai and A. K. Chaudhuri, J. Appl. Phys., 1993, 74, 6368–6374 CrossRef CAS.
- D. Lang, F. Cheng and Q. Xiang, Catal. Sci. Technol., 2016, 6, 6207–6216 RSC.
- R.-B. Wei, P.-Y. Kuang, H. Cheng, Y.-B. Chen, J.-Y. Long, M.-Y. Zhang and Z.-Q. Liu, ACS Sustainable Chem. Eng., 2017, 5, 4249–4257 CrossRef CAS.
- S. J. Hong, S. Lee, J. S. Jang and J. S. Lee, Energy Environ. Sci., 2011, 4, 1781–1787 RSC.
- N. T. Boileau, O. A. Melville, B. Mirka, R. Cranston and B. H. Lessard, RSC Adv., 2019, 9, 2133–2142 RSC.
Footnote |
| † Electronic supplementary information (ESI) available. See DOI: 10.1039/d0na00816h |
| This journal is © The Royal Society of Chemistry 2021 |

