
 Open Access Article
 This Open Access Article is licensed under a Creative Commons Attribution-Non Commercial 3.0 Unported Licence
Cell-imprinted substrates: in search of nanotopographical fingerprints that guide stem cell differentiation†
Khorshid
Kamguyan
a,
Saeed
Zajforoushan Moghaddam
 a,
Abolfazl
Nazbar
b,
Seyyed Mohammad Amin
Haramshahi
b,
Shiva
Taheri
b,
Shahin
Bonakdar
*b and
Esben
Thormann
*a
a,
Abolfazl
Nazbar
b,
Seyyed Mohammad Amin
Haramshahi
b,
Shiva
Taheri
b,
Shahin
Bonakdar
*b and
Esben
Thormann
*a
aDepartment of Chemistry, Technical University of Denmark, 2800, Kgs. Lyngby, Denmark. E-mail: esth@kemi.dtu.dk
bNational Cell Bank Department, Pasteur Institute of Iran, 1316943551, Tehran, Iran. E-mail: sh_bonakdar@pasteur.ac.ir
First published on 8th December 2020
Abstract
Cell-imprinted substrates direct stem cell differentiation into various lineages, suggesting the idea of lineage-specific nanotopography. We herein examined the surface topography of five different imprinted cell patterns using AFM imaging and statistical analysis of amplitude, spatial, and hybrid roughness parameters. The results suggest that different cell imprints possess distinguished nanotopographical features.
Stem cells can self-renew, proliferate, and differentiate into various other cell lineages.1 The functioning of the cells in their natural environment is dictated by the chemical and physical cues provided by the extracellular matrix (ECM).2 There is a growing interest in developing biomaterials that can control cell behavior and differentiation in both in vitro and in vivo environments. It has been recently proposed that substrates with designed micro- and nanotopography could modulate stem cell fate.3–5 The idea is that cells can perceive the topographical cues from the macro-, micro-, and nanoscale features in their environment and transmit that information to their nucleus as biochemical signals.6 Accordingly, several studies developed substrates decorated with nanotopographical features of controlled geometry and arrangement, promoting stem cell differentiation.7–11 Substrates with fabricated patterns of nanopillars,12 nanogrooves/gratings,13 and nanopits14 with optimized geometries could selectively guide stem cell fate. For instance, Dalby et al. fabricated substrates comprising nanopits of 120 nm diameter, 100 nm depth, with ordered and disordered square or hexagonal patterns to stimulate osteogenesis in human mesenchymal stem cells.15 In particular, nanopits with a controlled disorder of 50 nm from the true center led to notably high levels of bone cell markers.
Another recent approach in topographical stimulation is to develop biomimetic substrates with the imprinted pattern of the target cells.16–19 Accordingly, a substrate that can simulate the natural niche of the target cells can induce specific signals leading to a change in phenotype. For instance, Mahmoudi et al. utilized cell-imprinted substrates to induce chondrogenesis, suggesting that stem cells respond to the pattern of native chondrocytes imprinted on their culture substrate.20 Follow-up studies have revealed that stem cells cultured on substrates with the imprinted patterns of keratinocytes,21 myoblasts,22 and tenocytes/chondrocytes23 demonstrate significant upregulation of the corresponding marker genes. We recently demonstrated that polydimethylsiloxane (PDMS) substrates with the imprinted pattern of osteoblasts can stimulate stem cell osteogenic differentiation.24 It was, in particular, observed that although stem cells and osteoblasts possess quite similar microscale morphologies, they possess different nanoscale features. Notably, the elemental analysis of the surfaces indicated no trace of chemical or biological residues, ruling out the possibility of chemically induced differentiation. Thus, lineage-specific nanotopography may be the possible stimulus for the change in phenotype and fate of stem cells.
To test this hypothesis, we herein aim to quantify and compare the nanotopography of different cell-imprinted substrates, looking for nanoscale fingerprints on each pattern. Substrates with the imprinted patterns of five spindle-like cell types; i.e. adipose-derived stem cells (ADSC), osteoblasts, fibroblast-like chondrocytes (FLC), SW 1353 chondrosarcoma cells, and tenocytes were fabricated. All these cell-imprinted substrates (except SW 1353 chondrosarcoma) have been formerly utilized to stimulate stem cell differentiation.23 The cell-imprinted substrates were fabricated using the previously reported method.20 In brief, a mixture of PDMS resin and hardener is cast on the chemically fixed cell culture; once the resin is cross-linked, it is peeled off and washed thoroughly to remove all the biological debris. The surface topography of the cell-imprinted substrates was then examined using atomic force microscopy (AFM) imaging in contact mode. Adopting a top-down approach (Fig. 1), we obtained topography images of the imprints of single cells and their nucleus area, followed by a thorough roughness analysis (details of the experimental methods and roughness analysis are available in the ESI†).
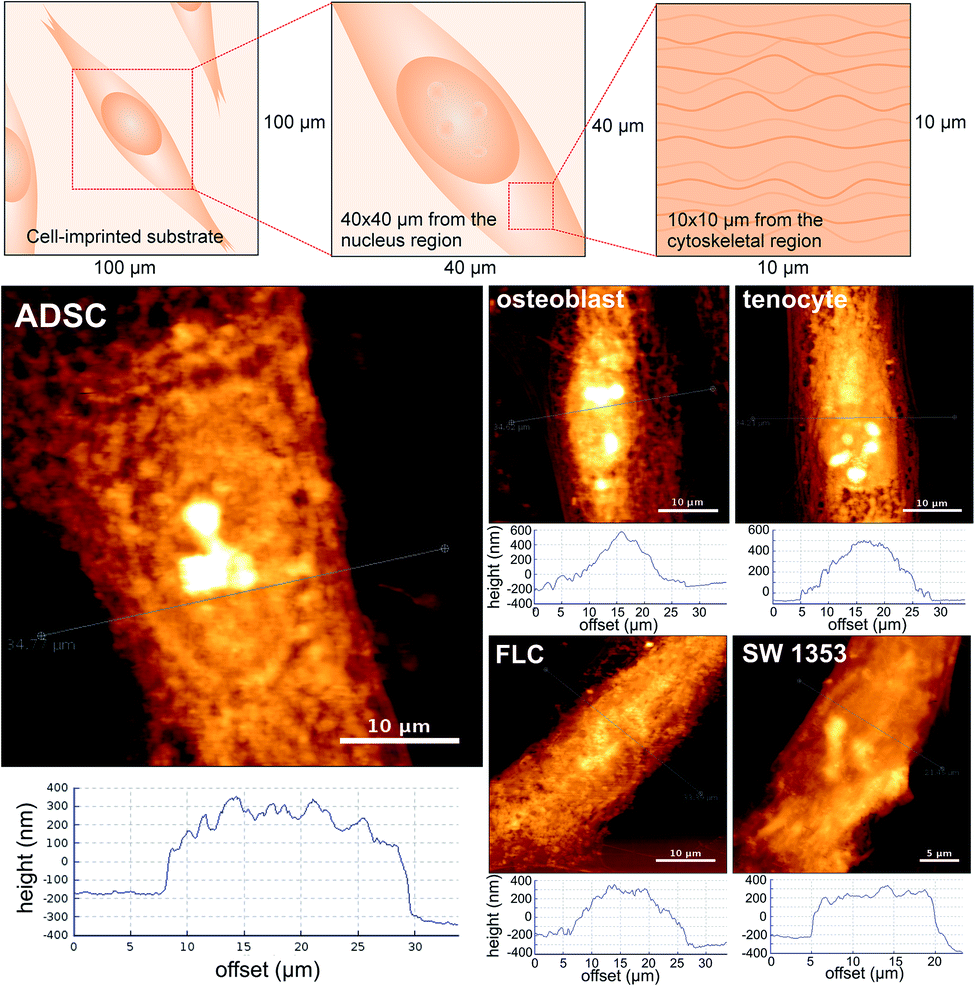 | ||
| Fig. 1 Height profiles and AFM images of the cell-imprinted substrates (nucleus region) fabricated from fixed cultures of adipose-derived stem cells (ADSC), osteoblast, fibroblast-like chondrocyte (FLC), SW 1353 chondrosarcoma, and tenocyte cells (reversed height images are presented for a better visual perception). | ||
All the investigated cellular patterns possess a similar spindle-like and elongated morphology, which makes them almost indistinguishable in microscale (ESI, Fig. S1†). Fig. 1 depicts the AFM images (40 μm × 40 μm) and the representative height profiles from the nucleus area of the single cell patterns. According to the height profiles, despite similar spindle-like morphology, the cellular patterns differ in the cross-section shape. For instance, the imprinted stem cells possess a more rectangular side view shape, whereas the osteoblasts have a more triangular cross-section shape. Notably, the population within each cell type shows variations in terms of depth and width of the cross-section profile; nevertheless, the cross-sectional shape appears to be exclusive for each cell type. To investigate the nanotopographical differences, AFM images (10 μm × 10 μm) from the region of the cell patterns correlated with the cytoskeleton were obtained (Fig. 2). The nanotopographies of the cellular imprints differ, as seen from the roughness (height) profiles. These differences can be quantitatively assessed using roughness parameters calculated for the topography images (20 images for each cellular pattern). Since these substrates are made of the same material and the imprints are from cells of similar morphology, customary roughness parameters, e.g., average roughness may not render detailed information on the topographical differences. Hence, we conducted a thorough roughness analysis using a set of nine standard roughness parameters.
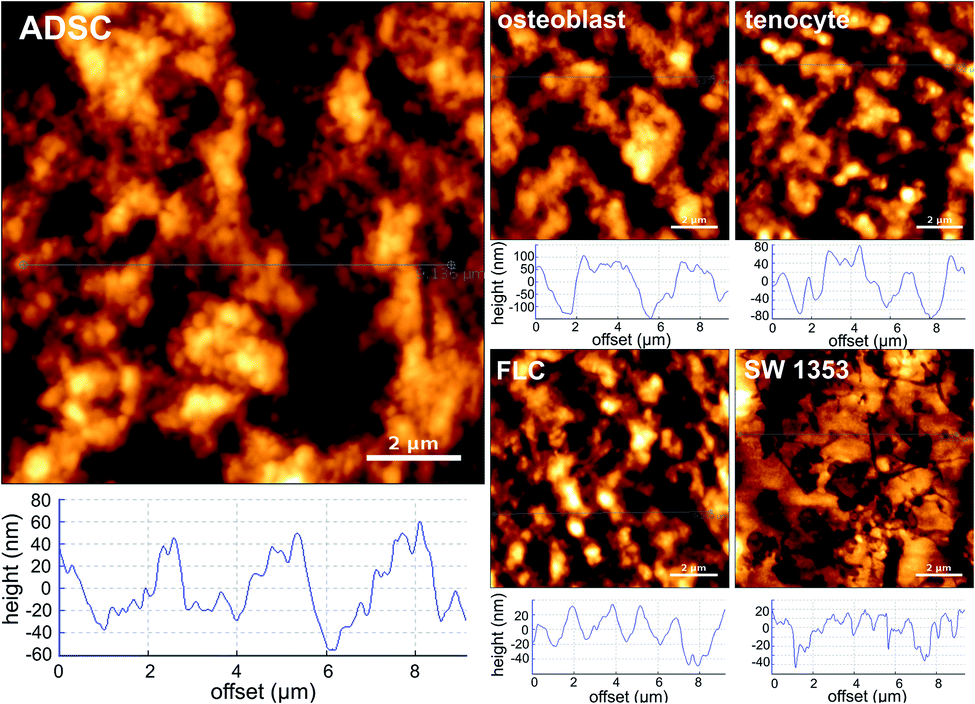 | ||
| Fig. 2 Height profiles and AFM images of the cell-imprinted substrates (cytoskeleton region) fabricated from fixed cultures of adipose-derived stem cells (ADSC), osteoblast, fibroblast-like chondrocyte (FLC), SW 1353 chondrosarcoma, and tenocyte cells. | ||
The roughness profiles can be described as high frequency (short wavelength) fluctuations in the surface height characterized by asperities (local maxima) and valleys (local minima) of varying amplitude and spacing. The surface roughness can be characterized using three types of roughness parameters, i.e., amplitude parameters, spatial parameters, and hybrid parameters.25–27 The amplitude parameters measure the vertical characteristics of the surface deviations and describe major height properties such as the statistical average, the shape, and extreme peak/valley parameters of the height distribution. We have herein utilized the following amplitude roughness parameters: root-mean-square deviation of the surface (Sq), skewness of surface height distribution (Ssk), and kurtosis of surface height distribution (Sku) (detailed information on each roughness parameter is provided in the ESI†). The spatial (spacing) parameters quantify the horizontal characteristics (e.g., the rapidity at which the height varies over horizontal distance) of the surface deviations within the sampling area. These parameters can describe high spot density and texture strength (e.g., anisotropy and directionality) and can be useful to distinguish between highly textured and random surface structures. Herein, the following spatial parameters are employed: fastest decay autocorrelation length (Scl20), texture aspect ratio (Str20), and density of summits (Sds). The hybrid parameters are based on a combination of amplitude and spatial surface properties. These parameters specify hybrid aspects of the surface roughness, e.g., slope of the surface topography, curvature of the high spots, and interfacial area of surface, which relate to physical attributes such as surface energy, adhesion, and friction.28 The parameters included herein are the root-mean-square slope of the surface (Sdq), developed surface area ratio (Sdr), and arithmetic mean summit curvature of the surface (Ssc).
Fig. 3 compares the roughness parameters for the cell-imprinted substrates (obtained from 20 AFM images of 10 μm × 10 μm size). The amplitude roughness parameters are summarized in the first row. The root mean square roughness (Sq) represents the standard deviation of the distribution of surface heights. Based on this parameter, the nanoscale patterns on each of the cell-imprinted substrates are quite distinguishable with significant differences from the stem cell-imprinted substrate. Accordingly, the osteoblast-imprinted substrate exhibits a relatively larger root mean square roughness compared to the stem cell-imprinted substrate, whereas the other patterned substrates (in particular SW 1353) demonstrate a smaller average ordinate roughness. Surface skewness (Ssk) is a measure of the asymmetry of the height distribution about the mean plane. Accordingly, a skewness value of zero represents a Gaussian (symmetrical) height distribution, a positive value indicates a surface with peaks dominating (distribution skewed above the mean plane), and a negative value refers to more pits (distribution skewed below the mean plane). All the cell-imprinted substrates (except SW 1353) demonstrate an average skewness value around zero, suggesting a rather symmetrical roughness profile. Notably, these surfaces exhibit heterogeneous nature as both negative and positive skewness values are obtained. Contrarily, SW 1353 represents a relatively negative average skewness value suggesting an asymmetric profile with the domination of valleys. Surface kurtosis (Sku) is a measure of the peakedness or sharpness of the height distribution profile. Accordingly, kurtosis values smaller than 3 represent a platykurtic profile with relatively few high peaks and low valleys, while kurtosis values larger than 3 represent a leptokurtic surface with relatively many high peaks and low valleys. It can be seen that imprinted patterns of stem cells, osteoblasts, and tenocytes possess comparable kurtosis values around 3, suggesting a normal profile where sharp and indented portions co-exist. However, the SW 1353 and fibroblast-like chondrocytes substrates demonstrate values slightly larger than 3, suggesting a more leptokurtic profile with sharp spike-like features.
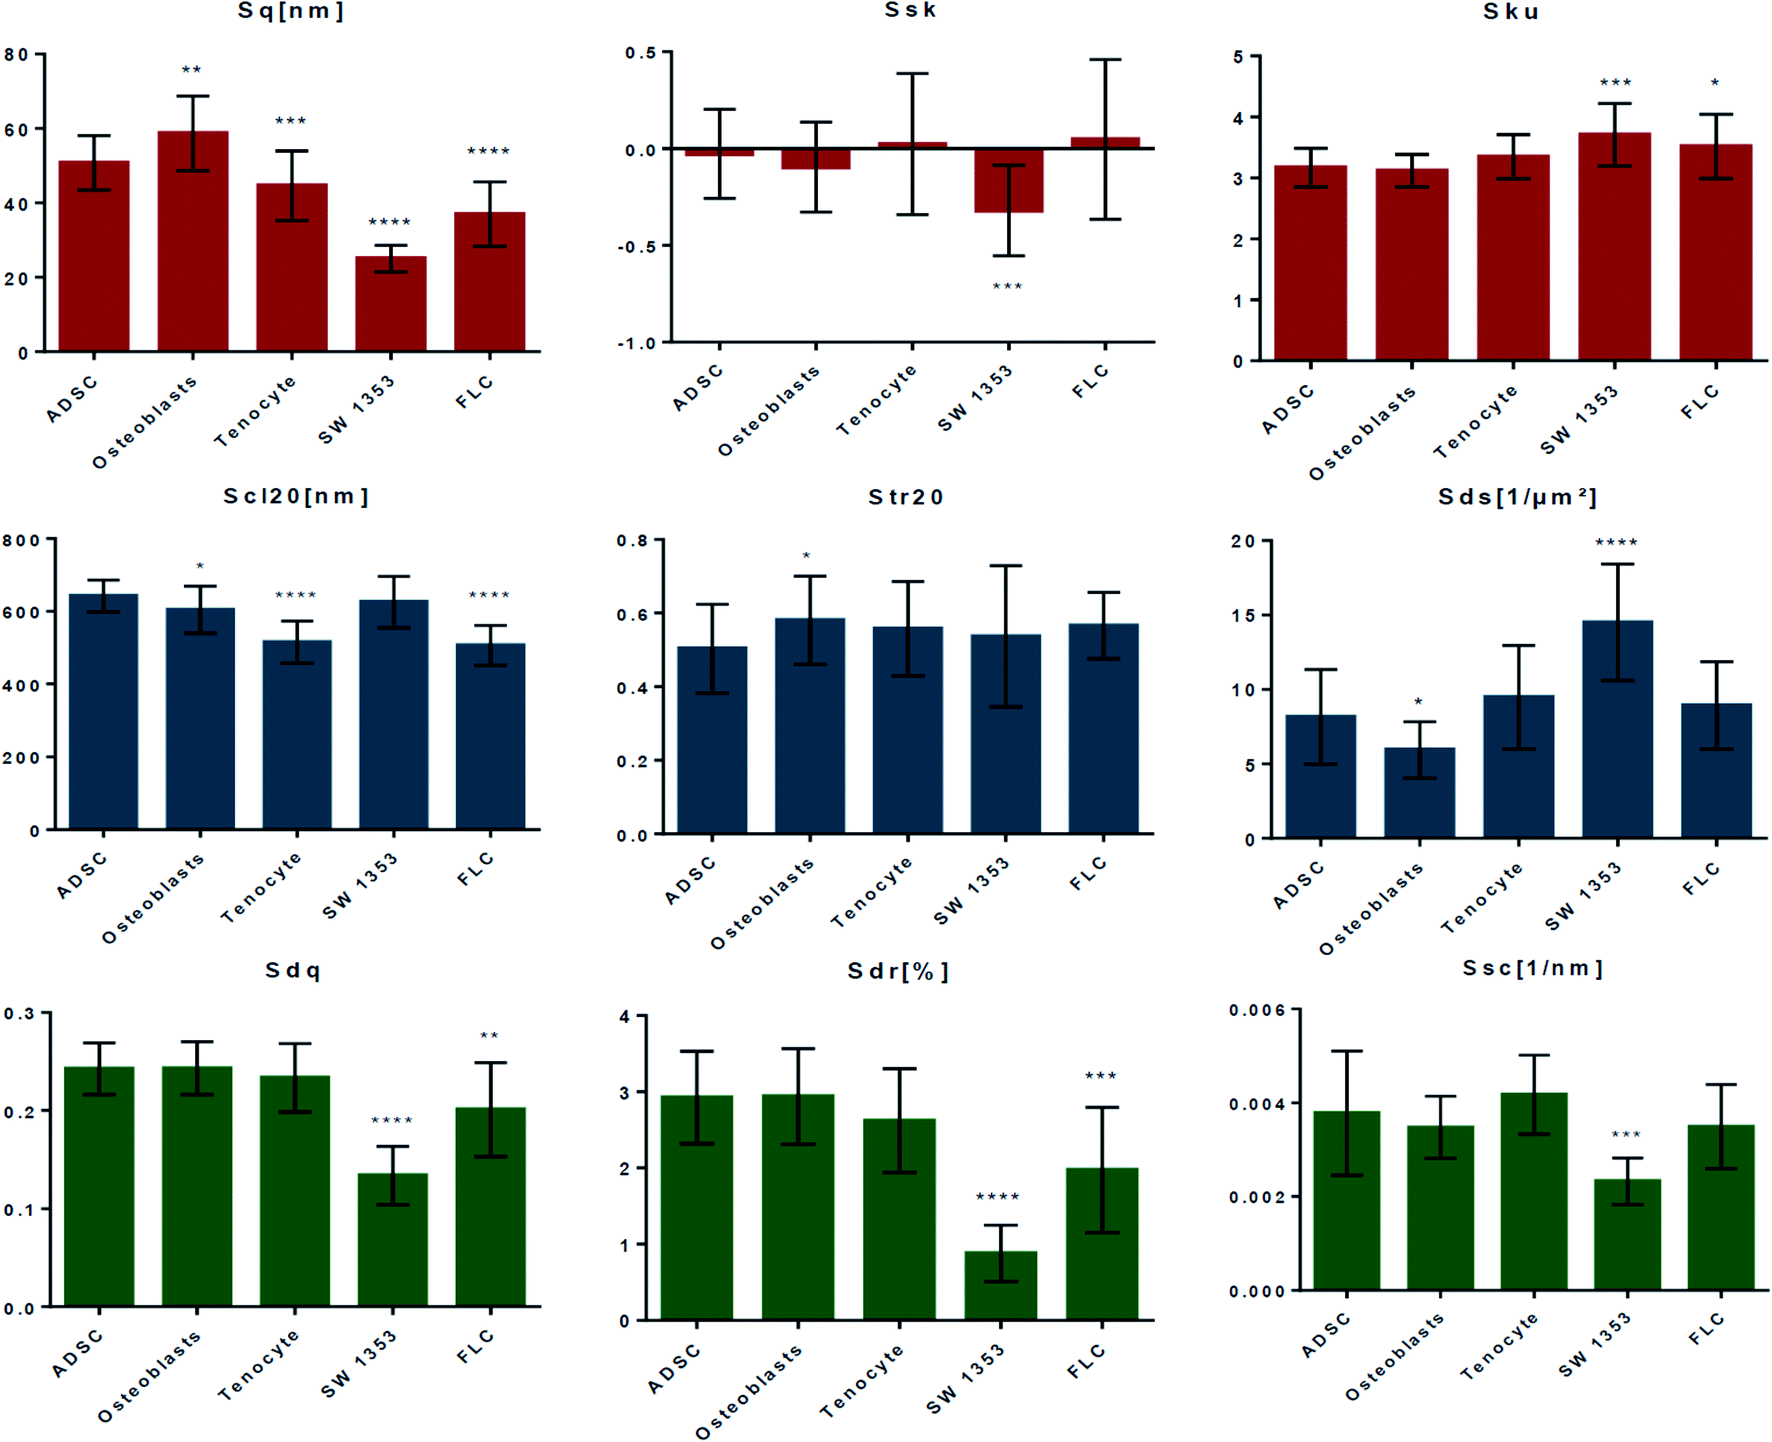 | ||
| Fig. 3 Roughness parameters for the cell-imprinted substrates; the first row represents the amplitude roughness parameters namely, root-mean-square deviation of the surface (Sq), skewness of surface height distribution (Ssk) and kurtosis of surface height distribution (Sku), the second row provides the spacing roughness parameters namely, fastest decay autocorrelation length (Scl20), texture aspect ratio (Str20), and density of summits (Sds), the third row demonstrates hybrid roughness parameters namely, the root-mean-square slope of the surface (Sdq), developed surface area ratio (Sdr), and arithmetic mean summit curvature of the surface (Ssc). | ||
The second row in Fig. 3 presents the spatial roughness parameters. The fastest decay autocorrelation length (Scl20) is a parameter with the dimension of length, which describes the character of the areal autocorrelation function (AACF) and is the length over which the function decays to a threshold value. The AACF, which is calculated from the inverse Fourier transform of the power spectrum of the surface, describes the dependence of the values of the height at one position on the values at another position. For an isotropic surface, the AACF decays identically fast in all directions. In contrast, anisotropic surfaces exhibit different decay functions in different radial directions. Accordingly, the AACF decays rapidly along the cross-lay direction while decays slowly along the lay direction. The fastest decay autocorrelation length is the shortest distance over which the normalized AACF decays to 0.2 regardless of direction. A large value denotes that the surface is dominated by low-frequency components. It can be seen that the patterns of stem cells and SW1353 demonstrate average Scl20 values of around 600 nm. The pattern of osteoblast is characterized by a slightly smaller average value, while fibroblast-like and tenocytes render considerably smaller values, suggesting a difference in texture isotropy of the patterns compared to stem cells. The texture aspect ratio of surface (Str20) can be used to identify the topographic texture pattern together with the fastest decay autocorrelation length. This parameter is calculated based on the AACF, defined as the ratio of the shortest decay distance to the longest decay distance at a normalized threshold of 0.2. Accordingly, the texture aspect ratio has always a value between 0 and 1. Relatively large values (>0.5) suggest a uniform texture in different directions, whereas smaller values (<0.3) indicate strong anisotropy and texture in one direction. For surfaces with neither uniform texture aspect nor significant long-crestness, this value will be around or smaller than 0.5. Regarding the cell-imprinted substrates, all the surfaces are characterized by texture aspect ratio values in the range of 0.4 to 0.7. This suggests that all the imprinted patterns render some degree of nonuniformity in texture, which is in accordance with the fact that all the imprints are from materials very similar in nature, i.e., plasma membrane. Only the osteoblast pattern shows a significant difference from the stem cell pattern, suggesting a more anisotropic texture. Accordingly, while all the surfaces show some degree of texture anisotropicity, the surface components of each exhibit different spatial frequencies. The density of summits (Sds) indicates the number of summits per unit sampling area and is a functional parameter in tribology. A summit, in general, is defined as a point above the mean plane of a specified area that has the largest value compared to other data points. The areal autocorrelation function can be used to specify the area surrounding the summit. Accordingly, only one summit is defined within a certain range of the autocorrelation area, whose half-length of the shorter side is the length that the normalized AACF has fast decayed to 0.2, whilst whose longer side contains the same number of data points as the shorter side. For the cell-imprinted substrates, the stem cell pattern demonstrates a density of summits of around 8. The fibroblast-like and tenocyte patterns show similar values with no significant difference. Contrarily, the pattern of osteoblasts is characterized by a relatively smaller density of summits. The largest difference from the stem cell patterns is found for the SW 1353 imprint, possessing a density of summits of around 14.
The bottom row of Fig. 3 illustrates the hybrid parameters. The root mean square slope of the surface (Sdq) is derived from the slopes calculated between every adjacent data point in the x and y directions. Surfaces with step heights or sudden spikes are characterized by large values of this parameter. Herein, the patterns of stem cells, osteoblasts, and tenocyte cells are characterized by quite a similar root mean square slope values. Contrarily, the patterns of fibroblast-like and more significantly SW 1353 exhibit relatively smaller slope values, suggesting a smoother variation (wider spaced texture) in surface height over the same spacing. The developed surface area ratio (Sdr) is calculated from the ratio of the rough surface to a flat surface of the same sampling area. An ideally flat surface is hence characterized by area ratio value of zero while increasing the local slope variation leads to a larger developed surface ratio. Similarly, it is shown that only fibroblast-like and SW 1353 patterns render relatively smaller surface area ratios, indicating less height contrast on the surface. The mean summit curvature (Ssc) is the average of the principal curvatures of the summits defined by the AACF length, which can be considered as a measure of summits general shape and dimension. Herein, all the cells demonstrate quite similar values of around 0.004 nm−1, except SW 1353 that renders a considerably smaller value of around 0.002 nm−1, suggesting a considerably larger effective diameter of the summits on this pattern.
Therefore, it is evident that the studied cell imprints possess distinct nanotopographies despite their similar spindle-like morphology. Notably, the nanotopographies of SW 1353 chondrosarcoma cells and fibroblast-like chondrocytes significantly differ from that of stem cells. These patterns can be distinguished by their smoother topography (based on hybrid roughness parameters) and less significant ordinal deviations (from the root mean square roughness). This observation suggests that the cells that have lost or changed function (e.g., cancer cells) possess quite distinguishable nano-scale patterns compared to the healthy cells. Regarding the patterns of osteoblast and tenocyte cells, differences in both cross-section shape, as well as ordinal roughness and texture strength, are found. Different nanotopographies of the cell-imprinted substrates could be attributed to the composition and molecular conformation of the plasma membrane of these cells.29,30 The observed nano-features are comparable to the size of protein–lipid complexes (∼a few to tens of nanometers),31–34 which has been also examined by molecular recognition imaging (topography and recognition imaging (TREC)) studies of the plasma membrane.35,36 These distinct nanotopographical cues, through a series of mechanotransductive events (e.g., modulating the density and arrangement of focal adhesions and redistributing the components in the cytoskeleton and nucleoskeleton), are eventually translated into protein- and gene-level changes in the cell nucleus and thus affect cell commitment.37–39
Conclusions and perspective
The surface topography of five cell-imprinted substrates (from adipose-derived stem cells, osteoblasts, fibroblast-like chondrocytes, SW 1353 chondrosarcoma, and tenocytes cells) was examined using AFM. Although these cellular patterns have quite similar shape and morphology, they demonstrate nanotopographical differences that are measurable by a set of surface roughness parameters. This finding calls for further investigation of the nanotopography of different cellular templates. For higher statistical significance, the data population must be increased to eliminate any risk of bias. For instance, skewness and kurtosis parameters are calculated from the third and fourth central moment of height distribution so can be extremely sensitive to imaging artifacts. Such investigation should comprise an extended number of roughness parameters, as well. The presented results can help us in finding out how cells respond to nanotopographical stimuli by identifying the critical roughness scale and parameters. As there is still extensive debate on the mechanisms of mechanotransduction in cells, a key factor to move forward is to understand the length scale of cell's physical recognition in terms of micro and nano topographies. Knowing how to tune the cells functioning using nanotopography opens new routes in regenerative medicine and cell-based therapies, e.g., developing patient-specific clinical prostheses with topographies that can directly modulate stem cell fate.Conflicts of interest
The authors have all declared that no competing interest exists.Acknowledgements
S. B. acknowledges the support by Iran Pasteur Institute Research, Grant #1093.Notes and references
- S. Yao, X. Liu, S. Yu, X. Wang, S. Zhang, Q. Wu, X. Sun and H. Mao, Nanoscale, 2016, 8, 10252–10265 RSC.
- K. A. Jansen, P. Atherton and C. Ballestrem, Semin. Cell Dev. Biol., 2017, 71, 75–83 CrossRef PubMed.
- W. Chen, Y. Shao, X. Li, G. Zhao and J. Fu, Nano Today, 2014, 9, 759–784 CrossRef PubMed.
- L. E. McNamara, R. J. McMurray, M. J. P. Biggs, F. Kantawong, R. O. C. Oreffo and M. J. Dalby, J. Tissue Eng., 2010, 1, 120623 CrossRef PubMed.
- H. J. Anderson, J. K. Sahoo, R. V. Ulijn and M. J. Dalby, Front. Bioeng. Biotechnol., 2016, 4, 38 Search PubMed.
- A. Higuchi, Q.-D. Ling, Y. Chang, S.-T. Hsu and A. Umezawa, Chem. Rev., 2013, 113, 3297–3328 CrossRef PubMed.
- M. P. Sousa, E. Arab-Tehrany, F. Cleymand and J. F. Mano, Small, 2019, 15, 1901228 CrossRef PubMed.
- W. Chen, S. Han, W. Qian, S. Weng, H. Yang, Y. Sun, L. G. Villa-Diaz, P. H. Krebsbach and J. Fu, Nanoscale, 2018, 10, 3556–3565 RSC.
- S. Dobbenga, L. E. Fratila-Apachitei and A. A. Zadpoor, Acta Biomater., 2016, 46, 3–14 CrossRef PubMed.
- M. S. Niepel, B. K. Ekambaram, C. E. H. Schmelzer and T. Groth, Nanoscale, 2019, 11, 2878–2891 RSC.
- I. M. Bjørge, I. S. Choi, C. R. Correia and J. F. Mano, Nanoscale, 2019, 11, 16214–16221 RSC.
- R. K. Silverwood, P. G. Fairhurst, T. Sjöström, F. Welsh, Y. Sun, G. Li, B. Yu, P. S. Young, B. Su, R. M. D. Meek, M. J. Dalby and P. M. Tsimbouri, Adv. Healthcare Mater., 2016, 5, 947–955 CrossRef.
- B. K. K. Teo, S. T. Wong, C. K. Lim, T. Y. S. Kung, C. H. Yap, Y. Ramagopal, L. H. Romer and E. K. F. Yim, ACS Nano, 2013, 7, 4785–4798 CrossRef.
- J. Yang, L. E. McNamara, N. Gadegaard, E. V. Alakpa, K. V. Burgess, R. M. D. Meek and M. J. Dalby, ACS Nano, 2014, 8, 9941–9953 CrossRef.
- M. J. Dalby, N. Gadegaard, R. Tare, A. Andar, M. O. Riehle, P. Herzyk, C. D. W. Wilkinson and R. O. C. Oreffo, Nat. Mater., 2007, 6, 997–1003 CrossRef.
- O. Mashinchian, L.-A. Turner, M. J. Dalby, S. Laurent, M. A. Shokrgozar, S. Bonakdar, M. Imani and M. Mahmoudi, Nanomedicine, 2015, 10, 829–847 CrossRef.
- M. Moosazadeh Moghaddam, S. Bonakdar, M. A. Shokrgozar, A. Zaminy, H. Vali and S. Faghihi, Artif. Cells, Nanomed., Biotechnol., 2019, 47, 1022–1035 CrossRef.
- I. Mutreja, T. B. F. Woodfield, S. Sperling, V. Nock, J. J. Evans and M. M. Alkaisi, Biofabrication, 2015, 7, 025002 CrossRef.
- S. Piletsky, F. Canfarotta, A. Poma, A. M. Bossi and S. Piletsky, Trends Biotechnol., 2020, 38(4), 368–387 CrossRef PubMed.
- M. Mahmoudi, S. Bonakdar, M. A. Shokrgozar, H. Aghaverdi, R. Hartmann, A. Pick, G. Witte and W. J. Parak, ACS Nano, 2013, 7, 8379–8384 CrossRef.
- O. Mashinchian, S. Bonakdar, H. Taghinejad, V. Satarifard, M. Heidari, M. Majidi, S. Sharifi, A. Peirovi, S. Saffar, M. Taghinejad, M. Abdolahad, S. Mohajerzadeh, M. A. Shokrgozar, S. M. Rezayat, M. R. Ejtehadi, M. J. Dalby and M. Mahmoudi, ACS Appl. Mater. Interfaces, 2014, 6, 13280–13292 CrossRef.
- E. A. Lee, S.-G. Im and N. S. Hwang, Biotechnol. J., 2014, 9, 1604–1612 CrossRef PubMed.
- S. Bonakdar, M. Mahmoudi, L. Montazeri, M. Taghipoor, A. Bertsch, M. A. Shokrgozar, S. Sharifi, M. Majidi, O. Mashinchian, M. Hamrang Sekachaei, P. Zolfaghari and P. Renaud, ACS Appl. Mater. Interfaces, 2016, 8, 13777–13784 CrossRef PubMed.
- K. Kamguyan, A. A. Katbab, M. Mahmoudi, E. Thormann, S. Zajforoushan Moghaddam, L. Moradi and S. Bonakdar, Biomater. Sci., 2018, 6, 189–199 RSC.
- E. S. Gadelmawla, M. M. Koura, T. M. A. Maksoud, I. M. Elewa and H. H. Soliman, J. Mater. Process. Technol., 2002, 123, 133–145 CrossRef.
- W. P. Dong, P. J. Sullivan and K. J. Stout, Wear, 1994, 178, 45–60 CrossRef.
- L. Blunt and X. Jiang, Advanced Techniques for Assessment Surface Topography, Elsevier, 2003 Search PubMed.
- J. Israelachvili, Intermolecular and Surface Forces, Elsevier, 2011 Search PubMed.
- L. A. Chtcheglova and P. Hinterdorfer, Semin. Cell Dev. Biol., 2018, 73, 45–56 CrossRef.
- Y. Shan and H. Wang, Chem. Soc. Rev., 2015, 44, 3617 RSC.
- A. E. Schmidt, A. V. Shvetsov, A. I. Kuklin, D. V. Lebedev, M. A. Surzhik, V. R. Sergeev and V. V. Isaev-Ivanov, Crystallogr. Rep., 2016, 61, 149–152 CrossRef CAS.
- T. Bartossek, N. G. Jones, C. Schäfer, M. Cvitković, M. Glogger, H. R. Mott, J. Kuper, M. Brennich, M. Carrington, A. S. Smith, S. Fenz, C. Kisker and M. Engstler, Nat. Microbiol., 2017, 2, 1523–1532 CrossRef CAS PubMed.
- C. A. McDevitt, C. A. Shintre, J. Günter Grossmann, N. L. Pollock, S. M. Prince, R. Callaghan and R. C. Ford, FEBS Lett., 2008, 582, 2950–2956 CrossRef CAS PubMed.
- M. K. Boehm, M. O. Mayans, J. D. Thornton, R. H. J. Begent, P. A. Keep and S. J. Perkins, J. Mol. Biol., 1996, 259, 718–736 CrossRef CAS PubMed.
- Y. F. Dufrêne, T. Ando, R. Garcia, D. Alsteens, D. Martinez-Martin, A. Engel, C. Gerber and D. J. Müller, Nat. Nanotechnol., 2017, 12, 295–307 CrossRef.
- D. J. Müller, J. Helenius, D. Alsteens and Y. F. Dufrêne, Nat. Chem. Biol., 2009, 5, 383–390 CrossRef.
- J. M. Stukel and R. K. Willits, Tissue Eng., Part B, 2016, 22, 173–182 CrossRef CAS.
- B. K. K. Teo, S. T. Wong, C. K. Lim, T. Y. S. Kung, C. H. Yap, Y. Ramagopal, L. H. Romer and E. K. F. Yim, ACS Nano, 2013, 7, 4785–4798 CrossRef CAS.
- J. le Digabel, M. Ghibaudo, L. Trichet, A. Richert and B. Ladoux, Med. Biol. Eng. Comput., 2010, 48, 965–976 CrossRef PubMed.
Footnote |
| † Electronic supplementary information (ESI) available: Experimental methods, calculation of roughness parameters, and raw data. See DOI: 10.1039/d0na00692k |
| This journal is © The Royal Society of Chemistry 2021 |