
 Open Access Article
 This Open Access Article is licensed under a
 Creative Commons Attribution 3.0 Unported Licence
Identification of disease-associated microRNA in a diet-induced model of nonalcoholic steatohepatitis
Tyler L.
Bissoondial
,
Anthony J.
Pellicano
,
Itzhak D.
Goldberg
and
Prakash
Narayan
 *
*
Department of Preclinical Research, Angion Biomedica Corp., USA. E-mail: pnarayan@angion.com
First published on 3rd November 2021
Abstract
Emerging evidence suggests that microRNA dysregulation plays an important role in nonalcoholic steatohepatitis. Using a model of diet-induced liver disease that progresses to fibrosis and hepatocellular carcinoma, we identify a set of 22 microRNA with robust correlation with liver enzyme levels and liver collagen content. These disease-asssociated miRs play pivotal roles in steatosis, extracellular matrix deposition and liver cancer, and may form the basis for identification of therapeutic strategies against this form of liver disease.
Introduction
Given the diabetes, obesity and metabolic syndrome epidemics, a staggering number of people are being diagnosed with nonalcoholic fatty liver disease (NAFLD).1 Left untreated NAFLD, starting with simple steatosis, can progress to non-alcoholic steatohepatitis (NASH). NASH can also end up leading to fibrosis, cirrhosis and hepatocellular carcinoma (HCC).1,2 Mounting evidence suggests that NASH can also progress to HCC in the absence of cirrhosis, a phenomenon termed non-cirrhotic HCC.3–7 Given the poor outcome associated with a diagnosis of HCC, there is an urgent unmet medical need to halt or reverse liver disease. Despite the success of many drug candidates in nonclinical models of NASH, there remains no approved therapy for this disease; indeed, a clinical landscape punctuated by failures8 testifies to the lack of translational success. Without a paradigm shift in understanding NASH, there is increasing risk of big Pharma companies abandoning this space altogether.Micro ribonucleic acids (microRNAs (miRs)) are small, non-protein coding, single-stranded RNAs of ∼22 nucleotides in length that regulate diverse biological aspects, including cell proliferation, differentiation, cell death, as well as organ development and the maintenance of organ physiology.9 In the context of NASH, dysregulated miRs play a pivotal role in fatty acid oxidation and metabolism pathways, inflammation, matrix deposition and progression to HCC.10 Altered hepatic miR profiles have been described in experimental and human NASH.10,11 Hepatocyte death can occur with ballooning degeneration that then releases several miRs into circulation and amplifies their potential to further propagate disease.12 Nevertheless, of the miRs reportedly dysregulated in NASH, it remains to be determined which, if any, are associated with disease. We utilize a model of diet-induced NASH and correlate liver enzyme levels and the amount of liver collagen deposition, each a continuous variable informing disease severity, to identify a subset of miRs associated with disease. Targeting these miRs may form the basis for effective therapies against NASH.
Methods
Animal model
All in-life studies were conducted in C57BL/6 mice (18–20 g, ∼6 weeks old) only after approval from Angion's Institutional Animal Care and Use Committee (5 May 2019, #2019-014) and according to the guidelines of the Ethical Conduct in the Care and Use of Nonhuman Animals in Research. Food and drink were provided ad libitum. A sham cohort comprised animals (n = 6) on a standard rodent diet (5001, LabDiet, St. Louis, MO, USA) for 17 months. The fast-food diet (FFD) cohort comprised mice (n = 8) on a modified rodent diet containing 40 kcal% fat, 20 kcal% fructose, and 2% cholesterol (D09100301, Research Diets, New Brunswick, NJ, USA) for 17 months.13–16 At sacrifice, animals were anesthetized with ketamine/xylazine (25/5 mg kg−1, intraperitoneal), blood was withdrawn, and livers harvested.Histopathology
Histopathological analysis13–16 was conducted by an observer blinded to the identity of the groups. At sacrifice, a portion of the liver was fixed in formalin (10%) and stained with hematoxylin & eosin (H&E). Livers were evaluated for steatosis, inflammation and ballooning, and the NAFLD activity score (NAS) computed.13 Picrosirius red (PSR)-stained liver sections were semi-quantified using ImageJ by a blinded observer. Several fields of view for each liver were evaluated to ensure that the data were representative of that liver.Liver enzyme levels and liver hydroxyproline (HYP)
Serum samples were sent to Northwell Health (Lake Success, NY, USA) for determination of aspartate aminotransferase (AST) and alanine aminotransferase (ALT). Liver HYP, a surrogate for collagen, was determined by colorimetric analysis (catalog # MAK008, Sigma Aldrich, St. Louis, MO, USA) and expressed as μg HYP/liver.RNA seq
RNA was isolated from liver tissue and an Ilumina Small RNA library was prepared using the Real-Seq AC Library Prep Kit (RealSeq Biosciences, Inc., Santa Cruz, California). Samples used for sequencing had an RNA Integrity Number (RIN) of at least 7. Sequencing was performed using the Illumina-Next Seq 500 v2 High-Output-SR 75 Cycle (RealSeq Biosciences), (Inc). The average number of pass filter reads/sample = 10 M and read length = 1 × 75 (Single Read). Reads were processed (trimming of adapters) and sequences were aligned to miRBase to identify microRNA expressed from the mouse genome. Counts were normalized from DESeq2 analysis.Hepatic col1a1, col1a2 and col3a1
RNA was isolated from approximately 10 mg of tissue following manufacturer protocol using the RNeasy Mini Kit (Qiagen). Total RNA was quantitated using a ThermoScientific NanoDrop Lite spectrophotometer (A260/A280). Approximately 100 ng of RNA was reversed transcribed into cDNA using the Applied Biosystems High-capacity cDNA Reverse Transcription Kit (Catalog # 4368814, Bohemia, New York, USA) according to manufacturer protocol. Quantitative polymerase chain reaction (qPCR) was then performed on the cDNA in triplicate with the Applied Biosystems TaqMan Fast Advanced Master Mix following the manufacturer's protocol. Analysis was performed for col1a1, (ThermoFisher TaqMan Gene Expression Assay-ID: Hs00164004_m1), col1a2 (ThermoFisher TaqMan Gene Expression Assay-ID: Hs01028956_m1), col1a3 (ThermoFisher TaqMan Gene Expression Assay-ID: Dr03126620_m1) and data normalized to the housekeeping gene gapdh (ThermoFisher TaqMan Gene Expression Assay-ID: Mm99999915_g1).Hepatic gpat1 expression level was measured by two-step qPCR and normalized to peptidylprolyl isomerase A (ppia) level. The designed primer sequences (Table 1) were produced using Oligo Sigma services (Millipore-Sigma; Massachusetts, US).
| Gene | Forward | Reverse |
|---|---|---|
| gpat1 | CAATGAAACGCACACAAGGC | AACACTGGTGGCAAACATGC |
| ppia | GTGTTCTTCGACATCACG | AAGTTTTCTGCTGTCTTTGG |
Analysis of miR expression
Normalized counts were analysed using Excel, GraphPad Prism Version 9.1.1 and iDEP. 93. Determination of differentially expressed miRs (p < 0.05) were determined using the formula = TTEST((sham Levels), (NASH Levels), 2, 2) or a 2 sample equal variance, 2 tailed, t-test. Raw p-values were adjusted by the Benjamini–Hochberg false discovery rate (FDR) method and only adjusted p-values (padj) < 0.05 were considered as statistically significant. Determination of the log2 fold change was calculated using the formula = LOG((mean NASH level/mean sham level), 2).Correlation of differentially expressed miRs with the AST, ALT and liver HYP, each a continuous variable informing disease severity, was performed using (GraphPad Prism Version 9.1.1). Two-tailed Pearson and Spearman (nonparametric) correlations were performed to compute correlation coefficients. R values (<−0.6 or >0.6) with p < 0.05 and ρ (<−0.6 or >0.6) were selected (Fig. 1a). A receiver operating characteristic (ROC) curve, i.e., true positive rate (sensitivity) vs. false positive rate (1-specificity), was generated using GraphPad Prism.
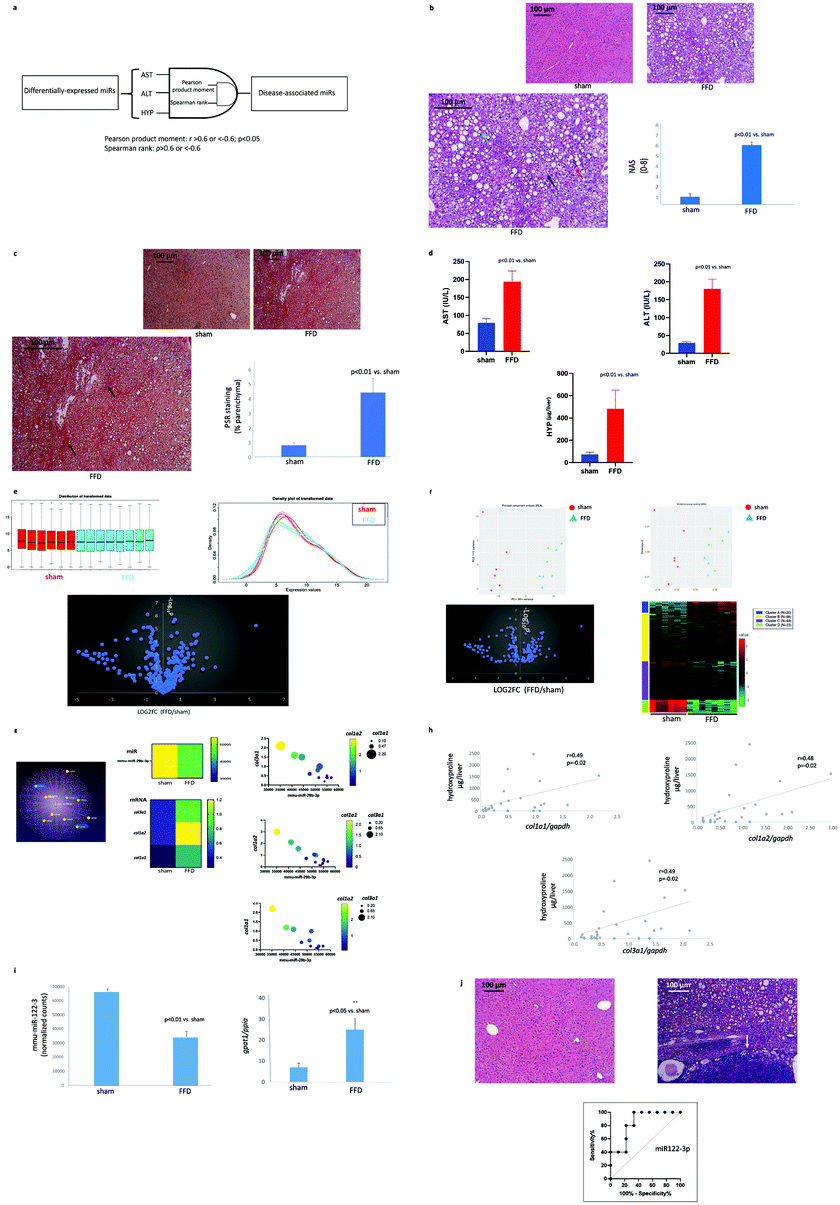 | ||
| Fig. 1 (a) Algorithm for identification of disease-associated miRs. Differentially expressed miRs were correlated with the continuous variables AST “AND” ALT “AND” liver HYP, using both Pearson product moment (r > 0.6 or r < −0.6; p < 0.05) “AND” Spearman rank (ρ > 0.6 or ρ < −0.6) criteria to identify disease-associated miRs. (b) FFD-induced liver disease. Representative images of H&E-stained liver sections from mice randomized to a standard diet (top left) or FFD (top right). (Bottom left) The green arrow shows one of many lipid droplets, the red arrow shows a site of inflammation, and the black arrow shows hepatocyte ballooning. (Bottom right) An increase in NAS was observed in the FFD cohort. (c) Fibrotic liver disease. Representative images of PSR-stained liver sections from mice randomized to a standard diet (top left) or FFD (top right). (Bottom left) The black arrow shows bridging fibrosis. (Bottom right) Quantitation of PSR staining shows elevated scarring in the FFD cohort. (d) Liver enzyme levels and scarring. Both AST (top left) and ALT (top right) were increased in the FFD cohort as was liver HYP (bottom). (e) miRs in FFD-induced liver disease. (Top left) Normal and (top right) Gaussian distribution of the 427 miRs that were identified in this murine model of FFD-induced liver disease. (Bottom) Volcano plot shows fold-changes in miR expression levels with FFD. (f) DE miRs in FFD-induced liver disease. PCA (top left) and MDS (top right) plots showing clustering of DE hepatic miRs by cohort. (Bottom left) Volcano plot showing the log2-transformed fold-change in DE miRs. (Bottom right) Heat map representation of DE miRs shows clustering by magnitude of fold-increase or decrease. (g) miR-29b-3p and collagen-signalling in FFD-induced liver disease. (Left) A partial miR-29b-3-mRNA network showing interaction between this miR and several collagens including col1a1, col1a2 and col3a1. qPCR analysis of hepatic homogenates in the sham and FFD cohorts showing decreased miR-29b-3 (centre top) is accompanied with increased col1a1, col1a2 and col3a1 (centre bottom). A robust inverse correlation is observed between miR-29b-3p and col1a1 (right top), col1a2 (right middle) and col3a1 (right bottom). (r < −0.9; p < 0.01). (h) Hepatic collagen mRNA and HYP. Hepatic col1a1 (top left), col1a2 (top right), and col1a3 (bottom) expression each exhibited a direct correlation with liver hydroxyproline content. (i) miR-29b-3p and lipid signalling. (Left) Reduced hepatic miR-29b-3p in the FFD cohort was accompanied by increased hepatic gpat1 expression (right). (j) FFD-induced HCC and miR-122-3p. Representative H&E-stained sections from a sham (top left) and FFD (17 mo) liver (top right). The FFD cohort liver exhibits a trabecular growth pattern of atypical hepatocytes and clusters of nuclei with a distinct margin between the noncancerous and cancerous parenchyma (arrow). (Bottom) Hepatic miR-122-3p level is a good diagnostic for HCC with an area under ROC of 0.84, a sensitivity of 80% with a specificity of 78%. | ||
iDEP (iDEP.93 (sdstate.edu)), a web-based tool for analysing RNA seq data, was utilized for creating data visualizations.
Results
Phenotypic characterization
Livers from mice randomized to FFD exhibited steatosis, inflammation and hepatocyte ballooning, key characteristics of NASH. Consistent with these findings, the FFD cohort exhibited a significant increase in NAS (Fig. 1b). Accumulation of scar was evident under PSR staining with fibrosis of the bridging type suggesting that 17 months of FFD is associated with NASH with fibrosis in these mice (Fig. 1c). Consistent with a diagnosis of NASH, the FFD cohort exhibited increased AST and ALT, and consistent with the PSR staining, an increase in HYP which is a component of collagens. (Fig. 1d).Liver miRs
A total of 427 miRs identified in this model of NASH were normally distributed across both groups (Fig. 1e). Of these miRs, 170 miRs were differentially expressed (DE) in livers from the FFD cohort (Table 2).| mmu-miR-122-3p | mmu-miR-137-3p | mmu-miR-22-5p | mmu-miR-200a-5p | mmu-miR-340-5p | mmu-miR-30e-3p | mmu-miR-125b-5p | mmu-miR-708-5p | mmu-miR-155-5p |
| mmu-miR-532-5p | mmu-miR-101a-3p | mmu-miR-361-3p | mmu-miR-154-3p | mmu-miR-425-3p | mmu-miR-409-5p | mmu-miR-376b-5p | mmu-miR-5100 | mmu-miR-1839-5p |
| mmu-miR-500-3p | mmu-miR-592-5p | mmu-miR-148a-3p | mmu-miR-203-3p | mmu-miR-23a-5p | mmu-miR-181b-5p | mmu-miR-376c-5p | mmu-miR-26a-2-3p | mmu-miR-7a-1-3p |
| mmu-miR-582-5p | mmu-miR-342-3p | mmu-miR-802-3p | mmu-miR-379-5p | mmu-miR-205-5p | mmu-miR-25-3p | mmu-miR-222-3p | mmu-miR-27a-5p | mmu-miR-29b-3p |
| mmu-miR-122b-3p | mmu-miR-16-5p | mmu-miR-136-5p | mmu-miR-223-5p | mmu-miR-125b-1-3p | mmu-miR-22-3p | mmu-miR-378d | mmu-miR-26a-5p | mmu-miR-542-5p |
| mmu-miR-122b-5p | mmu-miR-101b-3p | mmu-miR-127-5p | mmu-miR-374b-5p | mmu-miR-181d-5p | mmu-miR-149-5p | mmu-miR-223-3p | mmu-miR-181a-5p | mmu-miR-802-5p |
| mmu-miR-182-5p | mmu-miR-128-3p | mmu-miR-337-5p | mmu-miR-451a | mmu-miR-365-3p | mmu-miR-17-5p | mmu-miR-194-2-3p | mmu-miR-880-3p | mmu-miR-146a-5p |
| mmu-miR-30b-5p | mmu-miR-676-3p | mmu-miR-195b | mmu-miR-193a-3p | mmu-miR-144-3p | mmu-miR-362-5p | mmu-miR-154-5p | mmu-miR-503-5p | mmu-miR-146b-5p |
| mmu-miR-1948-3p | mmu-miR-429-3p | mmu-miR-326-3p | mmu-miR-181c-5p | mmu-miR-29c-3p | mmu-miR-150-5p | mmu-miR-33-3p | mmu-miR-134-5p | mmu-miR-32-5p |
| mmu-miR-194-5p | mmu-miR-369-3p | mmu-miR-183-5p | mmu-miR-376b-3p | mmu-miR-425-5p | mmu-miR-3068-3p | mmu-miR-342-5p | mmu-miR-301a-3p | mmu-miR-743b-3p |
| mmu-miR-33-5p | mmu-miR-200c-3p | mmu-miR-99b-5p | mmu-miR-3071-3p | mmu-miR-541-5p | mmu-miR-15b-5p | mmu-miR-126a-5p | mmu-miR-1195 | |
| mmu-miR-3065-5p | mmu-miR-30a-5p | mmu-miR-19b-3p | mmu-miR-15a-5p | mmu-miR-199a-5p | mmu-miR-322-5p | mmu-miR-126b-3p | mmu-miR-141-3p | |
| mmu-miR-125a-3p | mmu-miR-132-3p | mmu-miR-214-3p | mmu-miR-501-3p | mmu-miR-377-3p | mmu-miR-140-5p | mmu-miR-340-3p | mmu-miR-187-3p | |
| mmu-miR-200b-3p | mmu-miR-30f | mmu-miR-195a-5p | mmu-miR-409-3p | mmu-miR-125a-5p | mmu-miR-181c-3p | mmu-miR-195a-3p | mmu-miR-26b-5p | |
| mmu-miR-30c-5p | mmu-miR-20a-5p | mmu-miR-190a-5p | mmu-miR-455-5p | mmu-miR-411-5p | mmu-miR-221-5p | mmu-miR-338-3p | mmu-miR-27b-5p | |
| mmu-miR-200a-3p | mmu-miR-192-5p | mmu-miR-127-3p | mmu-miR-376a-3p | mmu-miR-136-3p | mmu-miR-188-5p | mmu-miR-18b-5p | mmu-miR-130a-3p | |
| mmu-miR-200b-5p | mmu-miR-652-3p | mmu-miR-130b-3p | mmu-miR-203-5p | mmu-miR-7a-5p | mmu-miR-20b-5p | mmu-miR-505-5p | mmu-miR-375-3p | |
| mmu-miR-24-3p | mmu-miR-199a-3p | mmu-miR-376c-3p | mmu-miR-142a-3p | mmu-miR-34a-5p | mmu-let-7i-5p | mmu-miR-18a-5p | mmu-miR-369-5p | |
| mmu-miR-122-5p | mmu-miR-199b-3p | mmu-miR-144-5p | mmu-miR-30e-5p | mmu-miR-351-5p | mmu-let-7j | mmu-let-7e-5p | mmu-miR-210-3p | |
| mmu-miR-1948-5p | mmu-miR-497a-5p | mmu-miR-382-5p | mmu-let-7i-3p | mmu-miR-30a-3p | mmu-miR-700-3p | mmu-miR-203b-5p | mmu-miR-5620-3p |
Both principal component analysis (PCA) and multidimensional scaling (MDS) plots revealed distinct clustering of DE miRs by cohort, with volcano plot analysis revealing the distribution of upregulated vs. downregulated DE miRs (Fig. 1f). The majority of these miRs fell within a log2 fold-change of −4 and 4 vs. the sham cohort. Additional insight was gained by heatmap representation of DE miRs which demonstrated that FFD resulted in both up- and down-regulation of hepatic miRs with clustering further stratified by the magnitude fold-change in up- or downregulation (Fig. 1f).
miR-phenotype correlations
The liver function tests AST and ALT, in addition to informing the presence and severity of liver disease, are continuous variables, and not subjected to operator bias. Liver HYP, a surrogate for the extent of liver collagen deposition, is also a continuous variable not influenced by operator bias. Liver DE miRs were correlated against AST, ALT and liver HYP. Table 3 lists the DE miRs that exhibited good correlations against each of these continuous variables.| Change | miR | HYP | AST | ALT | HYP | AST | ALT |
|---|---|---|---|---|---|---|---|
| r | r | r | ρ | ρ | ρ | ||
| Down | mmu-miR-122-3p | −1 | −1 | −1 | −1 | −1 | −1 |
| Down | mmu-miR-122b-5p | −1 | −1 | −1 | −1 | −1 | −1 |
| Down | mmu-miR-101a-3p | −1 | −1 | −1 | −1 | −1 | −1 |
| Down | mmu-miR-33-5p | −1 | −1 | −1 | −1 | −1 | −1 |
| Up | mmu-miR-132-3p | 0.6 | 0.8 | 0.9 | 0.9 | 0.7 | 0.8 |
| Down | mmu-miR-3065-5p | −1 | −1 | −1 | −1 | −1 | −1 |
| Up | mmu-miR-676-3p | 0.7 | 0.7 | 0.8 | 0.8 | 0.7 | 0.8 |
| Up | mmu-miR-342-3p | 0.6 | 0.8 | 0.8 | 0.9 | 0.7 | 0.8 |
| Up | mmu-miR-652-3p | 0.7 | 0.7 | 0.9 | 0.9 | 0.7 | 0.9 |
| Down | mmu-miR-101b-3p | −1 | −1 | −1 | −1 | −1 | −1 |
| Up | mmu-miR-326-3p | 0.6 | 0.8 | 0.9 | 0.8 | 0.9 | 0.9 |
| Down | mmu-miR-193a-3p | −1 | −1 | −1 | −1 | −1 | −1 |
| Up | mmu-miR-125b-1-3p | 0.7 | 0.7 | 0.8 | 0.8 | 0.6 | 0.9 |
| Down | mmu-miR-29c-3p | −1 | −1 | −1 | −1 | −1 | −1 |
| Up | mmu-miR-34a-5p | 0.8 | 0.6 | 0.8 | 0.6 | 0.9 | 0.9 |
| Up | mmu-miR-351-5p | 0.6 | 0.8 | 0.8 | 0.8 | 0.7 | 0.9 |
| Up | mmu-miR-150-5p | 0.7 | 0.6 | 0.8 | 0.9 | 0.6 | 0.7 |
| Up | mmu-miR-15b-5p | 0.6 | 0.7 | 0.8 | 0.8 | 0.8 | 0.9 |
| Up | mmu-let-7i-5p | 0.8 | 0.6 | 0.8 | 0.9 | 0.7 | 0.8 |
| Up | mmu-let-7j | 0.8 | 0.6 | 0.8 | 0.8 | 0.8 | 0.8 |
| Down | mmu-miR-29b-3p | −1 | −1 | −1 | −1 | −1 | −1 |
| Up | mmu-miR-155-5p | 0.8 | 0.6 | 0.7 | 0.8 | 0.7 | 0.8 |
Having identified a set of DE miRs whose expressions correlated against AST, ALT and liver HYP, qPCR analysis was undertaken to determine whether certain mRNA governed by a few of these miRs are subjected to modification. Evaluating all the mRNA regulated by each of these miRs is beyond the scope of this project and analysis was therefore limited to two miRs and a few of their targets.
miR-29b-3p plays a pivotal role in collagen accumulation (Fig. 1g).17 miR-29b-3p is downregulated in the FFD cohort (Fig. 1g) and qPCR analysis of hepatic homogenates revealed increased col1a1/a2 and col3a1 (Fig. 1g). Furthermore, each of col1a1, col1a2 and col1a3 exhibited a direct correlation with liver HYP content (Fig. 1h), a key component of collagens, further supporting the notion of an inverse relation between miR-29b-3p level and collagen deposition.
A number18 of studies suggest that a reduction in hepatic miR-122-3p is associated with increased lipid accumulation. Livers from the FFD cohort exhibited reduced miR-122-3p (Fig. 1i), and in addition to exhibiting steatosis, exhibited increased hepatic gpat1, a key intermediate in the synthesis of triacylglycerol and glycerophospholipids (Fig. 1i).
In addition to regulating lipid metabolism, miR-122-3p is a tumour suppressor.19 At sacrifice (17 months), several livers from the FFD (17 months) cohort exhibited tumours, a finding consistent with previous reports from this laboratory.13–16 By contrast, no tumours were evident in the sham cohort. To confirm that these tumours were indeed HCC, microscopic examination of liver sections housing tumours was conducted. Livers that presented with tumours on gross observation showed a trabecular growth pattern of atypical hepatocytes and clusters of multinucleated hepatocytes evident in H&E-stained sections (Fig. 1j). A distinct margin was observed between the cancerous and noncancerous parenchyma. The receiver operator characteristic curve indicated that the hepatic miR-122-3p level is a relatively good diagnostic for HCC with an area under ROC of 0.84, a sensitivity of 80% with a specificity of 78% (Fig. 1j).
Discussion
Mice that maintained a FFD for 17 months exhibited hallmark signs of NASH viz. steatosis, hepatic inflammation, and hepatocyte ballooning. Increased liver enzyme levels and liver matrix deposition (PSR and HYP) was also observed with several mice progressing to HCC. Compared to the sham/healthy cohort, livers from the FFD cohort exhibited 170 DE miRs from which a subset of 22 miRs correlated with liver enzyme levels and liver HYP content. Members from this subset of disease-associated miRs are involved in regulation steatosis matrix deposition and HCC.In addition to the sheer size of the NASH pandemic, findings that NASH can necessitate liver replacement and can progress to HCC even in the absence of scarring are cause for alarm.1–7 Equally disconcerting is a clinical trial landscape dotted with failures.8 Indeed, absent a paradigm shift in understanding and leveraging biological pathways in NASH there is increasing risk of abandoning drug development in this space altogether.
Emerging evidence indicates that miRs play a pivotal role in liver disease.10–12 Alterations in miR levels in response to genetic/epigenetic factors or the local milieu contribute to steatosis. Several differentially expressed miRs have been reported in plasma samples of NAFLD patients and even more dramatically in NASH, potentially distinguishing NASH from simple steatosis.12 However, of the miRs described in nonclinical and clinical NASH, it is not presently known which are associated with disease progression. Identification of disease-associated elements could spur development of therapeutics that are effective in halting or even reversing NASH.
Using a previously described13–16 model of FFD-induced liver disease, we identified 170 DE miRs. Volcano and PCA plots, and MDS analyses indicated that NASH is associated with a multi-fold change in expression of these miRs with excellent separation of these miRs between healthy and diseased livers. To assign a more distinct role for miRs in NASH we employed Boolean AND-gated logic to identify DE miRs whose levels correlate with liver enzyme levels and liver HYP content. The rationale underlying use of these liver endpoints is multifactorial. Liver enzyme levels are a clinically validated biomarker that inform severity of disease, and are continuous variables not subjected to observer bias. By contrast, NAS, although a clinically relevant endpoint, is not a continuous variable, and is observer dependent. The histopathological liver fibrosis score is also a clinically valid endpoint but not a continuous variable and is also operator-dependent. Liver HYP content on the other hand is a surrogate for liver collagen content, is a quantitative variable, and both continuous and operator independent. Use of rigorous statistical tools identified a subset of 22 miRs that were not only DE but whose expression levels correlated with AST, ALT and liver HYP. Although establishing causality is beyond the scope of this study, the rigorous gating nature of the statistical tests employed does suggest a pivotal role for these miRs in liver disease. Expression levels of miRs were correlated using Boolean AND gates to AST, ALT and liver HYP content using Pearson product moment and Spearman rank criteria. It is therefore not unreasonable to hypothesize that these 22 miRs are NASH-drivers, at least in this model. While it is beyond the scope of this study to comprehensively investigate the role of each of these 22 miRs, a survey of the literature20–22 suggests that they are intimately involved in regulating steatosis, hepatic matrix deposition and progression to HCC. Indeed, evaluation of downstream targets of miR-29b-3p and miR-122-3p support this hypothesis.
In the present study, hepatic miR-29b-3p was reduced in the FFD cohort with concomitant increases in hepatic col1a1, col1a2 and col3a1 mRNA. In fact, a robust inverse (r < −0.90, p < 0.01) relation was observed between this miR and each of these mRNA. Furthermore, hepatic col1a1, col1a2 and col3a1 each correlated directly with liver HYP content, a surrogate for liver collagen deposition. These data are consistent with the role that miR-29 plays in downregulating the expression of several extracellular matrix genes including col1a1 and col3a1. Indeed miR-29 was down-regulated in livers of CCl4-treated mice and in mice that underwent bile duct ligation, a phenomenon that was also observed in in livers from patients with advanced liver fibrosis.17,23,24
A number18 of studies demonstrate that miR-122, the most abundant miRs in the liver, plays a prominent role in the NAFLD continuum. Overexpression of hepatic miR-122 counteracts lipid accumulation;25 appearance of steatohepatitis in miR-122 knockout mice26 indicates a causal role of this miR in NAFLD. Upregulation of expression of enzymes involved in triglyceride biosynthesis and transport likely cause steatosis.18 Consistent with these observations hepatic miR-122 was downregulated in our model, a model accompanied by steatosis and an increase in hepatic gpat1 – which plays a pivotal role in lipid accumulation by shunting fats away from oxidation.14 Numerous studies19,25,26 have reported that hepatic miR-122 is a tumour suppressor. Expression of miR-122 is downregulated in liver samples from HCC and in rodent models of liver cancer, and expression of miR-122 inversely correlated with clinical features, such as development/presence of metastatic disease and patient prognosis.19,25,26 In our model of FFD-induced liver disease, several mice exhibited HCC. Not only was hepatic miR-122 downregulated vs. the sham cohort, but it also served as an excellent diagnostic for the presence of HCC with an area under ROC of 0.84, a sensitivity of 80% and a specificity of 78%. Together these data highlight the importance of these disease-associated miRs in NASH.
There are a few weaknesses associated with this study. All findings are reported at a single time point and in single, albeit clinically relevant model of diet-induced liver disease. It remains to be determined whether these findings are consistently observed at other time points and/or in other models. Second, despite identifying a subset of 22 miRs associated with liver disease-relevant markers, the study does not necessarily confer a disease-driving role for these miRs. Additional studies would be required to demonstrate that these miRs indeed drive NAFLD. Nevertheless, findings from this study are important in that they identify a population of miRs strongly associated with the NAFLD continuum. Targeting these miRs might form the basis for effective therapies against NASH. Indeed, these miRs might serve as a starting point for new therapeutic approaches27 with agomirs or antagomirs that may finally translate to clinical success in NASH.
Conclusions
In a clinically relevant model of diet-induced NASH with progression to liver fibrosis and HCC 22 miRs exhibit robust correlation with liver enzyme levels and liver HYP content. This set includes miRs involved in regulation of steatosis, extracellular matrix deposition and progression to HCC. This data might inform development of therapeutics that are effective against NASH.Data availability
All data generated or analysed during this study are included in this published article.Author contributions
T. L. B. and A. J. P. conduced the assays; T. L. B and P. N. analysed the data and prepared the manuscript; IDG provided funding for the study.Conflicts of interest
There are no conflicts to declare.Acknowledgements
Angion's summer research program for STEM students.Notes and references
- M. Tesfay, W. J. Goldkamp and B. A. Neuschwander-Tetri, Missouri Med., 2018, 115, 225–229 Search PubMed.
- A. J. Sanyal, S. L. Friedman, A. J. McCullough and L. Dimick-Santos, Hepatology, 2015, 61, 1392–1405 CrossRef PubMed.
- S. L. Friedman, J. Hepatol., 2014, 60, 1–2 CrossRef PubMed.
- R. B. Perumpail, R. J. Wong, A. Ahmed and S. A. Harrison, Dig. Dis. Sci., 2015, 60, 3142–3148 CrossRef CAS PubMed.
- J. Ertle, A. Dechene, J.-P. Sowa, V. Penndorf, K. Herzer, G. Kaiser, J. F. Schlaak, G. Gerken, W.-K. Syn and A. Canbay, Int. J. Cancer, 2011, 128, 2436–2443 CrossRef CAS PubMed.
- P. Kolly and J. F. Dufour, Diagnostics, 2016, 6, 22 CrossRef PubMed.
- G. Cholankeril, R. Patel, S. Khurana and S. K. Satapathy, World J. Hepatol., 2017, 9, 533–543 CrossRef PubMed.
- E. Guirguis, Y. Grace, Y. A. Bolson, M. J. DellaVecchia and M. Ruble., Pharmacotherapy, 2021, 41, 315–328 CrossRef PubMed.
- A. M. Ardekani and M. M. Naeini, Avicenna J. Med. Biotechnol., 2010, 2, 161–179 CAS.
- F. Schueller, R. Sanchari, M. Vucur, C. Trautwein, T. Luedde and C. Roderburg, Int. J. Mol. Sci., 2018, 19, 261 CrossRef PubMed.
- A. Eguchi, A. Wree and A. E. Feldstein, J. Hepatol., 2014, 60, 1063–1074 CrossRef CAS PubMed.
- S. S. Pillia, H. V. Lakhani, M. Zehra, J. Wang, A. Dilip, N. Puri, K. O'Hanlon and K. Sodhi, Int. J. Mol. Sci., 2020, 21, 6698 CrossRef PubMed.
- A. Hwang, C. Shi, E. Zhu, F. Naaz, P. Zhou, Z. Rasheed, M. Liu, L. S. Jung, B. Duan, J. Li, K. Jiang, L. Paka, S. V. Gadhiya, D. D. Dana, Q. Ali, M. A. Yamin, I. D. Goldberg and P. Narayan, PLoS One, 2018, 13, e0198937 CrossRef PubMed.
- K. Liao, A. J. Pellicano, K. Jiang, N. Prakash, J. Li, S. Bhutkar, Z. Hu, Q. Ali, I. D. Goldberg and P. Narayan, ACS Omega, 2020, 5, 18465–18471 CrossRef CAS PubMed.
- T. L. Bissoondial, Y. Han, S. Mullan, A. K. Pabla, K. Spahn, S. Shi, L. Zheng, P. Zhou, K. Jiang, N. Prakash, S. Bhutkar, Q. Ali, J. Li, Z. Hu, A. J. Pellicano, I. D. Goldberg and P. Narayan, Diagnostics, 2020, 10, 784 CrossRef CAS PubMed.
- A. J. Pellicano, K. Spahn, P. Zhou, I. D. Goldberg and P. Narayan, Molecules, 2021, 26, 3316 CrossRef CAS PubMed.
- H.-Y. Lin, Y.-L. Yang, P.-W. Wang and Y.-H. Huang, Cells, 2020, 9, 1041 CrossRef CAS PubMed.
- S. Thakral and K. Ghoshal, Curr. Gene Ther., 2015, 15, 142–150 CrossRef CAS PubMed.
- S. Bandiera, S. Pfeffer, T. F. Baumert and M. B. Zeisel, J. Hepatol., 2015, 62, 448–457 CrossRef CAS PubMed.
- P. Dongiovanni, M. Meroni, M. Longo, S. Fargion and A. L. Fracanzani, Int. J. Mol. Sci., 2018, 19, 3966 CrossRef PubMed.
- Q. Su, V. Kumar, N. Sud and R. I. Mahato, Adv. Drug Delivery Rev., 2018, 129, 54–63 CrossRef CAS PubMed.
- A. Zarfeshani, S. Ngo and A. M. Sheppard, J. Clin. Med., 2015, 4, 1938–1950 CrossRef CAS PubMed.
- Y. Matsumoto, S. Itami, M. Kuroda, K. Yoshizato, N. Kawada and Y. Murakami, Mol. Ther., 2016, 24, 1848–1859 CrossRef CAS PubMed.
- C. Roderburg, G. W. Urban, K. Bettermann, M. Vucur, H. Zimmermann, S. Schmidt, J. Janssen, C. Koppe, P. Knolle, M. Castoldi, F. Tacke, C. Trautwein and T. Luedde, Hepatology, 2011, 53, 209–218 CrossRef CAS PubMed.
- G. Y. Wu, C. Rui, J. Q. Chen, E. Sho, S. S. Zhan, X. W. Yuan and Y. T. Ding, Cell. Physiol. Biochem., 2017, 44, 1651–1664 CrossRef CAS PubMed.
- W. C. Tsai, S. D. Hsu, C. S. Hsu, T. C. Lai, S. J. Chen, R. Shen, Y. Huang, H. C. Chen, C. H. Lee, T. F. Tsai, M. T. Hsu, J. C. Wu, H. D. Huang, M. S. Shiao, M. Hsiao and A. P. Tsou, J. Clin. Invest., 2012, 122, 2884–2897 CrossRef CAS PubMed.
- B. Martinez and P. V. Peplow, Neural Regen. Res, 2017, 12, 1945–1959 CrossRef CAS PubMed.
| This journal is © The Royal Society of Chemistry 2021 |