 Open Access Article
Computational determination of coordination structure impact on adsorption and acidity of pristine and sulfated MOF-808†
Bo
Yang
 *a,
Joshua I.
Wheeler
a,
Brett
Sorensen
a,
Robert
Steagall
a,
Taylor
Nielson
a,
Jianhua
Yao
b,
Jose
Mendez-Arroyo
*b and
Daniel H.
Ess
 *a
*a
aDepartment of Chemistry and Biochemistry, Brigham Young University, Provo, Utah 84602, USA. E-mail: dhe@chem.byu.edu; bo.yang@chem.byu.edu
bPhillips 66, Bartlesville, Oklahoma 74003, USA. E-mail: jose.e.mendez-arroyo@p66.com
First published on 27th April 2021
Abstract
Metal–organic frameworks (MOFs) are composed of metal nodes connected by organic linkers. With the massive amount of possible metal and linker combinations, it is critical to develop structure–property relationships. However, a major impediment to developing these relationships is that MOFs often have multiple metal coordination structures in a single crystal. Here, we report periodic and cluster density functional theory (DFT) calculations analyzing the coordination structures of MOF-808 and sulfated MOF-808 and their physical and chemical properties. For MOF-808, we determined coordination structures by comparing computationally determined lattice constants with experimental values and then used these coordination structures to simulate N2 and Ar adsorption isotherms. Our simulated average N2 and Ar uptakes agree very well with the experimental values. For the sulfated MOF-808, which has been proposed to be a superacidic material, we determined the impact of coordination structure on acidity. Surprisingly, our results based on calculated proton affinities suggest a 1025 range in acid site strength depending on the coordination structure, with only a few sites having high acidity. The use of vibrational frequencies and other property-based methods for determining relative acidity fail. Our analysis revealed that the acidity of sulfated MOF-808 is unlikely controlled by a sulfate–water hydrogen bond that was previously proposed. Instead, we show that there is a strong correlation between conjugate base stability and proton affinity to rationalize acidity of protons in a single coordination structure model as well as across all coordination structures.
1. Introduction
Metal–organic frameworks (MOFs) are crystals that consist of metal nodes connected by organic ligand linkers. The large number of metal nodes and organic linkers provides an almost overwhelming possible diversity of MOFs with varying sizes, shapes, topologies, and physical and chemical properties.1,2 In addition to this diversity, MOFs have ordered and tunable structures that provide opportunities for post-synthesis modifications.3 With unique physical and chemical properties, MOFs are beginning to be targeted for many industrial applications, including gas storage, water purification, separation, toxic chemical decomposition, and catalysis.4–6While experimental and computational studies have begun to understand MOF structure–property relationships,5,7,8 because of the large chemical diversity of MOFs and varying physical and chemical properties, there remains a large gap in knowledge about how the coordination structure of MOFs control particular properties, especially gas adsorption and acidity related to catalysis. The term coordination structure is used here to describe different combinations and arrangements of organic and inorganic ligands that coordinate with the metal centers in the nodes. Complicating the development of coordination-structure-to-property relationships is that MOFs are often non-uniform and have multiple periodic coordination structures in a single crystal. Therefore, the experimentally observed properties of a MOF are potentially the results of co-existent coordination structures. Surprisingly, while thousands of MOFs have been experimentally synthesized, there are only a few computational studies that have systematically examined MOF coordination structures and resulting properties.9 For example, density functional calculations in combination with experiments revealed the thermodynamically most stable proton-topology of MOF NU-1000.10
MOF-808 is a Zr-based mesoporous material that has relatively high thermal and mechanical stability,5 which prompted structure modification and multiple studies in the application of adsorption, gas separation, and catalysis. MOF-808 is constructed by linking Zr6O4(OH)4 nodes (i.e., Zr6 node) with benzene-1,3,5-tricarboxylate (BTC) linkers, as shown in Fig. 1. Each Zr6 node cluster coordinates with six BTC linkers, and there are twelve open coordination sites on each node that can be utilized for binding other ligands. Due to the open metal sites in MOF-808, experimental H1-NMR, IR, and XRD data11–13 have revealed that ligands such as formate and water can coordinate to a Zr6 node in different configurations. This results in many different coordination structures throughout the crystal of MOF-808. To date, no systematic computational analysis of MOF-808 coordination structures has been reported. Therefore, it remains unknown how local structure controls local and global MOF-808 properties.
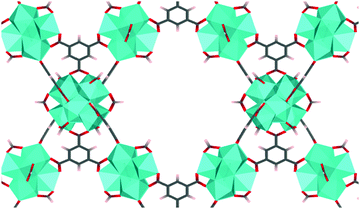 | ||
| Fig. 1 MOF-808 with Zr6O4(OH)4 nodes (shown as cyan polyhedron) and benzene-1,3,5-tricarboxylate linkers. Formates are coordinated to the node in the μ2-bridging configuration. | ||
A sulfated MOF-808 can be obtained through post-synthetic modification by exposing the crystals to aqueous sulfuric acid.11,13 Sulfate ligands are incorporated into the Zr6 nodes through the occupation of the aforementioned open metal sites of MOF-808 through Zr ligand substitution. Because there are a variety of possible Zr–sulfate coordination modes, similar to MOF-808, sulfated MOF-808 is a composite of multiple different coordination structures. Sulfated MOF-808 has been reported to be super acidic and acts as a potent Brønsted acid catalyst. For example, Yaghi demonstrated that the acidity of sulfated MOF-808 induces the dimerization of isobutene (2-methyl-1-propene) to isooctene.13 The proposed superacidity of sulfated MOF-808 was briefly analyzed using a single coordination structure and acidity proposed to arise from a sulfate ligand interacting with a neighboring aqua ligand through hydrogen bonding.13
Here we report periodic and cluster density functional theory (DFT) modeling of MOF-808 and sulfated MOF-808 to directly determine the impact of different coordination structures on N2 and Ar adsorption and acidity properties as well as build general structure–property relationships. Importantly, this work demonstrates the importance and nontrivial analysis of many coordination structures to analyze and understand the origin of physical and chemical properties for MOF-808. For MOF-808, the most probable coordination structures were determined by comparing the lattice constants of models with experimentally measured lattice constants of MOF-808. N2 and Ar adsorption isotherms were computed for selected models using grand canonical Monte Carlo (GCMC) simulations, and we obtained N2 and Ar uptake results that agree with the experimental measurements. For sulfated MOF-808, we find that the originally proposed hydrogen bond interaction in a single coordination structure likely does not significantly control acidity. Instead, the number of aqua groups and their relative positions affect the stability of conjugate base, which results in a strong correlation between conjugate base stability and proton affinity in a single coordination structure model as well as across all coordination structures. The typical use of vibrational frequencies does not adequately reproduce proton affinities.
2. Computational methods
All MOF-808 and sulfated MOF-808 periodic models were optimized using DFT calculations as implemented in the CP2K program.14 We used the PBEsol15,16 functional with the addition of the D3 damped dispersion terms of Grimme,17 the DZVP-MOLOPT basis set for Zr atoms, and TZVP-MOLOPT basis set for C, H, O, and S atoms. A plane wave cut-off energy of 200 Ry, and pseudopotentials for core electrons (as formulated by Geodecker et al.18) were used for all atoms. The PBEsol functional has been widely applied for calculating geometric properties of bulk solids and crystals, and generally gives accurate results of physical properties, such as lattice constants.19,20 All periodic models were optimized using triclinic primitive unit cells to facilitate fast calculations. Optimized primitive unit cells were transformed to cubic unit cells to acquire the average lattice constants, which were then compared with experimental values.Cluster models were constructed from optimized MOF-808 and sulfated MOF-808 periodic structures. The construction involved the truncation of BTC linkers and replacing them with acetate capping groups around one Zr6 node. The positioning of acetate capping groups around the Zr6 node was done so that the spatial constraint imposed on the node is the same as in the periodic structure. The position of the methyl-C atom in each acetate is not optimized during geometry optimizations so that the imposed constraints mimic those in a periodic system. All cluster models were optimized using the Gaussian 16 program.21 We used the M06-L22 density functional with SDD23 pseudopotentials and its corresponding basis set for Zr atoms and def2-TZVP24,25 basis set for all the other atoms. The M06-L functional was chosen because of its general accuracy in transition metal chemistry.26 All cluster models were optimized to their respective ground states which were confirmed by frequency analysis.
In addition to DFT calculations, we have also performed GCMC simulations on the DFT-optimized periodic geometries to obtain adsorption properties. Specifically, isotherms for N2 and Ar adsorptions at 77 and 87 K, respectively, were simulated using selected MOF-808 models. All GCMC simulations were performed using the RASPA 2.0 program.27 N2 and Ar molecules were described by the TraPPE force field.28 MOF-808 models were described by the GenericMOFs force field27 and were assumed rigid. The Lorentz–Berthelot mixing rule was used to calculate the Lennard-Jones parameters between different types of atoms. The Lennard-Jones interactions in the simulation were calculated using a spherical cut-off of 12 Å with long-range correction. The long-range electrostatic interactions were evaluated using Ewald summation.29 Partial atomic charges were computed for MOF atoms using the extended charge equilibration method.30 A total of 110![[thin space (1/6-em)]](https://www.rsc.org/images/entities/char_2009.gif) 000 GCMC cycles were performed to converge the adsorption isotherms with the first 10
000 GCMC cycles were performed to converge the adsorption isotherms with the first 10![[thin space (1/6-em)]](https://www.rsc.org/images/entities/char_2009.gif) 000 cycles for equilibrium and the latter 100
000 cycles for equilibrium and the latter 100![[thin space (1/6-em)]](https://www.rsc.org/images/entities/char_2009.gif) 000 cycles for ensemble averages.
000 cycles for ensemble averages.
3. Results and discussions
3.1 MOF-808 and gas adsorption
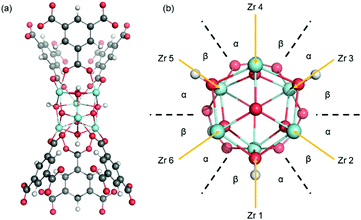
We developed 18 different periodic boundary models of pristine (i.e., no defects) MOF-808, each with a different coordination structure. All the MOF-808 models have the same backbone framework structure with Zr6 nodes interconnected by BTC linkers with each node binding with six linkers (Fig. 2a). All the Zr atoms in a Zr6 node have a formal oxidation state of +4 and can form eight bonds in total with surrounding ligands and linkers in a square anti-prism geometry. Surrounding each individual Zr atom, in addition to the BTC linkers and μ-oxo, μ-hydroxo groups within the Zr6 node, a maximum of two other ligands can be introduced at positions α and β shown in Fig. 2b. The types of ligands used in each model were based on the reported synthetic procedures and experimental XRD crystal data.11 Specifically, we consider three ligands including aqua (–OH2), hydroxo (–OH), and formate (–OOCH).The different coordination structures of each model were designed by changing the number and coordination configuration of ligands. A formate ligand can bind with either one or two Zr atoms. In models where a formate coordinates to a single Zr, the formate can chelate through either κ1 or κ2. In models where a formate coordinates with two Zr atoms (μ2-formate), there is a Zr–formate–Zr bridging structure motif. A list of the models and their coordination geometries is given in Table S1 of the ESI.†
The experimentally reported MOF-808 crystal data suggest cubic unit cells with averaged lattice constants ranging from 35.02331 to 35.232 Å.32 The variation in lattice constants results from MOF-808 being a mixture of coordination structures that each give a slightly different set of lattice constants. Therefore, we examined 18 coordination structure models to determine if a single model fits this lattice constants range or if a combination of coordination structures provides a better fit. Of the 18 models, the four models I–IV shown in Fig. 3 provide average lattice constants of 35.282, 35.131, 35.033, and 35.270 Å, respectively, that are closest to the experimental lattice values.
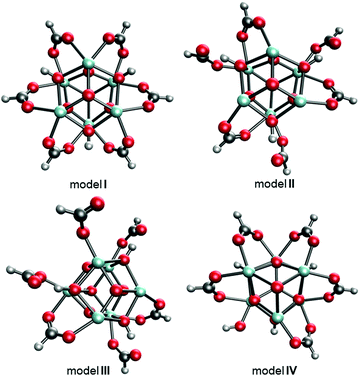 | ||
| Fig. 3 Top-down views of MOF-808 models I–IV where the BTC linkers were removed for clarity. C atoms are shown in grey, H in white, O in red, and Zr in cyan. | ||
The structural differences between the selected four models can be considered through a series of steps of bond breaking and new bond forming involving the formate ligands. Model I, II, and III all contain only Zr6 nodes that each bind with six formate ligands. In model I, all formates have a μ2-bridging configuration and bind with two adjacent Zr atoms. From model I to model II, three of the six μ2-bridging formates dissociate one leg from one of the two Zr atoms and bind, instead, with μ-hydroxo groups on the node through hydrogen bonding. From model II to model III, two of the remaining three μ2-bridging formates dissociate one leg from one of the two Zr atoms and extend into the pore, forming formates with κ1 configuration. From model I to model IV, one formate is replaced with a hydroxo ligand.
MOF-808 models I–IV have calculated lattice constants ranging from 35.033 to 35.282 Å. To verify our choice of models, we performed a higher level calculation for model I which has averaged lattice constants of 35.282 Å. The higher level calculation uses PBEsol15,16 density functional with D317 dispersion correction and up to 500 eV plane-wave basis set in the Vienna Ab initio Simulation Package (VASP).33–36 Due to the very large computational cost, we did not perform the higher level calculation for all models. This high-level calculation decreased the average lattice constant of model I from 35.282 to 35.182 Å, which is lower than the largest experimentally measured lattice constant, suggesting that model I is a suitable candidate for representing the MOF-808 structure. We also note that the experimentally measured lattice constants might be affected by residual water within the MOF-808 framework.11,31 Therefore, we examined the effect of water on physical properties of MOF-808. Several water-containing models were constructed by adding water molecules to the tetrahedral cage of model I and then re-optimized using DFT methods in CP2K. Structural properties, including lattice constants and BET surface areas were calculated (see Fig. 4). Importantly, both properties decrease as the number of water molecules increase within the tetrahedral cage of MOF-808.
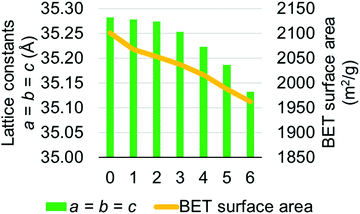 | ||
| Fig. 4 Changes in lattice constants and BET surface area as the number of water molecule increases (x-axis) within the tetrahedral pore of the MOF-808 model I. | ||
To determine the impact of MOF model coordination structure on physical properties, we simulated both N2 and Ar adsorption isotherms using models I–IV. A survey of the literature revealed several measurements of N2 adsorption at 77 K for MOF-80813,37–40 and one measurement of Ar adsorption at 87 K.41 Surprisingly, there is a relatively large deviation in experimentally measured maximum uptakes among different studies. Specifically, the N2 uptake ranges from ∼350 cm3 g−1 to ∼600 cm3 g−1 at p/p0 = 0.3. It is possible that the experimentally observed deviation in adsorption capacities is due to synthetic imperfections. These imperfections are potentially the result of missing linkers/nodes, a mixture of different coordination structures, or other structural deformations.42–44 Our simulated N2 adsorption at 77 K using model I with one missing linker per primitive unit cell has slightly higher (8 cm3 g−1) N2 uptake at p/p0 = 0.3 than that simulated using pristine model I.
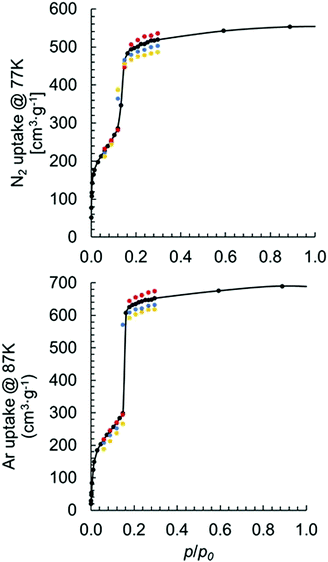
Fig. 5 shows the results of simulated isotherms for the MOF-808 models I–IV. Data points are simulated mainly at the low p/p0 region to obtain key information, such as the maximum uptake.
Good agreement was achieved between simulated and experimentally measured adsorption isotherms. For the N2 adsorption, the experimentally measured value varies between 350 and 600 cm3 (STP) g−1. Our calculated uptakes of 519, 502, 487, and 536 cm3(STP) g−1 at p/p0 = 0.3 were achieved for models I–IV, respectively. Interestingly, we noticed a decrease in N2 uptake when the formate ligands changed from binding with the Zr6 node in μ2-bridging configuration to the partially dissociated κ1 configuration. We also noticed an increase in the uptake when a hydroxo ligand replaces a formate. Note, the observed trend also holds in per mole basis with uptakes of 2![[thin space (1/6-em)]](https://www.rsc.org/images/entities/char_2009.gif) 832
832![[thin space (1/6-em)]](https://www.rsc.org/images/entities/char_2009.gif) 119, 2
119, 2![[thin space (1/6-em)]](https://www.rsc.org/images/entities/char_2009.gif) 741
741![[thin space (1/6-em)]](https://www.rsc.org/images/entities/char_2009.gif) 040, 2
040, 2![[thin space (1/6-em)]](https://www.rsc.org/images/entities/char_2009.gif) 654
654![[thin space (1/6-em)]](https://www.rsc.org/images/entities/char_2009.gif) 747, and 2
747, and 2![[thin space (1/6-em)]](https://www.rsc.org/images/entities/char_2009.gif) 862
862![[thin space (1/6-em)]](https://www.rsc.org/images/entities/char_2009.gif) 110 cm3 (STP) mol−1 achieved for models I–IV, respectively. The experimentally measured Ar uptake for MOF-808 is about 560 cm3 (STP) g−1 at p/p0 = 0.3.41 For the Ar adsorption using models I–IV, we obtained uptakes of 653, 632, 619 and 675 cm3 (STP) g−1, respectively, at p/p0 = 0.3. The same trend was observed for Ar adsorption using different coordination structures as for N2 adsorption.
110 cm3 (STP) mol−1 achieved for models I–IV, respectively. The experimentally measured Ar uptake for MOF-808 is about 560 cm3 (STP) g−1 at p/p0 = 0.3.41 For the Ar adsorption using models I–IV, we obtained uptakes of 653, 632, 619 and 675 cm3 (STP) g−1, respectively, at p/p0 = 0.3. The same trend was observed for Ar adsorption using different coordination structures as for N2 adsorption.
We examined the effect of water content within MOF-808 on adsorption. The water-containing models were constructed by adding water molecules to the tetrahedral cage of model I. The calculated Ar uptakes at p/p0 = 0.3 are shown in Fig. 6 and suggest that the amount of adsorbed Ar decreases with the increase of water content within MOF-808 as the water content reduces the surface area of the model (Fig. 4).
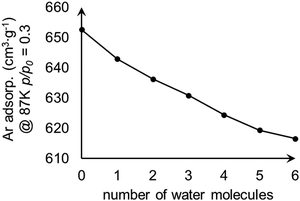 | ||
| Fig. 6 Change in calculated Ar uptake as the number of water molecules increases within the tetrahedral pore of the MOF-808 model I. | ||
3.2 Sulfated MOF-808 coordination structure and acidity
The sulfated MOF-808 can be synthesized by treating pristine MOF-808 with aqueous sulfuric acid.11,13 The sulfated MOF-808 is then “activated” by heating it under dynamic vacuum.11,13 Here, we refer to the sulfated and activated MOF as “S-MOF-808”. Similar to pristine MOF-808, the S-MOF-808 crystal contains Zr6 nodes with different coordination structures. These coordination structures may differ in terms of the number and the relative position of attached ligands, in particular coordinating sulfate dianions (SO4). For S-MOF-808, Yaghi11 reported average molecular formula of Zr6O4(OH)4(BTC)2(SO4)2.3(OH)1.4(OH2)3.1(DMF)0.4. By considering the average molecular formula and the synthesis procedures,11 we constructed nine periodic S-MOF-808 models that differ by (a) the number of sulfate ligands per node (from 1 to 3), (b) the bonding coordination configuration of the sulfate ligand to include μ2-bridging, κ2-chelating, and κ1 bonding accompanied by hydrogen bonding, and (c) the relative positions of sulfate and hydroxo ligands.S-MOF-808 models were constructed with two approaches. First, alterations were made directly to the optimized MOF-808 models according to the experimentally measured average molecular formula.11,13 We altered the pristine MOF-808 model using various combinations of ligands to capture potential coordination structures that could exist around Zr6 node. The second approach to construct S-MOF-808 models involved using experimental XRD structures. The advantage of this latter approach is that it retains possible structural nuances that can be potentially be lost as artifacts in the cell optimization procedure. A detailed list of studied models and their optimized coordinates is provided in the ESI.† Because of the activated form of S-MOF-808 there are no direct adsorption measurements to compare coordination structure models to, and therefore, rather than analyzing a single coordination structure, we compared all calculated coordination structures and their acidity by calculating proton affinities.
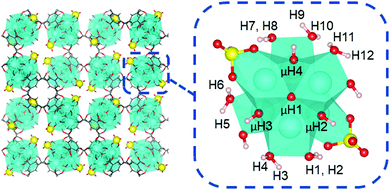
To begin, we first analyzed the acidity of coordination structure model A that was proposed by Yaghi and Head-Gordon.13 As shown in Fig. 7, this model contains two κ2 chelating sulfate ligands, two hydroxo ligands, and six aqua ligands per Zr6 node. This model accounts the experimentally measured average molecular formula.12,13
To determine the acidity, we calculated the proton affinities (PAs) for all hydrogens of the Zr6 node in model A. The PA measures the energy requirement to separate the O–H bond into a conjugate anion-proton pair (defined in eqn (1)). This type of analysis has been applied to both organic and inorganic acids,45,46 zeolites,47,48 and MOFs.49 In our procedure, we calculated proton affinities using cluster models truncated from fully optimized periodic S-MOF-808 models (see Computational methods section).
| PA = EMOF− + EH+ − EMOF–H | (1) |
We also explored ensemble-averaged proton affinities for hydrogens in model A. For a given hydrogen, the ensemble-averaged proton affinity (〈PA〉) takes into account all the possible binding locations on the conjugate anion that are in thermodynamic equilibrium.50 The PA as defined in eqn (1) does not consider equilibrium proton binding locations; however, is computationally less demanding than 〈PA〉 because the PA only requires the optimization of one MOF–H complex while the 〈PA〉 requires additional optimization of all structures. For two tested protons in model A, the computed 〈PA〉 values are within 0.6 kcal mol−1 to the PAs computed using eqn (1). This very small energy difference gave us confidence to generally use PA values rather than ensemble-averaged values. We have also compared 〈PA〉 values with PA values for MOF-808 model XIV and also found nearly identical values (see the ESI†).
For model A, we computed 16 proton affinities in total for the deprotonation of 12 protons from six aqua ligands and four protons from four μ-hydroxo groups. Fig. 8 plots the calculated PAs for model A and categorizes them into five kcal mol−1 ranges. This revealed that there is an extremely wide range of acidities just for this single coordination structure model. This greater than 35 kcal mol−1 range can be roughly equated to 1025 order magnitude in acidity range. The PAs for the twelve aqua protons range from 299 to 336 kcal mol−1. The PAs for the four μ-hydroxo-protons range from 311 to 326 kcal mol−1. The average value of all the PAs for model A is 316 kcal mol−1.
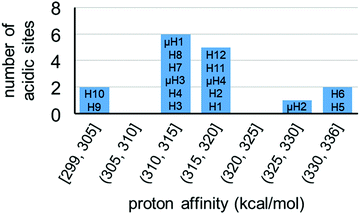 | ||
| Fig. 8 Distribution of proton affinities (PA, kcal mol−1) of model A. Protons are labelled following Fig. 7. In each column PA increases from bottom to top of bar graph. | ||
The two protons from the same aqua ligand gave similar PAs. For the six aqua ligands in model A, the PA difference between two protons from the same aqua ligand is on average 1 kcal mol−1 and at most 4 kcal mol−1. This similarity in proton affinities for both hydrogens of an aqua ligand is perhaps surprising given that the 3D structural and bonding environment are different. But more importantly, this observation impacts the interpretation of the previous computational assessment of model A where the superacid label of this MOF was proposed to arise from a single proton of one aqua ligand and its hydrogen bond with a neighboring sulfate ligand.13
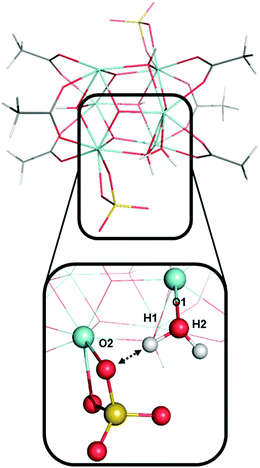
Fig. 9 shows an aqua ligand with two protons (H1 and H2, also see Fig. 7) that have a different chemical environment. H1 was previously assigned to be highly acidic due to the hydrogen bond interaction with the neighboring sulfate ligand. H2 is not involved in a hydrogen bonding interaction. The interaction between atom H1 and the sulfate ligand does induce an elongated O1–H1 bond. We computed the O1–H1 bond length of 1.006 Å and O1–H2 bond length of 0.968 Å. However, despite the difference in their surrounding chemical environment, and the difference in O–H bond lengths, proton H1 and H2 have identical PA values of 318 kcal mol−1. Therefore, the water–sulfate hydrogen bond interaction highlighted in Fig. 9 is not the source of superacidity in S-MOF-808. Just as important, this aqua ligand does not possess the most acidic hydrogens in model A. Instead, the most acidic protons (H9 and H10, Fig. 7) come from an aqua ligand that does not interact with sulfate ligands and bind with a Zr atom that is coordinating with another aqua ligand.
With the observation that the most acidic hydrogen in model A is not apparent from intra-node hydrogen bonding, we wondered if conventional analysis of O–H bond stretching frequencies, ν(OH), would correlate with the calculated proton affinities and begin to provide an origin of acidity. O–H stretching frequencies correlate well with PA in zeolites51 and some other crystalline materials,52,53 and is a commonly used acidity descriptor. However, ν(OH) values fail to capture the relative proton acidity for S-MOF-808 and hydrated MOF-808. We calculated ν(OH) values, O–H bond lengths, and PAs for three aqua ligands from model A and six aqua ligands from fully hydrated MOF-808 (details are given in ESI†). As shown in Fig. 10(a), there is a clear linear correlation (R2 = 0.996) between ν(OH) and the O–H bond length. However, Fig. 10(b) shows that there is no correlation between ν(OH) and PA.
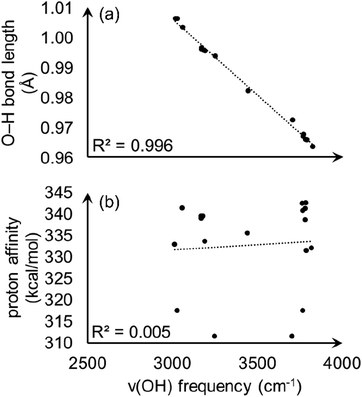 | ||
| Fig. 10 Calculated O–H stretching frequencies plotted versus (a) O–H bond length and (b) proton affinity. | ||
With the inability of vibrational frequencies to correlate with acidity, we desired to directly analyze S-MOF-808 conjugate base relative stabilities that control acidity. The deprotonation of a proton from an aqua ligand on the Zr6 node (Zr6–O(H)H) results in Zr-node stabilized hydroxide ligand ([Zr6–OH]−). The stability of this Zr–hydroxide conjugate base can be expressed in terms of the heterolytic Zr–O bond energy D. The heterolytic dissociation results in the dehydrated Zr6 node with one less aqua ligands than the starting Zr6 node as well as hydroxide (eqn (2)). EZr6, EOH−, and EZr6OH− are the energies of the dehydrated Zr6 node, OH−, and the conjugate base ([Zr6–OH]−). The dehydrated Zr6 node and the conjugate base are not optimized for the calculation of D.
| D = EZr6 + EOH− − EZr6OH− | (2) |
For model A, the linear correlation between each PA and the corresponding heterolytic dissociation energy is displayed in Fig. 11. For protons H1 and H2 shown in Fig. 9, the heterolytic Zr–O dissociation energies of their respective conjugate bases are 103 and 105 kcal mol−1, which explains their essentially identical PA values. This inverse relationship between proton acidity and conjugate base stability has been further verified using other S-MOF-808 models which are summarized in ESI.†
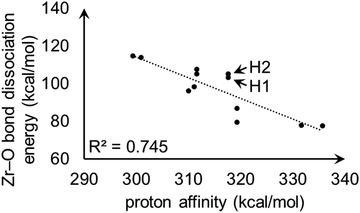 | ||
| Fig. 11 Linear correlation plot between proton affinities (kcal mol−1) and heterolytic Zr–O bond dissociation energies (kcal mol−1) for hydrogens in model A. H1 and H2 are the hydrogen atoms shown in Fig. 9. | ||
As expected, the relative stability of the conjugate base ([Zr–OH]−) is significantly impacted by the coordination ligands around the Zr atom. As described earlier, for each Zr atom of the Zr6 node, there are two open coordination sites, and these coordination sites can be occupied by aqua, hydroxo, or sulfate ligands. Here, we compare two groups of sub-structures in model A; one group includes substructures where a Zr atom coordinates with two aqua ligands (H2O–Zr–OH2) and the other group includes substructures where a Zr atom coordinates with one aqua and one hydroxo ligand (H2O–Zr–OH). The PAs associated with aqua-protons in H2O–Zr–OH2 range from 299 to 318 kcal mol−1 and are always lower than those with the H2O–Zr–OH motif that range from 319 to 336 kcal mol−1. Indeed, these different ranges are not surprising given that a coordination structure motif of H2O–Zr–OH2 contains a more electron-deficient Zr center capable of better stabilizing the resulting hydroxide after proton loss (i.e. [H2O–Zr–OH]−) and this is in contrast to the H2O–Zr–OH motif that would result in a less stable [HO–Zr–OH]− conjugate base.
With the wide range of acidities found in model A, and the identification of hydrogens more acidic than previously known, we wanted to determine if S-MOF-808 should be considered a superacid. Therefore, we decided to compare the proton affinities for model A to zeolite acids and known superacids. For zeolites MFI, BEA, FER, MOR, CHA, and FAU, PAs of 287.0 ± 2.6 kcal mol−1 computed using periodic DFT methods were reported.50 Superacids FSO3SbF5H (264), HSbF6 (265), HC5(CN)5 (262), HAlCl4 (266), HAlBr4 (265) have lower PAs (given in parentheses in kcal mol−1) than PAs of zeolites.45 Model A, as discussed earlier, has an averaged PA of 316 kcal mol−1 and lowest PA at 299 kcal mol−1. Because model A's PAs are significantly higher than that of both zeolites and traditional molecular superacids, it is unlikely that model A provides superacidic protons. Note that the PAs reported for zeolites and superacids were computed using different DFT functionals and basis sets than ours; however, despite the differences in methods, we believe these PAs are reasonable to make a qualitative comparison with S-MOF-808.
As we discussed earlier, a S-MOF-808 crystal contains different coordination structures, and therefore, proton affinity based on a single coordination structure is insufficient to give a full picture of the acidity of S-MOF-808. First, we compare models with different number of sulfate groups, namely models A, B, and C. Model A, as discussed earlier, has two sulfate ligands per Zr6 node. Models B and C have coordination structures that are based on model A. Model B has one sulfate ligand per node and was constructed by replacing one sulfate ligand of every node in model A with an aqua and a hydroxo ligand. Model C has three sulfate ligands per node and was constructed by replacing an aqua and a hydroxo ligand per node in model A with a sulfate group. Both models B and C were optimized with periodic boundary conditions, and their PAs were evaluated using corresponding cluster models. The choice of number of sulfate groups is based on the experimentally measured molecular formula of S-MOF-808 which suggests an average of 2.3 sulfate ligands per node.11 We observed an increase in average acidity of S-MOF-808 models with the increase of sulfate groups per node. Specifically, models B, A, C have averaged PAs of 327, 316, 309 kcal mol−1, respectively, which indicate progressively increasing acidity. Among the six neutral models we have studied, model J, which contains three sulfate groups, has the lowest averaged PA of 306 kcal mol−1 (see the ESI† for comparison of all models), and therefore the highest acidity; Model B has the highest averaged PA of 327 kcal mol−1 and the lowest acidity. Interestingly, model K, which contains two bisulfate (SO4H) groups, has averaged PA of 309 kcal mol−1. The lack of acidity in model K is caused by the increased amount of hydroxo groups on the Zr6 node due to charge balance, resulting in the loss of electron deficient Zr centers. We noticed that none of the neutral coordination structures give PA values that would suggest superacidity compared to classical superacids.
4. Conclusions
MOF-808 is a Zr-based MOF with relatively high chemical and mechanical stability and has often been for applications in chemical adsorption and gas separation. In this study, we applied periodic and cluster DFT calculations to determine the impact of MOF-808 and sulfated MOF-808 coordination structures on physical and chemical properties. For MOF-808, many calculated coordination structures were compared to experimental lattice constants. Our calculated lattice constants for multiple coordination structures, and N2 and Ar adsorption isotherms, agree very well with experimental values.For the sulfated MOF-808 that was previously proposed to be superacidic, we determined the impact of coordination structure on acidity. Surprisingly, our results based on proton affinities suggest a large distribution of acid site strength equivalent to 1025 orders of magnitude depending on the coordination structure with only few sites having high acidity. Furthermore, the data suggests that vibrational frequencies and other property-based methods for determining relative acidity fail. Our analysis revealed that the acidity of sulfated MOF-808 is unlikely controlled by a sulfate–water hydrogen bond that was previously proposed. Instead, we showed that there is a strong, likely causal, correlation between conjugate base stability and proton affinity to rationalize acidity of protons in a single coordination structure model as well as across all coordination structures.
Conflicts of interest
There are no conflicts to declare.Acknowledgements
We thank Brigham Young University and the Office of Research Computing for computational resources. We thank Phillips 66 Company for financial support.Notes and references
- Y. G. Chung, E. Haldoupis, B. J. Bucior, M. Haranczyk, S. Lee, H. Zhang, K. D. Vogiatzis, M. Milisavljevic, S. Ling, J. S. Camp, B. Slater, J. I. Siepmann, D. S. Sholl and R. Q. Snurr, J. Chem. Eng. Data, 2019, 64, 5985–5998 Search PubMed.
- S. Yuan, J.-S. Qin, C. T. Lollar and H.-C. Zhou, ACS Cent. Sci., 2018, 4, 440–450 Search PubMed.
- Z. Wang and S. M. Cohen, Chem. Soc. Rev., 2009, 38, 1315–1329 Search PubMed.
- Y. Bai, Y. Dou, L.-H. Xie, W. Rutledge, J.-R. Li and H.-C. Zhou, Chem. Soc. Rev., 2016, 45, 2327–2367 Search PubMed.
- A. Corma, H. García and F. X. L. i Xamena, Chem. Rev., 2020, 110, 4606–4655 Search PubMed.
- A. U. Czaja, N. Trukhan and U. Müller, Chem. Soc. Rev., 2009, 38, 1284–1293 Search PubMed.
- M. D. Allendorf and V. Stavila, CrystEngComm, 2015, 17, 229–246 Search PubMed.
- L. Chen, X. Zhang, X. Cheng, Z. Xie, Q. Kuang and L. Zheng, Nanoscale Adv., 2020, 2, 2628–2647 Search PubMed.
- J. L. Mancuso, A. M. Mroz, K. N. Le and C. H. Hendon, Chem. Rev., 2020, 120, 8641–8715 Search PubMed.
- N. Planas, J. E. Mondloch, S. Tussupbayev, J. Borycz, L. Gagliardi, J. T. Hupp, O. K. Farha and C. J. Cramer, J. Phys. Chem. Lett., 2014, 5, 3716–3723 Search PubMed.
- J. Jiang, F. Gándara, Y.-B. Zhang, K. Na, O. M. Yaghi and W. G. Klemperer, J. Am. Chem. Soc., 2014, 136, 12844–12847 Search PubMed.
- H. Furukawa, F. Gándara, Y.-B. Zhang, J. Jiang, W. L. Queen, M. R. Hudson and O. M. Yaghi, J. Am. Chem. Soc., 2014, 136, 4369–4381 Search PubMed.
- C. A. Trickett, T. M. Osborn Popp, J. Su, C. Yan, J. Weisberg, A. Huq, P. Urban, J. Jiang, M. J. Kalmutzki, Q. Liu, J. Baek, M. P. Head-Gordon, G. A. Somorjai, J. A. Reimer and O. M. Yaghi, Nat. Chem., 2019, 11, 170–176 Search PubMed.
- J. Hutter, M. Iannuzzi, F. Schifmann and J. VandeVondele, Rev. Comput. Mol. Sci., 2014, 4, 15–25 Search PubMed.
- L. A. Constantin, J. P. Perdew and J. M. Pitarke, Phys. Rev. B: Condens. Matter Mater. Phys., 2009, 79, 075126 Search PubMed.
- J. P. Perdew, A. Ruzsinszky, G. I. Csonka, O. A. Vydrov, G. E. Scuseria, L. A. Constantin, X. Zhou and K. Burke, Phys. Rev. Lett., 2008, 100, 136406 Search PubMed.
- S. Grimme, J. Antony, S. Ehrlich and H. Krieg, J. Chem. Phys., 2010, 132, 154104 Search PubMed.
- S. Goedecker, M. Teter and J. Hutter, Phys. Rev. B: Condens. Matter Mater. Phys., 1996, 54, 1703–1710 Search PubMed.
- M. Ropo, K. Kokko and L. Vitos, Phys. Rev. B: Condens. Matter Mater. Phys., 2008, 77, 195445 Search PubMed.
- G. I. Csonka, J. P. Perdew, A. Ruzsinszky, P. H. T. Philipsen, S. Lebègue, J. Paier, O. A. Vydrov and J. G. Ángyán, Phys. Rev. B: Condens. Matter Mater. Phys., 2009, 79, 155107 Search PubMed.
- M. J. Frisch, G. W. Trucks, H. B. Schlegel, G. E. Scuseria, M. A. Robb, J. R. Cheeseman, G. Scalmani, V. Barone, G. A. Petersson, H. Nakatsuji, X. Li, M. Caricato, A. V. Marenich, J. Bloino, B. G. Janesko, R. Gomperts, B. Mennucci, H. P. Hratchian, J. V. Ortiz, A. F. Izmaylov, J. L. Sonnenberg, D. Williams-Young, F. Ding, F. Lipparini, F. Egidi, J. Goings, B. Peng, A. Petrone, T. Henderson, D. Ranasinghe, V. G. Zakrzewski, J. Gao, N. Rega, G. Zheng, W. Liang, M. Hada, M. Ehara, K. Toyota, R. Fukuda, J. Hasegawa, M. Ishida, T. Nakajima, Y. Honda, O. Kitao, H. Nakai, T. Vreven, K. Throssell, J. A. Montgomery Jr., J. E. Peralta, F. Ogliaro, M. J. Bearpark, J. J. Heyd, E. N. Brothers, K. N. Kudin, V. N. Staroverov, T. A. Keith, R. Kobayashi, J. Normand, K. Raghavachari, A. P. Rendell, J. C. Burant, S. S. Iyengar, J. Tomasi, M. Cossi, J. M. Millam, M. Klene, C. Adamo, R. Cammi, J. W. Ochterski, R. L. Martin, K. Morokuma, O. Farkas, J. B. Foresman and D. J. Fox, Gaussian 16 (Revision B.01), Gaussian, Inc., Wallingford, CT, 2016 Search PubMed.
- Y. Zhao and D. G. Truhlar, J. Chem. Phys., 2006, 125, 194101 Search PubMed.
- D. Andrae, U. Häußermann, M. Dolg, H. Stoll and H. Preuß, Theor. Chim. Acta, 1990, 77, 123–141 Search PubMed.
- F. Weigend, Phys. Chem. Chem. Phys., 2006, 8, 1057–1065 Search PubMed.
- F. Weigend and R. Ahlrichs, Phys. Chem. Chem. Phys., 2005, 7, 3297–3305 Search PubMed.
- C. J. Cramer and D. G. Truhlar, Phys. Chem. Chem. Phys., 2009, 11, 10757–10816 Search PubMed.
- D. Dubbeldam, S. Calero, D. E. Ellis and R. Q. Snurr, Mol. Simul., 2016, 42, 81–101 Search PubMed.
- J. J. Potoff and I. J. Siepmann, AIChE J., 2001, 47, 1676–1682 Search PubMed.
- P. P. Ewald, Ann. Phys., 1921, 369, 253–287 Search PubMed.
- C. E. Wilmer, K. C. Kim and R. Q. Snurr, J. Phys. Chem. Lett., 2012, 3, 2506–2511 Search PubMed.
- W. Zhang, A. Bu, Q. Ji, L. Min, S. Zhao, Y. Wang and J. Chen, ACS Appl. Mater. Interfaces, 2019, 11, 33931–33940 Search PubMed.
- S. Lin, Y. Zhao, J. K. Bediako, C.-W. Cho, A. K. Sarkar, C.-R. Lim and Y.-S. Yun, Chem. Eng. J., 2019, 362, 280–286 Search PubMed.
- G. Kresse and J. Furthmüller, Phys. Rev. B: Condens. Matter Mater. Phys., 1996, 54, 11169–11186 Search PubMed.
- G. Kresse and J. Hafner, Phys. Rev. B: Condens. Matter Mater. Phys., 1994, 49, 14251–14269 Search PubMed.
- G. Kresse and J. Hafner, Phys. Rev. B: Condens. Matter Mater. Phys., 1993, 47, 558–610 Search PubMed.
- G. Kresse and J. Furthmüller, Comput. Mater. Sci., 1996, 6, 15–50 Search PubMed.
- R. C. Klet, Y. Liu, T. C. Wang, J. T. Hupp and O. K. Farha, J. Mater. Chem. A, 2016, 4, 1479–1485 Search PubMed.
- J. Xu, J. Liu, Z. Li, X. Wang and Z. Wang, J. Mater. Sci., 2019, 54, 12911–12924 Search PubMed.
- K. M. Choi, H. M. Jeong, J. H. Park, Y.-B. Zhang, J. K. Kang and O. M. Yaghi, ACS Nano, 2014, 8, 7451–7457 Search PubMed.
- J. Zhang, S. B. Peh, J. Wang, Y. Du, S. Xi, J. Dong, A. Karmakar, Y. Ying, Y. Wang and D. Zhao, Chem. Commun., 2019, 55, 4727–4730 Search PubMed.
- K. Healey, W. Liang, P. D. Southon, T. L. Church and D. M. D'Alessandro, J. Mater. Chem. A, 2016, 4, 10816–10819 Search PubMed.
- G. C. Shearer, S. Chavan, J. Ethiraj, J. G. Vitillo, S. Svelle, U. Olsbye, C. Lamberti, S. Bordiga and K. P. Lillerud, Chem. Mater., 2014, 26, 4068–4071 Search PubMed.
- G. C. Shearer, S. Chavan, S. Bordiga, S. Svelle, U. Olsbye and K. P. Lillerud, Chem. Mater., 2016, 28, 3749–3761 Search PubMed.
- D. S. Sholl and R. P. Lively, J. Phys. Chem. Lett., 2015, 6, 3437–3444 Search PubMed.
- I. A. Koppel, P. Burk, I. Koppel, I. Leito, T. Sonoda and M. Mishima, J. Am. Chem. Soc., 2000, 122, 5114–5124 Search PubMed.
- M. M. Meyer, X.-B. Wang, C. A. Reed, L.-S. Wang and S. R. Kass, J. Am. Chem. Soc., 2009, 131, 18050–18051 Search PubMed.
- K.-P. Schröder, J. Sauer, M. Leslie, C. Richard, A. Catlow and J. M. Thomas, Chem. Phys. Lett., 1992, 188, 320–325 Search PubMed.
- J. Sauer, Faraday Discuss., 2016, 188, 227–234 Search PubMed.
- M. D. de Mello, G. Kumar, T. Tabassum, S. K. Jain, T.-H. Chen, S. Caratzoulas, X. Li, D. G. Vlachos, S.-I. Han, S. L. Scott, P. Dauenhauer and M. Tsapatsis, Angew. Chem., 2020, 132, 13362–13368 Search PubMed.
- A. J. Jones and E. Iglesia, ACS Catal., 2015, 5, 5741–5755 Search PubMed.
- S. Bordiga, C. Lamberti, F. Bonino, A. Travert and F. Thibault-Starzyk, Chem. Soc. Rev., 2015, 44, 7262–7341 Search PubMed.
- E. E. Platero, M. P. Mentruit, C. O. Arean and A. Zecchina, J. Catal., 1996, 162, 268–276 Search PubMed.
- M. Mihaylov, S. Andonova, K. Chakarova, A. Vimont, E. Ivanova, N. Drenchev and K. Hadjiivanov, Phys. Chem. Chem. Phys., 2015, 17, 24304–24314 Search PubMed.
Footnote |
| † Electronic supplementary information (ESI) available: Periodic MOF-808 models and S-MOF-808 models (CIF); tabulated summary of MOF-808 and S-MOF-808 models, additional discussion on ensemble-averaged proton affinity, and additional correlation diagram between proton affinity and Zr–O bond dissociation energy (PDF). See DOI: 10.1039/d1ma00330e |
| This journal is © The Royal Society of Chemistry 2021 |

