
 Open Access Article
 This Open Access Article is licensed under a
 Creative Commons Attribution 3.0 Unported Licence
The emergence of mass spectrometry for characterizing nanomaterials. Atomically precise nanoclusters and beyond
Clothilde
Comby-Zerbino
,
Xavier
Dagany
,
Fabien
Chirot
 ,
Philippe
Dugourd
and
Rodolphe
Antoine
*
,
Philippe
Dugourd
and
Rodolphe
Antoine
*
Univ Lyon, Université Claude Bernard Lyon 1, CNRS, Institut Lumière Matière, UMR 5306, F-69622 Lyon, France. E-mail: rodolphe.antoine@univ-lyon1.fr
First published on 24th May 2021
Abstract
Mass spectrometry (MS) is widely used in molecular science, and is now emerging as a characterization technique for ultra-small nanoparticles. In the field of atomically precise nanoclusters, MS combined to ionization sources such as electrospray and matrix-assisted laser desorption-ionization allows for accurate characterization of the size and charge state of the metal core and of the number of ligands. MS also enables monitoring the evolution of these characteristics during synthesis. When dispersion in nanomaterial composition increases, more relevant metrics are average mass and mass distribution, which can be estimated from electrospray mass spectra using correlation algorithms. Also complex mixtures can be analysed using separation techniques directly coupled with mass spectrometry. For larger nanomaterial compounds, cutting-edge charge detection mass spectrometry can even be used to access the megadalton mass range. In addition, recent MS advancements include the development of new hyphenated techniques such as ion mobility and action spectroscopy, revealing structural details and structure-optical properties relationships in these systems. The present perspective aims at capturing the growing importance and impact of these mass spectrometry based techniques completing the characterization toolbox in materials science.
1 Introduction
A century ago, the first mass spectrometer – originally called a parabola spectrograph – was constructed by Sir J.J. Thomson and gave birth to mass spectrometry (MS) by measuring the mass-to-charge ratio (m/z) values of gaseous ionized molecules.1 Then, mass spectrometry has been strongly associated with the analysis of organic molecules for which ionization techniques like electric discharge and electron impact were optimal.2 Slowly, the field of mass spectrometry moved towards more complex molecules like sugars, DNAs, and peptides but was hampered by the lack of efficient, non-destructive ionization methods. In late 1980's, the development of electrospray ionization (ESI)3 and of laser desorption based methods4 like matrix-assisted laser desorption ionization (MALDI)5 pushed the limit for ionization of macromolecules and constituted a breakthrough in MS, in particular for protein analysis.6 In parallel, mass spectrometers became more and more sensitive and accurate, with high resolving power. For instance, sub ppb sensitivity and sub-ppm mass accuracy are now routinely available (at moderate cost) from benchtop MS instruments.7,8 Beyond unique capabilities for the determination of chemical composition, MS can also provide structural information at different levels. It can be coupled to numerous dissociation techniques,9–11 thus enabling characterization of molecular bonding networks. Molecular species can also be characterized in terms of 3-dimensional structure and structural dispersity, based on the coupling of mass spectrometry with ion mobility spectrometry.12The capabilities of MS for composition and structure determination can be applied to the investigation of nanostructured materials.13 In particular, ultrasmall nanoparticles (USNPs), with sizes in the 1–3 nm range, exhibit unique properties, distinct from those of free molecules and larger-sized nanoparticles. However, the plethora of well-established analytical techniques used for obtaining the size distribution of nanoparticles (NPs) and information on their structure (e.g. transmission electron microscopy (TEM), scanning electron microscopy (SEM), dynamic light scattering (DLS), atomic force microscopy) are often not accurate enough to address size and associated dispersion for USNPs.14 In contrast, the typical molecular weights of USNPs is easily accessible with current mass spectrometers: USNPs lay in the kilo-Dalton (kDa) to mega-Dalton (MDa) mass range (Dalton, abbreviated Da, is a unit used in expressing atomic or molecular mass, defined as 1/12 the mass of a single atom of carbon-12). Moreover, soft ionization sources (ESI or MALDI) have proven to be extremely versatile to ionize and transfer intact USNPs in the gas phase.15–18
The properties of USNPs are greatly sensitive to both their composition and size. Developing strategies for producing USNPs with atomic precision, e.g. ultrasmall nanoparticles produced with a unique number of atoms (often called atomically precise nanoclusters) remains the holy grail in the field.19,20 In terms of structure, such atomically precise nanoclusters can be viewed as a “multi-shell system” composed of a metallic core, a metal–ligand interface, and the surface ligand molecules. Mass spectrometry is facing several challenges such as characterizing both the core size and its charge state, the number of protecting ligands, thus yielding a stoichiometry between ligand and metal. Current synthesis often involves complex ligand engineering strategies. The ligands themselves can be complex, for example large proteins, or large synthetic polymers can be employed as templates. On the other hand, multi-shells of different ligands also offer interesting possibilities, but in turn, adding mass dispersion when atomic precision is not reached. Thus, the characterization of such engineered USNPs by mass spectrometry has to find the right balance between the precise determination of metal/ligand stoichiometry and a proper characterization of mass dispersity. This review, illustrated by pedagogic examples from the literature, aims at providing an overview of the recent advances in the characterization of protected metal nanoclusters by mass spectrometry. We will particularly focus on the different challenges related to the different levels of mass dispersity displayed by UNSPs ranging in the kilodalton to the megadalton mass range.
2 Mass spectrometry of nanomaterials
In the 1980s, thanks to the development of advanced cluster sources (supersonic expansion, laser-desorption ionization sources),21,22 mass spectrometry became an indispensable tool for the characterization of gas-phase bare metal clusters,23,24 as well as fullerenes,25 carbon26 and silicon clusters.27,28 In the 1990s, the landmark synthesis by Brust and co-workers of thiolate monolayer-protected gold nanoparticles, opened the route to reach gold core dimensions smaller than 3 nm by wet chemistry synthesis.29,30 These ultra-small nanoparticles (often called monolayer-protected clusters) have been representing an active field in nanoscale community these last 15 years. Following the Brust synthesis, Whetten and co-workers did seminal works to determining the chemical composition of gold nanoclusters in the 1–3 nm size range, using mass spectrometry (in the 10–300 kDa mass range).31–34 Since then, MS has been growingly used by material chemists and inorganic chemists for the characterization of various types of ultra-small nanoparticles and nanoclusters. Most MS analyses conducted on nanoclusters were done using either ESI or MALDI ionization sources in both positive and negative modes.17,35 ESI is known to produce gas-phase ions with relatively broad charge states distributions. In contrast, MALDI (due to the inherent low charge transfer process between matrix and analytes) generally yields ions with lower charge states (typically 1 or 2 charges per ion), resulting in narrower charge distributions, as illustrated by Fig. 1 (left bottom panel). In the following, we will mainly focus on reviewing MS examples on monolayer-protected metal clusters. Atomically precise nanoclusters (NCs) are designed to contain a definite number of core metal atoms, protected by a well-defined number of surface ligands. Consequently, the mass spectra obtained for such nanoclusters show similarities with that of large molecules. They usually display sharp peaks corresponding to species with the exact same composition in terms of the number of core atoms and surface ligands. Depending on the ionization source, species with different net charges are often present, yielding a series of peaks (see Fig. 1 left panel). If such simple and clean spectra are acquired with sufficient mass resolution and accuracy, it is often possible to resolve an isotopic pattern and to precisely determine the monoisotopic mass of the nanoclusters. As for molecular species, assignment of an atomic composition is then possible, based on a match between the measured value of the monoisotopic mass and that computed for candidate raw formulas. Such assignment can even be consolidated by the comparison of the experimental isotope pattern (relative intensity of the different peaks) to simulated isotopic distributions. In this vein, careful studies using high resolution mass spectrometry (HRMS) from Murray36–38 and coworkers and Tsukuda and coworkers,39–44 among others, have determined the molecular formulas (e.g. number of metal atoms and number of ligands) of metal nanoclusters. Long confined to a technique among many others, MS and in particular HRMS is currently emerging as a gold standard for characterizing atomically precise nanoclusters.16,17 Further applications of HRMS will be described in Section 2.1.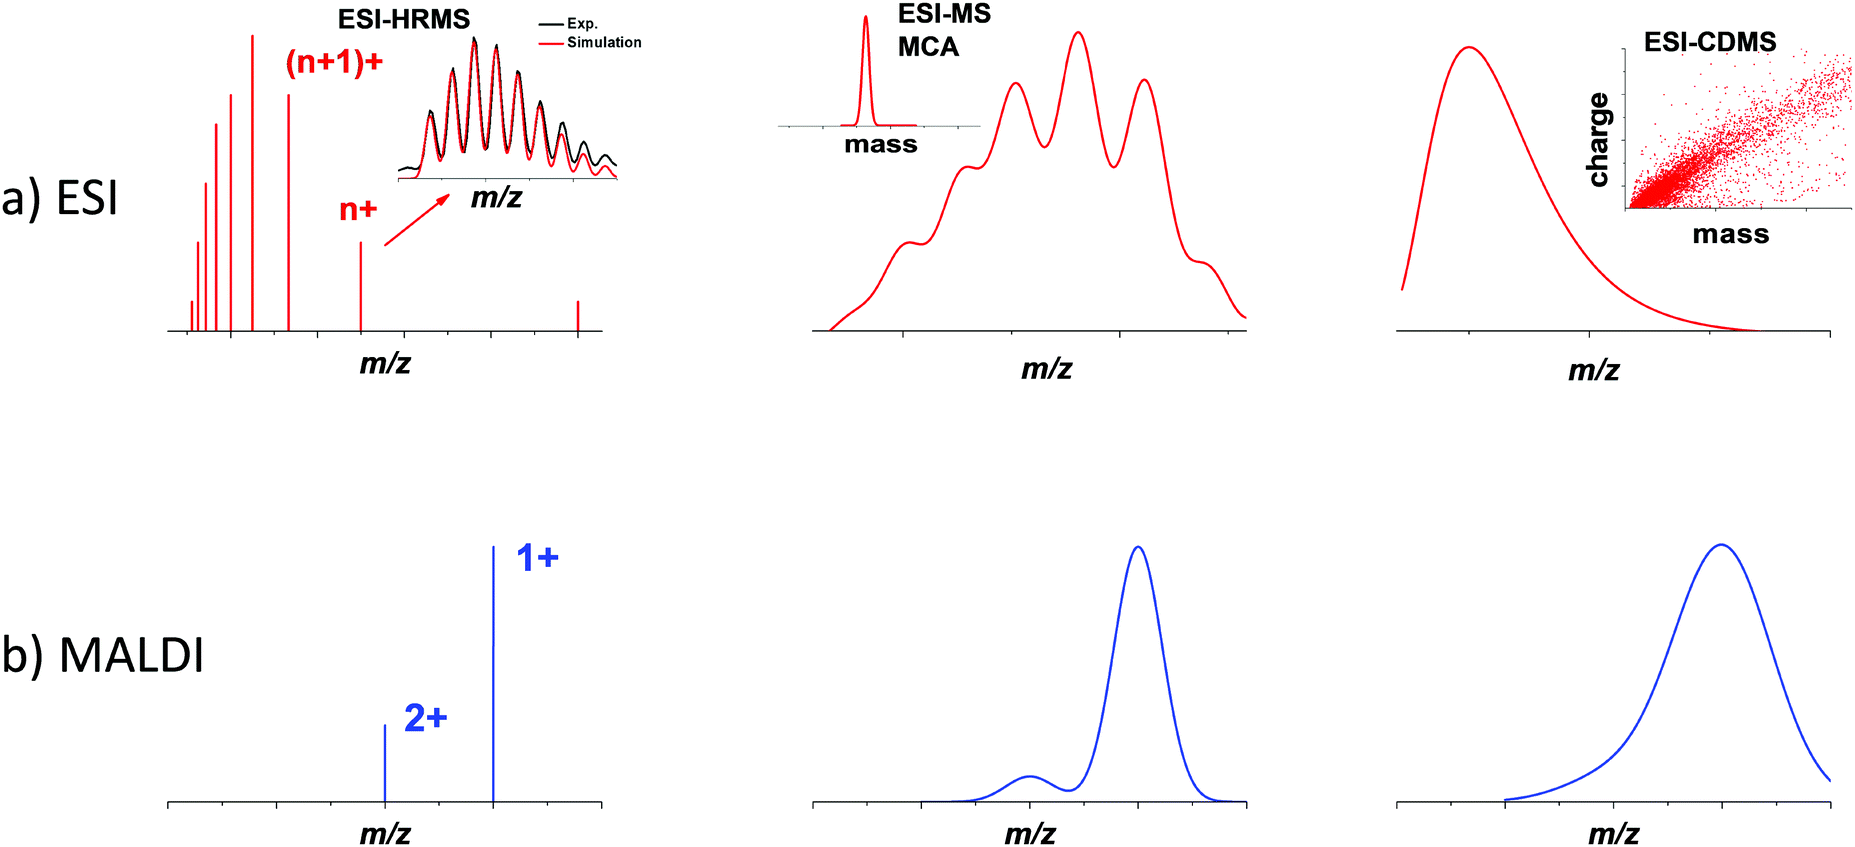 | ||
| Fig. 1 Schematic illustration of mass spectra with ESI and MALDI ionization sources and mass spectrometry devices for nanomaterials with increasing mass and dispersity. High-resolution mass spectrometry (HRMS) is usually used for atomically precise nanoclusters, multiplicative correlation algorithm (MCA) in combination with ESI-MS may be useful for mass characterization of polydisperse nanoclusters (in the mass range 10–100 kDa), while for nanomaterials with mass exceeding megadalton, mass distribution can be obtained using charge detection mass spectrometry (CDMS). | ||
Atomic precision is nevertheless rarely fully achieved, and nanocluster samples often display some dispersity in their composition. Dispersity can arise from the number of protecting ligands, even if the number of core atoms is conserved among the different species. When several ligands are present, different stoichiometry can also be observed. Moreover, oligomers corresponding to the bonding between different clusters, with or without coalescence of the cores, is also possible, as well as partial degradation of the species initially synthesized. All these sources of dispersity yield species with different masses, which can, in principle, be separated and characterized by mass spectrometry. Additionally, structural dispersity (i.e. the coexistence of different isomers), or charge dispersity (different charge states, especially of the core) are also important to characterize. However, their impact on the mass and charge distributions observed by MS is often difficult to interpret, and requires complementary methods (see Section 3).
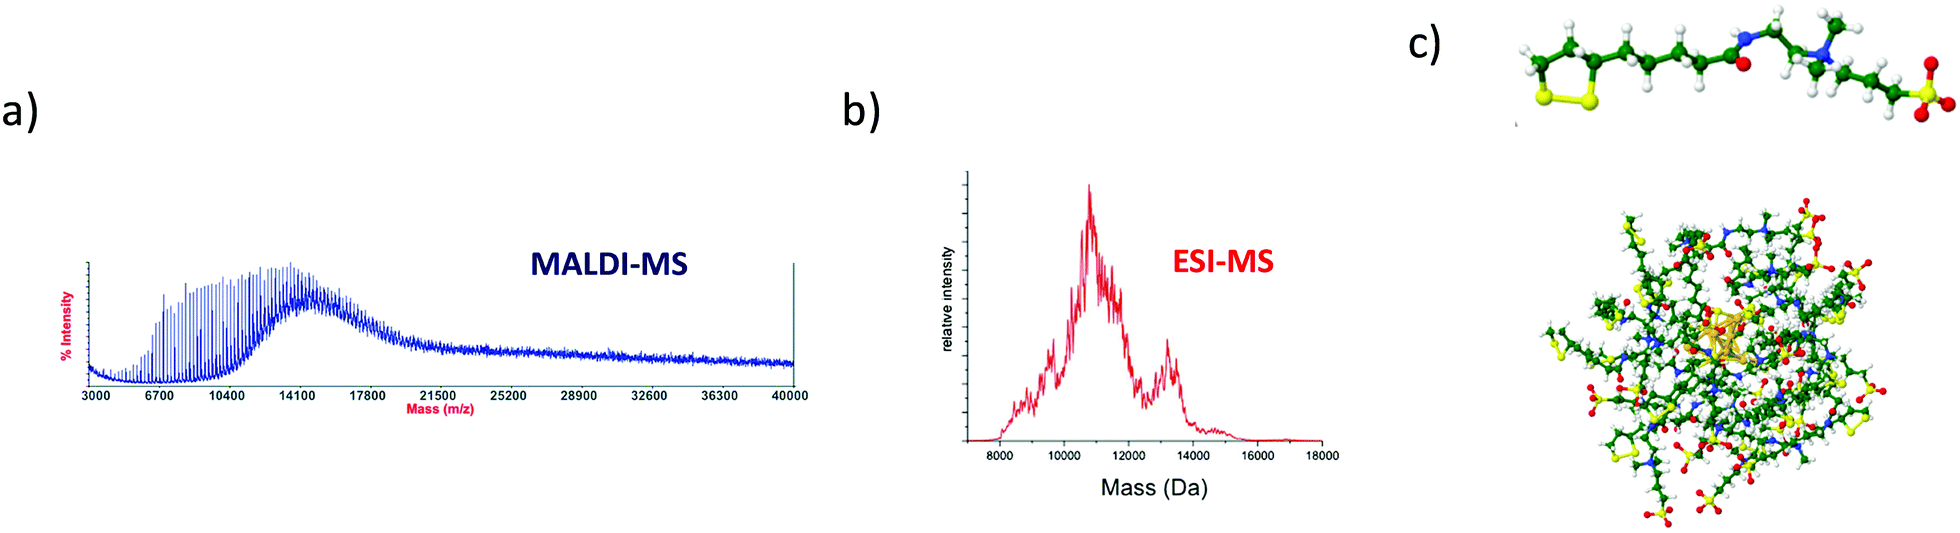
Even if a plethora of peaks are observed in mass spectra, it is in principle possible, using high resolution and high precision instruments to assign a raw formula to each peak. However, the instruments required are extremely expensive, and the deconvolution procedures are relatively complicated and time-consuming. Moreover, the combination of the above-cited dispersity factors often lead to “quasi-continuous” mass distributions (see Fig. 1 middle panel), with large dynamic range in concentrations, which makes any mass assignment often impossible. In such cases anyway, the exhaustive determination of all species present, is not only unattainable, but also poorly relevant. However, determining the average mass in a polydisperse cluster sample is of paramount interest, because it allows estimating the average core size and the average number of ligands. Based on advanced deconvolution procedures for ESI-MS spectra and using assumptions for average charge states for MALDI-MS spectra, it is possible to extract an average mass and its dispersion for small polydisperse nanoparticles. For instance, Dass and coworkers pushed the limit of MALDI-MS analysis for mass characterization of large gold NCs, in the sub-megadalton range of mass, as displayed in Fig. 2. But here, some assumptions on the charge state and on the power correlation between the number of gold atoms and the thiolate ligands are required to obtain a chemical composition.45,46 The potential of MS to determine the average composition of polydisperse clusters in terms of ligands and core size, and the associated dispersion (instead of raw formulas) will be discussed in Section 2.2.
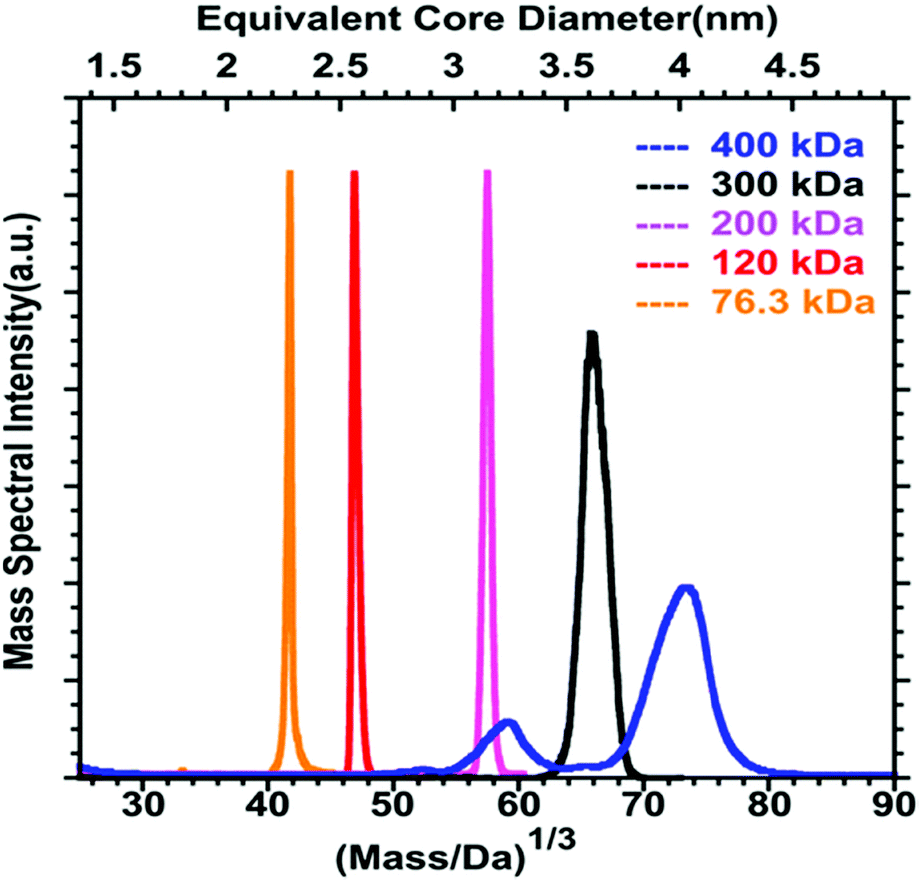 | ||
| Fig. 2 MALDI-MS of 76.3 to 400 kDa nanoparticles synthesized using HSC6H13 thiol. Mass spectrum data are plotted versus the cube root of mass to allow comparison with the core equivalent diameter (reprinted with permission Copyright© 2018 American Chemistry Society).45 | ||
Finally, when nanoparticles are produced without atomic precision, then size and mass dispersions can be high and when masses exceed several megadaltons, mass spectra are characterized by a broad envelope without any resolved pattern (see Fig. 1 right panel). Without hypothesis on the average charge of nanoparticles, it is impossible to extract information from mass spectra. We will show however that charge detection mass spectrometry that measures the mass (or more exactly m/z) and charge at the single ion level can provide accurate mass distributions for larger nanoparticles (see Section 2.3).
2.1 High-resolution mass spectrometry for atomically precise nanoclusters
Modern mass spectrometers, in particular based on the time-of-flight technology widely used in the nanoclusters community, can reach high resolving power (>50![[thin space (1/6-em)]](https://www.rsc.org/images/entities/char_2009.gif) 000) and mass accuracy (≤few ppm). With such mass accuracy and resolution capabilities, then the comparison between experimental and simulated isotopic distribution pattern (of the Au, Ag, Pt, Pd, etc. metals and that of atoms present in the ligands) for a given chemical formula (MnLm: n number of M metal and m number of L ligand) allow for “confident” nanocluster assignment. As an illustration, ESI-HRMS of Au25 protected by 18 MBA ligands (MBA mercaptobenzoic acid) is presented in Fig. 3. Of note, the observed isotope pattern was resulting from the coexistence of species with different raw formulas, including [Au25-ortho-MBA18-6H]5− but also [Au25-ortho-MBA18-5H]5− and [Au25-ortho-MBA18-4H]5− in respective proportions of 51.0%, 30.9%, and 18.1%.47 Clearly, as pointed out by Hayton and coworkers,48 the comparison of simulated isotope patterns and masses of observed mass spectral peaks should be taken with great care, since many factors can affect mass spectra (ion suppression, ion fragmentation, and adduct formations and reactions with the matrix…). Indeed, many works in the literature using MS as “characterization tool” have led to erroneous mass assignment of nanoclusters. One of the most striking examples was given by new chemical compositions of the glutathione protected gold clusters determined previously by electrospray ionization (ESI) mass spectrometry and reassessed by taking advantage of freshly prepared samples, higher mass resolution, and more accurate mass calibration.41 It also worth citing the story of monodisperse Au25L18, initially identified as Au28L16 and as Au38L24 before a correctly identification could be done by electrospray-ionization mass spectrometry.49 Even with MS instrument providing high resolution and high mass accuracy, gas phase NCs may appear in the form of [MnLm ± xH]z+/− (addition of protons or deprotonations) or [MnLm + xAd]z+, [MnLm + yAd]z− (addition of other adduct ions, Ad, present in synthetic process). Such adducts may induce difficulties or even errors to correctly assign the nanocluster composition.50 For mixtures of nanoclusters, performing desalting procedure before MS analysis, can lead to much better mass assignment.51 Usually, the composition, size, and monodispersity can be determined by high resolution mass spectrometry for atomically precise nanoclusters, in addition with other characterization techniques (usually NMR, FT-IR, X-ray absorption and photoelectron spectroscopies), and this was done mostly for nanoclusters containing gold or silver.52–79 HRMS was also applied for characterizing atomically monodisperse copper,80–86 nickel,87–89 cobalt,90 palladium91 nanoclusters and molecule-like CdSe nanoclusters.92
000) and mass accuracy (≤few ppm). With such mass accuracy and resolution capabilities, then the comparison between experimental and simulated isotopic distribution pattern (of the Au, Ag, Pt, Pd, etc. metals and that of atoms present in the ligands) for a given chemical formula (MnLm: n number of M metal and m number of L ligand) allow for “confident” nanocluster assignment. As an illustration, ESI-HRMS of Au25 protected by 18 MBA ligands (MBA mercaptobenzoic acid) is presented in Fig. 3. Of note, the observed isotope pattern was resulting from the coexistence of species with different raw formulas, including [Au25-ortho-MBA18-6H]5− but also [Au25-ortho-MBA18-5H]5− and [Au25-ortho-MBA18-4H]5− in respective proportions of 51.0%, 30.9%, and 18.1%.47 Clearly, as pointed out by Hayton and coworkers,48 the comparison of simulated isotope patterns and masses of observed mass spectral peaks should be taken with great care, since many factors can affect mass spectra (ion suppression, ion fragmentation, and adduct formations and reactions with the matrix…). Indeed, many works in the literature using MS as “characterization tool” have led to erroneous mass assignment of nanoclusters. One of the most striking examples was given by new chemical compositions of the glutathione protected gold clusters determined previously by electrospray ionization (ESI) mass spectrometry and reassessed by taking advantage of freshly prepared samples, higher mass resolution, and more accurate mass calibration.41 It also worth citing the story of monodisperse Au25L18, initially identified as Au28L16 and as Au38L24 before a correctly identification could be done by electrospray-ionization mass spectrometry.49 Even with MS instrument providing high resolution and high mass accuracy, gas phase NCs may appear in the form of [MnLm ± xH]z+/− (addition of protons or deprotonations) or [MnLm + xAd]z+, [MnLm + yAd]z− (addition of other adduct ions, Ad, present in synthetic process). Such adducts may induce difficulties or even errors to correctly assign the nanocluster composition.50 For mixtures of nanoclusters, performing desalting procedure before MS analysis, can lead to much better mass assignment.51 Usually, the composition, size, and monodispersity can be determined by high resolution mass spectrometry for atomically precise nanoclusters, in addition with other characterization techniques (usually NMR, FT-IR, X-ray absorption and photoelectron spectroscopies), and this was done mostly for nanoclusters containing gold or silver.52–79 HRMS was also applied for characterizing atomically monodisperse copper,80–86 nickel,87–89 cobalt,90 palladium91 nanoclusters and molecule-like CdSe nanoclusters.92
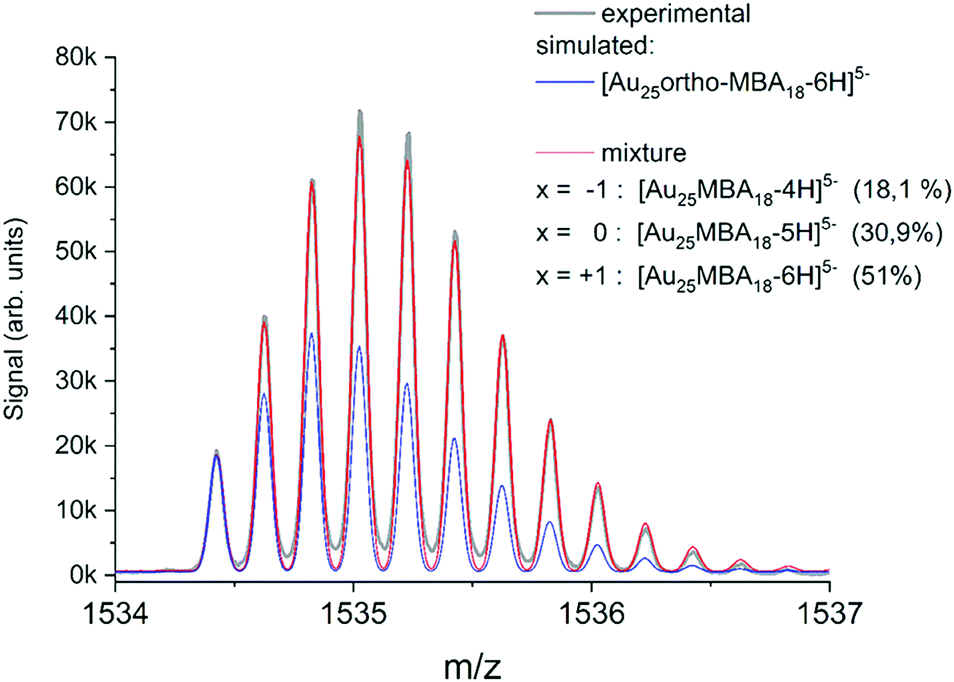 | ||
| Fig. 3 (Black line) Experimental isotope pattern for [Au25-ortho-MBA18]5−. (Blue line) Simulated isotope patters for [Au25-ortho-MBA18-6H]5− adjusted to fit the intensity of the experimental monoisotopic peak. (Red line) Fit obtained by considering a mixture of species with different deprotonation patterns, corresponding to different charge shifts x. (reprinted with permission Copyright© 2020 American Chemistry Society).47 | ||
In order to better tune chemical/physical properties of atomically precise metal nanoclusters, several strategies have been adopted in particular using either ligand engineering or metallic kernel (or core) alloying. Synthesis and composition characterization of alloyed nanoclusters are necessary from both scientific and practical aspects.93 Due to specific isotope patterns of the metals (Au, Ag, Pt, Pd, etc.), HR-MS has proven particularly useful to determine the composition of alloyed nanoclusters, in particular for gold-doped silver94–98 and silver-doped gold99–103 nanoclusters. MS investigations of Pt and Pd doping on noble metal clusters were also reported.104–108 High-resolution mass spectrometry was also applied to monitor the atom-by-atom substitution of Fe and Ni to the core of a well-defined ligated cobalt nanocluster.109 Alloying metallic kernel from monometallic to tetrametallic was also demonstrated and the monodispersity of each alloyed nanocluster was characterized by electrospray ionization mass spectrometry analysis.98,110 By recording mass spectra as a function of time, the evolution of the composition of a reacting mixture can even be monitored, which allows a better comprehension of the formation process, especially for alloyed nanoclusters.108,111–114 The Xie group and Pradeep group did impressive works using these approaches.16,17 In particular, time-dependent electrospray ionization mass spectrometry was found to be a powerful tool to follow the formation of MAuxAg28−x(BDT)12(PPh3)4 (x = 1–12) and bimetallic AgxAu25−x(PET)18 (x = 1–7) NCs during complex intercluster reaction, as illustrated in Fig. 4.110,115
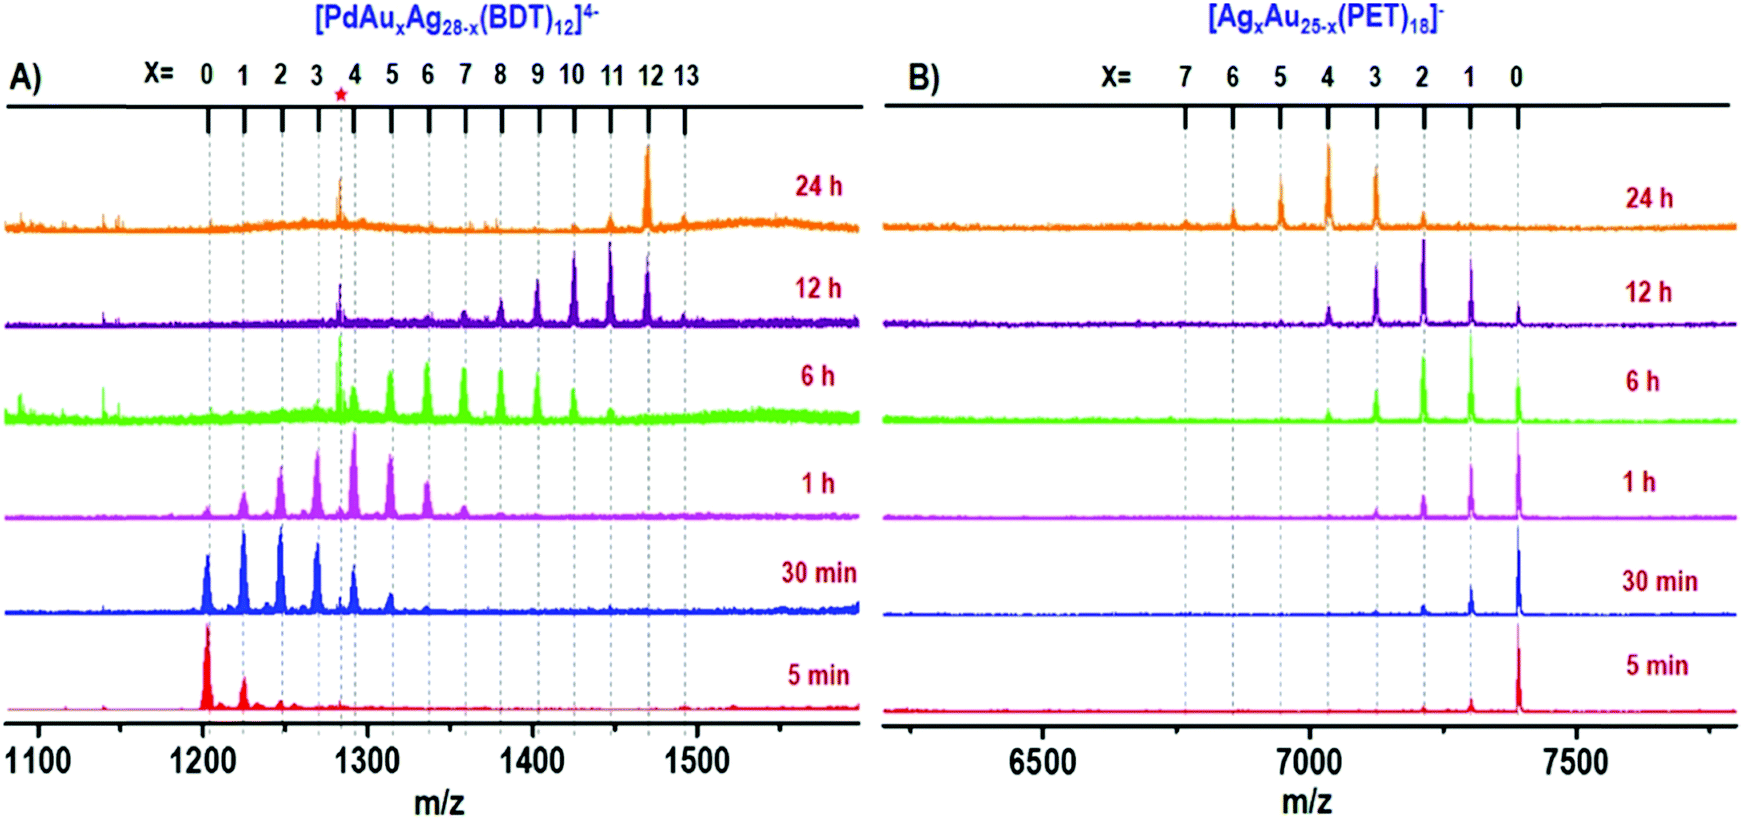 | ||
| Fig. 4 Time-dependent ESI MS of intercluster reaction between PdAg28 and Au25 (1:5 ratio) where panel (A) shows the reaction at the PdAg28 side and panel (B) presents the reaction at the Au25 side. The red asterisk corresponds to thiolates produced during the reaction. The species observed are [PdAuxAg28−x(BDT)12]4− and [AgxAu25−x(PET)18]−. (reprinted with permission Copyright© 2019 American Chemistry Society).110 | ||
Surface modification by specific functional groups is another effective approach to tune properties of nanoclusters for practical applications. Current strategies to engineer surface of metal nanoclusters employ multiple protecting ligands, ligand exchange or etching processes. Murray and co-workers studied Au25 NCs with ligand-exchanged mixed monolayers (thiophenolate, hexanethiolate, or biotinylated ligands) using ESI-MS.116,117 Mass spectrometry was again powerful for characterizing ligand exchange reactions in protected nanoclusters with selenolates or tellurolates.118–121 Again, time dependent experiments have permitted to push forward the understanding of the formation of cluster size conversion or surface ligand modifications as a function of ligand exchange strategies,122–126 reactive agents127–133 or etching process.134,135
Probing the charge state of the metal core (or kernel) of nanoclusters is also an exciting field of investigation. Indeed the total charge on nanoclusters may drive its reactivity.122,136,137 Therefore, efficient tools able to probe the charge states of metal nanoclusters are critical to investigate their potential application. Nuclear magnetic resonance (NMR), cyclic voltammetry138 and optical absorption spectroscopy can be used to address the charge state of metal nanoclusters.139–141 However, MS approaches were also successful. On the basis of detailed ESI-MS analysis, Tsukuda and coworkers studied the charge states of Au25 nanoclusters.142 Following this approach, our group further investigated Au NCs protected by glutathione ligands.143 The charge assignment was complicated by the fact that the total charge of the cluster ([Aun(SG)m-(p)H]q−) is a combination of p charges hold by several deprotonations on ligands and the charge of the gold kernel (q-p). In particular, using glutathione as ligand molecule, clusters with sizes superior to Au22(SG)17 were found to bear a negative kernel charge. Indeed, for such sizes, the gold core is sufficiently large to accommodate an excess electron. Charge states for clusters protected by “neutral” ligands (that do not ionize easily in the gas phase) were also reported in the literature using extra charging with alkali adducts144 or in the negative mode of ionization of electrospray for nanoclusters holding negative charges on the cluster core.145 Finally, our group has recently investigated the heterogeneity in the charging patterns of Au25MBA18 clusters by mass spectrometry. For a given charge state of those clusters, it was shown that several populations with different protonation patterns coexist (see Fig. 3).47
2.2 Mass spectrometry for polydisperse nanoclusters. Multiplicative correlation algorithm
Atomically precise nanoclusters are only a narrow class of ultra-small nanoparticles. Generally, synthesis lead to mixtures of clusters composed of different numbers of both core atoms and of the surface capping agents leads to charge and mass dispersion. This is particularly true for a specific class of nanocluster, e.g. protein templated metal nanoclusters. While ESI-MS is the gold standard for analyzing many proteins, only very few analyses of protein protected clusters by ESI MS have been reported.146 It is likely that ESI ionization efficiency is dramatically lowered due to the presence of counter ions from the synthesis procedure.147 Following the first MALDI-MS spectrum reported by Xie and coworkers for BSA-templated gold nanoclusters,148 efforts have been made, mainly by Pradeep's group, to use MALDI-MS to characterize protein-templated metal nanoclusters.149 MALDI matrices are crystal-forming organic molecules used to enhance the vaporization of poorly-volatile analytes, and their ionization through charge transfer capability. Typically sinapic acid (SA), α-cyano-α-hydroxy cinnamic acid (CHCA) and others,150 used for proteins are also suitable for protein-templated metal nanoclusters. Commercial MALDI TOF instruments coupled to standard 337 nm N2 laser are generally used. MALDI-MS spectra usually show both bare proteins and the corresponding protein-templated metal nanoclusters displaying a broad unresolved peak shifted by few kDa due to the presence of the gold core. However, the observed broad envelopes on MS spectra prevent from any clear assignment of the exact number of gold atoms and its possible dispersion. So far, gold and silver nanoclusters templated by a large variety of proteins (i.e. bovine and human serum albumin, bovine lactoferrin, human serum transferrin, hemoglobin, insulin, lysozyme, trypsin, horse radish peroxidase, pepsin, egg white, egg shell membrane, human hair, chymotrypsin) have been characterized by MALDI-MS, as reviewed by Pradeep et al.53,149Beyond mass characterization, the mechanisms of the formation of protein-protected nanoclusters have also been investigated by MS. Especially, Pradeep's group used time-dependent mass spectrometry of the reaction mixture in order to systematically monitor the first step of the growth of the cluster within the protein template.151–153 Matrix-assisted laser desorption ionization mass spectrometry was also used to document the pH-dependent and time-dependent in situ growth of Au NCs in protein.154 Recently, Shu-Hui Chen and coworkers intended to elucidate the core ligand sequence and key residues responsible for protein-encapsulated gold nanoclusters formation and stabilization using MALDI-MS, LC-MS/MS, and proteomics by developing a proper workflow and sample preparation method.155
Other strategies have been explored to tune properties of ultrasmall nanoparticles. For instance, metal clusters can be protected by multi-shells of ligands (using multidentate zwitterionic ligands). Also one can play with the ratio between the reducing and protecting agent leading to a subtle balance between metal kernel and shell of oligomeric Au(I)-ligand complexes. Such strategies in turn yield a strong mass and charge dispersion.156,157 As an illustration Fig. 5 displays the MALDI-MS spectrum of gold nanoclusters stabilized by a shell of zwitterion ligands (AuZw nanoclusters). A continuous band centered at m/z 14500 is observed along with equally spaced sharp peaks at lower masses. The broad band corresponds to highly polydisperse intact Au NCs associated with the ligand by covalent and no covalent bonds. Discrete peaks are attributed to the fragmented Au NC core. In such case, the MALDI spectrum clearly contains poor information on the composition of the clusters. Our group proposed to use the ESI ionization mode to better characterize such nanoclusters. Ligands protecting NCs often contain multiple groups easily ionized by ESI. The resulting ions are then highly charged, and different charge states are formed. The ESI spectrum is then more complex than the MALDI spectrum, but still poorly resolved. However, instead of a single broad band corresponding to the whole cluster, a series of bands is visible (as illustrated in Fig. 1 middle panel). These bands correspond to the different charge states of the whole cluster, and their distribution (decreasing inter-distance as m/z decreases) is characteristic of its mass and charge. We developed a multiplicative correlation algorithm (MCA) to estimate the mass of nanoparticles from such spectra.158,159 The multiplicative correlation was specifically designed to enhance the deconvoluted signal when the parent molecule is distributed into several charge states in the spectrum measured. As seen in Fig. 5, for gold nanoclusters stabilized by a shell of zwitterion ligands, the deconvoluted ESI-MS spectrum allows to determine their mass distribution (centered at 11000 Da with a second minor distribution at ∼13500 Da).160 Thus, possible molecular formula for AuZw (≈11 kDa) (see Fig. 5c) could be Au12Zw22. Such deconvolution approaches with ESI-MS measurements were found to be well-adapted for solving mass distributions of polydisperse gold nanoclusters51,160–165 as well as for ultrasmall Gd-based silica NPs.166–173
 | ||
| Fig. 5 (a) MALDI-MS and (b) Deconvoluted ESI-MS spectra of gold nanoclusters protected by multi-shells of thioctic bidentate zwitterionic ligands. (c) Possible structure for nanoclusters Au12Zw22 (with thioctic-zwitterion ligand (Zw, C15H30N2O4S3). Adapted with permission Copyright© © 2017 AIP Publishing and © 2014 and 2019 RSC Publishing).157,160,257 | ||
2.3 Mass spectrometry beyond nanoclusters. Charge detection mass spectrometry
Larger particles with higher molecular weight, e.g. megadalton or even larger, are also of interest in the nanoscale community. Indeed, recent strategies have emerged to produce self-assemblies of atomically precise noble metal nanoclusters with potential applications in various fields of science. More generally, due to their well-defined structure, metal NCs have become promising functional building blocks of metamaterials for various practical applications. Arrangement of functional building blocks into ordered hierarchy architectures is an alternative means to enhance individual properties by synergetic effects. Such controlled self-assemblies are supposed to have very large molecular weight with strong mass dispersion, beyond the scope of traditional MS techniques. Indeed, for such nanomaterials, the electrospray ionization may lead to highly charged species for which the charge state resolution is then lacking. On the opposite, producing low charge states of such large species (e.g. using MALDI-MS) results in ions with m/z so large that the detection efficiency is dramatically reduced using conventional technologies. In addition, mass spectra are characterized by a broad envelope without any resolved pattern (see Fig. 1 right panel). Without hypothesis on the average charge of particles, it is then impossible to extract any mass information. One way to overcome this limitation is to measure independently the mass (or more exactly the m/z) and the charge z of each ion. This can be fulfilled by the charge detection mass spectrometry (CDMS) technique. CDMS is based on a very simple concept: an ion passing through a conducting cylinder will induce an image charge (proportional to its charge) on the cylinder. Then the charge of the ion can be determined by measuring the amount of charges flowing to the cylinder. The velocity of the individual incoming ion is then obtained from the cylinder length and from the duration of the image charge signal, corresponding to the ion entering and exiting the tube. The m/z of the ion is determined from its energy and velocity. The mass of each ion is finally obtained from the measured charge z and m/z. In 1995, Fuerstenau and Benner174 coupled CDMS to ESI and really pioneered this technique in analyzing macromolecules in the MDa range, and paved the way to the future studies of biological species and nanoparticles. In more recent years, thanks to the impressive technical developments proposed by the group of Jarrold,175 CDMS was dramatically improved, enabling the determination of stoichiometry of bio-assemblies. In our group, we were interested in pushing the limits of CDMS for the determination of the mass and charge distribution of very heterogeneous samples containing nanoparticles.165,176–179 We recently pushed the envelope of characterization of both ligand protected gold nanoclusters and their assembly following zinc-ion-induced aggregation by measuring their entire molar mass distribution by mass spectrometry based methods.180Fig. 6b shows the ESI MS spectrum of precursor gold NCs are of stoichiometry Au10MPA10 with additional Au11–12MPA11–12. Addition of an excess of zinc ions to the as-prepared Au NCs solution, leads to the formation of zinc-mediated complexation reaction-based aggregates of AuNCs for which molar mass information were obtained using charge-detection mass-spectrometry. A mass histogram from the controlled zinc-ion-induced aggregates of AuMPA NCs shows a broad distribution extending from ∼75 MDa to more than ∼1 GDa, illustrating the ability of CDMS to characterize a large polydispersity of the sub-30 nm nanoparticles. We also demonstrated the interest of CDMS to characterize gold-thiolate self-assemblies.178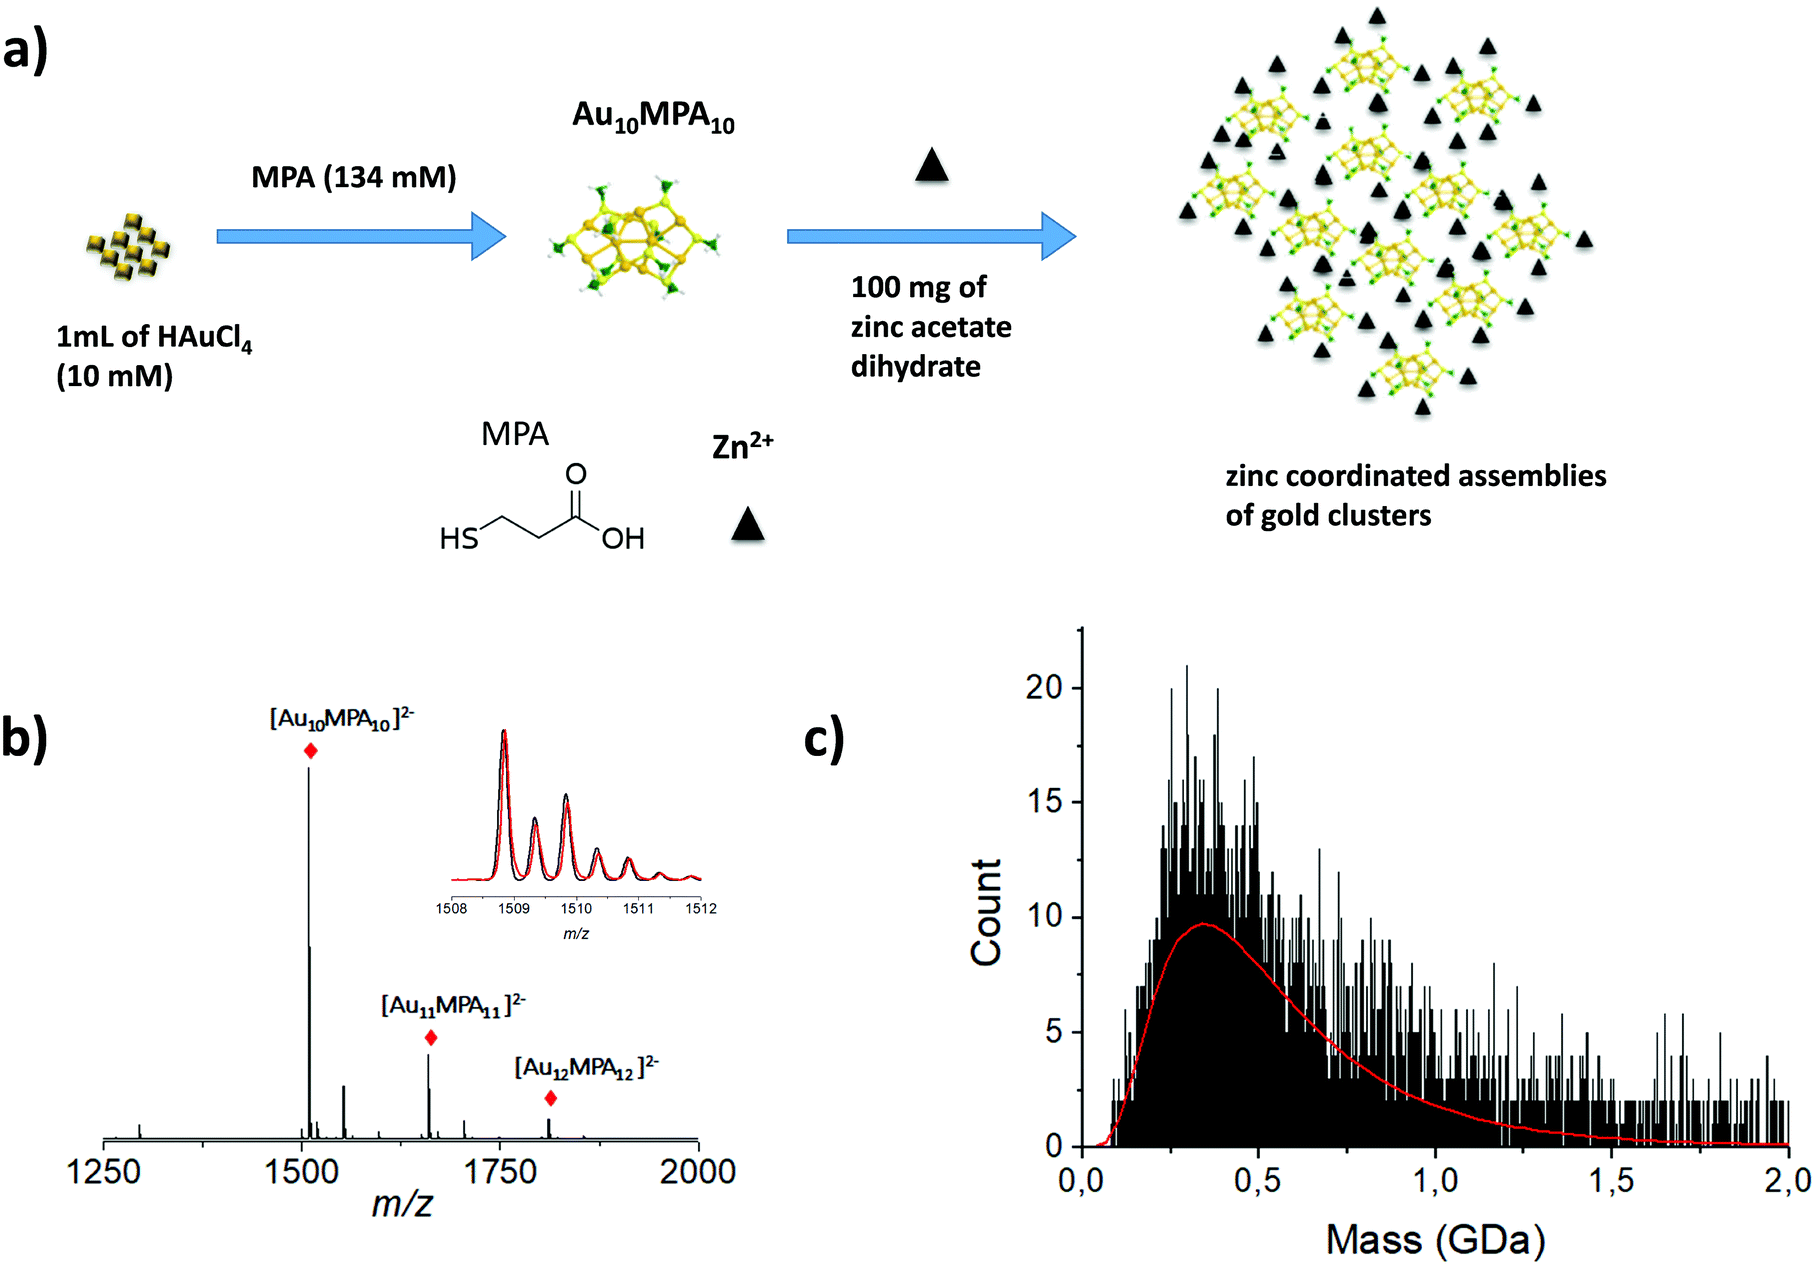 | ||
| Fig. 6 (a) Schematic illustration of the synthesis process of MPA AuNCs (Au10MPA10) adding zinc ion due to trigger aggregation of the MPA AuNCs. (b) Experimentally observed ESI-MS spectrum in negative mode of ionization of Au MPA NCs. Inset: Experimentally observed (red) and simulated (black) ESI-MS isotopic patterns of the 2-charge state of Au10MPA10 nanoclusters. (c) Mass histograms for the zinc induced MPA aggregates, obtained by charge-detection mass spectrometry (CDMS) measurements. Experimental distributions are fitted with lognormal distributions (red curve). (Reprinted with permission Copyright© © 2021 RSC Publishing).180 | ||
3 Couplings
While the above examples have demonstrated the interest in MS as an efficient tool for the mass characterization of ultrasmall nanoparticles (and in particular atomically precise nanoclusters), two areas are still not correctly addressed by this technique for their exhaustive analysis: (i) deep insight into their structural motifs and the chemical composition and (ii) exhaustive characterization of mixtures in nanomaterials samples. Interfacing MS with a (offline or online) separation method helps to better discriminate complex samples. Also, no structural information can be drawn from the only mass measurement. Fortunately, techniques like ion mobility–MS (IM-MS) and tandem MS (MS/MS) including photodissociation and action spectroscopy are able to provide structural information.3.1 Separation techniques
In early works following the Brust method, synthesis led usually to mixtures of ultrasmall nanoparticles or nanoclusters. And clearly, the addition of separation techniques was helpful to exhaustively characterize synthesis products. Polyacrylamide gel electrophoresis (PAGE), high-performance liquid chromatography (HPLC), and thin-layer chromatography (TLC) are the most popular separation methods developed for monolayer protected metal clusters and related clusters. Characterization, analysis, and separation of mixtures of clusters by chromatography have been pioneered by Whetten group.31–33 A recent review on these techniques applied to thiolate (SR)-protected gold clusters was recently published by Negishi et al.181 In particular, PAGE was demonstrated to be an efficient technique to separate complex cluster synthesis mixtures prior to ESI-MS analysis (off-line coupling), for which the composition of glutathione protected gold41 and silver55,182 nanoclusters was correctly assigned. Size exclusion chromatography has permitted to isolate thiolate-protected gold nanoclusters with core mass of 12 kDa, the collected eluates was then analyzed by ESI-MS to determine the predominant cluster species.183 Size-dependent electrophoretic migration and separation of water-soluble gold nanoclusters were also obtained by capillary electrophoresis.184HPLC benefits from high resolution and repeatability.185,186 This technique also has the advantage to be straightforwardly coupled online with electrospray ionization (ESI) mass spectrometry (MS), as opposed to separation by other techniques (PAGE). Thus, it is possible to determine the chemical composition of very minor components that cannot be detected by PAGE. Some of the recent developments include direct coupling of chromatographic techniques to MS. Our group for instance was able to study ultrasmall nanoparticles by combining HPLC and ESI-MS. Time-dependent experiments were conducted on ultrasmall Gd-based silica sub-5 nm nanoparticles aiming at recording both chromatograms and associated mass spectra as a function of time and have permitted to bring new information on the aging processes in such USNPs (as illustrated in Fig. 7).159 Black et al. coupled reversed-phase chromatography and capillary LC with mass spectrometry and separated gold clusters of varying core sizes from their mixtures.187–191 As illustrated in Fig. 8, they demonstrated that using volatile trimethylamine as an ion-pair reagent enhances separation of Aun(m-MBA)m clusters (m-MBA = m-mercaptobenzoic acid; n = 48–67, m = 26–30), then allowing the determination of their composition.190
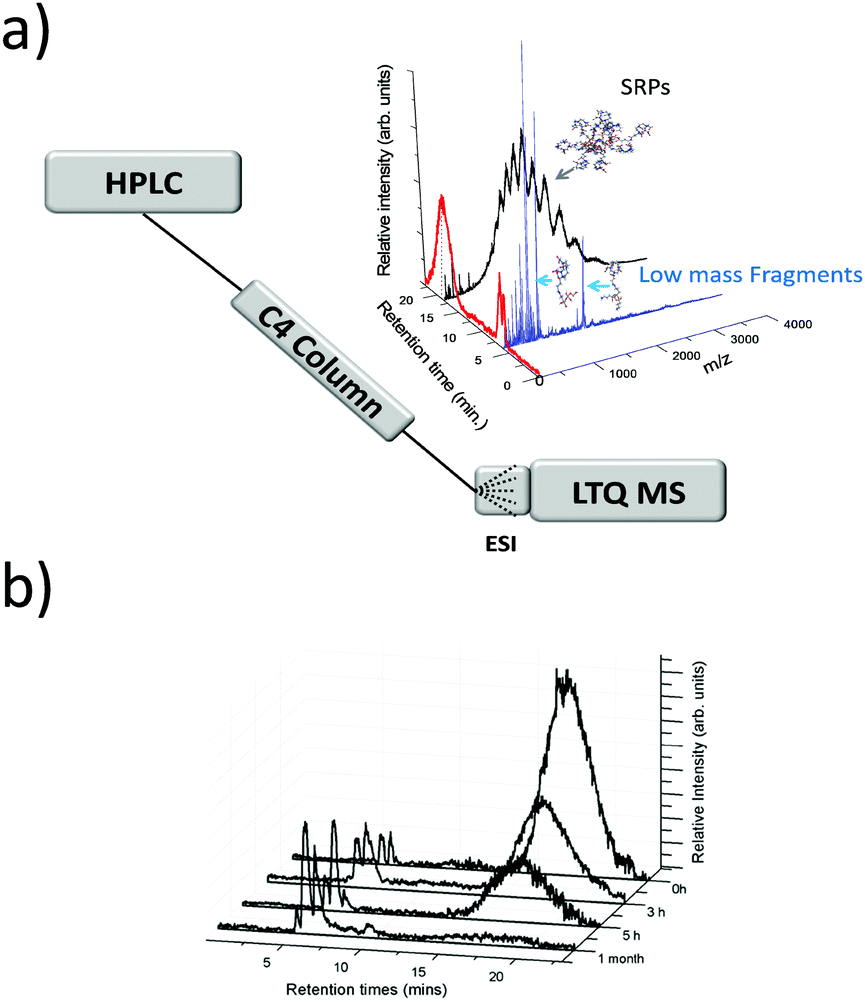 | ||
| Fig. 7 (a) general online HPLC/ESI-MS setup. HPLC spectrum of the nanoparticles and corresponding mass spectra for each peak of elution (evidencing products of fragmentation and intact small rigid platform SRP NPs. (b) Chromatograms (HPLC-MS) recorded at different aging times of the solution. (reprinted with permission Copyright© 2013 American Chemistry Society).159 | ||
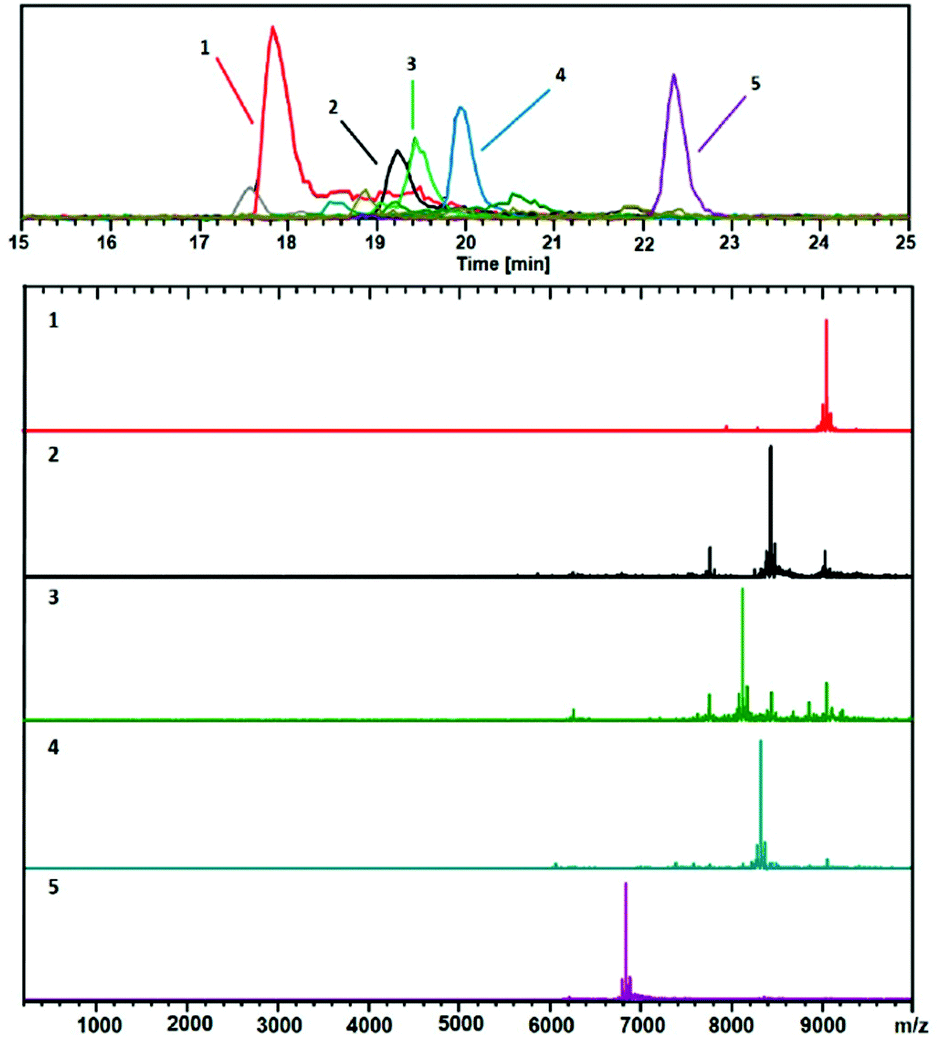 | ||
| Fig. 8 Positive ESIMS spectra. This analysis shows mainly 2+ charge-states. The black trace corresponds to the base peak chromatogram (m/z 100–10000). The color-coded EIC chromatographic peaks track with the coded and numbered mass spectra listed herein, with compositions assigned as follows: (1, Red) (67, 30), 18.1 kDa; (2, Black) (60, 31), 16.9 kDa; (3, Green) (58, 30), 16.2 kDa; (4, Blue) (60, 30), 16.6 kDa; and (5, Purple) (48, 26), (13.6 kDa. Reprinted with permission Copyright© 2019 MDPI Publishing).190 | ||
3.2 Ion mobility-MS
Ion mobility coupled to mass spectrometry (IM-MS) is becoming an indispensable tool for gas phase structural biology.192–194 In an IM-MS experiment, ions are driven through a buffer gas by a weak electric field, prior to their injection in a mass spectrometer. Ions with different size and shape, or different charges, adopt different velocities in the drift gas and then reach the mass spectrometer at different times. This allows isomer separation before mass measurement. The drift time of the ions can then be converted to a collision cross section (CCS), related to their geometry. IM-MS has been largely applied to study the folding and unfolding mechanisms of proteins.193 In the field of nanoclusters a significant breakthrough was achieved by Cliffel, McLean and colleagues, who reported the first IM-MS analysis of gold nanoclusters protected by different ligands (tiopronin and phenylethanethiolate), as well as gold-tiopronin and gold-phenylethanethiolate precursor complexes.195 After the pioneering works of Dass et al.,196 who used IM-MS to investigate Au25(SCH2CH2Ph)18 nanoclusters, the technique has gained importance in the field of protected noble metal NCs. For instance the Pradeep group was very active in IM-MS, figuring out several isomers in ligand protected silver cluster, separating dimers and trimers of [Au25(SR)18]−, looking at the unfolding of lysozyme upon gold addition, probing intercluster reactions or even following oligomerization processes.153,197–201Structural assignment based on IM-MS is nevertheless not as direct and unambiguous as determining the composition of a cluster from a HR-MS measurement. A first step generally consists of generating candidate structures, most often based on molecular modelling. Then, CCS computed for these structures can be compared to the experimental CCS. An important limitation to this procedure is that the CCS is roughly a measure of the average projected surface of the clusters and thus no one-to-one relation exists between structure and CCS. Consequently, a simple match between the CCS of a candidate structure and the experimental value is not sufficient for an assignment. Additional criterion, such as the energetics have to be taken into account. Another challenge to achieve structural assignment consists of generating the structures. Although force field simulations have often been sufficient for biomolecules, accurate simulations of metallic nanoclusters often require first principle calculations, e.g. density functional theory (DFT). Our group reported several studies based on IM-MS, especially applied to the sizing of glutathione-protected gold nanoclusters202 and to help in structural determination in the case of inorganic nanoclusters.203 In particular, we investigated homoleptic Au10SR10 nanoclusters, for which CCS were measured for different charge states and for different ligands (glutathione as well as smaller thioglycolic acid TGA ligand). For the tripeptide gluthatione as ligand, strong charge-state effects on the experimental CCS values were observed and attributed to charge-induced glutathione unfolding. Such a dominant influence of the ligand on the CCS makes it impossible to extract any workable information on the core structure.204 This effect is nevertheless minimized in the case of smaller and more rigid ligands (such as TGA). In this case, our results supported a possible catenane structure for the cluster, based on comparison with DFT simulations.205
Systematic IM-MS studies can also provide information on the influence of ligands on cluster structure, or to investigate their structural stability. For example, the structural changes upon ligand exchange from [Au8(PPh3)7]2+ and [Au11(PPh3)9H]2+ with methyldiphenylphosphine (MePPh2) were evidenced by IM-MS analysis.206 Recently, Hirata et al. studied the effect of collisional excitation on structural properties of nanoclusters and showed that phosphine-protected gold clusters undergo conversion to more compact isomers.207 Very recently, Hakkinen and coworkers showed that IM-MS was a technique of choice to probe interconversion between isomers of Au25(SR)18 clusters.208 Accessible interconversion pathways between the different identified conformers can further be probed by tandem ion mobility measurement (IM–IM–MS), as developed in our group.209–211 A schematic of the double IMS instrumental setup is presented in Fig. 9. In tandem-ion mobility, a first separation is used to select conformers. Selected ions can then be subjected to collisional activation. Finally, the resulting species are dispersed in the second tube before mass analysis with a time-of-flight mass spectrometer. We used this set-up to investigate the heterogeneity in the charging patterns of Au25MBA18 clusters. We showed that for a given charge state of those clusters, several populations with different protonation patterns coexist. Part of the observed heterogeneity could be attributed to spontaneous electron loss occurring in the gas phase, which was supported by IM–IM–MS measurements. As illustrated in Fig. 9, we showed that if Au25 ions with a 5-charge state are selected at the end of the first drift tube, their drift time in the second drift tube is intermediate between that expected for 5- and 4-ions, suggesting that part of the ions have lost an electron during their flight.47
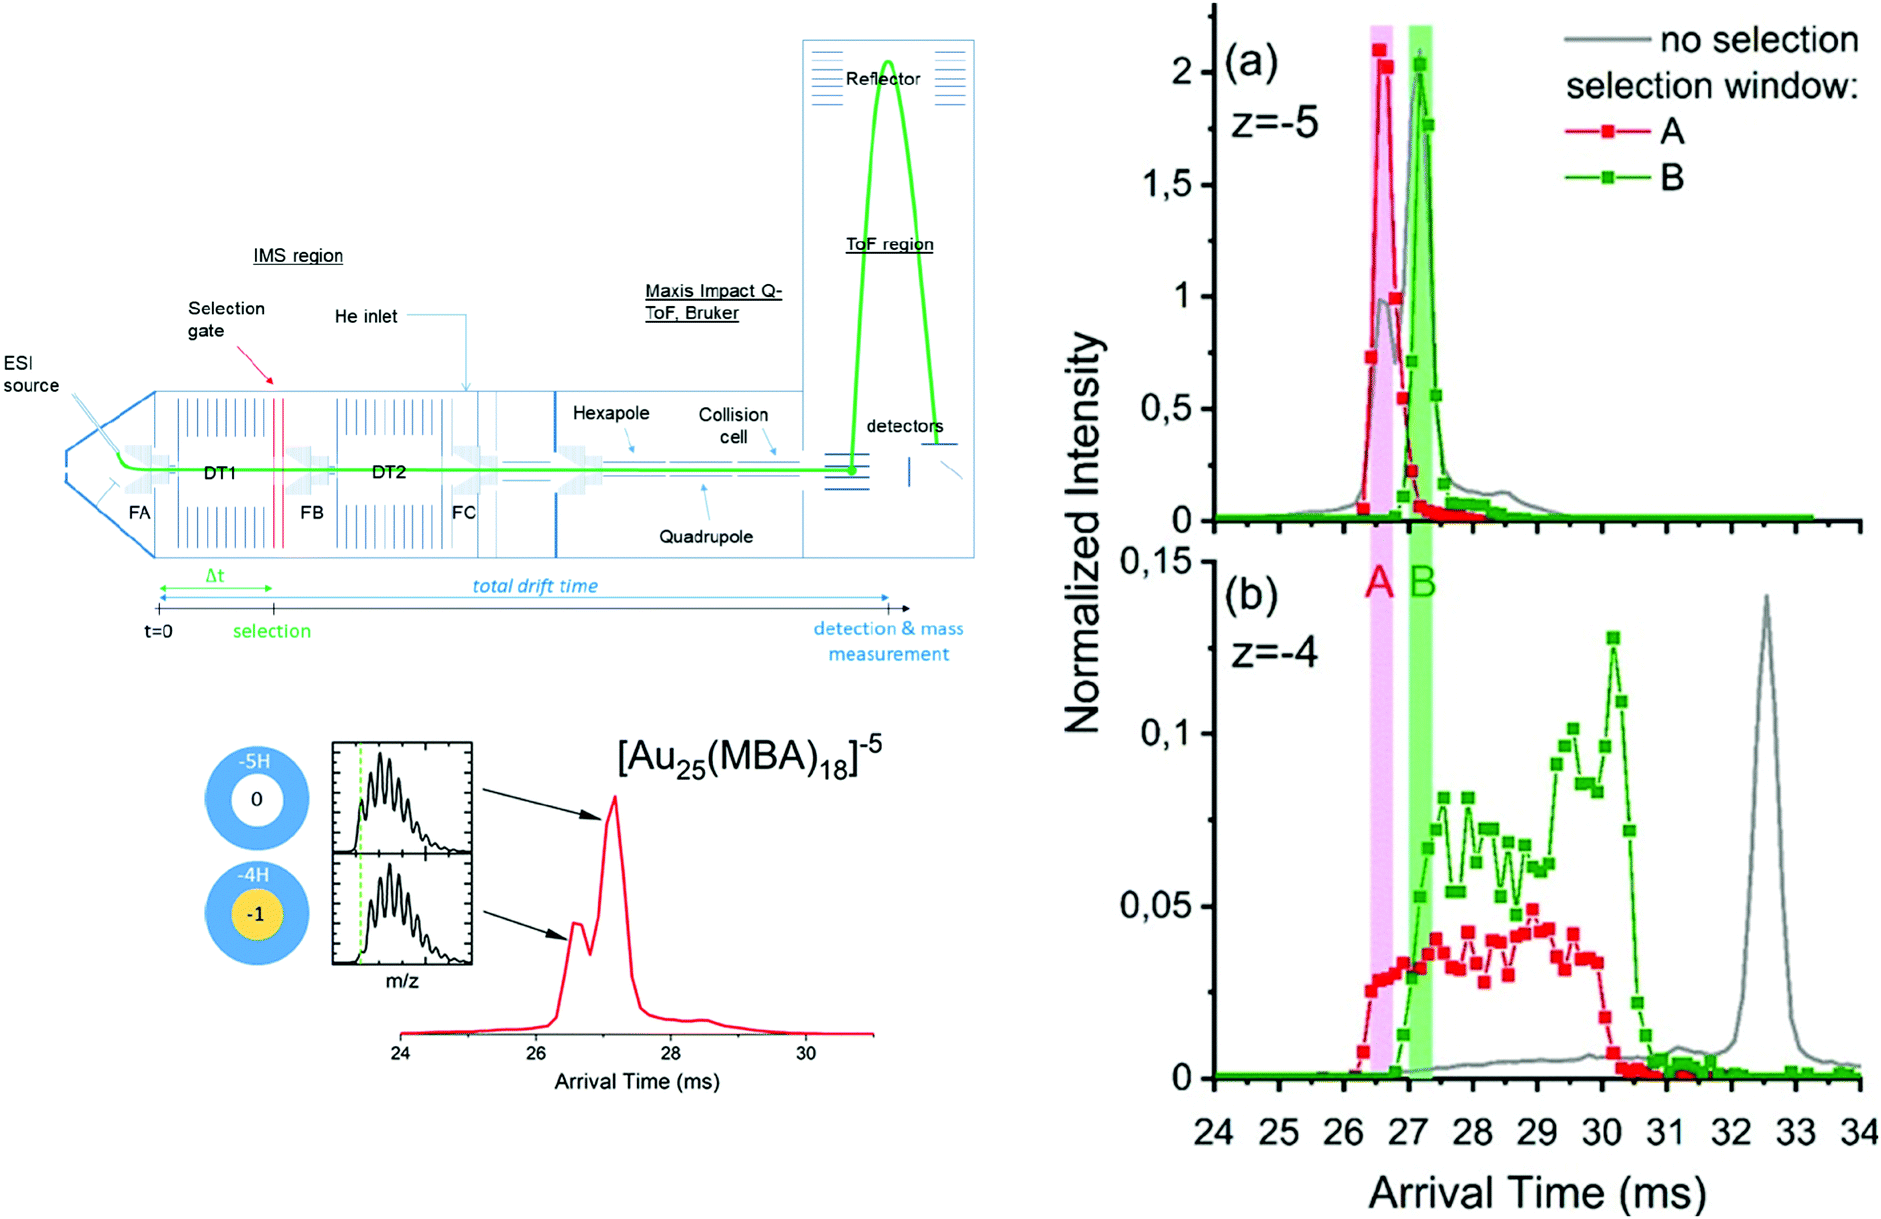 | ||
| Fig. 9 (left panel) Scheme of the IMS-IMS-MS setup. The green line represents the path of the ions through the instrument, from the electrospray (ESI) ion source transfer capillary. A timeline for IMS-IMS-MS measurements is provided below, where Δt corresponds to the time at which the selection gate is briefly opened (typically for 500 μs) to let through only the ions with a chosen mobility. ATDs for [Au25-meta-MBA18]5− clusters with corresponding full isotopic pattern. (right panel) Arrival time distributions extracted for (a) [Au25-meta-MBA18]5− clusters and (b) [Au25-meta-MBA18]4− clusters by integrating over the full isotopic pattern in each case. Red and green traces were obtained after selection of the ions on the fly (between the two drift tubes), respectively, using the selection windows labeled A and B. These ATDs were normalized to the total ion signal (see text). Corresponding ATDs obtained without selection are also provided as a reference (gray lines). (reprinted with permission Copyright© 2020 American Chemistry Society).47 | ||
3.3 Dissociation techniques and action spectroscopy
Complementary information regarding the structure and bonding of NCs can be obtained from dissociation studies (tandem MS). The most popular dissociation technique used in mass spectrometry is collision induced dissociation (CID) where mass-selected ions are subjected to energetic collisions with inert gases like Ar, N2, He, etc. Several CID studies on ligand-protected NCs were reported. In particular, for Au25, common dissociation channels involve surface staple motifs and/or ligand evaporation.36,55,57,123,143,196,212–214 For larger nanoclusters such as Au144(SR)60 and Au130(SR)50, Black et al. demonstrated a charge dependence on the extent of fragmentation,215 as also shown on Au25 capped with different isomers of MBA ligands (ortho, meta and para).216 CID experiments can also be used to probe the relative stability of homologous clusters (by monitoring the energy thresholds for fragmentation). For instance, an isomeric effect of mercaptobenzoic acids on the gas-phase stability of Au25(MBA)18 NCs was observed. Fig. 10 displays the CID breakdown curves for the 4-charge state of Au25(MBA)18 for the three isomeric forms of the MBA ligands (ortho (o), meta (m), and para (p)). For p-MBA, almost no fragmentation is observed in the explored collision energy range. In contrast, Au25 with o-MBA ligands appears to be dramatically more sensitive to collisional activation. This was attributed to the different steric hindrance of the carboxylic groups on the ligand shell at the surface of the gold core (higher for m-MBA and, and even more for o-MBA). This leads to constraints on the Au–S interface that may reduce the binding energy for fragmentation through Au–S bond breaking.216 Surface-induced dissociation (SID), where mass selected ions are collided with Au surfaces protected by monolayers of alkanethiols was found to be a more convenient technique than CID, as it produce more fragments.199 It is also better suited to extract thermodynamic parameters of the cluster ions (threshold energies and activation entropies of fragmentation), as demonstrated by Johnson et al. on small TPP-protected Au clusters.217 Recently Brodbelt, Whetten and coworkers evidenced the interest of dissociation techniques using near-vacuum ultraviolet photodissociation.218 Upon 193 nm irradiation (excitation laser wavelength), high-energy fragmentation pathways and cleavage of Au–S and C–S bonds may be reached, which leads to massive fragmentation (as compared to CID or SID). Interestingly the final products of the fragmentation in this case consist of bare gold cluster ions, which allows to unambiguously determine the size of the cluster core. CID was also used as an efficient tool to produce bare metal clusters, inside62 and outside219 mass spectrometers, from sequential evaporation of ligated clusters, as pioneered by our group for producing small silver clusters.220 Of note, upon UV and near-UV irradiation, negatively charged nanoclusters display electron photodetachment as the main observed channel. This channel can be conveniently used either for action spectroscopy or to produce activated radical species that efficiently promotes additional fragmentation.212,221,222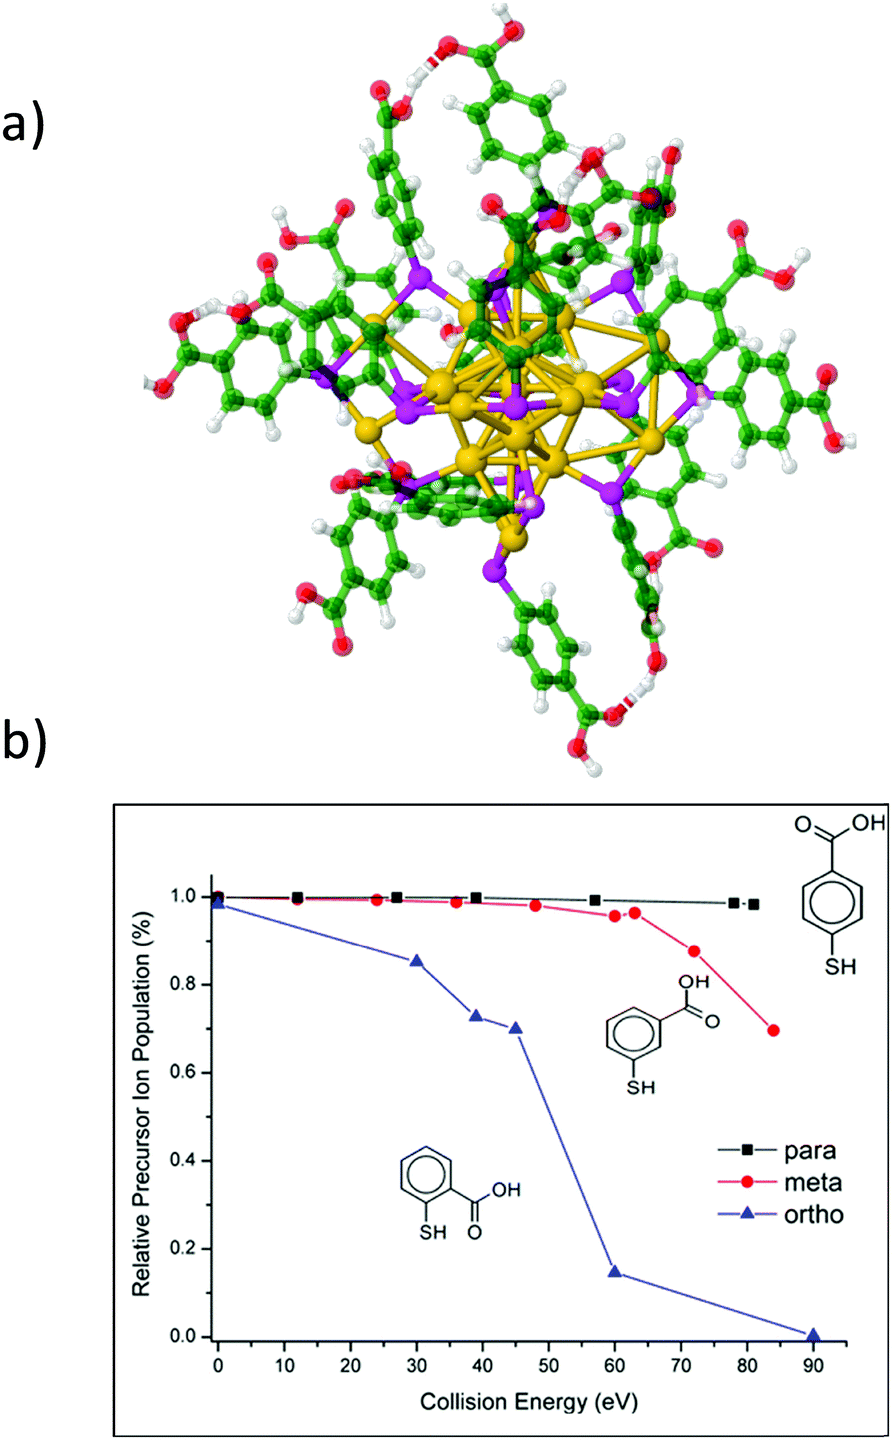 | ||
| Fig. 10 (a) Proposed structure for Au25(MBA)18 with p-MBA isomeric ligand. (b) CID breakdown curves for the 4-charge state of Au25(MBA)18 for the three isomeric MBA ligands as a function of collision energy. (reprinted with permission Copyright© 2018 American Chemistry Society).216 | ||
Some types of mass spectrometry devices can also act as storage devices (e.g. ion trap mass spectrometer). Tunable lasers can be injected within such traps to irradiate a bunch of mass-selected ions. Action spectroscopy then consists of recording the fragmentation (or photodetachment) yields as a function of excitation laser wavelength, thus providing insight into the absorption properties of gas phase ions.223–226 This coupling leading to action spectroscopy was pioneered by our group to study visible and ultraviolet spectroscopy of gas phase protein ions.221 We also applied this technique to provide general insight into the nature of electronic excitations at the metal–bioorganic interface58,227–234 that involve π–π* excitation within bioorganic subunits, charge transfer between two subunits and intrametallic excitations.227 However, more recently, we moved towards a more rational strategy aiming at combining ion mobility on one hand and action spectroscopy on other hand to better determine the structure-optical properties relationship.203 For instance, [Ag14(C![[triple bond, length as m-dash]](https://www.rsc.org/images/entities/char_e002.gif) CtBu)12Cl]+, [Ag14(CCtBu)12Br]+ were characterized by IM–MS. These cluster ions showed a single peak in ion mobility arrival time distribution and comparison of the CCS values derived from IM with the CCS values modelled from its X-ray crystal structure suggested that the gas-phase structures of the clusters are closely related to their condensed-phase structures (Fig. 11). Then we performed VUV and UV action spectroscopy on [Ag14−nCun(CCtBu)12 X]+ (X = Cl and Br). Thanks to VUV action spectroscopy, the ionization onsets of the cluster ions were determined to be ∼8.8 eV. In the UV range, action spectroscopy gave the “absorption” spectra of the cluster ions in the gas phase (Fig. 11). The experimental optical absorption spectra compared with TDDFT calculations permitted to figure out the key electronic excitations responsible for observed absorption band with a IM-MS characterized structure.203
CtBu)12Cl]+, [Ag14(CCtBu)12Br]+ were characterized by IM–MS. These cluster ions showed a single peak in ion mobility arrival time distribution and comparison of the CCS values derived from IM with the CCS values modelled from its X-ray crystal structure suggested that the gas-phase structures of the clusters are closely related to their condensed-phase structures (Fig. 11). Then we performed VUV and UV action spectroscopy on [Ag14−nCun(CCtBu)12 X]+ (X = Cl and Br). Thanks to VUV action spectroscopy, the ionization onsets of the cluster ions were determined to be ∼8.8 eV. In the UV range, action spectroscopy gave the “absorption” spectra of the cluster ions in the gas phase (Fig. 11). The experimental optical absorption spectra compared with TDDFT calculations permitted to figure out the key electronic excitations responsible for observed absorption band with a IM-MS characterized structure.203
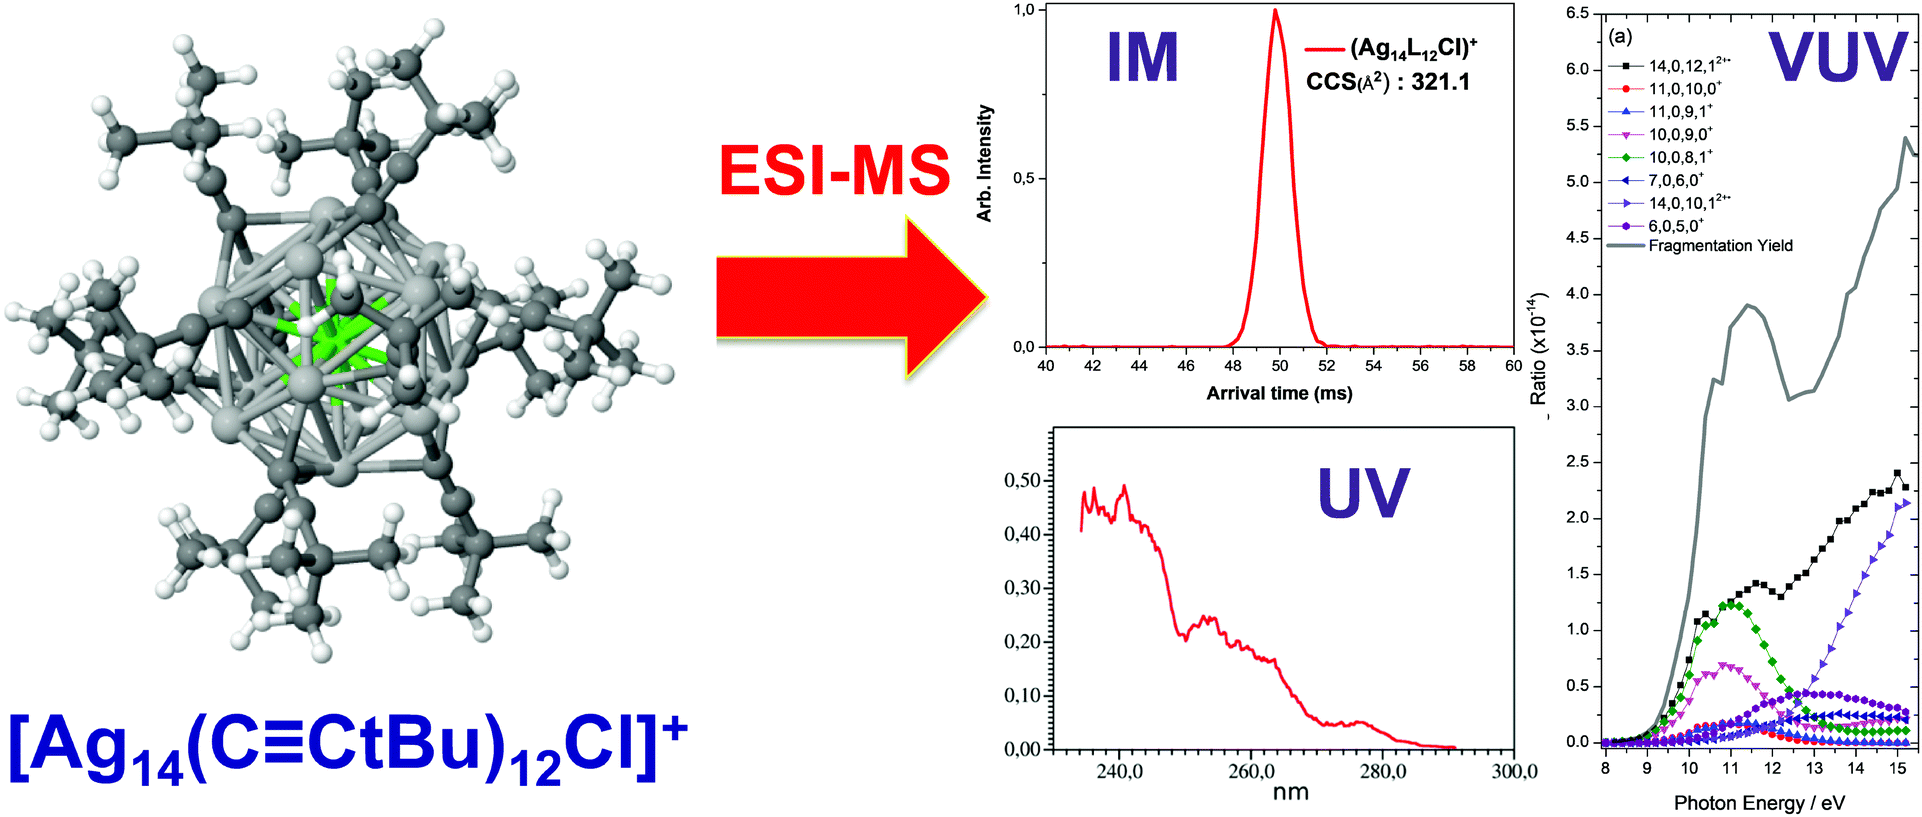 | ||
| Fig. 11 DFT-optimized structures (chlorine, light green; silver, light gray; copper, orange; carbon, dark green; hydrogen, white) for [Ag14(CCtBu)12Cl]+ with Ion-mobility arrival times (red peak) and optical action spectra in the UV and VUV range. (reprinted with permission Copyright© 2017 American Chemistry Society).203 | ||
4 Concluding remarks
In this perspective article, we reviewed the current trends in mass spectrometry as a powerful characterization tool for nanomaterials. For nanoclusters produced at the atomic precision, both composition in terms of stoichiometry (between ligands and metal atoms) and charge states of the metal kernel as well as compound evolution during the synthesis can be determined by high-resolution mass spectrometry. Mass spectrometry based tools can be used to weighing ultrasmall nanoparticles in the mass range of few hundreds of kilodalton and for nanoclusters presenting mass dispersion but usually some assumptions on the charge state and on the NP composition are required to obtain information on their composition. The combination of electrospray ionization with multiplicative correlation algorithms was found to be a useful tool for characterization of polydisperse nanoclusters in the mass range 10–100 kDa. For larger molecular weight, e.g. megadalton or even larger, that are observed for self-assembly of precision noble metal nanoclusters, mass information can be fulfilled by the charge detection mass spectrometry technique that directly measures the mass and the charge z of each ion. In particular the recent improvement of charge detection mass spectrometry (using electrostatic storage devices)175 allows for unprecedented low charge limits and would allow for better insights into the mechanism of formation of large assemblies: from kilodalton individual clusters to their megadalton self assembly.180 Of note, this mass range appears optimal for nanomechanical resonators235 like nanomechanical mass spectrometers.236Definitely, mass spectrometry is becoming a technique of profound importance for materials science, and is now an indispensable tool completing the characterization toolbox. Depending on the synthesis routes, information on nanomaterials ranging from its composition at the atomic precision to the estimation of its average mass and distribution can be obtained. It is nevertheless central to keep in mind that mass spectrometry cannot be a single technique with respect to characterization of nanomaterials. Even in the field of atomically precise nanoclusters, a wide range of complementary techniques must be employed for exhaustive nanocluster characterization (as illustrated in Fig. 12).237–239
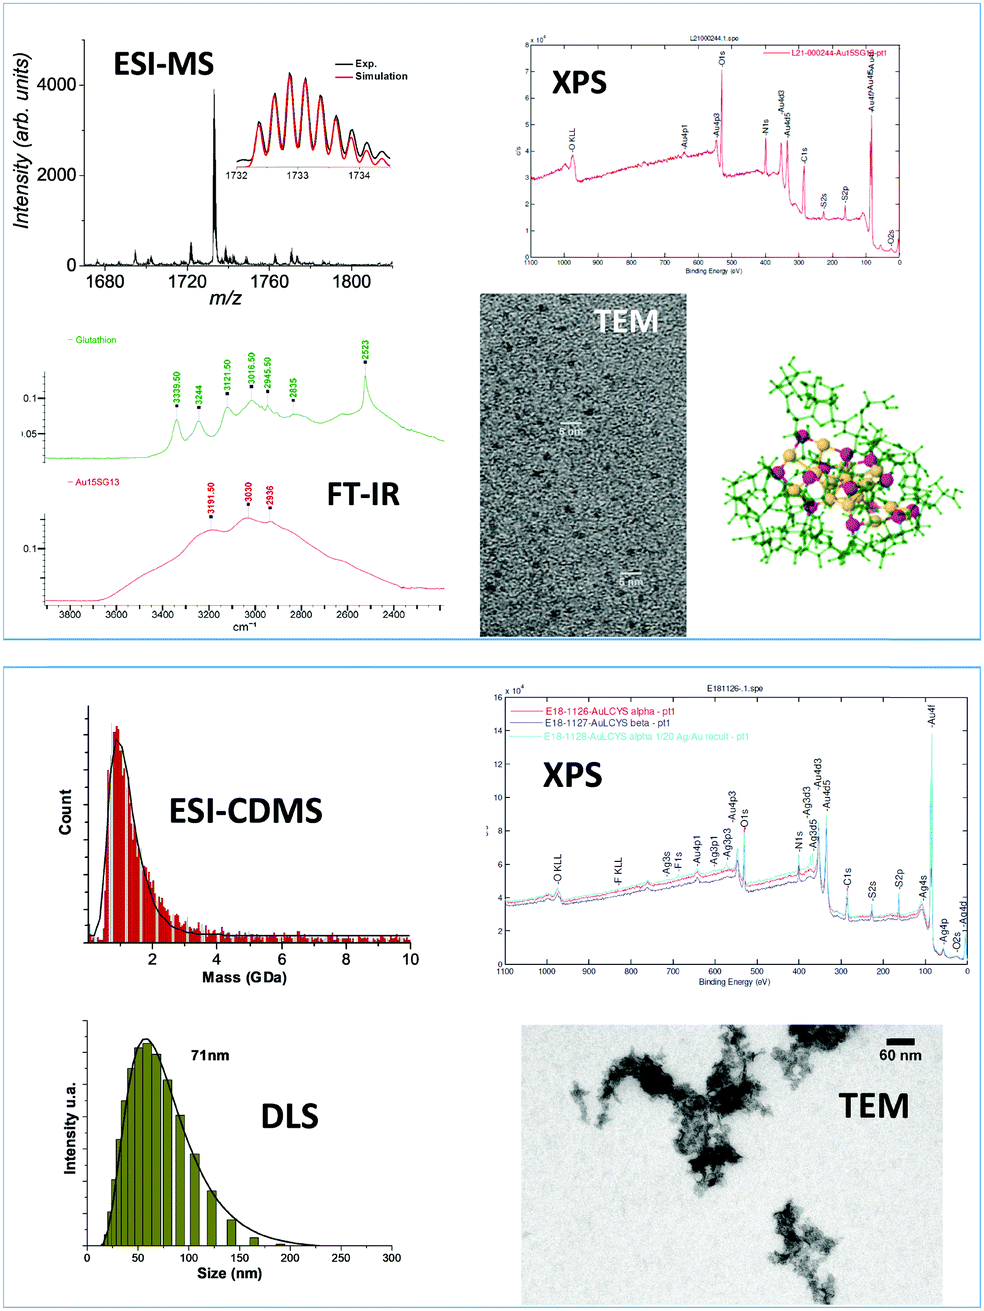 | ||
| Fig. 12 Examples of characterization techniques in addition to mass spectrometry used for atomically precise Au15SG13 nanoclusters (top panel) and Sub-100 nanometer silver doped gold–cysteine supramolecular assemblies (bottom panel). XPS: X-ray photoelectron spectroscopy, FT-IR: Fourier-transform IR spectroscopy, TEM: Transmission electron miscorscopy, DLS: dynamic light scattering. | ||
Gas-phase spectroscopy involving electronic excitations in combination with ion mobility has recently gained importance in revealing the structural details and structural dynamics of biomolecular objects.209–211 In a similar manner, such studies may be extended with gas phase IR (for vibrational excitations) and VUV (for valence shell excitations) spectroscopies in the case of nanoclusters as complement tools for understanding the structures of isomers.203,240,241 Negatively charged nanoclusters are usually prone to detach electrons upon photoexcitation, and clearly photoelectron spectroscopy (PES) could be more explored to better address electronic properties of the NCs.212,242 Also, the coupling between electron photodetachment or PES with circular dichroism243,244 may be of interest to better understand the chirality in liganded nanoclusters. Indeed, the ionization energies of gold core is ∼7.5 eV while the ionization energies of sulfur-containing ligands are ∼9.5 eV. Thus by playing with the VUV photon energy, it would be possible to decipher the origin of chirality in such nano-objects by recording VUV photoelectron spectroscopy and photoelectron circular dichroism.
Another promising direction may consist of transposing to nanoclusters strategies successfully applied in top-down proteomics, where intact protein ions or large protein fragments are subjected to gas-phase fragmentation before MS analysis. Dissociation techniques and in particular UVPD might allow developing the concept of top-down “metal nanocluster omics”. Namely, rich fragmentation patterns such as those which can be produced by 193 nm laser photodissociation,10,218 could be systematically exploited for the exhaustive characterization of each constituent of the clusters, from the ligands to the core. This is particularly appealing when dealing with complex nanomaterials with mixtures of surface capping ligands or alloy kernels, for which the mass of the whole assembly gives poor information on the stoichiometry of the building blocks.
Beyond pure MS, hyphenated methodologies that combine separation techniques with mass spectrometry are becoming central for materials synthesis, allowing a rapid investigation of complex mixtures in synthetic protocols for materials at the atomic precision. A promising future of such hyphenated techniques for such characterizations will be employing either top-down enzymatic digestion of the proteins bound to the NP surface, and their subsequent separation and identification and/or quantification by separation techniques combined to mass spectrometry or direct analysis by charge detection mass spectrometry might help to follow the “aging” of ultra-small NPs in vitro.245–247 The aging of USNPs in vitro (or in vivo) remain a challenging issue in nanomedicine.245–248 For instance, the characterization and a comprehensive picture of the “protein corona” arising after exposure to NPs in cells and organisms might benefit from operando strategies using mass spectrometry imaging.249
Finally, electrospray and MALDI are methods of choice for efficiently ionizing nanomaterials and thus for their analysis by MS instruments, but can also be used as source for producing nanomaterials.250 Indeed, electrospray has shown to be an elegant and versatile way to make a broad array of nanoparticles.251–253 Combining laser desorption and spray as new “out-of-equilibrium” media will allow for reactivity within droplets and/or laser ablation plume and can lead to new synthetic routes for nanomaterials.219,254–256
Conflicts of interest
There are no conflicts to declare.Notes and references
- J. J. Thomson, London, Edinburgh Dublin Philos. Mag. J. Sci., 1912, 23, 449–457 Search PubMed.
- P. F. Knewstubb, 6 - Mass Spectrometry of Ions from Electric Discharges, Flames, and Other Sources, in Mass Spectrometry of Organic Ions, ed. F. W. McLafferty, Academic Press, 1963, pp. 255 –307 Search PubMed.
- J. Fenn, M. Mann, C. Meng, S. Wong and C. Whitehouse, Science, 1989, 246, 64–71 Search PubMed.
- K. Tanaka, H. Waki, Y. Ido, S. Akita, Y. Yoshida, T. Yoshida and T. Matsuo, Rapid Commun. Mass Spectrom., 1988, 2, 151–153 Search PubMed.
- M. Karas, D. Bachmann, U. Bahr and F. Hillenkamp, Int. J. Mass Spectrom. Ion Processes, 1987, 78, 53–68 Search PubMed.
- J. B. Fenn, Angew. Chem., Int. Ed., 2003, 42, 3871–3894 Search PubMed.
- A. Makarov, Anal. Chem., 2000, 72, 1156–1162 Search PubMed.
- E. S. Hecht, M. Scigelova, S. Eliuk and A. Makarov, Fundamentals and Advances of Orbitrap Mass Spectrometry, in Encyclopedia of Analytical Chemistry, ed. R. A. Meyers, 2021 DOI:10.1002/9780470027318.a9309.pub2.
- A. W. Jones and H. J. Cooper, Analyst, 2011, 136, 3419–3429 Search PubMed.
- J. S. Brodbelt, L. J. Morrison and I. Santos, Chem. Rev., 2020, 120, 3328–3380 Search PubMed.
- J. M. Wells and S. A. McLuckey, in Biological Mass Spectrometry, ed. A. L. Burlingame, Elsevier Academic Press Inc, San Diego, 2005, vol. 402, pp. 148–185 Search PubMed.
- B. C. Bohrer, S. I. Mererbloom, S. L. Koeniger, A. E. Hilderbrand and D. E. Clemmer, Annu. Rev. Anal. Chem., 2008, 1, 293–327 Search PubMed.
- X. Huang, H. Liu, D. Lu, Y. Lin, J. Liu, Q. Liu, Z. Nie and G. Jiang, Chem. Soc. Rev., 2021, 50, 5243–5280 Search PubMed.
- B. H. Kim, M. J. Hackett, J. Park and T. Hyeon, Chem. Mater., 2014, 26, 59–71 Search PubMed.
- Y. Z. Lu and W. Chen, Anal. Chem., 2015, 87, 10659–10667 Search PubMed.
- P. Chakraborty and T. Pradeep, NPG Asia Mater., 2019, 11, 48 Search PubMed.
- T. Chen, Q. Yao, R. R. Nasaruddin and J. Xie, Angew. Chem., Int. Ed., 2019, 58, 11967–11977 Search PubMed.
- K. M. Harkness, D. E. Cliffel and J. A. McLean, Analyst, 2010, 135, 868–874 Search PubMed.
- R. Jin, Y. Pei and T. Tsukuda, Acc. Chem. Res., 2019, 52, 1 Search PubMed.
- R. Antoine, Nanomaterials, 2020, 10, 377 Search PubMed.
- T. G. Dietz, M. A. Duncan, D. E. Powers and R. E. Smalley, J. Chem. Phys., 1981, 74, 6511–6512 Search PubMed.
- M. A. Duncan, Rev. Sci. Instrum., 2012, 83, 041101 Search PubMed.
- W. D. Knight, K. Clemenger, W. A. de Heer, W. A. Saunders, M. Y. Chou and M. L. Cohen, Phys. Rev. Lett., 1984, 52, 2141–2143 Search PubMed.
- M. Broyer, Phys. Scr., 1989, T26, 84–89 Search PubMed.
- H. W. Kroto, J. R. Heath, S. C. O’Brien, R. F. Curl and R. E. Smalley, Nature, 1985, 318, 162–163 Search PubMed.
- E. A. Rohlfing, D. M. Cox and A. Kaldor, J. Chem. Phys., 1984, 81, 3322–3330 Search PubMed.
- L. A. Bloomfield, M. E. Geusic, R. R. Freeman and W. L. Brown, Chem. Phys. Lett., 1985, 121, 33–37 Search PubMed.
- M. F. Jarrold and J. E. Bower, J. Chem. Phys., 1986, 85, 5373–5375 Search PubMed.
- M. Brust, M. Walker, D. Bethell, D. J. Schiffrin and R. Whyman, J. Chem. Soc., Chem. Commun., 1994, 801–802 Search PubMed.
- R. Antoine, P. F. Brevet, H. H. Girault, D. Bethell and D. J. Schiffrin, Chem. Commun., 1997, 1901–1902 Search PubMed.
- T. G. Schaaff, G. Knight, M. N. Shafigullin, R. F. Borkman and R. L. Whetten, J. Phys. Chem. B, 1998, 102, 10643–10646 Search PubMed.
- R. L. Whetten, J. T. Khoury, M. M. Alvarez, S. Murthy, I. Vezmar, Z. L. Wang, P. W. Stephens, C. L. Cleveland, W. D. Luedtke and U. Landman, Adv. Mater., 1996, 8, 428–433 Search PubMed.
- T. G. Schaaff, M. N. Shafigullin, J. T. Khoury, I. Vezmar, R. L. Whetten, W. G. Cullen, P. N. First, C. Gutiérrez-Wing, J. Ascensio and M. J. Jose-Yacamán, J. Phys. Chem. B, 1997, 101, 7885–7891 Search PubMed.
- M. M. Alvarez, J. T. Khoury, T. G. Schaaff, M. Shafigullin, I. Vezmar and R. L. Whetten, Chem. Phys. Lett., 1997, 266, 91–98 Search PubMed.
- C. Kumara, V. R. Jupally and A. Dass, in Gold Clusters, Colloids and Nanoparticles I, ed. D. M. P. Mingos, Springer International Publishing, Cham, 2014, pp. 155–187 Search PubMed.
- C. A. Fields-Zinna, J. S. Sampson, M. C. Crowe, J. B. Tracy, J. F. Parker, A. M. deNey, D. C. Muddiman and R. W. Murray, J. Am. Chem. Soc., 2009, 131, 13844–13851 Search PubMed.
- C. A. Fields-Zinna, R. Sardar, C. A. Beasley and R. W. Murray, J. Am. Chem. Soc., 2009, 131, 16266–16271 Search PubMed.
- A. C. Templeton, M. P. Wuelfing and R. W. Murray, Acc. Chem. Res., 2000, 33, 27–36 Search PubMed.
- N. K. Chaki, Y. Negishi, H. Tsunoyama, Y. Shichibu and T. Tsukuda, J. Am. Chem. Soc., 2008, 130, 8608–8610 Search PubMed.
- P. Maity, H. Tsunoyama, M. Yamauchi, S. H. Xie and T. Tsukuda, J. Am. Chem. Soc., 2011, 133, 20123–20125 Search PubMed.
- Y. Negishi, K. Nobusada and T. Tsukuda, J. Am. Chem. Soc., 2005, 127, 5261–5270 Search PubMed.
- H. Tsunoyama and T. Tsukuda, J. Am. Chem. Soc., 2009, 131, 18216–18217 Search PubMed.
- R. Tsunoyama, H. Tsunoyama, P. Pannopard, J. Limtrakul and T. Tsukuda, J. Phys. Chem. C, 2010, 114, 16004–16009 Search PubMed.
- S. Yamazoe, K. Koyasu and T. Tsukuda, Acc. Chem. Res., 2014, 47, 816–824 Search PubMed.
- C. Kumara, M. M. Hoque, X. Zuo, D. A. Cullen, R. L. Whetten and A. Dass, J. Phys. Chem. Lett., 2018, 9, 6825–6832 Search PubMed.
- S. Vergara, U. Santiago, C. Kumara, D. Alducin, R. L. Whetten, M. Jose Yacaman, A. Dass and A. Ponce, J. Phys. Chem. C, 2018, 122, 26733–26738 Search PubMed.
- C. Comby-Zerbino, F. Bertorelle, P. Dugourd, R. Antoine and F. Chirot, J. Phys. Chem. A, 2020, 124, 5840–5848 Search PubMed.
- A. W. Cook and T. W. Hayton, Acc. Chem. Res., 2018, 51, 2456–2464 Search PubMed.
- J. F. Parker, C. A. Fields-Zinna and R. W. Murray, Acc. Chem. Res., 2010, 43, 1289–1296 Search PubMed.
- C. Kumara and A. Dass, Anal. Chem., 2014, 86, 4227–4232 Search PubMed.
- M. Waszkielewicz, J. Olesiak-Banska, C. Comby-Zerbino, F. Bertorelle, X. Dagany, A. K. Bansal, M. T. Sajjad, I. D. W. Samuel, Z. Sanader, M. Rozycka, M. Wojtas, K. Matczyszyn, V. Bonacic-Koutecky, R. Antoine, A. Ozyhar and M. Samoc, Nanoscale, 2018, 10, 11335–11341 Search PubMed.
- L. G. AbdulHalim, S. Ashraf, K. Katsiev, A. R. Kirmani, N. Kothalawala, D. H. Anjum, S. Abbas, A. Amassian, F. Stellacci, A. Dass, I. Hussain and O. M. Bakr, J. Mater. Chem. A, 2013, 1, 10148–10154 Search PubMed.
- I. Chakraborty and T. Pradeep, Chem. Rev., 2017, 117, 8208–8271 Search PubMed.
- R. Jin, C. Zeng, M. Zhou and Y. Chen, Chem. Rev., 2016, 116, 10346–10413 Search PubMed.
- F. Bertorelle, R. Hamouda, D. Rayane, M. Broyer, R. Antoine, P. Dugourd, L. Gell, A. Kulesza, R. Mitric and V. Bonacic-Koutecky, Nanoscale, 2013, 5, 5637–5643 Search PubMed.
- W. H. Ding, L. M. Guan, J. J. Han, R. Mangala and Z. X. Luo, Sens. Actuators, B, 2017, 250, 364–371 Search PubMed.
- B. Bellina, I. Compagnon, F. Bertorelle, M. Broyer, R. Antoine, P. Dugourd, L. Gell, A. Kulesza, R. Mitric and V. Bonacic-Koutecky, J. Phys. Chem. C, 2011, 115, 24549–24554 Search PubMed.
- V. Bonacic-Koutecky, A. Kulesza, L. Gell, R. Mitric, R. Antoine, F. Bertorelle, R. Hamouda, D. Rayane, M. Broyer, T. Tabarin and P. Dugourd, Phys. Chem. Chem. Phys., 2012, 14, 9282–9290 Search PubMed.
- I. Russier-Antoine, F. Bertorelle, N. Calin, Z. Sanader, M. Krstic, C. Comby-Zerbino, P. Dugourd, P. F. Brevet, V. Bonacic-Koutecky and R. Antoine, Nanoscale, 2017, 9, 1221–1228 Search PubMed.
- I. Russier-Antoine, F. Bertorelle, R. Hamouda, D. Rayane, P. Dugourd, Z. Sanader, V. Bonacic-Koutecky, P.-F. Brevet and R. Antoine, Nanoscale, 2016, 8, 2892–2898 Search PubMed.
- Z. Sanader, M. Krstic, I. Russier-Antoine, F. Bertorelle, P. Dugourd, P. F. Brevet, R. Antoine and V. Bonacic-Koutecky, Phys. Chem. Chem. Phys., 2016, 18, 12404–12408 Search PubMed.
- A. Ghosh, M. Bodiuzzaman, A. Nag, M. Jash, A. Baksi and T. Pradeep, ACS Nano, 2017, 11, 11145–11151 Search PubMed.
- X. Y. Ma, Y. Lv, H. Li, T. Chen, J. Zeng, M. Z. Zhu and H. Z. Yu, J. Phys. Chem. C, 2020, 124, 13421–13426 Search PubMed.
- N. Xia, J. Yang and Z. K. Wu, Nanoscale, 2015, 7, 10013–10020 Search PubMed.
- F. L. Bi, H. Q. Yin, S. Y. Zheng, Q. H. Zhu, H. F. Yang, M. Kang, F. Gan and X. J. Chen, RSC Adv., 2016, 6, 4627–4633 Search PubMed.
- H. Kawasaki, H. Yamamoto, H. Fujimori, R. Arakawa, Y. Iwasaki and M. Inada, Langmuir, 2010, 26, 5926–5933 Search PubMed.
- P. Gao, H. Wang, G. F. Zou and K. Q. Zhang, RSC Adv., 2018, 8, 27805–27810 Search PubMed.
- D. Q. Feng, G. L. Liu and W. Wang, J. Mater. Chem. B, 2015, 3, 2083–2088 Search PubMed.
- G. Y. Lan, W. Y. Chen and H. T. Chang, Analyst, 2011, 136, 3623–3628 Search PubMed.
- G. Y. Lan, W. Y. Chen and H. T. Chang, RSC Adv., 2011, 1, 802–807 Search PubMed.
- J. Lee, J. Park, H. H. Lee, H. Park, H. I. Kim and W. J. Kim, Biosens. Bioelectron., 2015, 68, 642–647 Search PubMed.
- K. Morishita, J. L. MacLean, B. W. Liu, H. Jiang and J. W. Liu, Nanoscale, 2013, 5, 2840–2849 Search PubMed.
- S. Jin, W. J. Du, S. X. Wan, X. Kang, M. Chen, D. Q. Hu, S. Chen, X. J. Zou, G. D. Sun and M. Z. Zhu, Inorg. Chem., 2017, 56, 11151–11159 Search PubMed.
- S. Jin, F. Q. Xu, W. J. Du, X. Kang, S. Chen, J. Zhang, X. W. Li, D. Q. Hu, S. X. Wang and M. Z. Zhu, Inorg. Chem., 2018, 57, 5114–5119 Search PubMed.
- T. K. Chen and J. P. Xie, Chem. Rec., 2016, 16, 1761–1771 Search PubMed.
- Q. F. Yao, Y. Yu, X. Yuan, Y. Yu, J. P. Xie and J. Y. Lee, Small, 2013, 9, 2696–2701 Search PubMed.
- Q. F. Yao, X. Yuan, Y. Yu, Y. Yu, J. P. Xie and J. Y. Lee, J. Am. Chem. Soc., 2015, 137, 2128–2136 Search PubMed.
- X. Yuan, N. Goswami, W. Chen, Q. Yao and J. Xie, Chem. Commun., 2016, 52, 5234–5237 Search PubMed.
- J. Chen, Q. F. Zhang, T. A. Bonaccorso, P. G. Williard and L. S. Wang, J. Am. Chem. Soc., 2014, 136, 92–95 Search PubMed.
- S. Maity, D. Bain and A. Patra, J. Phys. Chem. C, 2019, 123, 2506–2515 Search PubMed.
- R. W. Huang, J. Yin, C. W. Dong, A. Ghosh, M. J. Alhilaly, X. L. Dong, M. N. Hedhili, E. Abou-Hamad, B. Alamer, S. Nematulloev, Y. Han, O. F. Mohammed and O. M. Bakr, J. Am. Chem. Soc., 2020, 142, 8696–8705 Search PubMed.
- X. H. Gao, C. Du, C. M. Zhang and W. Chen, ChemElectroChem, 2016, 3, 1266–1272 Search PubMed.
- S. K. Barik, S. C. Huo, C. Y. Wu, T. H. Chiu, J. H. Liao, X. P. Wang, S. Kahlal, J. Y. Saillard and C. W. Liu, Chem. – Eur. J., 2020, 26, 10471–10479 Search PubMed.
- K. K. Chakrahari, R. P. B. Silalahi, T. H. Chiu, X. P. Wang, N. Azrou, S. Kahlal, Y. C. Liu, M. H. Chiang, J. Y. Saillard and C. W. Liu, Angew. Chem., Int. Ed., 2019, 58, 4943–4947 Search PubMed.
- A. W. Cook, Z. R. Jones, G. Wu, S. J. Teat, S. L. Scott and T. W. Hayton, Inorg. Chem., 2019, 58, 8739–8749 Search PubMed.
- K. Basu, K. Gayen, T. Mitra, A. Baral, S. S. Roy and A. Banerjee, ChemNanoMat, 2017, 3, 808–814 Search PubMed.
- M. Zhu, S. M. Zhou, C. H. Yao, L. W. Liao and Z. K. Wu, Nanoscale, 2014, 6, 14195–14199 Search PubMed.
- Y. Z. Pan, J. S. Chen, S. D. Gong and Z. H. Wang, Dalton Trans., 2018, 47, 11097–11103 Search PubMed.
- K. S. Joya, L. Sinatra, L. G. AbdulHalim, C. P. Joshi, M. N. Hedhili, O. M. Bakr and I. Hussain, Nanoscale, 2016, 8, 9695–9703 Search PubMed.
- A. W. Cook, G. Wu and T. W. Hayton, Inorg. Chem., 2018, 57, 8189–8194 Search PubMed.
- P. K. Aneesh, C. Govind and S. R. Nambiar, Anal. Methods, 2019, 11, 2089–2096 Search PubMed.
- S. Dolai, A. Dass and R. Sardar, Langmuir, 2013, 29, 6187–6193 Search PubMed.
- X. Kang, Y. Li, M. Zhu and R. Jin, Chem. Soc. Rev., 2020, 49, 6443–6514 Search PubMed.
- D. Mishra, V. Lobodin, C. Q. Zhang, F. Aldeek, E. Lochner and H. Mattoussi, Phys. Chem. Chem. Phys., 2018, 20, 12992–13007 Search PubMed.
- G. Soldan, M. A. Aljuhani, M. S. Bootharaju, L. G. AbdulHalim, M. R. Parida, A. H. Emwas, O. F. Mohammed and O. M. Bakr, Angew. Chem., Int. Ed., 2016, 55, 5749–5753 Search PubMed.
- M. van der Linden, A. J. van Bunningen, L. Amidani, M. Bransen, H. Elnaggar, P. Glatzel, A. Meijerink and F. M. F. de Groot, ACS Nano, 2018, 12, 12751–12760 Search PubMed.
- M. van der Linden, A. J. van Bunningen, M. U. Delgado-Jaime, B. Detlefs, P. Glatzel, A. Longo and F. M. F. de Groot, J. Phys. Chem. C, 2018, 122, 28351–28361 Search PubMed.
- X. Kang, X. Wei, S. Jin, Q. Yuan, X. Luan, Y. Pei, S. Wang, M. Zhu and R. Jin, Proc. Natl. Acad. Sci. U. S. A., 2019, 116, 18834–18840 Search PubMed.
- B. Zhang, G. Salassa and T. Burgi, Chem. Commun., 2016, 52, 9205–9207 Search PubMed.
- C. Yao, J. Chen, M.-B. Li, L. Liu, J. Yang and Z. Wu, Nano Lett., 2015, 15, 1281–1287 Search PubMed.
- C. Kumara, X. Zuo, D. A. Cullen and A. Dass, J. Phys. Chem. Lett., 2015, 6, 3320–3326 Search PubMed.
- J. Fan, Y. Song, J. Chai, S. Yang, T. Chen, B. Rao, H. Yu and M. Zhu, Nanoscale, 2016, 8, 15317–15322 Search PubMed.
- S. Wang, X. Meng, A. Das, T. Li, Y. Song, T. Cao, X. Zhu, M. Zhu and R. Jin, Angew. Chem., Int. Ed., 2014, 53, 2376–2380 Search PubMed.
- H. F. Qian, B. Ellen, Y. Zhu and R. C. Jin, Acta Phys.-Chim. Sin., 2011, 27, 513–519 Search PubMed.
- J. S. Chen, L. R. Liu, X. Liu, L. W. Liao, S. L. Zhuang, S. M. Zhou, J. L. Yang and Z. K. Wu, Chem. – Eur. J., 2017, 23, 18187–18192 Search PubMed.
- X. Kang, F. Q. Xu, X. Wei, S. X. Wang and M. Z. Zhu, Sci. Adv., 2019, 5, eaax7863 Search PubMed.
- Y. Niihori, W. Kurashige, M. Matsuzaki and Y. Negishi, Nanoscale, 2013, 5, 508–512 Search PubMed.
- M. S. Bootharaju, S. M. Kozlov, Z. Cao, M. Harb, M. R. Parida, M. N. Hedhili, O. F. Mohammed, O. M. Bakr, L. Cavallo and J. M. Basset, Nanoscale, 2017, 9, 9529–9536 Search PubMed.
- H. Gholipour-Ranjbar, H. Fang, J. Guan, D. A. Peters, A. Seifert, P. Jena and J. Laskin, Small, 2020, 2002927 Search PubMed.
- E. Khatun, P. Chakraborty, B. R. Jacob, G. Paramasivam, M. Bodiuzzaman, W. A. Dar and T. Pradeep, Chem. Mater., 2020, 32, 611–619 Search PubMed.
- M. S. Bootharaju, S. M. Kozlov, Z. Cao, A. Shkurenko, A. M. El-Zohry, O. F. Mohammed, M. Eddaoudi, O. M. Bakr, L. Cavallo and J. M. Basset, Chem. Mater., 2018, 30, 2719–2725 Search PubMed.
- M. S. Bootharaju, L. Sinatra and O. M. Bakr, Nanoscale, 2016, 8, 17333–17339 Search PubMed.
- P. Bose, P. Chakraborty, J. S. Mohanty, Nonappa, A. R. Chowdhuri, E. Khatun, T. Ahuja, A. Mahendranath and T. Pradeep, Nanoscale, 2020, 12, 22116–22128 Search PubMed.
- K. Y. Zheng, V. Fung, X. Yuan, D. E. Jiang and J. P. Xie, J. Am. Chem. Soc., 2019, 141, 18977–18983 Search PubMed.
- M. Neumaier, A. Baksi, P. Weis, E. K. Schneider, P. Chakraborty, H. Hahn, T. Pradeep and M. M. Kappes, J. Am. Chem. Soc., 2021, 143, 6969–6980 Search PubMed.
- J. B. Tracy, M. C. Crowe, J. F. Parker, O. Hampe, C. A. Fields-Zinna, A. Dass and R. W. Murray, J. Am. Chem. Soc., 2007, 129, 16209–16215 Search PubMed.
- A. Dass, K. Holt, J. F. Parker, S. W. Feldberg and R. W. Murray, J. Phys. Chem. C, 2008, 112, 20276–20283 Search PubMed.
- S. Hossain, W. Kurashige, S. Wakayama, B. Kumar, L. V. Nair, Y. Niihori and Y. Negishi, J. Phys. Chem. C, 2016, 120, 25861–25869 Search PubMed.
- X. M. Meng, Q. Xu, S. X. Wang and M. Z. Zhu, Nanoscale, 2012, 4, 4161–4165 Search PubMed.
- Y. A. Attia and S. H. Abdel-Hafez, New J. Chem., 2018, 42, 9606–9611 Search PubMed.
- W. Kurashige, S. Yamazoe, K. Kanehira, T. Tsukuda and Y. Negishi, J. Phys. Chem. Lett., 2013, 4, 3181–3185 Search PubMed.
- Y. Cao, V. Fung, Q. Yao, T. Chen, S. Zang, D.-E. Jiang and J. Xie, Nat. Commun., 2020, 11, 5498 Search PubMed.
- G. E. Johnson and J. Laskin, Analyst, 2016, 141, 3573–3589 Search PubMed.
- M. P. Maman, A. S. Nair, H. Cheraparambil, B. Pathak and S. Mandal, J. Phys. Chem. Lett., 2020, 11, 1781–1788 Search PubMed.
- A. Kim, C. J. Zeng, M. Zhou and R. C. Jin, Part. Part. Syst. Charact., 2017, 34, 1600388 Search PubMed.
- Z. Huang, Y. Ishida, K. Narita and T. Yonezawa, J. Phys. Chem. C, 2018, 122, 18142–18150 Search PubMed.
- Y. T. Cao, J. H. Guo, R. Shi, G. I. N. Waterhouse, J. H. Pan, Z. X. Du, Q. F. Yao, L. Z. Wu, C. H. Tung, J. P. Xie and T. R. Zhang, Nat. Commun., 2018, 9, 2379 Search PubMed.
- M. Z. Zhu, G. R. Chan, H. F. Qian and R. C. Jin, Nanoscale, 2011, 3, 1703–1707 Search PubMed.
- L. Tang, X. Kang, S. X. Wang and M. Z. Zhu, Langmuir, 2019, 35, 12350–12355 Search PubMed.
- Q. F. Yao, V. Fung, C. Sun, S. D. Huang, T. K. Chen, D. E. Jiang, J. Y. Lee and J. P. Xie, Nat. Commun., 2018, 9 Search PubMed.
- R. R. Nasaruddin, Q. F. Yao, T. K. Chen, M. J. Hulsey, N. Yan and J. P. Xie, Nanoscale, 2018, 10, 23113–23121 Search PubMed.
- Y. Yu, Z. T. Luo, Y. Yu, J. Y. Lee and J. P. Xie, ACS Nano, 2012, 6, 7920–7927 Search PubMed.
- G. Li, H. Abroshan, Y. X. Chen, R. C. Jin and H. J. Kim, J. Am. Chem. Soc., 2015, 137, 14295–14304 Search PubMed.
- L. Yang, H. Cheng, Y. Jiang, T. Huang, J. Bao, Z. Sun, Z. Jiang, J. Ma, F. Sun, Q. Liu, T. Yao, H. Deng, S. Wang, M. Zhu and S. Wei, Nanoscale, 2015, 7, 14452–14459 Search PubMed.
- A. C. Dharmaratne, T. Krick and A. Dass, J. Am. Chem. Soc., 2009, 131, 13604–13605 Search PubMed.
- R. Jin, G. Li, S. Sharma, Y. Li and X. Du, Chem. Rev., 2021, 121, 567–648 Search PubMed.
- Y. Lu, Y. Jiang, X. Gao and W. Chen, Chem. Commun., 2014, 50, 8464–8467 Search PubMed.
- S. Antonello, N. V. Perera, M. Ruzzi, J. A. Gascón and F. Maran, J. Am. Chem. Soc., 2013, 135, 15585–15594 Search PubMed.
- A. Venzo, S. Antonello, J. A. Gascón, I. Guryanov, R. D. Leapman, N. V. Perera, A. Sousa, M. Zamuner, A. Zanella and F. Maran, Anal. Chem., 2011, 83, 6355–6362 Search PubMed.
- Z. Wu, C. Gayathri, R. R. Gil and R. Jin, J. Am. Chem. Soc., 2009, 131, 6535–6542 Search PubMed.
- R. C. Jin, Nanoscale, 2015, 7, 1549–1565 Search PubMed.
- Y. Negishi, N. K. Chaki, Y. Shichibu, R. L. Whetten and T. Tsukuda, J. Am. Chem. Soc., 2007, 129, 11322–11323 Search PubMed.
- R. Hamouda, F. Bertorelle, D. Rayane, R. Antoine, M. Broyer and P. Dugourd, Int. J. Mass Spectrom., 2013, 335, 1–6 Search PubMed.
- A. Dass, S. Theivendran, P. R. Nimmala, C. Kumara, V. R. Jupally, A. Fortunelli, L. Sementa, G. Barcaro, X. Zuo and B. C. Noll, J. Am. Chem. Soc., 2015, 137, 4610–4613 Search PubMed.
- Q. Z. Li, J. S. Chai, S. Yang, Y. B. Song, T. Chen, C. Chen, H. Zhang, H. Z. Yu and M. Z. Zhu, Small, 2020, 1907114 Search PubMed.
- N. Fernández-Iglesias and J. Bettmer, Nanoscale, 2014, 6, 716–721 Search PubMed.
- M. Kluz, H. Nieznańska, R. Dec, I. Dzięcielewski, B. Niżyński, G. Ścibisz, W. Puławski, G. Staszczak, E. Klein, J. Smalc-Koziorowska and W. Dzwolak, PLoS One, 2019, 14, e0218975 Search PubMed.
- J. Xie, Y. Zheng and J. Y. Ying, J. Am. Chem. Soc., 2009, 131, 888–889 Search PubMed.
- T. Pradeep, A. Baksi and P. L. Xavier, Functional Nanometer-Sized Clusters of Transition Metals: Synthesis, Properties and Applications, The Royal Society of Chemistry, 2014, pp. 169–225 Search PubMed.
- H. Kouchi, H. Kawasaki and R. Arakawa, Anal. Methods, 2012, 4, 3600–3603 Search PubMed.
- D. Ghosh, S. K. Mudedla, M. R. Islam, V. Subramanian and T. Pradeep, J. Phys. Chem. C, 2019, 123, 17598–17605 Search PubMed.
- D. Ghosh, M. Bodiuzzaman, A. Som, S. Raja, A. Baksi, A. Ghosh, J. Ghosh, A. Ganesh, P. Samji, S. Mahalingam, D. Karunagaran and T. Pradeep, J. Phys. Chem. C, 2019, 123, 29408–29417 Search PubMed.
- D. Ghosh, A. Baksi, S. K. Mudedla, A. Nag, M. A. Ganayee, V. Subramanian and T. Pradeep, J. Phys. Chem. C, 2017, 121, 13335–13344 Search PubMed.
- K. Chaudhari, P. L. Xavier and T. Pradeep, ACS Nano, 2011, 5, 8816–8827 Search PubMed.
- Y. C. Hsu, M. J. Hung, Y. A. Chen, T. F. Wang, Y. R. Ou and S. H. Chen, Molecules, 2019, 24, 1630 Search PubMed.
- Y. Zhang, M. F. Yan, S. B. Wang, J. J. Jiang, P. F. Gao, G. M. Zhang, C. Dong and S. M. Shuang, RSC Adv., 2016, 6, 8612–8619 Search PubMed.
- X. L. Guevel, O. Tagit, C. E. Rodríguez, V. Trouillet, M. Pernia Leal and N. Hildebrandt, Nanoscale, 2014, 6, 8091–8099 Search PubMed.
- R. Antoine, C. Truillet, P. Dugourd, F. Lux and O. Tillement, France Pat., FR3010527A1, 2015 Search PubMed.
- C. Truillet, F. Lux, O. Tillement, P. Dugourd and R. Antoine, Anal. Chem., 2013, 85, 10440–10447 Search PubMed.
- D. J. Shen, M. Henry, V. Trouillet, C. Comby-Zerbino, F. Bertorelle, L. Sancey, R. Antoine, J. L. Coll, V. Josserand and X. Le Guevel, APL Mater., 2017, 5, 053404 Search PubMed.
- C. Colombe, X. Le Guevel, A. Martin-Serrano, M. Henry, E. Porret, C. Comby-Zerbino, R. Antoine, I. Atallah, B. Busser, J. L. Coll, C. A. Righini and L. Sancey, Nanomedicine, 2019, 20, 102011 Search PubMed.
- B. Musnier, K. D. Wegner, C. Comby-Zerbino, V. Trouillet, M. Jourdan, I. Hausler, R. Antoine, J. L. Coll, U. Resch-Genger and X. Le Guevel, Nanoscale, 2019, 11, 12092–12096 Search PubMed.
- E. Porret, M. Jourdan, B. Gennaro, C. Comby-Zerbino, F. Bertorelle, V. Trouillet, X. Qiu, C. Zoukimian, D. Boturyn, N. Hildebrandt, R. Antoine, J. L. Coll and X. Le Guavel, J. Phys. Chem. C, 2019, 123, 26705–26717 Search PubMed.
- A. R. Ziefuss, T. Steenbock, D. Benner, A. Plech, J. Göttlicher, M. Teubner, C. Rehbock, C. Comby-Zerbino, R. Antoine, D. Amans, I. Chakraborty, G. Bester, B. Sures, M. Rübhausen, W. J. Parak and S. Barcikwoski, Adv. Mater., 2021 DOI:10.1002/adma.202101549.
- M. Loumaigne, C. Midelet, T. Doussineau, P. Dugourd, R. Antoine, M. Stamboul, A. Debarre and M. H. V. Werts, Nanoscale, 2016, 8, 6555–6570 Search PubMed.
- F. Lux, A. Mignot, P. Mowat, C. Louis, S. Dufort, C. Bernhard, F. Denat, F. Boschetti, C. Brunet, R. Antoine, P. Dugourd, S. Laurent, L. V. Elst, R. Muller, L. Sancey, V. Josserand, J.-L. Coll, V. Stupar, E. Barbier, C. Remy, A. Broisat, C. Ghezzi, D. G. Le, S. Roux, P. Perriat and O. Tillement, Angew. Chem., Int. Ed., 2011, 50, 12299–12303 Search PubMed.
- A. Mignot, C. Truillet, F. Lux, L. Sancey, C. Louis, F. Denat, F. Boschetti, L. Bocher, A. Gloter, O. Stéphan, R. Antoine, P. Dugourd, D. Luneau, G. Novitchi, L. C. Figueiredo, P. C. de Morais, L. Bonneviot, B. Albela, F. Ribot, L. Van Lokeren, I. Déchamps-Olivier, F. Chuburu, G. Lemercier, C. Villiers, P. N. Marche, G. Le Duc, S. Roux, O. Tillement and P. Perriat, Chem. – Eur. J., 2013, 19, 6122–6136 Search PubMed.
- J. Morlieras, J. M. Chezal, E. Miot-Noirault, A. Roux, L. Heinrich-Balard, R. Cohen, S. Tarrit, C. Truillet, A. Mignot, R. Hachani, D. Kryza, R. Antoine, P. Dugourd, P. Perriat, M. Janier, L. Sancey, F. Lux and O. Tillement, Nanoscale, 2013, 5, 1603–1615 Search PubMed.
- J. Morlieras, J.-M. Chezal, E. Miot-Noirault, A. Vidal, S. Besse, D. Kryza, C. Truillet, A. Mignot, R. Antoine, P. Dugourd, F. Redini, L. Sancey, F. Lux, P. Perriat, M. Janier and O. Tillement, Chem. Commun., 2013, 49, 3046–3048 Search PubMed.
- J. Morlieras, S. Dufort, L. Sancey, C. Truillet, A. Mignot, F. Rossetti, M. Dentamaro, S. Laurent, L. Vander Elst, R. N. Muller, R. Antoine, P. Dugourd, S. P. Roux, P. Perriat, F. O. Lux, J.-L. Coll and O. Tillement, Bioconjugate Chem., 2013, 24, 1584–1597 Search PubMed.
- L. Sancey, S. Kotb, C. Truillet, F. Appaix, A. Marais, E. S. Thomas, B. van der Sanden, J.-P. Klein, B. Laurent, M. L. Cottier, R. Antoine, P. Dugourd, G. R. Panczer, F. O. Lux, P. Perriat, V. Motto-Ros and O. Tillement, ACS Nano, 2015, 9, 2477–2488 Search PubMed.
- V.-L. Tran, V. Thakare, F. Rossetti, A. Baudouin, G. Ramniceanu, B.-T. Doan, N. Mignet, C. Comby-Zerbino, R. Antoine, P. Dugourd, F. Boschetti, F. Denat, C. Louis, S. Roux, T. Doussineau, O. Tillement and F. Lux, J. Mater. Chem. B, 2018, 6, 4821–4834 Search PubMed.
- C. Truillet, F. Lux, J. Moreau, M. Four, L. Sancey, S. Chevreux, G. Boeuf, P. Perriat, C. Frochot, R. Antoine, P. Dugourd, C. Portefaix, C. Hoeffel, M. Barberi-Heyob, C. Terryn, L. van Gulick, G. Lemercier and O. Tillement, Dalton Trans., 2013, 42, 12410–12420 Search PubMed.
- S. D. Fuerstenau and W. H. Benner, Rapid Commun. Mass Spectrom., 1995, 9, 1528–1538 Search PubMed.
- D. Z. Keifer, E. E. Pierson and M. F. Jarrold, Analyst, 2017, 142, 1654–1671 Search PubMed.
- R. Antoine, Rapid Commun. Mass Spectrom., 2020, 34, e8539 Search PubMed.
- T. Doussineau, A. Désert, O. Lambert, J.-C. Taveau, M. Lansalot, P. Dugourd, E. Bourgeat-Lami, S. Ravaine, E. Duguet and R. Antoine, J. Phys. Chem. C, 2015, 119, 10844–10849 Search PubMed.
- H. Fakhouri, M. Perić, F. Bertorelle, P. Dugourd, X. Dagany, I. Russier-Antoine, P.-F. Brevet, V. Bonačić-Koutecký and R. Antoine, Phys. Chem. Chem. Phys., 2019, 21, 12091–12099 Search PubMed.
- I. Russier-Antoine, H. Fakhouri, S. Basu, F. Bertorelle, P. Dugourd, P.-F. Brevet, P. Velayudhan, S. Thomas, N. Kalarikkal and R. Antoine, Chem. Commun., 2020, 56, 3859–3862 Search PubMed.
- S. Basu, H. Fakhouri, C. Moulin, S. Dolai, I. Russier-Antoine, P.-F. Brevet, R. Antoine and A. Paul, Nanoscale, 2021, 13, 4439–4443 Search PubMed.
- Y. Negishi, S. Hashimoto, A. Ebina, K. Hamada, S. Hossain and T. Kawawaki, Nanoscale, 2020, 12, 8017–8039 Search PubMed.
- B. Bhattarai, Y. Zaker, A. Atnagulov, B. Yoon, U. Landman and T. P. Bigioni, Acc. Chem. Res., 2018, 51, 3104–3113 Search PubMed.
- H. Qian and R. Jin, Chem. Commun., 2011, 47, 11462–11464 Search PubMed.
- T. Wan, F. L. Tang, Y. R. Yin, M. X. Zhang, M. M. F. Choi and X. P. Yang, Electrophoresis, 2019, 40, 1345–1352 Search PubMed.
- S. P. Xie, M. C. Paau, Y. Zhang, S. M. Shuang, W. Chan and M. M. F. Choi, Nanoscale, 2012, 4, 5325–5332 Search PubMed.
- Y. Zhang, Q. Hu, M. C. Paau, S. P. Xie, P. F. Gao, W. Chan and M. M. F. Choi, J. Phys. Chem. C, 2013, 117, 18697–18708 Search PubMed.
- D. M. Black, M. M. Alvarez, F. Z. Yan, W. P. Griffith, G. Plascencia-Villa, S. B. H. Bach and R. L. Whetten, J. Phys. Chem. C, 2017, 121, 10851–10857 Search PubMed.
- D. M. Black, S. B. H. Bach and R. L. Whetten, Anal. Chem., 2016, 88, 5631–5636 Search PubMed.
- D. M. Black, N. Bhattarai, S. B. H. Bach and R. L. Whetten, J. Phys. Chem. Lett., 2016, 7, 3199–3205 Search PubMed.
- D. M. Black, M. M. Hoque, G. Plascencia-Villa and R. L. Whetten, Nanomaterials, 2019, 9, 1303 Search PubMed.
- D. M. Black, G. Robles, P. Lopez, S. B. H. Bach, M. Alvarez and R. L. Whetten, Anal. Chem., 2018, 90, 2010–2017 Search PubMed.
- E. Jurneczko and P. E. Barran, Analyst, 2011, 136, 20–28 Search PubMed.
- J. L. P. Benesch and B. T. Ruotolo, Curr. Opin. Struct. Biol., 2011, 21, 641–649 Search PubMed.
- T. M. Allison, P. Barran, S. Cianférani, M. T. Degiacomi, V. Gabelica, R. Grandori, E. G. Marklund, T. Menneteau, L. G. Migas, A. Politis, M. Sharon, F. Sobott, K. Thalassinos and J. L. P. Benesch, Anal. Chem., 2020, 92, 10872–10880 Search PubMed.
- K. M. Harkness, L. S. Fenn, D. E. Cliffel and J. A. McLean, Anal. Chem., 2010, 82, 3061–3066 Search PubMed.
- L. A. Angel, L. T. Majors, A. C. Dharmaratne and A. Dass, ACS Nano, 2010, 4, 4691–4700 Search PubMed.
- A. Baksi, P. Chakraborty, S. Bhat, G. Natarajan and T. Pradeep, Chem. Commun., 2016, 52, 8397–8400 Search PubMed.
- A. Baksi, E. K. Schneider, P. Weis, K. R. Krishnadas, D. Ghosh, H. Hahn, T. Pradeep and M. M. Kappes, J. Phys. Chem. C, 2019, 123, 28477–28485 Search PubMed.
- A. Baksi, S. R. Harvey, G. Natarajan, V. H. Wysocki and T. Pradeep, Chem. Commun., 2016, 52, 3805–3808 Search PubMed.
- P. Chakraborty, A. Baksi, S. K. Mudedla, A. Nag, G. Paramasivam, V. Subramanian and T. Pradeep, Phys. Chem. Chem. Phys., 2018, 20, 7593–7603 Search PubMed.
- A. Baksi, A. Ghosh, S. K. Mudedla, P. Chakraborty, S. Bhat, B. Mondal, K. R. Krishnadas, V. Subramanian and T. Pradeep, J. Phys. Chem. C, 2017, 121, 13421–13427 Search PubMed.
- A. Soleilhac, F. Bertorelle, C. Comby-Zerbino, F. Chirot, N. Calin, P. Dugourd and R. Antoine, J. Phys. Chem. C, 2017, 121, 27733–27740 Search PubMed.
- S. Daly, C. M. Choi, A. Zavras, M. Krstic, F. Chirot, T. U. Connell, S. J. Williams, P. S. Donnelly, R. Antoine, A. Giuliani, V. Bonacic-Koutecky, P. Dugourd and R. A. J. O'Hair, J. Phys. Chem. C, 2017, 121, 10719–10727 Search PubMed.
- C. Comby-Zerbino, F. Bertorelle, F. Chirot, P. Dugourd and R. Antoine, Eur. Phys. J. D, 2018, 72 Search PubMed.
- C. Comby-Zerbino, M. Perić, F. Bertorelle, F. Chirot, P. Dugourd, V. Bonačić-Koutecký and R. Antoine, Nanomaterials, 2019, 9, 457 Search PubMed.
- M. R. Ligare, E. S. Baker, J. Laskin and G. E. Johnson, Chem. Commun., 2017, 53, 7389–7392 Search PubMed.
- K. Hirata, P. Chakraborty, A. Nag, S. Takano, K. Koyasu, T. Pradeep and T. Tsukuda, J. Phys. Chem. C, 2018, 122, 23123–23128 Search PubMed.
- E. Kalenius, S. Malola, M. F. Matus, R. Kazan, T. Bürgi and H. Häkkinen, J. Am. Chem. Soc., 2021, 143, 1273–1277 Search PubMed.
- C. M. Choi, A. Kulesza, S. Daly, L. MacAleese, R. Antoine, P. Dugourd and F. Chirot, Rapid Commun. Mass Spectrom., 2019, 33, 28–34 Search PubMed.
- A.-L. Simon, F. Chirot, C. M. Choi, C. Clavier, M. Barbaire, J. Maurelli, X. Dagany, L. MacAleese and P. Dugourd, Rev. Sci. Instrum., 2015, 86, 094101 Search PubMed.
- S. Poyer, C. M. Choi, C. Deo, N. Bogliotti, J. Xie, P. Dugourd, F. Chirot and J.-Y. Salpin, Analyst, 2020, 145, 4012–4020 Search PubMed.
- R. Hamouda, B. Bellina, F. Bertorelle, I. Compagnon, R. Antoine, M. Broyer, D. Rayane and P. Dugourd, J. Phys. Chem. Lett., 2010, 1, 3189–3194 Search PubMed.
- R. Tomihara, K. Hirata, H. Yamamoto, S. Takano, K. Koyasu and T. Tsukuda, ACS Omega, 2018, 3, 6237–6242 Search PubMed.
- A. Zavras, G. N. Khairallah and R. A. J. O'Hair, in Gold Clusters, Colloids and Nanoparticles II, ed. D. M. P. Mingos, Springer, New York, 2014, vol. 162, pp. 139–230 Search PubMed.
- D. M. Black, N. Bhattarai, R. L. Whetten and S. B. H. Bach, J. Phys. Chem. A, 2014, 118, 10679–10687 Search PubMed.
- F. Bertorelle, I. Russier-Antoine, C. Comby-Zerbino, F. Chirot, P. Dugourd, P. F. Brevet and R. Antoine, ACS Omega, 2018, 3, 15635–15642 Search PubMed.
- G. E. Johnson, T. Priest and J. Laskin, Chem. Sci., 2014, 5, 3275–3286 Search PubMed.
- D. M. Black, C. M. Crittenden, J. S. Brodbelt and R. L. Whetten, J. Phys. Chem. Lett., 2017, 8, 1283–1289 Search PubMed.
- M. Jash, R. R. J. Methikkalam, M. Bodiuzzaman, G. Paramasivam and T. Pradeep, Chem. Commun., 2020, 56, 15623–15626 Search PubMed.
- T. Tabarin, R. Antoine, M. Broyer and P. Dugourd, Eur. Phys. J. D, 2006, 37, 237–239 Search PubMed.
- R. Antoine and P. Dugourd, Phys. Chem. Chem. Phys., 2011, 13, 16494–16509 Search PubMed.
- R. Antoine, J. Lemoine and P. Dugourd, Mass Spectrom. Rev., 2014, 33, 501–522 Search PubMed.
- A. Cirri, H. M. Hernández and C. J. Johnson, J. Phys. Chem. A, 2020, 124, 1467–1479 Search PubMed.
- A. Cirri, H. Morales Hernández, C. Kmiotek and C. J. Johnson, Angew. Chem., Int. Ed., 2019, 58, 13818–13822 Search PubMed.
- K. Koyasu and T. Tsukuda, J. Chem. Phys., 2021, 154, 140901 Search PubMed.
- K. Hirata, R. Tomihara, K. Kim, K. Koyasu and T. Tsukuda, Phys. Chem. Chem. Phys., 2019, 21, 17463–17474 Search PubMed.
- Ž. Sanader, R. Mitrić, V. Bonačić-Koutecký, B. Bellina, R. Antoine and P. Dugourd, Phys. Chem. Chem. Phys., 2014, 16, 1257–1261 Search PubMed.
- B. Bellina, I. Compagnon, L. MacAleese, F. Chirot, J. Lemoine, P. Maître, M. Broyer, R. Antoine, A. Kulesza, R. Mitrić, V. Bonačić-Koutecký and P. Dugourd, Phys. Chem. Chem. Phys., 2012, 14, 11433–11440 Search PubMed.
- R. Antoine, T. Tabarin, M. Broyer, P. Dugourd, R. Mitric and V. Bonacic-Koutecky, ChemPhysChem, 2006, 7, 524–528 Search PubMed.
- I. Compagnon, T. Tabarin, R. Antoine, M. Broyer, P. Dugourd, R. Mitric, J. Petersen and V. Bonacic-Koutecky, J. Chem. Phys., 2006, 125, 164326 Search PubMed.
- R. Antoine, F. Bertorelle, M. Broyer, I. Compagnon, P. Dugourd, A. Kulesza, R. Mitric and V. Bonacic-Koutecky, Angew. Chem., Int. Ed., 2009, 48, 7829–7832 Search PubMed.
- A. Kulesza, R. Mitric, V. Bonacic-Koutecky, B. Bellina, I. Compagnon, M. Broyer, R. Antoine and P. Dugourd, Angew. Chem., Int. Ed., 2011, 50, 878–881 Search PubMed.
- B. Bellina, R. Antoine, M. Broyer, L. Gell, Z. Sanader, R. Mitric, V. Bonacic-Koutecky and P. Dugourd, Dalton Trans., 2013, 42, 8328–8333 Search PubMed.
- T. Tabarin, A. Kulesza, R. Antoine, R. Mitric, M. Broyer, P. Dugourd and V. Bonacic-Koutecky, Phys. Rev. Lett., 2008, 101, 213001 Search PubMed.
- Y. T. Yang, C. Callegari, X. L. Feng, K. L. Ekinci and M. L. Roukes, Nano Lett., 2006, 6, 583–586 Search PubMed.
- S. Dominguez-Medina, S. Fostner, M. Defoort, M. Sansa, A.-K. Stark, M. A. Halim, E. Vernhes, M. Gely, G. Jourdan, T. Alava, P. Boulanger, C. Masselon and S. Hentz, Science, 2018, 362, 918–922 Search PubMed.
- H. Fakhouri, M. Perić, F. Bertorelle, P. Dugourd, X. Dagany, I. Russier-Antoine, P.-F. Brevet, V. Bonačić-Koutecký and R. Antoine, Phys. Chem. Chem. Phys., 2019, 21, 12091–12099 Search PubMed.
- G. F. Combes, H. Fakhouri, C. Moulin, M. Girod, F. Bertorelle, S. Basu, R. Ladouce, M. Perić Bakulić, Ž. Sanader Maršić, I. Russier-Antoine, P.-F. Brevet, P. Dugourd, A. Krisko, K. Trajković, M. Radman, V. Bonačić-Koutecký and R. Antoine, Commun. Chem., 2021, 4, 69 Search PubMed.
- I. Russier-Antoine, F. Bertorelle, A. Kulesza, A. Soleilhac, A. Bensalah-Ledoux, S. Guy, P. Dugourd, P. F. Brevet and R. Antoine, Prog. Nat. Sci.: Mater. Int., 2016, 26, 455–460 Search PubMed.
- O. V. Lushchikova, D. M. M. Huitema, P. López-Tarifa, L. Visscher, Z. Jamshidi and J. M. Bakker, J. Phys. Chem. Lett., 2019, 10, 2151–2155 Search PubMed.
- A. Fielicke, C. Ratsch, G. V. Helden and G. Meijer, J. Chem. Phys., 2005, 122, 091105 Search PubMed.
- K. Hirata, K. Yamashita, S. Muramatsu, S. Takano, K. Ohshimo, T. Azuma, R. Nakanishi, T. Nagata, S. Yamazoe, K. Koyasu and T. Tsukuda, Nanoscale, 2017, 9, 13409–13412 Search PubMed.
- S. Daly, F. Rosu and V. Gabelica, Science, 2020, 368, 1465–1468 Search PubMed.
- R. Hadidi, D. K. Bozanic, G. A. Garcia and L. Nahon, Adv. Phys.: X, 2018, 3, 1477530 Search PubMed.
- E. R. Gran, F. Bertorelle, H. Fakhouri, R. Antoine, M. Perić Bakulić, Ž. Sanader Maršić, V. Bonačić-Koutecký, M. Blain, J. Antel and D. Maysinger, Nanoscale, 2021, 13, 3173–3183 Search PubMed.
- J. Ji, A. Moquin, F. Bertorelle, P. Ky Chang, R. Antoine, J. Luo, R. A. McKinney and D. Maysinger, Nanotoxicology, 2019, 13, 285–304 Search PubMed.
- D. Maysinger, E. R. Gran, F. Bertorelle, H. Fakhouri, R. Antoine, E. S. Kaul, D. M. Samhadaneh and U. Stochaj, Theranostics, 2020, 10, 1633–1648 Search PubMed.
- E. C. Dreaden, A. M. Alkilany, X. Huang, C. J. Murphy and M. A. El-Sayed, Chem. Soc. Rev., 2012, 41, 2740–2779 Search PubMed.
- P. Y. B. Florian, M. A. H. Ron and P. Nina Ogrinc, Curr. Pharm. Des., 2017, 23, 1974–1984 Search PubMed.
- S. Bose, A. Chatterjee, S. K. Jenifer, B. Mondal, P. Srikrishnarka, D. Ghosh, A. R. Chowdhuri, M. P. Kannan, S. V. Elchuri and T. Pradeep, ACS Sustainable Chem. Eng., 2021, 9, 4554–4563 Search PubMed.
- A. Pawar, S. Thakkar and M. Misra, J. Controlled Release, 2018, 286, 179–200 Search PubMed.
- J. A. Tapia-Hernández, P. I. Torres-Chávez, B. Ramírez-Wong, A. Rascón-Chu, M. Plascencia-Jatomea, C. G. Barreras-Urbina, N. A. Rangel-Vázquez and F. Rodríguez-Félix, J. Agric. Food Chem., 2015, 63, 4699–4707 Search PubMed.
- C. Luo, T. Okubo, M. Nangrejo and M. Edirisinghe, Polym. Int., 2015, 64, 183–187 Search PubMed.
- M. Vojkovic, D. Rayane, R. Antoine, M. Broyer, A. R. Allouche, P. Mignon and P. Dugourd, J. Phys. Chem. A, 2017, 121, 4404–4411 Search PubMed.
- M. Vojkovic, D. Rayane, F. Bertorelle, R. Antoine, M. Broyer and P. Dugourd, Int. J. Mass Spectrom., 2015, 387, 45–50 Search PubMed.
- M. P. Woodard, S. T. Akin, C. J. Dibble and M. A. Duncan, J. Phys. Chem. A, 2018, 122, 3606–3620 Search PubMed.
- M. Perić, Ž. Sanader Maršić, I. Russier-Antoine, H. Fakhouri, F. Bertorelle, P.-F. Brevet, X. le Guével, R. Antoine and V. Bonačić-Koutecký, Phys. Chem. Chem. Phys., 2019, 21, 23916–23921 Search PubMed.
| This journal is © The Royal Society of Chemistry 2021 |