 Open Access Article
Creative Commons Attribution 3.0 Unported Licence
Throwing light on the current developments of two-dimensional metal–organic framework nanosheets (2D MONs)
Shabnam
Khan
 and
M.
Shahid
 *
*
Functional Inorganic Materials Lab (FIML), Department of Chemistry, Aligarh Muslim University, Aligarh 202002, India. E-mail: shahid81chem@gmail.com
First published on 22nd June 2021
Abstract
Due to the fascinating features such as ultra-thickness, great surface-to-volume atom ratios, abundantly available unsaturated coordination sites, highly porous structure, enhanced conductivity, and easily tunable structure, considerable research interest in the area of 2D metal–organic framework nanosheets (2D MONs) has been aroused worldwide. In this review, some recent contributions in 2D MONs by adopting various top-down (sonication exfoliation, chemical exfoliation, mechanical exfoliation, Li-intercalation, and chemical-assisted approach) and bottom-up strategies (surfactant-assisted approach, interfacial synthesis, modulated method, sonication synthesis) are summarized. This work aims to summarize some basic characterization techniques adopted for analyzing the developed 2D MONs. In further sections, promising applications of 2D MONs in various fields such as catalysis, gas separation, energy storage and conversion, sensors, wastewater treatment and biomedicine are also presented. In the final section, the exclusive perception of challenges and futuristic possibilities in order to promote development in this research field are presented.
1. Introduction
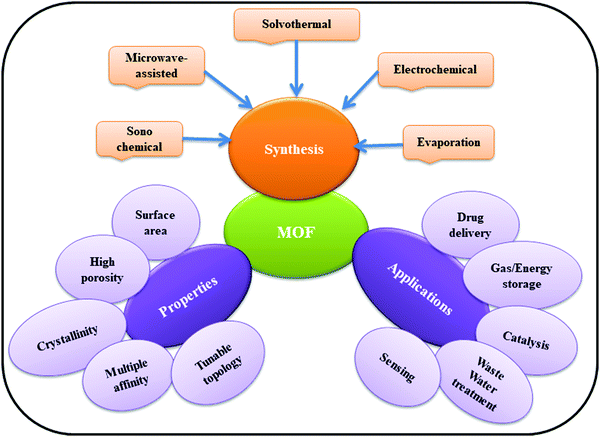
Metal–organic frameworks (MOFs) have achieved considerable attention worldwide among researchers owing to their potential applications in various fields including catalysis, sensing, separation, adsorption, electronic and optical devices, drug delivery, photocatalysis, and energy storage devices.1–8 MOFs, a category of crystalline porous materials, are usually designed by combining the organic linkers (e.g. carboxylate ligands or other negatively charged ligands) with metal nodes (e.g. metal ions and clusters) using the underlying principle of coordination chemistry.9 MOFs are generally prepared through hydrothermal or solvothermal methods;10 however, some reports on the growth of crystalline MOFs through surfactant-thermal strategy have also been documented.11 A number of factors such as tailorability of organic linkers and metal nodes as well as differing coordination numbers contributed towards the generation of approximately 90![[thin space (1/6-em)]](https://www.rsc.org/images/entities/char_2009.gif) 000 types of MOFs till date and the number is growing daily.12 Research related to MOF is attracting a number of researchers in the field of materials chemistry, owing to the modifiable structures and functionality, high surface area, and extremely high porous behavior of such materials.13 A range of well-established coordination motifs is present that allows a high degree of predictability over the resultant structure topology. MOFs can be systematically altered and modified through reticular substitution of various metal ions and organic linkers or through post-synthetic modifications due to the prefabricated nature of these materials. Fig. 1 depicts the general synthesis strategies used in MOF synthesis, their properties and applications.
000 types of MOFs till date and the number is growing daily.12 Research related to MOF is attracting a number of researchers in the field of materials chemistry, owing to the modifiable structures and functionality, high surface area, and extremely high porous behavior of such materials.13 A range of well-established coordination motifs is present that allows a high degree of predictability over the resultant structure topology. MOFs can be systematically altered and modified through reticular substitution of various metal ions and organic linkers or through post-synthetic modifications due to the prefabricated nature of these materials. Fig. 1 depicts the general synthesis strategies used in MOF synthesis, their properties and applications.
With the discovery of graphene in 2004, 2D nanomaterials viz. metal nanosheets,14 transition metal dichalcogenides,15,16 2D hexagonal boron nitride,17,18etc., have created an enormous impact on research interest in this field. 2D MONs have evolved as an emerging class of the 2D family and have received considerable interest. Being a part of the 2D family, 2D MONs combines the features of 2D nanosheets19–21 along with extreme structure tailorbility by careful selection of metal ions and bridging ligands.22–24 2D MONs extending in lateral directions and nanometric thickness have active sites on the surface that offer advantages in the field of energy conversion and catalysis.25,26
The fundamental principle behind the fabrication of 2D MONs is designing the material with directional and strong intralayer interactions, but feeble interlayer interactions in the bulk material. For instance, there exist strong covalent carbon–carbon bonds forming a hexagonal lattice, and these layers are held together by comparatively weak dispersion interactions. The connectivity between MON layers can be attained either through organic linkers, which help in bridging the isolated metal ions/clusters or through the joined inorganic clusters, or sometimes a combination of both.27a,b Typically, there is a mixture of hydrogen bonding, dispersive, and ionic interactions for any connectivity in the third dimension that allows the separation of individual layers and makes them isolated.
2D MONs have been manifested due to their chemical tenability, high conductivity and highly porous structure, usually exhibiting three, four or six connected network topologies.27c Usually in 2D MONs, three available coordinating metal sites are contained in the metal complexes of MOF to form the 2D structure.27d 2D MONs owing to the intrinsic advantages of ultrahigh porous architectures, abundantly available open active sites in the framework, and great surface-to-volume ratios, behave well to the external stimuli-responses such as ion, solvent, temperature, light, nitroaromatic explosives, gas and electron with remarkable achievements.28
So far, a myriad of well-established methods has been reported that are concerned with the synthesis of bulk MOF crystals, 0D MOF nanoparticles,29 and 1D MOF nanorods/nanowires.30,31 However, the synthesis of 2D MONs is still a challenging field as the MOF crystal growth should only be allowed in two lateral directions, meanwhile suppressing it along the vertical direction.32
In this review, an overview of the advancement, challenges, and future possibilities in the research area of 2D MONs are discussed. Herein, a list of various synthesis strategies for the 2D MONs viz., top-down and bottom-up methods are presented. In these synthesis strategies, the challenges arising during the synthesis of MONs are also presented. Some basic characterization techniques for analyzing the molecular, nanoscopic and macroscopic structures and properties of 2D MONs are outlined. Finally, the potential applications of 2D MONs in the field of catalysis, energy conversion and storage, gas separation, biomedicine, sensing, wastewater treatment are also discussed. At last, some personal perspectives on the challenges and future directions in this favorable research field are stated.
2. Synthetic strategies of 2D-MONs
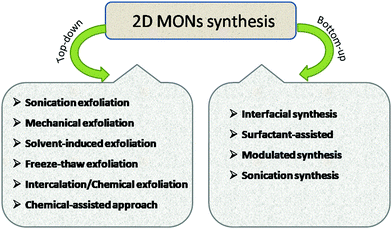
The literature reveals a variety of methods for 2D MONs synthesis, such as sonication exfoliation, Li-intercalation exfoliation, mechanical exfoliation, chemical exfoliation, surfactant-assisted approach, interfacial synthesis, and sonication synthesis. The synthetic strategies of 2D MONs (Fig. 2) can be broadly categorized into two broad groups: top-down and bottom-up methods. The top-down method comprises the efficient exfoliation of layered bulk MOFs and the bottom-up method involves the direct synthesis of 2D MONs by employing organic linkers and metal nodes. In this segment, some top-down and bottom-up methods for 2D MON preparation will be discussed in detail.2.1 Top-down strategy for 2D MONs
As the name suggests, the top-down approach involves the bulk layered-structured MOF-exfoliation into 2D MONs. In the case of bulk-layered MOFs, there is a presence of strong coordination bonds within the layers, and comparatively feeble interactions between the layers such as hydrogen bonding, van der Waals forces, π–π stacking interaction exist.33 These weak interlayer interactions in bulk-layered MOFs could be easily overcome by the application of external driving forces such as shaking, micromechanical force, sonication, and freeze–thaw to yield a single or few-layer 2D MONs. This exfoliation approach basically relies on the concept of being able to break apart weak interlayer interactions preferentially, without affecting the strong bonding interactions between them.Various examples of top-down methods, such as sonication exfoliation, mechanical exfoliation, chemical exfoliation, intercalation/chemical exfoliation to produce single or few-layered MONs are summarized in Table 1. In this section, a range of top-down methods for the preparation of 2D MONs has been discussed in detail along with suitable examples from the literature.
| MOF name | Ligand abbreviation | Metal | Synthesis strategy | Solvent | Thickness (nm) | Ref. |
|---|---|---|---|---|---|---|
| [Cu2Br(IN)2]n | Isonicotinic acid (HIN) | Cu | Sonication exfoliation | Water | 0.5 ± 0.015 | 36 |
| Zn2(bim)4 | Benzimidazole | Zn | Ball-milling/sonication exfoliation | Methanol/n-propanol | 1.12 | 34 and 129 |
| [Co(CNS)2(pyz)2]n | Pyrazine (pyz) | Co | Sonication exfoliation | Ethanol | 1.0 | 37a |
| Zn(BDC)·H2O·DMF (MOF-2) | 1,4-Benzene dicarboxylic acid (H2BDC) | Zn | Sonication exfoliation | Acetone | 1.5–6 | 130 |
| Zn7(DMS)6(OH)2 | 2,2-Dimethylsuccinic acid (H2DMS) | Zn | Sonication exfoliation | Ethanol | >10 | 36b |
| M(DMS)·(H2O) M = Mn, Co, Zn | 2,3-Dimethylsuccinic acid (H2DMS) | Mn, Co, Zn | Sonication exfoliation | Ethanol | <5 | 36c |
| Mn(DMS)·H2O | 2,2-Dimethyl succinic acid (H2DMS) | Mn | (1) Sonication exfoliation | Ethanol | ∼1 | 36d |
| (2) Sonication/Li-intercalation | Hexane | ∼1 | 48c | |||
| CuL(DMF) | 2,5-Bis(3-methoxypropoxy)-terephthalic acid (H2L) | Cu | Sonication exfoliation | DMF, acetonitrile, acetone, or ethanol | 5–30 | 84 |
| ZnL(DMF) | Zn | |||||
| Ti2(HDOBC)2·(H2-DOBDC) (NTU-9) | 2,5-Dihydroxy terephthalic acid | Ti | Sonication exfoliation | Isopropanol | 15–50 | 131 |
| Cu(μ-pym2S2)(μCl)·nH2O | Dipyrimidinedisulfide (pym2S2) | Cu | (1) Spontaneous exfoliation | Water | ∼2 | 45 |
| Cu(μ-pym2S2)(μCl)·nMeOH | (2) Sonication Exfoliation | Water | 2–50 | 83b | ||
| Ni8(5-bbdc)6(μ-OH)4 (MAMS-1) | 5-tert-Butyl-1,3-benzenedicarboxylic acid (bbdc) | Ni | Freeze–thaw exfoliation | Hexane | 4 | 47 |
| Zn2(PdTCPP) (DPDS)2 | Pd(II) tetrakis (4-carboxyphenyl)porphyrin [PdTCPP] and 4,4′-dipyridyl disulfide (DPDS) | Zn | Intercalation/chemical exfoliation | Ethanol | ∼1 | 48 |
| Cu2(bdc)2(DMF)2 | 1,4-Benzenedicarboxylate (bdc) | Cu | Amine-assisted delamination | 70 | 49 | |
| Surfactant (PVP) + amine delamination | 4–14 | |||||
| Zn2(BIM)3(OH)(H2O) Zn2(bim)3 | Benzimidazole (BIM) | Zn | Ball-milling/sonication exfoliation | Methanol–propanol | ∼1.6 | 132 |
| [La2(TDA)3]·2H2O | 2,2′-Thiodiacetic acid (TDA) | La | Sonication/Li-intercalation | Hexane | ∼2 | 48b |
| Eu2(PSA)3(H2O) [Eu-PSA] | 2-Phenylsuccinic acid (H2PSA) | Eu | Sonication exfoliation | Ethanol | ∼20 | 133 |
| [(H3O)(phz)3]-[FeIIFeIII(C6O4Cl2)3]·12H2O | 2,5-Dihydroxy-3,6-dibromo-1,4-benzoquinone (H2C6O4Cl2) | Fe | Sonication exfoliation | Methanol | ∼7 | 134 |
First, Zamora et al. demonstrated the preparation of extremely thin 2D MONs by adopting the sonication exfoliation method that breaks the weak π–π stacking interlayer interactions of bulk-layered [Cu2Br(IN)2]n {IN = isonicotinato}to form ultrathin nanosheets of [Cu2Br(IN)2]n in water.36a In [Cu2Br(IN)2]n, there exists a coordination of one copper dimer with one bromine ligand and four isonicotinato ligands (two coordinate through Cu–O bond, and the rest two coordinate through Cu–N bond) resulting in the formation of a 2D layered structure. There is a presence of interlayer π–π interactions between the aromatic rings of isonicotinato ligands that are responsible for the stacking of 2D layers. However, bulk [Cu2Br(IN)2]n MOF (1 mg mL−1) was successfully exfoliated and dispersed through sonication for 30 min to produce 2D MONs with 5 ± 0.15 Å thickness. Later on, several reports inspired by this enlightening method appeared, wherein sonication exfoliation was widely reported for the preparation of 2D MONs, some of which are discussed below.
Cheetham et al. reported a systematic study on the exfoliation of a series of DMS-based MOFs (DMS = dimethyl succinate), viz., ZnDMS,36b M(2,3-DMS) {where, M = Mn, Co and Zn},36c and MnDMS.36d A wide range of solvents such as water, methanol, ethanol, propanol, hexane, and tetrahydrofuran (THF) were employed for the exfoliation, out of which ethanol was found to be the most effective solvent for the exfoliation of the layered MOFs and also to inhibit the restacking of exfoliated nanosheets.36d The effective exfoliation in the case of DMS-based MOFs might be attributable to the presence of bulky methyl groups in the ligand, that aided in the formation of frameworks with weak interlayer interactions.36b The kinetics of exfoliation and the relationship between sonication time and concentration for different MOFs was also demonstrated by using absorption spectroscopy.36c It was overall inferred that high exfoliation rate of >70% for all MOFs could be achieved with 20 min sonication.
Yang et al. combined the sonication process with a wet ball milling process (Fig. 3a–d) for the exfoliation of layered Zn2(bim)4 {bim = benzimidazole} MOF to its nanosheets.34 A single Zn2(bim)4 layer comprising Zn ions, which are coordinated with four benzimidazole ligands in a distorted tetrahedral geometry as shown in Fig. 3a. The resultant 2D layers are stacked through van der Waals interaction along the c axis to form final MOF crystals. The exfoliation of bulk Zn2(bim)4 MOF crystals was achieved by wet ball milling of crystals at 60 rpm, followed by sonication exfoliation in an appropriate solvent. The choice of using a solvent mixture of methyl alcohol and n-propyl alcohol (1![[thin space (1/6-em)]](https://www.rsc.org/images/entities/char_2009.gif) :
:![[thin space (1/6-em)]](https://www.rsc.org/images/entities/char_2009.gif) 1 volume ratio) was found to be an appropriate one in this case. It was observed that the small methanol molecule's penetration into the interlayer space of bulk Zn2(bim)4 was facilitated by the wet ball-milling process in order to weaken the interlayer interactions. On the contrary, n-propyl alcohol aids in the stabilization of exfoliated Zn2(bim)4 nanosheets by adhering on the MONs surface with hydrophobic alkane chains, thus fulfilling the role similar to that of surfactants. The thickness (Fig. 3c) of Zn2(bim)4 nanosheets was found to be 1.12 nm with several micrometers lateral size that coincides with HRTEM results. The SAED pattern (along c axis) showed the diffraction pattern of (hkl) nanosheet planes, which shows good agreement with the simulated result that confirms the crystal structure of exfoliated nanosheets.
1 volume ratio) was found to be an appropriate one in this case. It was observed that the small methanol molecule's penetration into the interlayer space of bulk Zn2(bim)4 was facilitated by the wet ball-milling process in order to weaken the interlayer interactions. On the contrary, n-propyl alcohol aids in the stabilization of exfoliated Zn2(bim)4 nanosheets by adhering on the MONs surface with hydrophobic alkane chains, thus fulfilling the role similar to that of surfactants. The thickness (Fig. 3c) of Zn2(bim)4 nanosheets was found to be 1.12 nm with several micrometers lateral size that coincides with HRTEM results. The SAED pattern (along c axis) showed the diffraction pattern of (hkl) nanosheet planes, which shows good agreement with the simulated result that confirms the crystal structure of exfoliated nanosheets.
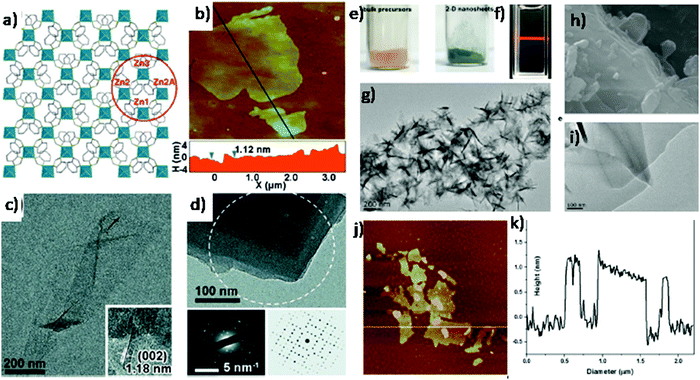 | ||
| Fig. 3 (a) Schematic representation of the mono-layer Zn2(bim)4 nanosheet (Zn coordination polyhedral depicted in blue), whereas bim ligands are represented by sticks (b) AFM image of Zn2(bim)4 nanosheets on Si, and the corresponding height profile measured along the black line (c) TEM image of Zn2(bim)4 nanosheet. Inset: HRTEM image of five-layered nanosheet (d) TEM image and the SAED pattern (white circle) of few-layered Zn2(bim)4 nanosheet. Reproduced with permission from ref. 34. Copyright 2014, the American Association for the Advancement of Science. (e) Image of the powder samples of bulk Co(CNS)2(pyz)2 precursor and 2D [Co(CNS)2(pyz)2]n nanosheets; (f) Tyndall effect of an ethanolic colloidal suspension; (g) SEM image of bulk Co(CNS)2(pyz)2 precursors; and (h and i) TEM images of the 2D MOF nanosheets. (j) AFM topological image and (k) height profile of a single-layered nanosheet along the white line. Reproduced with permission from ref. 37a. Copyright 2018, the American Chemical Society. | ||
Luo et al. developed single layers of 2D [Co(CNS)2(pyz)2]n {pyz = pyrazine} nanosheets by adopting ultrasonic force-assisted liquid exfoliation technology on bulk MOF by using ethanol as a solvent.37a As shown in Fig. 3e, after the ultrasonic treatment of a crystalline bulk [Co(CNS)2(pyz)2]n, which is pink in color, for approx. 2 h resulted in green 2D MONs, and Fig. 3f depicts a colorless and finely dispersed colloidal suspension, exhibiting a considerable Tyndall effect. The SEM image of the bulk precursor revealed that the nanosheets are arranged in lamellar structures that are stacked one above the other by means of weak van der Waals forces to form 3D block morphology. TEM morphology of 2D nanosheets (Fig. 3h and i) depicted randomly stacked enormous ultrathin nanosheets with about 0.5 μm lateral size and thickness in sub-1.0 nm (as shown in the height profile in Fig. 3k).
It is likely to understand that a solvent system working well for one MOF system cannot be generalized for others as each MOF has its own properties depending on its combination of metal and ligands. For instance, Junggeburth et al. noted the effect of shaking in varying solvent systems. The use of hydrophobic MOF revealed poor exfoliation while using polar solvents such as H2O and DMF and decreasing exfoliation in order, THF > toluene > CHCl3. This behaviour results from the inability of polar solvents to penetrate into the hydrophobic interlayer space.37b On the contrary, Moorthy et al. showed that the presence of hydrogen bonds between MOF layers could be overcome by using hydrogen-bond-accepting solvents, leading to spontaneous exfoliation.37c
Although the mechanism of exfoliation is not well established yet some reports are available that describe the mechanism to get a better understanding of this aspect. For instance, Huang et al. demonstrated the exfoliation of 3D pillared-layer MOFs into single-layer 2D MONs by utilizing the advantage of coordination bond anisotropy in 3D MOFs.37d This anisotropy results in the selective breaking of interlayer bonding through the substitution of pillared ligands by capping solvent molecules combined with sonication in solvent for a short duration (30 min) leading to single-layer MONs. In this work, [Zn2(bdc)2(dabco)]·4DMF·0.5H2O, (where, H2bdc = 1,4-benzenedicarboxylic acid, dabco = 1,4-diazabicyclo-[2.2.2]octane, and DMF = N,N-dimethylformamide), also known as 3D-Zn, was employed as the exfoliation precursor. [M2(bdc)] is the 2D metal–organic coordination layer, dabco is the pillared ligand and H2O was employed as capping-end guest molecules for the exchange of pillared ligands and finally destructing the pillar structure of 3D pillared-layer MOFs. At the same time, ultrasonication restricts the restacking of resulting 2D MON layers. As a result, the parent MOFs can be easily and rapidly exfoliated to single-layer nanosheets (∼0.9 nm) by sonication exfoliation in H2O in a relatively higher yield of up to 94%. The possible exfoliation mechanism is illustrated in Fig. 4 where the dabco pillars in 3D-Zn were selectively removed through solvent substitution and capping to yield essentially 2D layered sheets for which synergistic ultrasound was applied to reinforce the exfoliation effect and prevent the well-ordered restacking of the resultant single layer nanosheet.
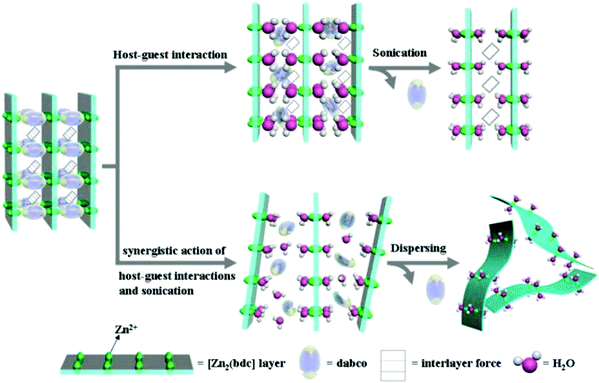 | ||
| Fig. 4 Proposed mechanisms for the transformation of a 3D pillared-layer MOF to ultrathin 2D MOF nanosheets. Reproduced with permission from ref. 37d. Copyright 2020, the Royal Society of Chemistry. | ||
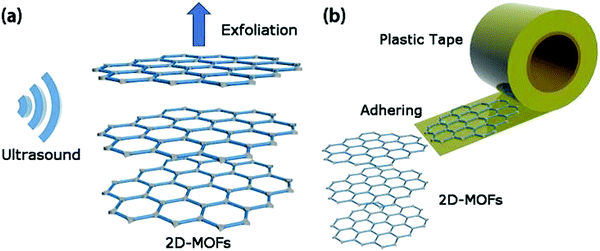 | ||
| Fig. 5 Comparative illustrations of sonication (a) and mechanical (b) exfoliation methods. Reproduced with permission from ref. 38. Copyright 2019, the Royal Society of Chemistry. | ||
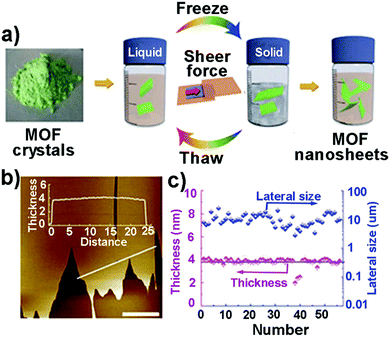 | ||
| Fig. 6 (a) Schematic illustration of the freeze–thaw process for the exfoliation of MAMS-1 crystals into dispersed nanosheets. (b) The AFM image of a piece of MAMS-1 nanosheets and the corresponding height profile measured along the white line. Scale bar: 10 mm. (c) Thickness (purple) and lateral size (blue) distributions of exfoliated MAMS-1 nanosheets after 10-cycle freeze–thaw in hexane. Reproduced with permission from ref. 47a. Copyright 2017, Nature Publishing Group. | ||
Very recently, Zheng et al. reported the freeze–thaw exfoliation of Co-MOF by incorporating a pre-photodimerized 9-anthrylmethylphosphonic acid (amp2H4), producing Co2(amp2H4)2(H2O)4·6H2O {designated as MDAF-1, where MDAF is the abbreviation for metal dianthracene framework}.47b In the layered compound, MDAF-1, the interlayer interactions are mainly dominated by hydrogen bond and van der Waals interactions, which were overcome by a mild freeze–thaw strategy. Firstly, MDAF-1 crystals (approx. 2 mg) were firstly dispersed in 5 ml water, then this solution was frozen in liquid nitrogen (−196 °C), and finally followed by thawing in hot water (at 55 °C). After 70 freeze–thaw cycles, the suspension was allowed to stand for 24 h, and then centrifuged for 10 min in order to remove the precipitate. Hence, nanosheets (MDAF-1-ns) were obtained with 1.4–1.7 nm thickness and 5.6 μm average lateral size.
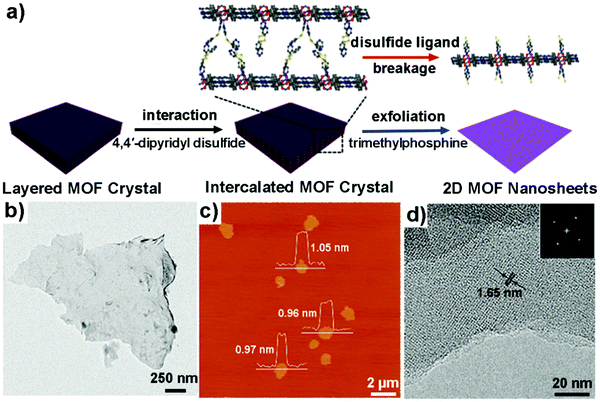 | ||
| Fig. 7 (a) Schematic illustration of the procedure for the synthesis of 2D MONs via an intercalation and chemical exfoliation approach. (b) TEM image of a piece of exfoliated MON. (c) AFM image of the exfoliated MONs with the corresponding height profiles measured along three white lines. (d) High-resolution TEM image of a multilayered MON and the corresponding FFT pattern. Reproduced with permission from ref. 48a. Copyright 2017, the American Chemical Society. | ||
Xia et al. adopted a sonication/Li-intercalation approach for the exfoliation of La2(TDA)3 (TDA = 2,2′-thiodiacetic acid).48b First of all, multilayered La2(TDA)3 nanosheets were prepared through the sonication exfoliation method. After that, Li-intercalation was introduced to further exfoliate the multi-layered MONs to single-layered MONs. The mode of mechanism can be due to the incorporation of Li ions that increases the layer spacing, thus weakening the interlayer interactions resulting in easy exfoliation of layered MOFs. In a similar way, Song et al. demonstrated the exfoliation of MnDMS to ultrathin MONs adopting the same sonication/Li-intercalation approach.48c First of all, MnDMS crystals were broken to form nanoparticles (size up to 200 nm) via ultrasonication in ethanol for 20 min. Finally, Li-intercalation was done to exfoliate these MnDMS nanoparticles into ultrathin layers of 1 nm thickness. In both cases, the mode of action could be due to the forced hydration of Li ions, which leads to the pushing of MOF layers apart to such an extent that the interlayer interactions are negated.48b,c
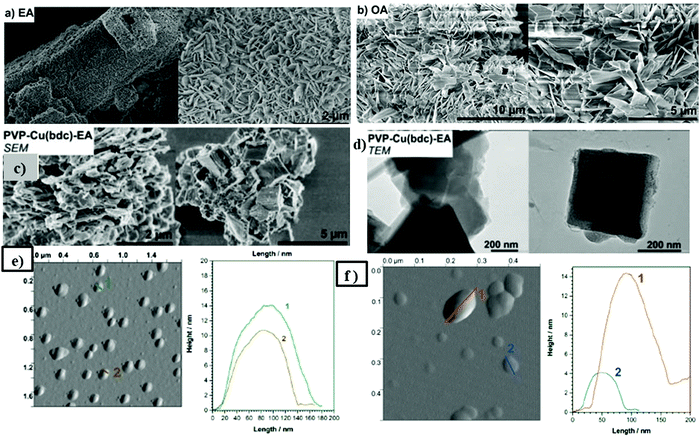 | ||
| Fig. 8 (a) SEM images of Cu2(bdc)2 after delamination tests with (a) ethylamine (EA) and (b) octylamine (OA) under optimized conditions for each substrate, respectively. (c) SEM image of PVP (10 mol%) derived Cu(bdc) and (d) SEM and TEM images of delaminated PVP–Cu(bdc) with ethylamine (EA) at 60 °C. (e) AFM images (left) and height profiles (right), of the particles obtained from the supernatant suspension after delamination with octylamine (f) AFM image (left) and height profiles (right) of the particles obtained from the supernatant suspension after delamination of Cu2(bdc)2 PVP with ethylamine. Reproduced with permission from ref. 49a. Copyright 2017, the Royal Society of Chemistry. | ||
This new strategy has the advantage of a gentle delamination process due to the absence of any mechanical pressure that usually affects the preliminary, bulk material but it utilizes the affinity of open metal sites in copper paddle wheels to the amine reagents so as to shatter the weak interlayer interactions for the separation of stabilized single layers. This synthesis strategy serves as a general method for other possible 2D MOFs (in which paddle wheel clusters or open metal sites are present) delamination into MONs.
As a whole, top-down methods have been recognized as the simplest and consistent strategies for the preparation of 2D MONs. Regardless of the great attainments of this approach, several disadvantages of top-down methods still hamper their further applications. Foremost, top-down methods are found to be not suitable for non-layered MONs in general. Second, it is quite difficult to have control over the external driving force for precisely controlling the thickness of obtained MONs. Lastly, the major drawback is the low exfoliation yield of MONs (usually less than 15%) for large-scale applications. Furthermore, there arise some structural deterioration or restacking problems with the exfoliated MONs.49b Henceforth, substantial efforts are required to surpass the above-discussed issues of top-down methods.
2.2 Bottom-up synthesis strategy for 2D MONs
This method involves the direct assembly of 2D MONs from organic ligands and metal ions under specific synthesis conditions. The underlying principle of this straightforward method is allowing the bi-directional lateral growth while limiting the MOF growth along the vertical direction.19 In comparison to the top-down method, this method can result in higher yields of MONs with uniform thickness. This approach is most suitable for non-layered MOFs and nearly all of the non-layered MOFs were synthesized by utilizing bottom-up methods. On the other hand, in the case of layered MOFs, hampering the layer stacking restricts the vertical direction growth of MOFs that result in the formation of 2D MONs. In this section, some bottom-up strategies, such as interfacial synthesis strategy, surfactant-assisted approach, modulated synthesis, and sonication method, used in the direct preparation of 2D MONs are discussed in detail. Various bottom-up methods along with examples are summarized in Table 2.| MOF name | Ligand abbreviation | Metal | Synthesis strategy | Thickness (nm) | Ref. |
|---|---|---|---|---|---|
| Ni–BHT (nano-1) | Benzenehexathiol (BHT) | Ni | Liquid–liquid interfacial | 1000–2000 | 135 |
| Liquid–air interfacial | 0.6 | 52g | |||
| Cu(dhbc)2(bpy).H2O | 2,5-Dihydroxybenzoic acid (dhbc) | Cu | Liquid–air interfacial | 4.4 | 52h |
| TCPP–Cu (NAFS-2) | Tetrakis(4-carboxyphenyl)-porphyrin (TCPP) | Cu | Liquid–air interfacial | Depending on cycle number, ∼21 nm for 30 cycles | 52c |
| PdTCPP–Cu (NAFS-13) | Tetrakis(4-carboxyphenyl)-porphyrin (TCPP) | Cu | Liquid–air interfacial | Single-layer | 52d |
| ZnTPyP–Cu (NAFS-21) | Tetra(4-pyridyl)-porphinato zinc(II) (ZnTPyP) | Cu | Liquid–air interfacial | 0.5 | 52e |
| Ni–THT | Triphenylenehexathiol (THT) | Ni | Liquid–air interfacial | 0.7–0.9 | 136 |
| Cu–HHTP | 2,3,6,7,10,11-Hexahydroxytriphenylene (HHTP) | Cu | Liquid–liquid interfacial | 380 | 53 |
| Cu-MOF | Tetrakis(4-carboxyphenyl)-porphyrin (TCPP) | Cu | Liquid–liquid interfacial | 3.4 | 54a |
| Ni-MOF | Terephthalic acid (1,4-H2BDC) | Ni | Liquid–liquid interfacial | 5 | 54b |
| Cu3(BHT) | Benzenehexathiol (BHT) | Cu | Liquid–liquid interfacial | 15–500 | 137 |
| Co3(THT)2H3 (Co–THT) | Triphenylenehexathiol (THT) | Co | Liquid–liquid interfacial | 100–200 | 138 |
| CuBDC | 1,4-Benzene dicarboxylic acid (H2BDC) | Cu | Liquid–liquid interfacial | ∼5 | 139 |
| Pd–BHT | Benzenehexathiol (BHT) | Pd | Liquid–liquid interfacial | 1000 | 140 |
| Liquid–air interfacial | 4–10 | ||||
| Nano-NiIT NiAT | 1,3,5-Triaminobenzene-2,4,6-trithiol | Ni | Liquid–liquid interfacial | 20 | 141 |
| Liquid–air interfacial | 0.6–12 | 142 | |||
| Zn–TCPP | Tetrakis(4-carboxyphenyl)-porphyrin (TCPP) | Zn | Surfactant-assisted polyvinylpyrrolidone (PVP) | 7.6 ± 2.6 | 55 |
| Zr–BDC | 1,4-Benzene dicarboxylic acid (H2BDC) | Zr | Surfactant-assisted sorbitol-alkylamine | 3–4 | 56 |
| NH2-MIL-53(Al) | 2-Aminoterephthalic acid | Al | Surfactant-assisted hexadecyltrimethylammonium bromide (CTAB) | 35–45 | 143 |
| [Cu2(BDC)2(BPY)]n (or, 1-meso) | 1,4-Benzene dicarboxylic acid (H2BDC) | Cu | Modulated synthesis (acetic acid) | 60–300 | 58 |
| NiCo–BDC | 1,4-Benzene dicarboxylic acid (H2BDC) | Ni, Co | Sonication | 3.1 | 67 |
| Mn-UMOFNs | 1,4-Benzene dicarboxylic acid (H2BDC) | Mn | Sonication | 1.8–7 | 68 |
| Ni-UMOFNs | Ni | 8–10 | |||
| NiFe–BDC | 1,4-Benzene dicarboxylic acid (H2BDC) | Ni, Fe | Sonication | 10 | 69 |
| Ni-MOF | 1,4-Benzene dicarboxylic acid (H2BDC) | Ni | Sonication | 4.3–4.4 | 70 |
The liquid–gas interface can be applied to develop ultra-thin or single-layer nanosheets.51 In this method, the liquid surface is roofed over with a little quantity of volatile organic solvent consisting of a limited amount of organic ligands or metal ions. The evaporation of organic solvent leads to the formation of a gas–liquid interface. In this method, good control over the nucleation and growth kinetics of MOFs is possible as the reaction takes place on the water surface. Initially, Kitagawa and co-workers employed the liquid–gas interfacial synthesis method for the preparation of a series of TCPP-based MONs at the water/air interface.52a–f
Nishihara et al. adopted liquid–gas interfacial synthesis for the development of ultrathin Ni–BHT (where, BHT = benzenehexathiol) nanosheets.52g As shown in Fig. 9a, the aqueous solution surface containing Ni(OAc)2 was gently covered with AcOEt (ethyl acetate) solution containing the BHT ligand. After the evaporation of ethyl acetate, a thin layer comprising BHT ligands on the water surface appears. At this liquid/air interface, Ni–BHT nanosheets are obtained after the reaction for a period of 2 h. The obtained nanosheets were finally transferred to HOPG substrate (highly oriented pyrolytic graphite). The AFM phase image (Fig. 9b) clearly shows few-layer Ni–BHT nanosheets morphology with several nanometric thicknesses. While the single-layer Ni–BHT nanosheet AFM image represents a smooth surface with 0.6 nm thickness.
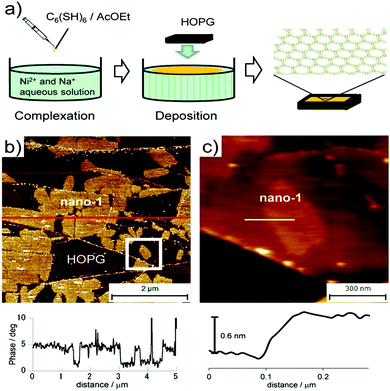 | ||
| Fig. 9 (a) Illustration of the synthesis of nano-1. (b) (top) AFM phase image on HOPG and (bottom) its cross-sectional analysis. The bright areas correspond to nano-1. (c) (top) AFM topological image of single-layer nano-1 and (bottom) and its cross-sectional analysis. The white square in (b) corresponds to the scan area. Reproduced with permission from ref. 52g Copyright 2013, the American Chemical Society. | ||
Recently, Zhao et al. adopted a modified interfacial synthesis method for the preparation of Cu(dhbc)2(bpy)·H2O MONs at the air/water interface, as shown in Fig. 10.52h Thus, obtained nanosheets were dispersed in isopropanol to form a colloidal solution with appreciable Tyndall effect (Fig. 10b). The AFM image revealed layered morphology with lateral of about 8 μm and thickness of approximately 4.4 nm (Fig. 10c). TEM results also confirmed the layered morphology (Fig. 10d) while MOF crystallinity was seen in the few-layer MONs as shown in HR-TEM and SAED results (Fig. 10e and f).
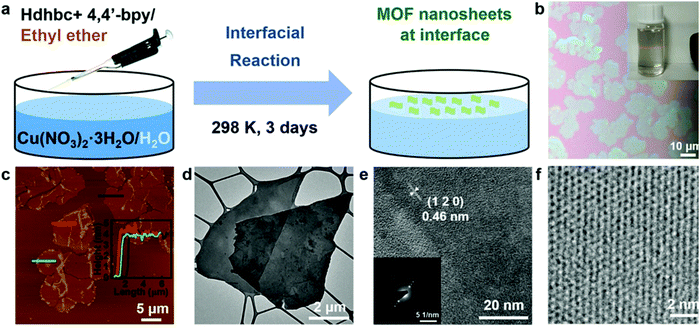 | ||
| Fig. 10 (a) Scheme of the preparation of few-layer Cu(dhbc)2(bpy)·H2O MONs at the air/water interface. (b) Image of the synthesized MONs. Inset: Tyndall effect of the MON suspension in isopropanol. (c) Tapping-mode AFM topographical image of MONs on a silicon wafer. Inset: Height profiles of the MONs corresponding to the three marked lines. (d) Low-magnification TEM image of few-layer MONs. (e and f) High-resolution TEM (HRTEM) images of few-layer MONs. Inset: The selected area electron diffraction (SAED) pattern. Reproduced with permission from ref. 52h Copyright 2021, Wiley-VCH. | ||
In the case of a liquid–liquid interfacial interface, two immiscible liquids are utilized in order to dissolve the organic linker and metal ions. Wong et al. fabricated a π-conjugated metal complex nanosheet (Cu–HHTP nanosheets) by employing liquid–liquid interfacial synthesis.53 As illustrated in Fig. 11a, ethyl acetate was carefully poured above the deionized aqueous solution of Cu2+ and then ethyl acetate solution of HHTP (2,3,6,7,10,11-hexahydroxytriphenylene) was carefully added on the top to generate a liquid–liquid interface. The reaction was kept undisturbed for 1 day under ambient conditions. AFM topological image (Fig. 11f) revealed smooth and homogeneous texture with a thickness of around 380 nm.
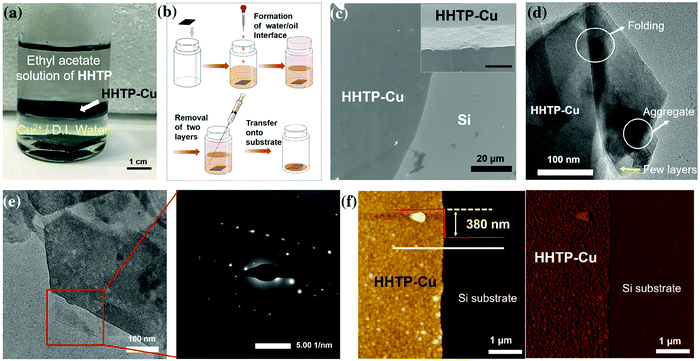 | ||
| Fig. 11 (a) The photograph of the formed HHTP–Cu through the interface-assisted synthesis process (b) schematic diagram of the transfer process of large-sized HHTP–Cu onto the substrate (c) scanning electron microscopy (SEM) image of HHTP–Cu. The inset image is the magnification of the edge. Scale bar: 400 nm. (d) The transmission electron microscopy (TEM) image of HHTP–Cu on a copper grid. (e) The TEM image of the selected area on the nanosheet and the corresponding electron diffraction pattern. (f) Atomic force microscopy images and cross-sectional analysis of HHTP–Cu on the Si substrate. Left: Height image; right: phase image. The cross-sectional analysis was conducted along with the white line in the height image. Reproduced with permission from ref. 53. Copyright 2020, Springer. | ||
Recently, Zhao et al. developed ultrathin 2D MONs via sonication exfoliation of the membranes of MOF (Fig. 12) developed from interfacial growth.54a In this method, the copper acetate salt was first dissolved in water to form the aqueous phase and TCPP was dissolved in a mixed solvent (DMF and 1-octanol) to form the organic phase. This organic phase was carefully poured above the aqueous phase and left as such for 3 days and finally, the product obtained at the interface of two immiscible solvents was extracted with the aid of a spoon. After washing with ethanol, Cu-MONs were obtained by applying the sonication exfoliation method on membranes in water for a period of 20 min. The AFM image indicated a consistent thickness of ∼3.4 nm of MONs.
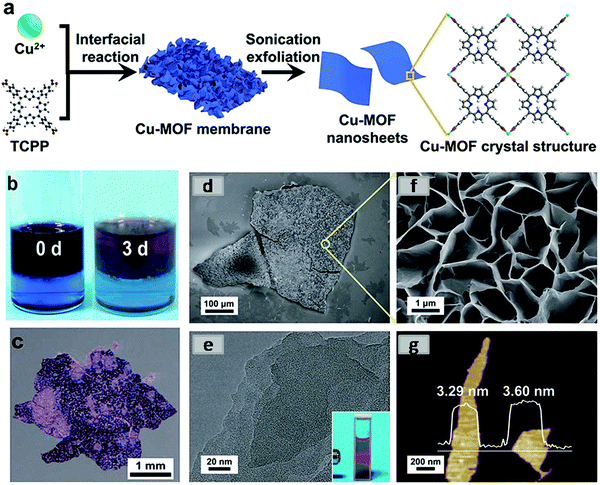 | ||
| Fig. 12 (a) Synthetic procedure and crystal structure of Cu-MOF nanosheets (schematic) (b) photographs of the color changes of two immiscible phases before and after the reaction (c) optical image of a Cu-MOF membrane. (d) FESEM image of the overview of a Cu-MOF membrane (e) high-magnification FESEM image of the surface of a Cu-MOF membrane (f) TEM image of Cu-MOF nanosheets, inset: the Tyndall effect of a colloidal suspension. (g) AFM image of Cu-MOF nanosheet. Reproduced with permission from ref. 54a. Copyright 2019, the Royal Society of Chemistry. | ||
Very recently, Huang et al. fabricated 2D Ni MONs through a mild liquid–liquid interfacial method with a controlled molar ratio of metal precursors and linkers.54b In this method, a definite amount of organic linker (1,4-H2BDC, terephthalic acid) dissolved in a mixture solution consisting of N,N-dimethylacetamide (DMAC) and trichloromethane (CHCl3) was taken in a beaker. To this solution, a stoichiometric amount of nickel acetate (Ni(Ac)2) as a metal salt dispersed in deionized water was dropped into the organic solution. As the metallic precursor aqueous solution comes in contact with the organic phase, a light-green product starts to appear at the liquid–liquid interface. The obtained product displayed 2D parallelogram-like features with 200–450 nm lateral size exhibiting the Tyndall effect. Thus, it indicated the formation of 2D Ni MONs with an average thickness of ∼5 nm (corresponding to 6 metal coordination structural layers).
The major limitation of interfacial synthesis is the relatively lower yield of MONs that can be attributed to the limited area at the interface.
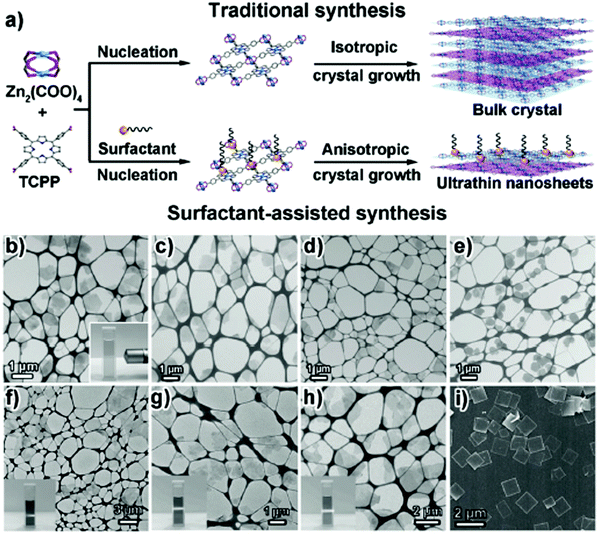 | ||
| Fig. 13 (a) Scheme of the traditional synthesis and surfactant-assisted synthesis of Zn–TCPP MOFs. To make the layered structures clear, the MOF layers are drawn in blue and purple, respectively. (b–h) TEM images of MOF nanosheets synthesized by using the surfactant-assisted synthetic method. (b) Zn–TCPP nanosheets. (c) Cu–TCPP nanosheets. (d) Cd–TCPP nanosheets. (e) Co–TCPP nanosheets. Reproduced with permission from ref. 55. Copyright 2015, Wiley-VCH. | ||
Recently, Zhang et al. presented the fabrication of ultrathin 2D MONs by surfactant-assisted coordination approach (Fig. 14a) through the pseudo-assembly process.56 In this method, bio-based surfactant sorbitol-alkylamine was used consisting of polyhydroxy and amine groups that could competitively bind to the defects present in Zr–BDC MOF leading to the anisotropic growth of MOFs. By careful control of the ligand and surfactant ratio, the pseudo-assembly process leads to the MOF formation and hence intercalated MOFs are produced. Due to hydrophobic chain interactions, the intercalated MOFs get accumulated with the surfactant, which could result in weakened interlayer interactions to form ultrathin nanosheets with 3–4 nm thickness (Fig. 14d) in high yield (67%). It was also concluded that the thickness of nanosheets can be varied in 3–60 nm range by changing the hydrophobic chain length in the surfactant.
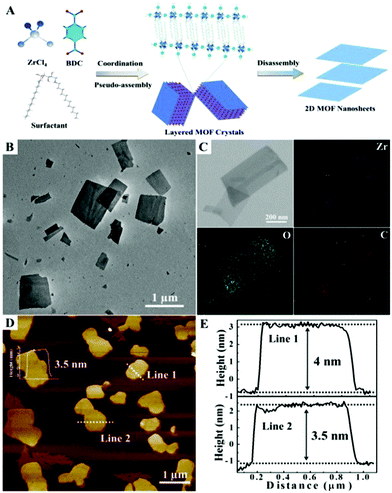 | ||
| Fig. 14 (a) Schematic illustration of the process developed to produce 2D Zr-MOF nanosheets via a surfactant-mediated method (b) representative TEM image (c) EDX elemental mapping (d) AFM image and the corresponding height profiles (e) of the 2D Zr–BDC MOF synthesized using SAAS-C12 as the surfactant. Reproduced with permission from ref. 56. Copyright 2019, the Royal Society of Chemistry. | ||
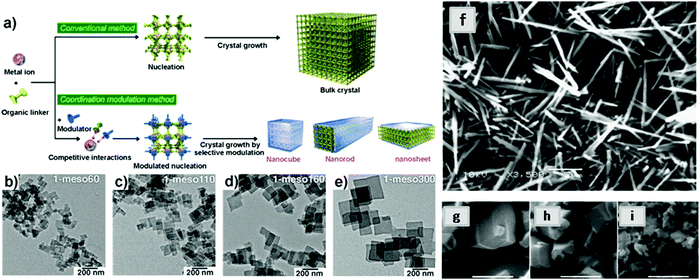 | ||
| Fig. 15 Schematic illustration of the modulated synthesis of MOF nanocrystals. Reproduced with permission from ref. 57. Copyright 2009, Wiley-VCH. (b–e) TEM images of [Cu2(BDC)2(BPY)] nanosheets prepared by adding different amounts of modulator (r = 20, 30, 40 and 50, where r = [acetic acid]/[copper acetate]). (b) 1-meso60 nanosheets, r = 20. (c) 1-meso110 nanosheets, r = 30. (d) 1-meso160 nanosheets, r = 40. (e) 1-meso300 nanosheets, r = 50. Reproduced with permission from ref. 58. Copyright 2013, the American Association for the Advancement of Science. (f) SEM images of NH2-MIL-53(Al) synthesized with decreasing molar ratio of acetic acid to Al(NO3)3·9H2O; 30 (in DMF); (g) 30 (in H2O); (h) 20 (in H2O); (i) 0 (in H2O). Reproduced with permission from ref. 59. Copyright 2013, Royal Society of Chemistry. | ||
Many other types of modulators have been reported such as cetyltrimethylammonium bromide (CTAB),60 trisodium citrate,61 trisodium lauric acid,62 formic acid and water.63 In addition to the above-mentioned modulators, synthesis of MONs could also be performed by the use of basic compounds such as triethylamine64 and NaOH.65
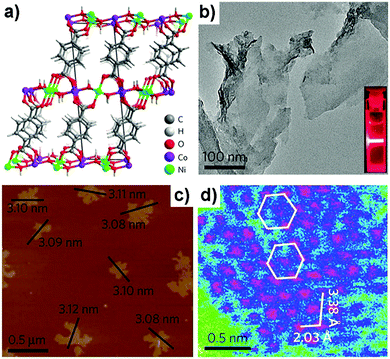 | ||
| Fig. 16 (a) Crystal structure of NiCo–UMOFNs. (b) TEM image of NiCo–UMOFNs. Inset: Tyndall light scattering of NiCo–UMOFNs in an aqueous solution. (c) AFM image of as-prepared NiCo–UMOFNs, showing measured dimensions of individual nanosheets. (d) HAADFSTEM image of the (200) plane for NiCo–UMOFNs, showing the hexagonal arrangement of the metal atoms. The pink color represents metal atoms, blue is for light elements (carbon and oxygen), and green is for background. Reproduced with permission from ref. 67. Copyright 2016, Nature Publishing Group. | ||
In short, the sonication method is straightforward, power-efficient and reliable that has the potential for the extensive fabrication of 2D MONs.
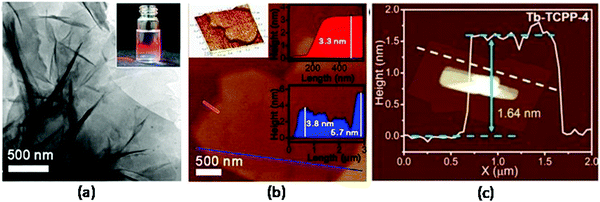 | ||
| Fig. 17 (a) TEM image of Zr–BTB nanosheets prepared by microdroplet flow synthesis method, and the inset displays the Tyndall light scattering of the Zr–BTB colloidal suspension. (b) AFM image of Zr–BTB nanosheets, and corresponding height profiles along the blue and red lines, respectively. Reproduced with permission ref. 73 Copyright 2018, American Chemical Society (c) AFM image of Tb–TCPP-4 nanosheets synthesized in a household microwave oven, together with the height profile of Tb–TCPP-4 nanosheets along the white dashed line. Reproduced with permission ref. 74. Copyright 2020, Wiley-VCH. | ||
Recently, synthesis of some of MONs were reported by the combination of top-down and bottom-up methods.64,75 Lotsch et al. synthesized ultrathin MONs by adopting the surfactant-assisted bottom-up method and successive exfoliation method.60 CTAB was employed as a surfactant to synthesize mesostructured imidazolate frameworks (MIFs), which are comprised of stacked 2D [Zn(BIM)OAc] layers with periodic interspace occupied by CTAB. This could further be easily exfoliated to 10 nm thickness nanosheets due to weak van der Waals interactions existing between [Zn(BIM)OAc] layers and CTAB.
To conclude, the bottom-up synthesis strategy has been successfully utilized for the development of a wide variety of MONs. In comparison to above mentioned top-down methods, usually, bottom-up methods hold some inherent advantages. First, the bottom-up approach that is normally performed in the solution can result in a higher yield of MONs. Secondly, the fabrication of MONs with appreciable nanometric thickness and large lateral size (up to several centimeters) could be achieved through a bottom-up method via fine-tuning of reaction parameters. Lastly, non-layered MONs can be fabricated by a bottom-up approach. Despite the above-listed achievements, it still a remains challenge to design a global bottom-up method for the fabrication of high-quality MONs.
3. Characterization methodologies
After the synthesis of 2D MONs, the analysis and clear demonstration of their structure plays a crucial role. Even though the crystal structure of MOFs were usually resolved with the aid of single-crystal X-ray diffraction (XRD) technique or through the combined agreement between simulation and refinement with powder X-ray diffraction (PXRD), still there is not a single decisive technique in order to determine the structure of 2D MONs.76,77 Hence, a combination of multiple techniques is usually employed for the characterization of these nanosheets. Some in-situ characterization techniques such as Infrared (IR) spectroscopy, Ultraviolet-Visible (UV-vis) spectroscopy, Raman spectroscopy and Tyndall light scattering are usually employed to determine the formation of MONs. MONs are basically complex, ordered nanomaterials whose structure as well as properties needs to be studied with a wide range of characterization techniques obtained from the solid-state, surface, solution and colloidal state. In this section, the core-set of methods emerging for the characterization of MONs are focused on underlining the innovative use of advanced techniques.3.1 Structure and composition
The fruitful success of MOFs has been mainly due to the developments in single-crystal X-ray diffraction (SC-XRD) that helps in the atomic resolution of complex structures. In the case of MONs, reduced dimensions mean that the crystals are too small for SC-XRD. However, if the structure of parent layered MOF or somewhat closely related structure is known, comparing the X-ray powder diffraction (XRPD) patterns of MONs with the known structure, allows with ease the determination of nanosheet structure. XRPD patterns of MONs may show systematic disappearance of peaks analogous to out-of-plane reflections in the parent MOF. This behavior arises due to the broadening of peaks resulting from the reduced dimensions of MONs and also preferred crystallite orientation. Gascon et al. explained this effect by assigning the peaks in XRPD patterns (Fig. 18a) of the developed nanosheets to the reflections that correspond to the layers stacking along the [201] direction.78a However, there is not always peak broadening that indicates nanosheet re-aggregation or the presence of larger particles that dominates the powder patterns. Grazing incidence (GIXRD) can be utilized for enhancing the detection of in-plane peaks in thin films.78b,c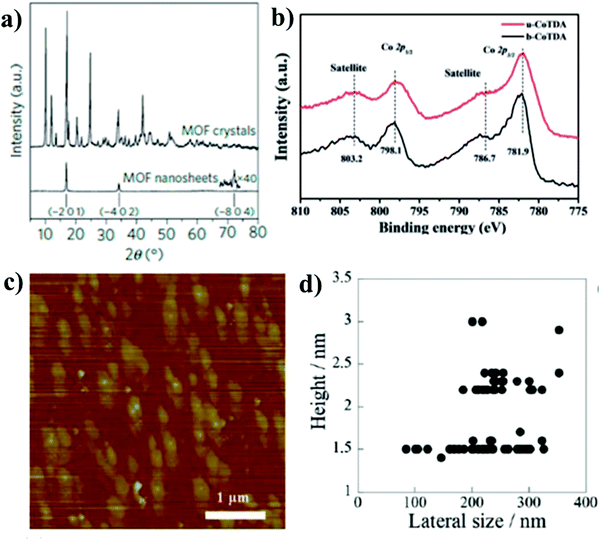 | ||
| Fig. 18 (a) XRPD patterns comparing nanosheets with parent MOF showing systematic loss of out-of-plane reflections. Reproduced with permission from ref. 78a. Copyright 2015, Nature Publishing Group. (b) XPS data providing evidence on the elemental composition of a MON. Reproduced with permission from ref. 71. Copyright 2017, Wiley-VCH. (c) AFM image of CuMOF nanosheets exfoliated by shaking treatment (d) the height data of CuMOF nanosheets against the lateral sizes. Reproduced with permission from ref. 81c. Copyright 2013, Royal Society of Chemistry. | ||
Some additional information about the structure and composition can be obtained from a diverse range of other techniques such as solid-state nuclear magnetic resonance (NMR) spectroscopy, thermal gravimetric analysis (TGA), infrared (IR) spectroscopy, pair distribution function (PDF) and elemental analysis for providing evidence of MON composition.79 Some surface techniques like X-ray photo spectroscopy (XPS), X-ray fluorescence (XRF) and ultraviolet photoelectron spectroscopy (UPS) give information regarding the elemental composition and oxidation state of nanosheets.71,80 The prime factor to consider during the MON imaging is to get the concentration low enough in order to see the isolated nanosheets.
XPS technique is a sophisticated analytical technique used to study the surface elemental composition of MONs (particularly, photocatalyst) and gives information of the presence of any element by the usage of XPS database (semi-quantitative), or by comparison with standard reference material (quantitative) (Fig. 18b). XPS is based on the concept of the photoelectric effect, which shows the impact of photons results in the ejection of electrons from the material surface. Basically, the XPS technique relies upon the incident photon energy, kinetic energy possessed by ejected electrons, and collection angle. The source of photon energy is usually Al-Kα (1486.6 eV) or Mg-Kα (1253.6 eV) cathodes. Due to the interactions of photon-matter, the emitted electron usually contains all the necessary data that reveals the compositional behavior of the sample. With the aid of instrumental technique, the ejected electrons form a spectrogram in which the peak area provides the information related to the binding energy (BE) of the present elements, the number of atoms present in the material, and chemical bonding information.
3.2 Nanoscopic characterization
The nanoscopic dimensions of MONs must also be investigated in addition to understanding the molecular framework of MONs. The surface topography of MON is considered a key feature to get precise information about its adsorption capability and could be carried out by both contact and non-contact techniques. One of the most common techniques that fall under the category of contact process is atomic force microscopy (AFM). AFM is basically applied to measure the thickness of nanosheets at the resolution of angstrom. With the aid of the AFM technique, the layered structure and comparatively smooth structure of MONs (Fig. 18c and d) can be discovered.81 In most of the cases, the height of the nanosheets observed matches that predicted from the crystal structures. However, the interpenetration of components, as well as instrumental set-up, leads to the mismatching in the height of multilayer nanosheets to those of single-layer nanosheets.82a Sometimes, due to the presence of solvent molecules or surface water and counter ions, the nanosheets appear thicker than expected.82b A range of substrates such as mica, silica and HOP graphenes have been used for imaging nanosheets.In general, SEM and TEM are employed for the characterization of MONs generating high-resolution images which display the shape of the material thus giving information about the dimensions and rigidity. SEM characterization requires prior pretreatment, usually by employing a coating on the surface with conductive material, generally gold.83a In order to eliminate this significant drawback, researchers nowadays use a field emission electron microscope (FESEM). Sometimes, the labile and non-conductive nature of MONs means that they may readily suffer electron damage and charging making the imaging quite challenging. In order to determine the underlying structure of MONs, a range of advanced electron microscopy techniques have been utilized for such additional information.
HRTEM has been widely used in order to determine the particle size, grain size, plane indices and dislocations. Furthermore, HRTEM analysis can be employed to calculate the interplanar distance of crystalline structure (fringe width) and crystalline planes that can be further deduced from the SAED (selected area electron diffraction) pattern. This technique also contributes to the MOFs analysis modified with nanoparticle (NP) incorporation as the recorded TEM provides a good insight into the size and dispersion of NPs. These microscopy techniques can also be coupled with energy dispersive X-ray analysis (EDX or EDAX) or energy dispersive spectroscopy (EDS) that is used for the quantitative or qualitative composition determination of MONs. For instance, Zhao et al. synthesized 2D Cu-MONs and decorated them with Au NPs to produce Au/Cu-MOF nanocomposites that were characterized using FESEM (Fig. 19a and b) and HRTEM (Fig. 19c and d) to study the surface morphology of developed MOFs.54 These powerful techniques help gain a proper insight to understand the nature and position of defects, functional groups and active sites that are vital to their performance in a wide range of applications.
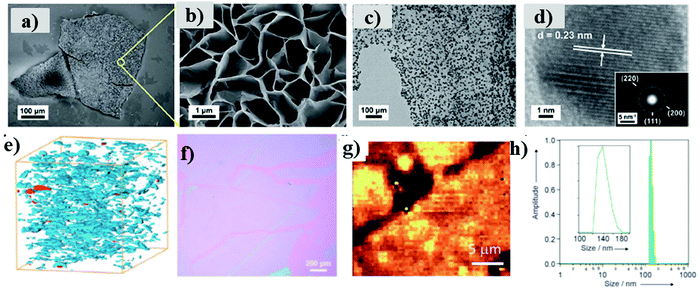 | ||
| Fig. 19 (a) FESEM image of the overview of Cu-MOF membrane (b) high-magnification FESEM image of the surface of a Cu-MOF membrane (c) TEM image of Au/Cu-MOF nanocomposites (d) HRTEM image of Au NPs on nanosheets, inset: corresponding electron diffraction pattern. Reproduced with permission from ref. 54a. Copyright 2019, Royal Society of Chemistry. (e) FIB-SEM of nanosheets dispersed in a polymer membrane. Reproduced with permission from ref. 78a. Copyright 2015, Nature Publishing Group. (f) Brewster angle optical microscopy of nanosheets formed at the liquid–gas interface using Langmuir–Blodgett method Reproduced with permission ref. 51. Copyright 2011, Wiley-VCH. (g) Raman microscopy images of MONs. Reproduced with permission from ref. 83b. Copyright 2015, the Royal Society of Chemistry. (h) DLS data showing the lateral size distribution of nanosheets in suspension. Reproduced with permission from ref. 83c. Copyright 2012, Wiley-VCH. | ||
A good resolution can also be achieved through SEM that can be quite worthwhile for characterizing the parent material layers and to get an overview of particle size distribution. For instance, Rodenas et al. used focused ion beam SEM (FIB-SEM) in order to determine the distribution of MONs within their composite membranes (Fig. 19e).78a Brewster angle microscopy can be utilized for imaging the nanosheets at interfaces shown in Fig. 19f,51 as in the case of Raman spectroscopy (Fig. 19g).83b Dynamic light scattering (DLS) has been utilized for determining the lateral size distribution of nanosheets. Rosseinsky et al. represented a narrow distribution of lateral size between 120–180 nm through DLS, consistent with those observed through AFM (Fig. 19h).83c
3.3 Macroscopic characterization
The ability of MONs to disperse in solutions makes it possible to be processed as suspensions thus making them available to interact as catalysts and sensors with molecules in a solution. The most common in situ way for 2D MON characterization is the presence of Tyndall scattering when a laser beam is allowed to pass through the sample (Fig. 20a).36d Stable suspensions have a very low concentration of material, typically less than 0.1 mg mL−1. However, several factors such as the choice of solvent, presence of surfactants and functional group incorporation can overall enhance the material concentration in a suspension.84 The concentration of material present in a suspension can be determined by measuring the material mass left after careful drying or filtration of the suspension. Otherwise, it can also be obtained from UV-vis data by plotting a calibration curve using samples of known concentration.84 Moorthy et al. compared the degree of exfoliation attained in various solvents by using fluorescence spectroscopy resulting from emission quenching due to layers stacking or aggregation (Fig. 20b).44 Elder et al. utilized temperature-programmed desorption (TPD) for investigating the surface interactions of ethanol and water molecules with Cu–BDC nanosheets and also studied the kinetic parameters for desorption from the pore, edge and external surface sites.85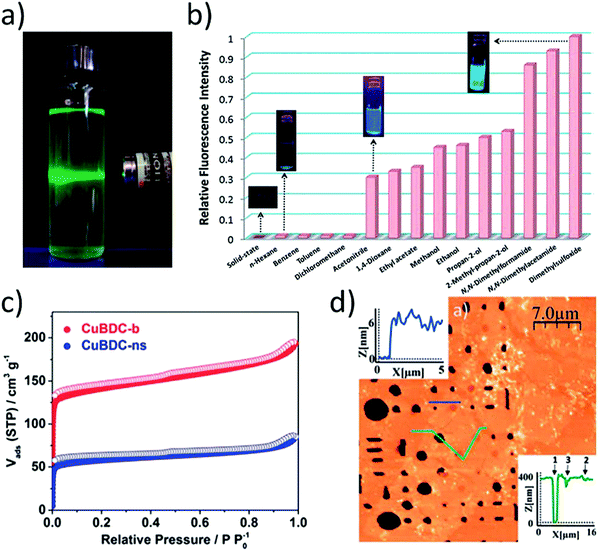 | ||
| Fig. 20 (a) Photo showing typical Tyndall scattering resulting from a suspension of MONs. Reproduced with permission from ref. 36d. Copyright 2012, American Chemical Society (b) Fluorescence emission profiles (λex = 330 nm) of Cd MONs in different solvents. Reproduced with permission from ref. 44. Copyright 2017, the Royal Society of Chemistry. (c) Gas adsorption isotherm comparing N2 uptake for Cu(BDC) bulk MOF (red) and MONs (blue). Reproduced with permission from ref. 87. Copyright 2017, Elsevier (d) AFM topographic image of Cu-based nanosheets suspended over micron-sized wells (400 nm depth) within a-Si/SiO2 substrate. Reproduced with permission from ref. 83b. Copyright 2015, the Royal Society of Chemistry. | ||
Similar to MOFs, most of the applications of MONs rely on the porous structure and high surface area in the solid-state. Gas adsorption measurements have been utilized for the characterization of accessible volumes present in MONs (Fig. 20c).86,87 It is used for the determination of textural parameters like surface area, average pore size, pore volume and pore size distribution. This technique is based on the study of N2 adsorption (at the boiling temperature of liquid nitrogen) over the solid surface that results in an adsorption isotherm. According to the International Union of Pure and Applied Chemistry (IUPAC), there are six categories of physisorption isotherms (Type I–Type VI, Fig. 18a).88 Type I corresponds to the physisorption of non-polar gases (N2 and Ar) on nanoporous, microporous, or macroporous solids. Type II and III isotherm refers to the macro porous samples, while Type IV and V isotherms indicate mesopores in the sample. In case, if there is no hysteresis loop in the reversible adsorption–desorption of N2 gas then that relates to the presence of mesopores (≥4 nm) in the sample and corresponds to Type IV (b) isotherm. On the other hand, Type VI isotherm represents a homogeneous nonporous solid surface.
Generally, MOFs are solids characterized with porosity and the presence of high surface area (>2000 m2 g−1) and most of them fall under microporous Type I isotherm. For the calculation of surface area of MOFs, the most commonly used approach is Brunauer–Emmett–Teller (BET) method,89 that allows their comparison with other porous materials. The presence of micropores is studied with the aid of the t-plot method, which compares the adsorption isotherm data of a nonporous sample to that of porous materials.90 The BET surface area of the nanosheets is generally found to be lower than that of the parent porous material, which is due to the inefficient packing of small crystallites,87 while other properties like permeability may be enhanced up to a significant extent.
In addition to the above-discussed characterization parameters, a better understanding of the mechanical properties of MONs is also necessary for the optimization of their applications in membranes for gas separation and in composite formation. Cheetham et al. compared the mechanical properties of different faces of bulk layered MOF using a spherical-tip diamond indentor.36d They also measured the critical resolved shear stress to be relatively small (≤0.4 GPa), which is needed for the micromechanical delamination of individual layers. AFM was also utilized for nanoindentation experiments of nanosheets situated over different diameter wells. For instance, Zamora et al. calculated the breaking strength and Young's modulus of their frameworks as 0.12 N m−1 and 5 GPa (Fig. 20d).83b These mentioned values were found to be 150 and 200 times lower as compared to values for pristine graphene, however, the MONs were strong enough to be suspended as free-standing sheets over micron-sized holes.
The assessment of the aqueous stability of MOFs is significantly important. In general, MOFs must possess stability in aqueous solutions in order to achieve practical application in fields such as water purification. The water stability of 2D MONs is quite similar to that of bulk MOFs. The water stability of bulk MOF, as well as 2D MONs, can be determined by simply immersing the material in an aqueous solution of known pH. After a definite time duration, MOF is filtered, washed and dried and the stability yield could be assessed by the comparison of the mass recovered with respect to the initial mass.91 Though, this process of comparison greatly needs control of the structure and porosity and measuring N2 adsorption isotherm and XRD before and after aqueous testing. Another most common approach for estimating the aqueous stability is to analyze the water adsorption isotherms by applying partial pressure of water vapor into the MOF under vacuum.92 As discussed in the earlier section that most of the MOFs fall under the category of microporous materials, following the Type-I adsorption isotherm. Hence, the shape of the respective adsorption isotherm gives great information about the strength and type of interaction between water molecules and MOF surfaces. This water adsorption isotherm analysis must be supported by XRD characterization to get a detailed insight into the changes if any. Most MOFs show water adsorption isotherms similar to the previously reported isotherms of porous materials, still several MOFs are available that show fascinating adsorption behavior due to the flexibility in their framework. For instance, MIL-53 water adsorption behavior displays a reversible structure transition from the large pore form to the narrow pore form, resulting in large pore volume reduction. Overall, for applications in which MOFs must be used in an aqueous phase, it is always recommended to assess the MOF stability in water by simply immersing them and stirring in certain aqueous conditions, which is followed by XRD, BET, and mass loss evaluation after the filtration of the sample.
4. Applications of 2D MONs
2D MONs exhibit interesting nano effects and there exists plenty of unsaturated active sites rendering them highly reactive or show activity, known as the surface effect. Due to the planar structure of MONs, there is a presence of a proper conjugation system that allows electron delivery on the nanosheets. Due to the 2D structure, these MONs possess interesting chemical and physical properties and an ample range of applications.93 The adjustable structural features and functions of MONs facilitate resourceful compositional framework and properties by varying the organic linkers and metal nodes, thus proving advantageous towards specific applications. Until now, 2D MONs proved to be a great milestone in a range of applications, including sensing, catalysis, gas separation, energy storage and conversion, biomedicine and much more. In the present segment, applications of 2D MONs will be briefly discussed along with some examples (Table 3).| MON | Ligand | Metal | Application | Ref. |
|---|---|---|---|---|
| UPC-28 | Pentiptycene based | Mg | Sensing (Ba2+) | 126 |
| Dye adsorption | ||||
| Cu–TCPP | Tetrakis(4-carboxyphenyl)porphyrin TCPP | Cu | Sensing (dopamine) | 97 |
| [CdL(μ-1,3-SCN)2]n | 2-(2-(Ethylmamino)ethyliminomethyl)-6-ethoxyphenol (HL) | Cd | Photosensitive devices | 110 |
| Ni3(HITP)2 | 2,3,6,7,10,11-Hexaaminotriphenylene (HITP) | Ni | Gas separation | 103 |
| NMOF | 5-(4-Pyridyl)-methoxyl isophthalic acid [5,4-PMIA] and tetrakis(4-pyridyloxymethylene) methane [TPOM] | Ni | Catalysis | 116 |
| [Cd2(5-NO2-BDC)2L(MeOH)]·2MeOH (MOF-Calix) | 5-Nitro-1,3-benzenecarboxylic acid (5-NO2-H2BDC) | Cd | Fluorescence detector | 144 |
| 25,26,27,28-tetra-[(4-pyridylmethyl)oxy]calyx[4]arene (L) | ||||
| M-TCPP | Tetrakis(4-carboxyphenyl)porphyrin (TCPP) | Zn, Cu, Cd, Co | Fluorescence detector (DNA) | 55 |
| Zr–BDC | 1,4-Benzenedicarboxylic acid (H2BDC) | Zr | Catalysis | 56 |
| Cu–BDC | 1,4-Benzenedicarboxylic acid (H2BDC) | Cu | Catalysis | 117 |
| Ni-MOF@NiS2@C (NMSC) | 1,4-Benzenedicarboxylic acid (H2BDC) | Ni | Energy storage | 140 and 145 |
| MIL-53(Al)-FA | Sodium meta-aluminate (NaAlO2) | Al | Iodine adsorption | 141 and 146 |
| Fumaric acid (FA) | ||||
| ZIF-67 | Sodium hypophosphite (NaH2PO2) | Co | Energy conversion | 142 and 147 |
| 2-Methylimidazole (MI) | Ni | |||
| [Cu2(ndc)2(dabco)]n | 1,4-Naphthalenedicarboxylic acid | Cu | CO2 sorption | 143 and 148 |
| [Cu2(nbdc)2(dabco)]n | 2-Nitro-1,4-benzenedicarboxylic acid | |||
| [Cu2(abdc)2(dabco)]n | 2-Amino-1,4-benzenedicarboxylic acid | |||
| [Ni(C4O4)(H2O)2]n | Squaric acid (H2C4O4) | Ni | Energy storage/conversion | 90 and 149 |
| [Cu3(TTPB)2(H2O)6]·5DMF | 1,3,5-Tri(4-(2H-tetrazol-5-yl)phenoxy)benzene (H3TTPB) | Cu | Nitroaromatic explosive sensing | 144 and 150 |
| [Cd3(TTPB)2(H2O)6]·6DMF | Cd | |||
| NiCo–BDC | 1,4-Benzenedicarboxylic acid (H2BDC) | Ni | Energy storage | 109 |
| Co | ||||
| Cu(II)-5N3IP | 5-Azidoisophthalic acid (H25N3IP) | Cu | Dye adsorption | 127 |
| Catalysis | ||||
| M-TCPP | Tetrakis(4-carboxyphenyl)porphyrin (TCPP) | Cu | Catalysis | 151 |
| Zn | ||||
| RuMOFNS | Tris(4,4′-dicarboxylic acid-2,2′-bipyridyl) ruthenium(II) chloride (Ru(dcbpy)32+) | Zn | Immunosensor | 152 |
| Zn(bim)(OAc) | Benzimidazole (bim) | Zn | Energy storage | 153 |
| Ni-MOF | p-Benzenedicarboxylic acid (PTA) | Ni | Sensing | 154 |
| MOF-5 | 1,4-Benzenedicarboxylic acid (H2BDC) | Zn | Catalysis | 155 |
4.1 Sensing
Due to the 2D characteristics and structural miscellany, 2D MONs can exhibit great potential for sensing applications. The escalating demand for extremely responsive and selective sensors has stimulated the growth of a wide variety of novel functional nanomaterials.94 Until now, 2D MONs have been utilized for sensing systems, such as electrochemical sensors and optical sensors. Due to distinct 2D structural features and high specific areas, 2D MONs typically find applications as fluorescence sensors for the detection of different analytes, such as adenosine,48b microRNA,48c and DNA.55 Zhao et al. reported a 2D MON-based fluorescent sensing platform for the recognition of DNA.55 Experiments have revealed the excellent quenching ability of 2D MONs usually comes from their 2D structures. The detection limit was found to be 20 × 10−12 M for DNA sensing that is found to be lesser in comparison to previously reported MOF-based fluorescent assays and quite analogous to other 2D nanomaterials. It is noteworthy to mention that the developed fluorescent sensor of 2D Cu-TCPP nanosheet could concomitantly achieve multiple DNA detection.Ghosh et al. fabricated highly luminescent 2D MOF [Zn1.5(L)(H2O)]·1.5benzene (1) consisting of π-stacked cylindrical arrangement in a backbone for the rapid and reversible solid-state detection of both aliphatic and aromatic nitro-explosives by using fluorescence quenching mechanism.95 The plausible mechanism for the nitro-explosives detection could be explained on the basis of interaction of super π electron-rich supramolecular 2D sheets or π–π stacked 1D packing of ligands (leading to a “supramolecular wire effect”) with the electron-deficient nitrobenzene as shown in Fig. 21b. The highest quenching effect can be seen in the case of NB (86%) (Fig. 21a) in comparison to electron-deficient smaller aliphatic NM (75%), although NM can enter inside the pores of MOF, but NB cannot. Other nitro-explosives, such as 2,4-DNT and 2,6-DNT displayed appreciable quenching effects (53% and 46%, respectively) owing to their low vapor pressure and bulky molecular sizes. Despite the bulkier size of these compounds, they are capable to form strong π-interactions on the π-stacked framework backbone surface. In addition, DMNB (aliphatic nitro-explosive) also displayed remarkable quenching (57%) even though it is devoid of the electron-deficient aromatic ring as shown in Fig. 21c. In this case, orbital overlapping of super electron-rich MOFs over electron-deficient DMNB nitro groups could be the sole reason for quenching, involving the n–π* charge transfer from MOF to DMNB. The comparative quenching efficiency of different nitro-explosives is presented in Fig. 21d.
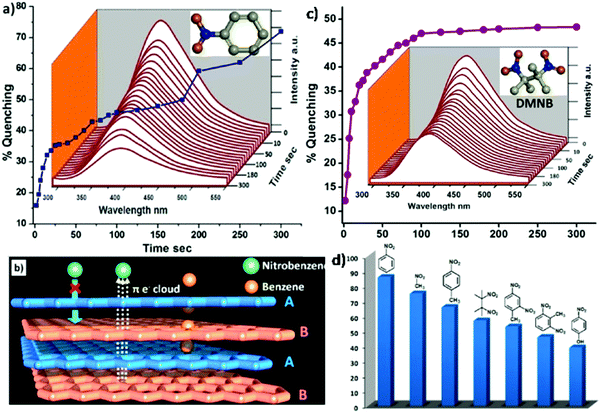 | ||
| Fig. 21 (a) A quenching profile of 1′ by NB. (b) Supra-molecular wire effect showing a flow of π-electrons from sheet to sheet, and the plausible diffusion of benzene and the surface interaction of nitrobenzene molecules in 1′ (c) A quenching profile of 1′ by DMNB. (d) Descending sequential quenching effects of NB, NM, NT, DMNB, 2,4-DNT, 2,6-DNT, and NP on the luminescence of 1′ in 10 min. Reproduced with permission from ref. 95. Copyright 2013, the American Chemical Society. | ||
Besides fluorescent sensors, 2D MONs could also be fabricated for the application as electrochemical sensors due to their extremely low thickness and exceptional adsorption affinity. By carefully examining structural tenability and flexibility, electrochemically active 2D MONs could be fabricated by the use of catalytically active organic ligands/metal ions as building units. Zhang et al. designed 2D M–TCPP(Fe) nanosheets [M = Cu, Co, and Zn] that serve as an electrochemical sensor for H2O2 detection.96 Firstly, multilayer films of M–TCPP(Fe) nanosheets were prepared via the Langmuir–Schafer method by transferring the 2D MOF suspension on the top of a glass carbon electrode (Fig. 22a). It was observed that 2D Co–TCPP(Fe) nanosheets exhibited exceptional electrocatalytic activity for H2O2 reduction and quantitative detection of H2O2 with 0.4–50 μM linear range and 0.15 μM detection limit (Fig. 22b and c).
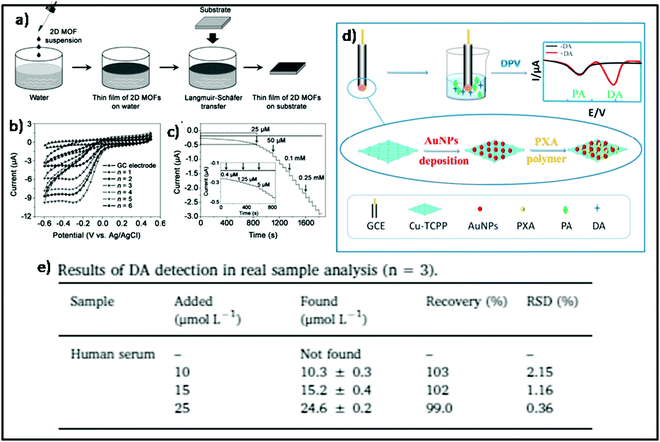 | ||
| Fig. 22 (a) Schematic illustration of the assembly of 2D MOF film. (b) Cyclic voltammograms of the bare GCE and GCE/(Co–TCPP(Fe))n (n = 1–6) in the presence of H2O2. (c) Typical amperometric responses of H2O2 at bare GCE and GCE/Co–TCPP(Fe)5. Reproduced with permission from ref. 96. Copyright 2016, Wiley-VCH. (d) Schematic illustration of the preparation process of the ratiometric electrochemical sensor for DA detection. (e) Results of DA detection in real sample analysis. Reproduced with permission from ref. 97. Copyright 2019, Elsevier. | ||
Jie et al. fabricated novel Cu-MONs to develop a responsive and proficient electrochemical ratiometric sensor for dopamine (DA) detection, a small biological molecule playing a vital function as neuromodulators and neurotransmitters in the brain.97 The synthesized Cu-MOFs were amalgamated with gold nanoparticles (NPs) and poly-xanthurenic acid (pXA) by a simple electrochemical method on the electrode (Fig. 22d), in order to develop an outstanding electrocatalyst for the electrochemical detection of DA in the 5–125 μM range and 1.0 μM detection limit. The potential application of the proposed sensor was assessed by the detection of DA in human serum that revealed a recovery rate from 99% to 103% (as shown in Fig. 22e) that indicated successful detection of DA in the real sample.
4.2 Gas separation
For the applications in fields of clean energy and environmental sustainability, gas separation plays a critically important role.98,99 Natural gas contains a considerable quantity of acidic gases such as CO2 and H2S that need to be eliminated so as to enhance the heating value and thus preventing corrosion of the pipeline.100 For example, H2/CO2 separation plays a key role in precombustion CO2 capture and H2 purification in power plants.101 In comparison to traditional gas separation techniques, viz., amine scrubbing, membrane-based gas separation imparts high energy efficiency, ease of operation and better scalability.102Emerging as a new category of 2D nanomaterials, 2D MONs served as favorable and promising candidates for highly selective and ultra-permeable membranes. 2D MON-based membranes have been anticipated to realize high permeability (productivity) and high selectivity (efficiency), owing to the nanometric thickness and distinct structure of pore structures that can distinguish small gas molecules of different shapes and sizes.34 For instance, Yang et al. fabricated 2D MON-based ultrathin molecular sieve membranes for the separation of H2/CO2.34 Monolayered Zn2(bim)4 nanosheets were cast into membranes with several nanometer thicknesses by hot-dropping the MON colloid onto porous ceramic (α-Al2O3) substrates. The developed membranes displayed outstanding size selectivity (>200) for H2/CO2 and high H2 permeance of up to 3760 gas permeation units (GPUs), due to the ultrathin nature and small pore orifice (0.21 nm) of Zn2(bim)3(OH) nanosheets as shown in Fig. 23b.
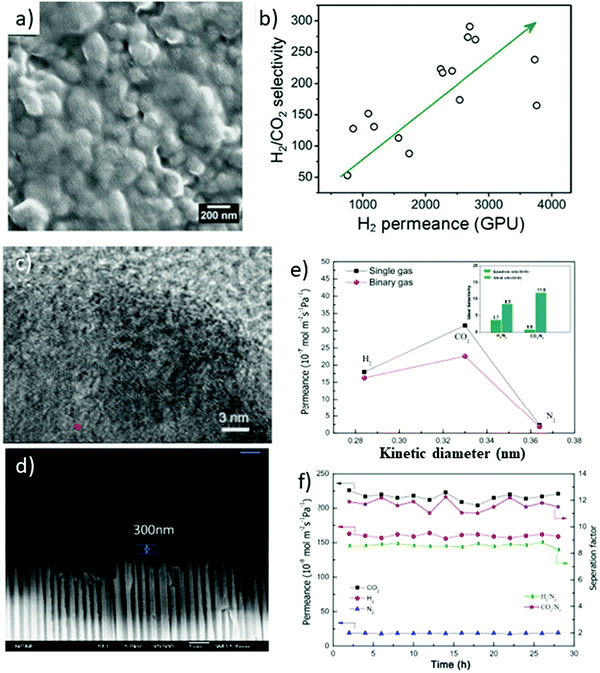 | ||
| Fig. 23 (a) SEM image of a Zn2(bim)4 nanosheet layer on α-Al2O3 support. (b) An anomalous relationship between selectivity and permeance was measured from 15 Zn2(bim)4 membranes. Reproduced with permission from ref. 34. Copyright 2014, American Association for the Advancement of Science. (c) TEM image of Ni3(HITP)2 nanosheets (d) cross-sectional view of Ni3(HITP)2 membranes on AAO support (e) single and binary gas permeances through the Ni3(HITP)2 membrane measured at 298 K and 1.2 bar (f) stability of the Ni3(HITP)2 membrane for the separation of an equimolar H2/N2, CO2/N2 mixture at 298 K and 1.2 bar. Reproduced with permission from ref. 103. Copyright 2020, Wiley-VCH. | ||
Recently, Zhu et al. reported the development of Ni3(HITP)2 (HITP = 2,3,6,7,10,11-hexaaminotriphenylene) nanosheets by adopting a soft physical method and fabricated the gas separation membranes by utilizing these nanosheets supported on anodized aluminium oxide (AAO) by adopting a filtration method.103 Gas permeation results revealed high permeance and selectivity for CO2 over N2 and H2 over N2. The CO2 permeance was found to be 3.15 × 10⁻⁶ mol m−2 s−1 Pa−1 (Fig. 23e). The separation factors for CO2/N2 and H2/N2 (Fig. 23f) from single gas permeance were found to be 13.6 and 7.8, respectively. The fabricated membranes displayed enhanced stability, reproducibility and durability that are of great interest in the field of CO2 separation.
Lennox et al. demonstrated the CO2/CH4 separation in both defective and defect-free 2D CuBDC nanosheets and compared their performances with the bulk CuBDC MOF.104 Studies revealed that the separation mechanism is basically a pore-blocking effect. Most of the adsorption sites were occupied by CO2 molecules that can show strong interaction with the framework atoms and thus possess a lower velocity through MON, hence limiting the CH4 molecule permeability through the nanosheet. The performance of nanosheet for the separation of CO2 and CH4 as compared to bulk MOFs might be attributable to the surface effect and mass transfer resistance causing the agglomeration of methane molecules on the pore window of MON. It was also observed that the presence of defects has a great impact on the selectivity of the nanosheets. Missing of just 10% linkers results in the formation of nonselective MONs, whereas in the case of 20% concentration MONs becomes selective towards methane. These results indicated that the synthesis process should be done with utmost care in order to limit the missing linkers as much as is humanly possible, such that, CuBDC can be used successfully for the separation of light gas.
4.3 Energy conversion and storage
Due to the ordered nature of the porous framework, ultrathin thickness, and profusely available metal sites, it makes MONs as an ultimate choice for applications in the field of energy storage or conversions.105,106 The exposed metal sites in the case of 2D MONs make them feasible catalysts for a broad range of energy conversion applications such as carbon dioxide reduction reaction (CO2RR), oxygen reduction reaction (ORR), oxygen evolution reaction (OER), and hydrogen evolution reaction (HER). Marinescu et al. reported the application of 2D MONs in HER.107 In this work, BHT-based 2D MONs were integrated with cobalt dithiolene species by employing liquid–liquid interfacial synthesis. These synthesized 2D MONs could be employed as electrocatalysts for HER in an aqueous electrolyte and displayed a current density of up to 41 mA cm−2 at −0.8 V. 2D MONs also find application as OER catalysts. Zhang et al. fabricated ultrathin FeCo 2D-MONs by an electrochemical/chemical exfoliation method that displayed gleaming performance in OER with 211 mV overpotential at 10 mA cm−2 current density that is comparatively lower than of its bulk counterpart.108Apart from these applications, 2D MONs has also been employed for energy storage purpose. Li et al. fabricated ultrathin bimetallic NiCo-MON (4.69 nm thickness) via a hydrothermal method.109 The results revealed exceptional electrochemical performance with 1945.83 and 1700.40 F g−1 specific capacitance at 0.5 and 1 A g−1 current densities, respectively, with good stability (Fig. 24a and b). The superior electrochemical performance might be attributed to ultrathin thickness, which in turn offers rich metal sites and great electrochemical surface area for redox reactions. The enhanced performance can also be related to increased charge transfer during the electrochemical process due to the strong coupling between Ni and Co species causing the high oxidation state of Ni2+ and hence improved pseudocapacitance reactivity.
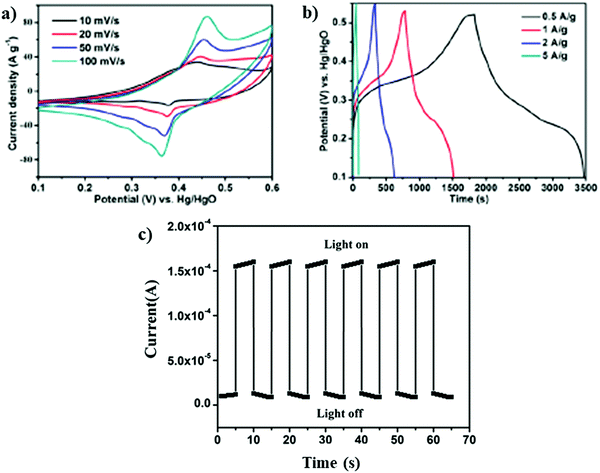 | ||
| Fig. 24 (a) CV curves and (b) GCD curves of NiCo–BDC nanosheets. Reproduced with permission from ref. 109. Copyright 2019, the American Chemical Society. (c) Current vs. time plot when the light was turned on or off. Reproduced with permission from ref. 110. Copyright 2015, Royal Society of Chemistry. | ||
Chattopadhyay et al. synthesized novel thiocyanate bridged 2D MON, [CdL(μ-1,3-SCN)2]n; HL = 2-(2-(ethylamino)ethyliminomethyl)-6-ethoxyphenol, and demonstrated the photosensitive nature of developed semiconducting MOF with remarkably high on–off ratio (Fig. 24c).110 It was observed that the synthesized 2D MON exhibited good sensitivity to the switched on/off light source which means that photocurrent can be switched repeatedly, multiple times, without deteriorating the on/off ratio and thus it finds applications in photo-switch nanodevices. This interesting behavior might be correlated to the twofold donor–acceptor properties of organic–inorganic hybrid material. The organic ligand upon the photo-excitation acts as an electron donor, whereas the inorganic CdSCN part acts as an electron acceptor.111
4.4 Catalysis
2D MONs combining the lateral dimensions and thickness in the nanometer range hold rich accessible sites on the surface that is likely to show great performance in the field of heterogeneous catalytic systems.112,113 The existence of abundantly available active sites on the surface of 2D MONs offers efficient interactions between the substrate and active sites as compared to the interactions occurring in confined pores of 3D frameworks.32,114 Therefore, 2D MONs generally show outstanding performances in various catalysis reactions. For instance, Morsali et al. synthesized 2D MOF (TMU-58), [Zn (L1)(oba)] based on carbohydrazide moiety (L1), an effective heterogenous H-bond donor catalyst, for the effective and enhanced catalytic activity in the methanolysis of epoxides.115 In order to achieve a high-efficiency catalytic system, carbohydrazide moiety was selected in the fabrication of MOF. Due to the stronger acidic hydrogen in carbohydrazide, as compared to that in urea, it is capable to form effectual host–guest interactions with various substrates. In addition, carbohydrazide moiety-based 2D structure offers more accessible active sites for efficient catalytic reactions. The 2D heterogenous H-bond catalyst, TMU-58, with strong acidic Lewis sites was found to be more efficient in comparison to the 3D MOF organocatalyst based on urea for the methanolysis of styrene epoxide (Fig. 25a) and other bulky epoxides.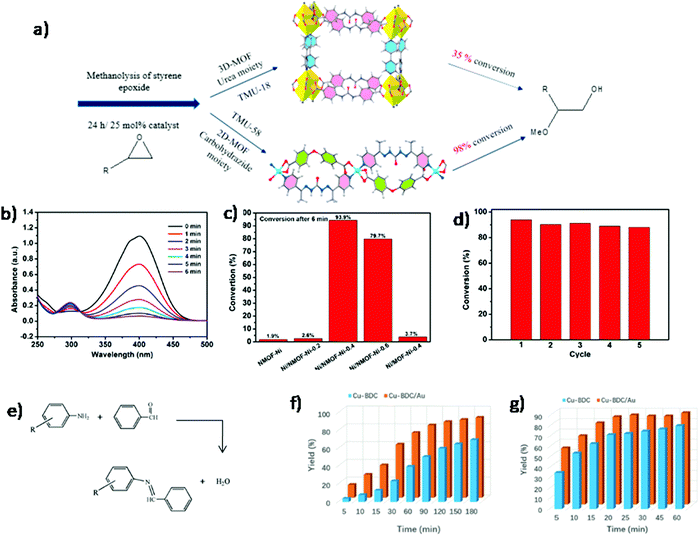 | ||
| Fig. 25 (a) Comparison of catalytic activity of 3D-MOF and 2D-MOF in methanolysis of styrene epoxide. Reproduced with permission from ref. 115. Copyright 2019, the American Chemical Society. (b) Time-dependent UV-visible absorption spectra for catalytic reduction of 4-NP by Ni/NMOF-Ni-0.4 (c) catalytic performance of various catalysts evaluated by 4-NP conversion within 6 min (d) stability tests of Ni/NMOF-Ni-0.4 over five cycles. Reproduced with permission from ref. 116. Copyright 2020, the American Chemical Society. (e) The condensation reaction between benzaldehyde and aromatic amines (R = H for aniline and R = SH for 4-aminothiophenol). Results of an experiment with condensation between benzaldehyde and (f) aniline (g) 4-aminothiphenol over pristine Cu–BDC and Cu–BDC/Au catalysts. Reproduced with permission from ref. 117. Copyright 2019, Wiley-VCH. | ||
Recently, Wen et al. fabricated MONs incorporated with ultrasmall and homogeneous non-noble metal nanoparticles (Ni NPs) within NMOF-Ni, where Ni(II) metal ion nodes get partly self-reduced to metallic Ni(0) atoms in the presence of aqueous NaBH4 reducing agent under ambient conditions.116 These as-formed Ni/NMOF-Ni-0.4 played the role of an ideal catalyst in the catalytic reduction of 4-nitrophenol (4-NP) with great efficiency and selectivity and better recyclability (Fig. 25d). The high catalytic efficiency might be attributed to ultrasmall and monodisperse Ni NPs as well as 2D MON carriers. The progress of the reaction was monitored by means of UV-vis spectroscopy (Fig. 25b) and it was observed that the absorption peak of 4-NP decreased within 6 min (Fig. 25c). In addition to this, neither NMOF-Ni nor Ni/NMOF-Ni-0.2 displayed no appreciable catalytic activity due to the scarcity of active Ni NPs.
Zhan et al. fabricated 2D Cu–BDC nanosheets by adopting facile and benign methodology through the use of Cu2O nanocubes as the metal ion source and 1,4-benzenedicarboxylic acid as an organic linker.117 Cu2O nanocubes serving as metal ion sources slowly release Cu+ ions that are further oxidized by dissolved oxygen and serve in the formation of 2D frameworks. The as-synthesized Cu–BDC nanosheets with ultrathin thickness, oriented growth and superb crystallinity can be utilized as a platform for designing 2D-integrated nanocatalysts by using various metal nanocrystals (Au, Ag, Pt and Ru) with 3-mercaptopropionic acid as a molecular link. The developed Cu–BDC/M composites with rich accessible active sites on its surface displayed enhanced catalytic activity (due to the synergistic effect of two components) in several condensation reactions between benzaldehyde and primary amines (Fig. 25e). As shown in Fig. 25(f and g), Cu–BDC/Au profoundly increased the reaction rate in comparison to pristine Cu–BDC nanosheets as catalysts in the case of both the amines (aniline and 4-aminothiophenol) used as substrates. It is noteworthy to mention that the reaction rate was comparatively higher in the case of 4-aminothiophenol due to the presence of electron-donating para substituents (–SH) on aniline as reported earlier.118
It is well known that the combination of two different components with varying catalytic activities has proven to be an effective means for the development of multi-functional catalysis for cascade reactions.119 Zhang et al. fabricated 2D MONs, Cu–TCPP(M) [M = Co, Fe] for the growth of Au nanoparticles in order to synthesize multifunctional catalysts for cascade reactions.120 Metalloporphyrinic MONs, Cu–TCPP(M) exhibit peroxidase-like activity and Au NPs referred to as glucose oxidase (GOx) mimics. Hence, Au NPs/Cu–TCPP(M) hybrid nanosheets catalyze glucose oxidation reaction in the presence of O2 to give gluconic acid and H2O2. This in situ generated H2O2 can be utilized in the second step for the oxidation of 3,3′,5,5′-tetramethylbenzidine (TMB) to give the oxidized TMB (oxTMB).
4.5 Biomedicine
Due to features such as large surface area, high porosity, biodegradability and surface functionality, 2D MONs perform the role of nanocarriers for chemotherapeutics, nucleic acid, and drug delivery and release.121 Lin et al. outlined the application of UiO MONs in treating drug-resistant ovarian cancer cells by the successful delivery of cisplatin and pooled small interfering RNAs (siRNAs) at the site.121 The huge pores in the case of UiO MONs can be utilized for loading cisplatin, while vacant Zr sites in MONs are utilized for the binding of siRNAs via coordination bonds. The in vitro chemotherapeutic efficacy improved a lot by simultaneous delivery of cisplatin and siRNA into cancer cells. Still, this area is in its infancy stage, yet MONs shows the great ability to be used as drug delivery materials due to possible chances regarding the adjustment of a functional group on the surface of framework, tunable pore size and the introduction of drug molecules acting as linkers.Lin et al. developed GO/Fe-MOF Nanozyme Nest and explained its robust peroxidase-like catalytic activity.122 This developed Nanozyme Nest could be utilized for the quantification of woodsmoke biomarker (BPDE–DNA adduct) through the use of the ultrasensitive ELISA method. The better detection sensitivity can be attributed to the enriched Fe-MOF nanozyme and the cooperated GO. In addition to this, Nanozyme Nest combines the characteristics of classical nanozymes such as low cost, easy purification and excellent stability (Fig. 26a).
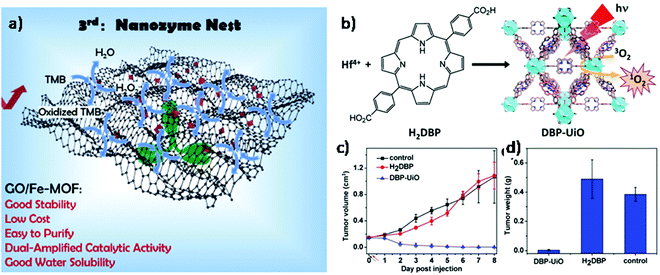 | ||
| Fig. 26 (a) The Generation of Labels for ELISA: (3rd generation) GO/Fe-MOF Nanozyme Nest. Reproduced with permission from ref. 122. Copyright 2019, the American Chemical Society. (b) Schematic illustration of the synthesis of DBP–UiO and the process of light-triggered 1O2 generation (c) tumor growth inhibition curves after PDT treatment (d) tumor weight after PDT treatment. Reproduced with permission from ref. 124. Copyright 2014, the American Chemical Society. | ||
In addition to chemotherapy, another field of photodynamic therapy (PDT) has gained considerable attention by adopting 2D hybrid MOFs as promising photosensitizers. Likewise, porphyrin, photosensitizers can be used to produce singlet oxygen from molecular oxygen in the presence of light, thus enhancing the therapeutic efficiency of PDT. Hence, loading 2D MOF with porphyrin enables the hybrid structure to effectively produce cytotoxic singlet oxygen from surrounding tissue oxygen that causes an increase in the cell temperature. Thus, enhanced apoptosis and necrosis of cells due to the photothermal conversion makes porphyrin-based 2D MONs an effective oxygen sensor in cells.123
For instance, Lin et al. synthesized DBP UiO MONs (Fig. 26b) by using porphyrin derivative, 5,15-di(p-benzoato)porphyrin (H2DBP) that could be utilized as an effectual photosensitizer to be applied for the PDT of resistant head and neck cancer.124 These developed nanosheets effectively generate singlet oxygen (1O2) under light irradiation. In vivo efficiency of PDT on tumor-bearing mice revealed that half of the tumors upon the single dosage of DBP–UiO with single light exposure were completely eradicated while the remaining half of the tumors showed volume reduction by 50 times. On the contrary, no considerable therapeutic effect was seen in the mice treated with H2DBP ligands.
4.6 Wastewater treatment
2D MONs find application in wastewater treatment owing to interesting features such as intriguing structural diversity, ionic framework, tunable pore size, ultrahigh surface area, abundant active sites and added stability that aids the selective uptake and dye removal.125 Recently, our group synthesized 2D MOFs, [M(ox)(bpy)]n [M = Cu or Co] under solvothermal conditions via a simple approach and assessed their application in wastewater treatment.125b These two MOFs were employed for adsorption of organic dyes, i.e., methyl orange (MO) and methylene blue (MB). Among the two dyes, MOFs showed selective adsorption of MB with % removal of up to 96–98% at optimum temperature and neutral pH. The plausible mechanism (Fig. 27a) for dye adsorption of MB was mainly through electrostatic, π–π and hydrogen bonding interactions between 2D sheets and the dye.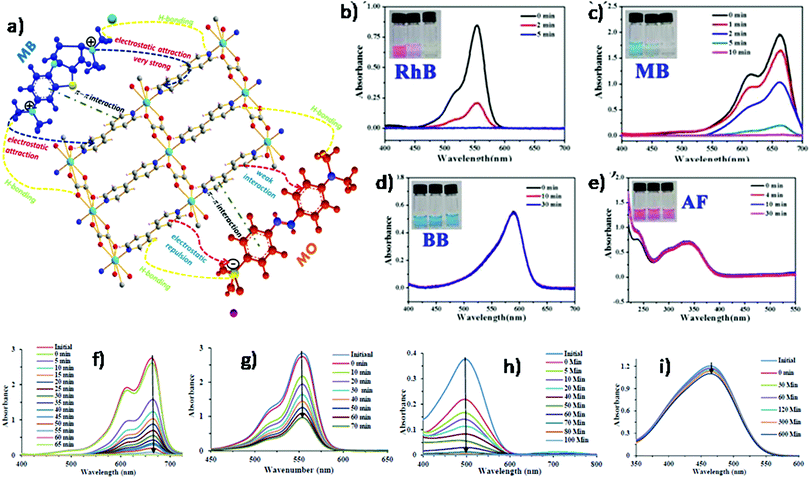 | ||
| Fig. 27 (a) The plausible mechanism of dye adsorption between cationic/anionic dyes and MOFs. Reproduced with permission from ref. 125b. Copyright 2020, Elsevier. (b) UV-vis spectra of UPC-28 dispersed in H2O treated with RhB, (c) MB, (d) BB and (e) AF. The inset photographs highlight the adsorption effects showing before (left), during (middle) and after (right) adsorption. Reproduced with permission from ref. 126. Copyright 2018, the Royal Society of Chemistry. (f) UV-vis spectra of Cu(II)-N3IP for adsorption of MB (g) RhB (h) CR (i) MO. Reproduced with permission from ref. 127. Copyright 2018, the Royal Society of Chemistry. | ||
Zhang et al. fabricated 2D porous pentiptycene-based MONs (UPC-28) for the detection of Ba2+ and adsorptive removal of organic dyes from wastewater.126 The porosity of the synthesized MOFs revealed that it falls under the microporous category with 648.9 m2 g−1 of Brunauer–Emmett–Teller (BET) surface area and 1.1 to 1.6 nm pore size distribution. The synthesized MOF, UPC-28, was assessed for dye uptake by using neutral bromophenol blue (BB), positively charged rhodamine B (RhB) and methylene blue (MB) and negatively charged acid fuschin (AF). It was observed that UPC-28 readily and effectively adsorbed RhB+ (Fig. 27b) and MB+ (Fig. 27c) within 5 and 10 minutes, respectively, with negligible uptake of neutral BB (Fig. 27d) and anionic AF (Fig. 27e). The possible mechanism for adsorption might be strong electrostatic interactions between electrically anionic framework and positively charged dyes and also the existence of weak (π–π) interactions between the framework and the dyes.
Verpoort et al. fabricated 2D MONs, Cu(II)-5N3IP under the ambient condition as well as solvothermal conditions at 85 °C and assessed their potential applications in dye adsorption and catalytic applications (aerobic oxidation and Knoevenagel condensation).127 The adsorption was studied by using two types of dyes such as cationic dyes like rhodamine B (RhB), methylene blue (MB) and anionic dye like congo red (CR) and methyl orange (MO). As shown in Fig. 27(f–i), the adsorptive removal of dye follows the order MB > CR > RhB > MO. The overall MB adsorption is much higher as compared to RhB (in spite of their similar ionic strength) due to the relative difference in the molecular sizes. In the case of MB, nearly 50% adsorption takes place within the first 10 min and continues to completion in around one hour. The fast adsorption rate of MOF could be attributed to electronic interactions between dye molecules and the azide functional group along with hydrogen bonding and weak π–π interactions between the aromatic rings of MOF and dyes.
Hou et al. developed ultrathin 2D MONs, PCN-134-2D and Zr-BTB-H4TBAPy, possessing large surface area, high water stability and show selective adsorption towards cationic dyes, RhB and MB from their aqueous solution with 100% removal within a time period of 10 min.128 The excellent adsorption could be ascertained to their ultrathin and porous behavior, bounteous exposed active sites on the surface and effectual electrostatic interactions between adsorbents and cationic dyes. Along with this, 2D MONs revealed excellent recyclability and reusability that makes 2D MONs potentially pertinent for selective and rapid cationic dye adsorption and separation.
5. Conclusion and future perspectives
In a nutshell, we have summarized the synthesis strategies that are widely adopted in the synthesis of 2D MONs, viz., top-down and bottom-up methods. As already discussed, one of the most widely used top-down methods is sonication-exfoliation that is used for the successful preparation of 2D MONs. However, some other top-down synthesis approaches, viz., freeze–thaw exfoliation, mechanical exfoliation, chemical assisted approach, and chemical exfoliation, have also been much explored for the synthesis of 2D MONs. Though a myriad of potential advancement has been achieved in the field of 2D MONs by applying top-down strategies, still some challenges need to be resolved. For instance, the yield of the 2D MONs, which is commonly quite low, could be improved by the combination of two different approaches (intercalation and chemical exfoliation) up to 57%.48a Besides this, stabilization of the exfoliated MONs is another challenge of the top-down method which could be overcome by the use of solvents with surface energy comparable to exfoliated MONs or by adding stabilizers so as to lower the high surface energy of exfoliated MONs, and much more. In comparison to top-down methods, the direct synthesis of MONs including non-layered MONs could be attained by bottom-up methods. Various methods from the bottom-up approach, such as surfactant-assisted synthesis, interfacial synthesis, modulated synthesis, and sonication, have been introduced by researchers worldwide. Single or few-layer MONs could be synthesized efficiently in a solution phase by liquid/air interfacial synthesis. The preparation of MONs under ambient conditions could be done by three-layer synthesis and sonication synthesis. Modulated synthesis and surfactant-assisted synthesis are the best-suited approaches in cases where synthesis temperature is high. In spite of all these achievements, there still remain some limits for specific synthesis methods. In the case of the surfactant-assisted approach, ultrathin, stable and uniform 2D MONs can be synthesized due to the protective nature of surfactants. However, surfactants attached to the MON surface can sometimes lead to the blocking of some active sites, which is not found to be appreciably good for sensing and catalysis applications. Interfacial synthesis is quite promising for the preparation of large-sized single and few-layered MOF nanosheets, however, the crystallinity of these MONs is somewhat lost, as depicted by the weak diffraction spots and XRD patterns.156The aim of the present review was also to summarize some basic characterization techniques that are used to analyze 2D MONs. However, new characterization methodologies should be explored in order to further elucidate the fine structure of these nanosheets. With glooming research awareness in 2D MONs, their applications are widening day by day especially in the field of sensing, catalysis, energy storage due to the large surface area, available active sites, permanent porosity and appreciable dispersibility of 2D MONs. However, some other promising applications still need to be explored such as optoelectronic devices, drug delivery and photodynamic therapy. It is also clear from the literature that examples of semiconductive MON-based devices and wastewater treatment are rare. The synthesis of high-quality conductive and semi-conductive MONs can open new prospects for their successful application in the device and energy fields. In addition to this, another promising strategy is the combination of 2D MOF with other 2D nanomaterials to prepare functional composites for varied potential applications.
Overall, the sole objective of this review article was to provide material science researchers (particularly young investigators) appropriate knowledge about the 2D MONs, their synthetic strategies with instrumental techniques and a broad range of applications in various fields.
Conflicts of interest
There are no conflicts to declare.Acknowledgements
Authors acknowledge UGC-DRS (SAP-II) and FIST programs, Department of Chemistry, Aligarh Muslim University, Aligarh, India for providing necessary research facilities. S. K. acknowledges the Council of Scientific and Industrial Research, New Delhi for granting Research Associateship [CSIR-RA, File No.#09/112(0665)/2020-EMR-I].References
- J. Choi, J. Park, M. Park, D. Moon and M. S. Lah, Eur. J. Inorg. Chem., 2008, 5465–5470 CrossRef CAS.
- Y.-X. Xie, W.-N. Zhao, G.-C. Li, P.-F. Liu and L. Han, Inorg. Chem., 2016, 55, 549–551 CrossRef CAS PubMed.
- L. Pan, G. Liu, H. Li, S. Meng, L. Han, J. Shang, B. Chen, A. E. Platero-Prats, W. Lu and X. Zou, J. Am. Chem. Soc., 2014, 136, 17477–17483 CrossRef CAS PubMed.
- Y. Zhang, T. Cheng, Y. Wang, W. Lai, H. Pang and W. Huang, Adv. Mater., 2016, 28, 5241 CrossRef PubMed.
- (a) Y. Li, B. Zou, A. Xiao and H. Zhang, Chin. J. Chem., 2017, 35, 1501–1511 CrossRef CAS; (b) H.-M. Wen, C. Liao, L. Li, A. Alsalme, Z. Alothman, R. Krishna, H. Wu, W. Zhou, J. Hu and B. Chen, J. Mater. Chem. A, 2019, 7, 3128–3134 RSC.
- (a) Y. Chen, X. Huang, S. Zhang, S. Li, S. Cao, X. Pei, J. Zhou, X. Feng and B. Wang, J. Am. Chem. Soc., 2016, 138, 10810–10813 CrossRef CAS PubMed; (b) Y. Xie, Z. Yu, X. Huang, Z. Wang, L. Niu, M. Teng and J. Li, Chem. – Eur. J., 2007, 13, 9399–9405 CrossRef CAS PubMed.
- Y. Yan, C. Li, Y. Wu, J. Gao and Q. Zhang, J. Mater. Chem. A, 2020, 8, 15245–15270 RSC.
- (a) C. Li, K. Wang, J. Li and Q. Zhang, Nanoscale, 2020, 12, 7870–7874 RSC; (b) K. Wang, R. Bi, M. Huang, B. Lv, H. Wang, C. Li, H. Wu and Q. Zhang, Inorg. Chem., 2020, 59, 6808–6814 CrossRef CAS PubMed.
- (a) H. Furukawa, K. E. Cordova, M. O’Keeffe and O. M. Yaghi, Science, 2013, 341, 1–12 CrossRef PubMed; (b) H. Wang, Q.-L. Zhu, R. Zou and Q. Xu, Chem, 2017, 2, 52–80 CrossRef CAS.
- (a) F. A. A. Paz, J. Klinowski, S. M. F. Vilela, J. P. C. Tome, J. A. S. Cavaleiro and J. Rocha, Chem. Soc. Rev., 2012, 41, 1088–1110 RSC; (b) S.-T. Zheng, T. Wu, C. Chou, A. Fuhr, P. Feng and X. Bu, J. Am. Chem. Soc., 2012, 134, 4517–4520 CrossRef CAS PubMed; (c) C.-P. Li and M. Du, Chem. Commun., 2011, 47, 5958–5972 RSC; (d) Y. Liu, M. J. W. Tan, F. Wei, Y. Tian, T. Wu, C. Kloc, F. Huo, Q. Yan, H. H. Hng and J. Ma, CrystEngComm, 2012, 14, 75–78 RSC.
- J. Gao, M. He, Z. Y. Lee, W. Cao, W.-W. Xiong, Y. Li, R. Ganguly, T. Wu and Q. Zhang, Dalton Trans., 2013, 42, 11367–11370 RSC.
- (a) D. Zhu, M. Qiao, J. Liu, T. Tao and C. Guo, J. Mater. Chem. A, 2020, 8, 8143–8170 RSC; (b) M. N. Ahamad, M. S. Khan, M. Shahid and M. Ahmad, Dalton Trans., 2020, 49, 14690 RSC; (c) M. S. Khan, M. Khalid and M. Shahid, Mater. Adv., 2020, 1, 1575 RSC; (d) M. S. Khan, M. Khalid, M. S. Ahmad, M. Shahid and M. Ahmad, Dalton Trans., 2019, 48, 12918 RSC; (e) K. Iman, M. Shahid, M. S. Khan, M. Ahmad and F. Sama, CrystEngComm, 2019, 21, 5299–5309 RSC; (f) M. N. Ahamad, M. Shahid, M. Ahmad and F. Sama, ACS Omega, 2019, 44, 7738–7749 CrossRef PubMed; (g) M. Raizada, F. Sama, M. Ashafaq, M. Shahid, M. Khalid, M. Ahmad and Z. A. Siddiqi, Polyhedron, 2018, 139, 131–141 CrossRef CAS; (h) A. Siddique, I. Mantasha, M. Shahid, R. N. Singh, P. Rawat, S. Trivedi, A. Ranjan and M. Zeeshan, CrystEngComm, 2021, 23, 2316–2325 RSC; (i) H. A. M. Saleh, I. Mantasha, K. M. A. Qasem, M. Shahid, M. N. Akhtar, M. A. AlDamen and M. Ahmad, Inorg. Chim. Acta, 2020, 512, 11990 CrossRef.
- (a) H.-C. Zhou, J. R. Long and O. M. Yaghi, Chem. Rev., 2012, 112, 673–674 CrossRef CAS PubMed; (b) H.-C. Zhou and S. Kitagawa, Chem. Soc. Rev., 2014, 43, 5415–5418 RSC.
- Y. Chen, Z. Fan, Z. Zhang, W. Niu, C. Li, N. Yang, B. Chen and H. Zhang, Chem. Rev., 2018, 118, 6409–6455 CrossRef CAS PubMed.
- M. Chhowalla, Z. Liu and H. Zhang, Chem. Soc. Rev., 2015, 44, 2584–2586 RSC.
- C. Tan and H. Zhang, Chem. Soc. Rev., 2015, 44, 2713–2731 RSC.
- Q. Weng, X. Wang, X. Wang, Y. Bando and D. Golberg, Chem. Soc. Rev., 2016, 45, 3989–4012 RSC.
- Q. Cai, D. Scullion, W. Gan, A. Falin, S. Zhang, K. Watanabe, T. Taniguchi, Y. Chen, E. J. G. Santos and L. H. Li, Sci. Adv., 2019, 5, eaav0129 CrossRef PubMed.
- M. Zhao, Y. Huang, Y. Peng, Z. Huang, Q. Ma and H. Zhang, Chem. Soc. Rev., 2018, 47, 6267–6295 RSC.
- J. Liu, W. Shi and X. Wang, J. Am. Chem. Soc., 2019, 141, 18754–18758 CrossRef CAS PubMed.
- C. Tan, K. Yang, J. Dong, Y. Liu, Y. Liu, J. Jiang and Y. Cui, J. Am. Chem. Soc., 2019, 141, 17685–17695 CrossRef CAS.
- Y.-M. Wang, J.-W. Zhang, Q.-Y. Wang, H.-Y. Li, X.-Y. Dong, S. Wang and S.-Q. Zang, Chem. Commun., 2019, 55, 14677–14680 RSC.
- D.-M. Chen, N.-N. Zhang, C.-S. Liu and M. Du, J. Mater. Chem. C, 2017, 5, 2311–2317 RSC.
- X.-L. Jiang, S.-L. Hou, Z.-H. Jiao and B. Zhao, Anal. Chem., 2019, 91, 9754–9759 CrossRef CAS PubMed.
- (a) R. Makiura, S. Motoyama, Y. Umemura, H. Yamanaka, O. Sakata and H. Kitagawa, Nat. Mater., 2010, 9, 565–571 CrossRef CAS; (b) L. Cao, Z. Lin, F. Peng, W. Wang, R. Huang, C. Wang, J. Yan, J. Liang, Z. Zhang and T. Zhang, Angew. Chem., 2016, 128, 5046–5050 CrossRef.
- (a) K. Wang, Q. Li, Z. Ren, C. Li, Y. Chu, Z. Wang, M. Zhang, H. Wu and Q. Zhang, Small, 2020, 16, 2001987 CrossRef CAS PubMed; (b) Y. Li, M. Lu, Y. Wu, Q. Ji, H. Xu, J. Gao, G. Qian and Q. Zhang, J. Mater. Chem. A, 2020, 8, 18215–18219 RSC; (c) Z. Wu, D. Adekoya, X. Huang, M. J. Kiefel, J. Xie, W. Xu, Q. Zhang, D. Zhu and S. Zhang, ACS Nano, 2020, 14, 12016–12026 CrossRef CAS.
- (a) C. Lee, X. Wei, J. W. Kysar and J. Hone, Science, 2008, 321, 385–388 CrossRef CAS PubMed; (b) A. K. Cheetham, C. N. R. Rao and R. K. Feller, Chem. Commun., 2006, 4780–4795 RSC; (c) Q.-Y. Yang, K. Li, J. Luo, M. Pan and C.-Y. Su, Chem. Commun., 2011, 47, 4234–4236 RSC; (d) A. M. Spokoyny, D. Kim, A. Sumrein and C. A. Mirkin, Chem. Soc. Rev., 2009, 38, 1218–1227 RSC.
- C. Li, K. Wang, J. Li and Q. Zhang, ACS Mater. Lett., 2020, 2, 779–797 CrossRef CAS.
- S. Wang, C. M. McGuirk, A. d’Aquino, J. A. Mason and C. A. Mirkin, Adv. Mater., 2018, 30, 1800202 CrossRef.
- A. Carné, C. Carbonell, I. Imaz and D. Maspoch, Chem. Soc. Rev., 2011, 40, 291–305 RSC.
- J. Della Rocca, D. Liu and W. Lin, Acc. Chem. Res., 2011, 44, 957–968 CrossRef CAS PubMed.
- M. Zhao, Q. Lu, Q. Ma and H. Zhang, Small Methods, 2017, 1, 1600030 CrossRef.
- J. Duan, Y. Li, Y. Pan, N. Behera and W. Jin, Coord. Chem. Rev., 2019, 395, 25–45 CrossRef CAS.
- Y. Peng, Y. Li, Y. Ban, H. Jin, W. Jiao, X. Liu and W. Yang, Science, 2014, 346, 1356–1359 CrossRef CAS PubMed.
- (a) J. N. Coleman, Acc. Chem. Res., 2013, 46, 14–22 CrossRef CAS; (b) C. Backes, T. M. Higgins, A. Kelly, C. Boland, A. Harvey, D. Hanlon and J. N. Coleman, Chem. Mater., 2017, 29, 243–255 CrossRef CAS.
- (a) P. Amo-Ochoa, L. Welte, R. González-Prieto, P. J. S. Miguel, C. J. Gómez-García, E. Mateo-Martí, S. Delgado, J. Gómez-Herrero and F. Zamora, Chem. Commun., 2010, 46, 3262–3264 RSC; (b) P. J. Saines, J.-C. Tan, H. H.-M. Yeung, P. T. Barton and A. K. Cheetham, Dalton Trans., 2012, 41, 8585–8593 RSC; (c) P. J. Saines, M. Steinmann, J.-C. Tan, H. H.-M. Yeung, W. Li, P. T. Barton and A. K. Cheetham, Inorg. Chem., 2012, 51, 11198–11209 CrossRef CAS; (d) J.-C. Tan, P. J. Saines, E. G. Bithell and A. K. Cheetham, ACS Nano, 2012, 6, 615–621 CrossRef CAS PubMed.
- (a) Y.-H. Luo, C. Chen, C. He, Y.-Y. Zhu, D.-L. Hong, X.-T. He, P.-J. An, H.-S. Wu and B.-W. Sun, ACS Appl. Mater. Interfaces, 2018, 10, 28860–28867 CrossRef CAS PubMed; (b) S. C. Junggeburth, L. Diehl, S. Werner, V. Duppel, W. Sigle and B. V. Lotsch, J. Am. Chem. Soc., 2013, 135, 6157–6164 CrossRef CAS; (c) P. Chandrasekhar, A. Mukhopadhyay, G. Savitha and J. N. Moorthy, J. Mater. Chem. A, 2017, 5, 5402–5412 RSC; (d) W. Pang, B. Shao, X.-Q. Tan, C. Tang, Z. Zhang and J. Huang, Nanoscale, 2020, 12, 3623–3629 RSC.
- H. Zhu and D. Liu, J. Mater. Chem. A, 2019, 7, 21004–21035 RSC.
- K. S. Novoselov, A. K. Geim, S. V. Morozov, D. Jiang, Y. Zhang, S. V. Dubonos, I. V. Grigorieva and A. A. Firsov, Science, 2004, 306, 666–669 CrossRef CAS PubMed.
- C. Tan, X. Cao, X.-J. Wu, Q. He, J. Yang, X. Zhang, J. Chen, W. Zhao, S. Han and G.-H. Nam, Chem. Rev., 2017, 117, 6225–6331 CrossRef CAS.
- A. Abhervé, S. Manas-Valero, M. Clemente-León and E. Coronado, Chem. Sci., 2015, 6, 4665–4673 RSC.
- J. López-Cabrelles, S. Mañas-Valero, I. J. Vitórica-Yrezábal, P. J. Bereciartua, J. A. Rodríguez-Velamazán, J. C. Waerenborgh, B. J. C. Vieira, D. Davidovikj, P. G. Steeneken and H. S. J. Van der Zant, Nat. Chem., 2018, 10, 1001–1007 CrossRef.
- Y. Shen, B. Shan, H. Cai, Y. Qin, A. Agarwal, D. B. Trivedi, B. Chen, L. Liu, H. Zhuang and B. Mu, Adv. Mater., 2018, 30, 1802497 CrossRef.
- P. Chandrasekhar, A. Mukhopadhyay, G. Savitha and J. N. Moorthy, J. Mater. Chem. A, 2017, 5, 5402–5412 RSC.
- A. Gallego, C. Hermosa, O. Castillo, I. Berlanga, C. J. Gómez-García, E. Mateo-Martí, J. I. Martínez, F. Flores, C. Gómez-Navarro and J. Gómez-Herrero, Adv. Mater., 2013, 25, 2141–2146 CrossRef CAS PubMed.
- (a) V. K.-M. Au, K. Nakayashiki, H. Huang, S. Suginome, H. Sato and T. Aida, J. Am. Chem. Soc., 2018, 141, 53–57 CrossRef PubMed; (b) B. Garai, A. Mallick, A. Das, R. Mukherjee and R. Banerjee, Chem. – Eur. J., 2017, 23, 7361–7366 CrossRef CAS PubMed.
- (a) X. Wang, C. Chi, K. Zhang, Y. Qian, K. M. Gupta, Z. Kang, J. Jiang and D. Zhao, Nat. Commun., 2017, 8, 1–10 CrossRef; (b) Q. Zou, S. Bao, X. Huang, G. Wen, J. Jia, L. Wu and L. Zheng, Chem. – Asian J., 2021, 16, 1456–1465 CrossRef CAS.
- (a) Y. Ding, Y.-P. Chen, X. Zhang, L. Chen, Z. Dong, H.-L. Jiang, H. Xu and H.-C. Zhou, J. Am. Chem. Soc., 2017, 139, 9136–9139 CrossRef CAS; (b) H.-S. Wang, J. Li, J.-Y. Li, K. Wang, Y. Ding and X.-H. Xia, NPG Asia Mater., 2017, 9, e354–e354 CrossRef CAS; (c) W.-J. Song, Talanta, 2017, 170, 74–80 CrossRef CAS PubMed.
- (a) C. Kutzscher, A. Gelbert, S. Ehrling, C. Schenk, I. Senkovska and S. Kaskel, Dalton Trans., 2017, 46, 16480–16484 RSC; (b) A. Dhakshinamoorthy, A. M. Asiri and H. Garcia, Adv. Mater., 2019, 31, 1900617 CrossRef CAS PubMed.
- X. Xiao, L. Zou, H. Pang and Q. Xu, Chem. Soc. Rev., 2020, 49, 301–331 RSC.
- T. Bauer, Z. Zheng, A. Renn, R. Enning, A. Stemmer, J. Sakamoto and A. D. Schlüter, Angew. Chem., 2011, 123, 8025–8030 CrossRef.
- (a) R. Makiura, S. Motoyama, Y. Umemura, H. Yamanaka, O. Sakata and H. Kitagawa, Nat. Mater., 2010, 9, 565–571 CrossRef CAS PubMed; (b) R. Makiura, K. Tsuchiyama and O. Sakata, CrystEngComm, 2011, 13, 5538–5541 RSC; (c) S. Motoyama, R. Makiura, O. Sakata and H. Kitagawa, J. Am. Chem. Soc., 2011, 133, 5640–5643 CrossRef CAS PubMed; (d) R. Makiura and O. Konovalov, Sci. Rep., 2013, 3, 2506 CrossRef; (e) R. Makiura and O. Konovalov, Dalton Trans., 2013, 42, 15931–15936 RSC; (f) R. Makiura, R. Usui, Y. Sakai, A. Nomoto, A. Ogawa, O. Sakata and A. Fujiwara, ChemPlusChem, 2014, 79, 1352–1360 CrossRef CAS; (g) T. Kambe, R. Sakamoto, K. Hoshiko, K. Takada, M. Miyachi, J.-H. Ryu, S. Sasaki, J. Kim, K. Nakazato, M. Takata and H. Nishihara, J. Am. Chem. Soc., 2013, 135, 2462–2465 CrossRef CAS PubMed; (h) Y. Ying, Z. Zhang, S. B. Peh, A. Karmakar, Y. Cheng, J. Zhang, L. Xi, C. Boothroyd, Y. M. Lam and C. Zhong, Angew. Chem., 2021, 133, 11419–11426 CrossRef.
- Y. Liu, Z. Xie and W.-Y. Wong, J. Inorg. Organomet. Polym. Mater., 2020, 30, 254–258 CrossRef CAS.
- (a) S. Wu, L. Qin, K. Zhang, Z. Xin and S. Zhao, RSC Adv., 2019, 9, 9386–9391 RSC; (b) M. Wang, X. Dong, Z. Meng, Z. Hu, Y. Lin, C. Peng, H. Wang, C. Pao, S. Ding, Y. Li, Q. Shao and X. Huang, Angew. Chem., 2021, 133, 11290–11295 CrossRef.
- M. Zhao, Y. Wang, Q. Ma, Y. Huang, X. Zhang, J. Ping, Z. Zhang, Q. Lu, Y. Yu and H. Xu, Adv. Mater., 2015, 27, 7372–7378 CrossRef CAS PubMed.
- X. Zhang, P. Zhang, C. Chen, J. Zhang, G. Yang, L. Zheng, J. Zhang and B. Han, Green Chem., 2019, 21, 54–58 RSC.
- T. Tsuruoka, S. Furukawa, Y. Takashima, K. Yoshida, S. Isoda and S. Kitagawa, Angew. Chem., 2009, 121, 4833–4837 CrossRef.
- Y. Sakata, S. Furukawa, M. Kondo, K. Hirai, N. Horike, Y. Takashima, H. Uehara, N. Louvain, M. Meilikhov and T. Tsuruoka, Science, 2013, 339, 193–196 CrossRef CAS PubMed.
- J. M. Chin, E. Y. Chen, A. G. Menon, H. Y. Tan, A. T. S. Hor, M. K. Schreyer and J. Xu, CrystEngComm, 2013, 15, 654–657 RSC.
- S. C. Junggeburth, L. Diehl, S. Werner, V. Duppel, W. Sigle and B. V. Lotsch, J. Am. Chem. Soc., 2013, 135, 6157–6164 CrossRef CAS.
- M. Hu, S. Ishihara and Y. Yamauchi, Angew. Chem., Int. Ed., 2013, 52, 1235–1239 CrossRef CAS.
- S. He, Y. Chen, Z. Zhang, B. Ni, W. He and X. Wang, Chem. Sci., 2016, 7, 7101–7105 RSC.
- L. Cao, Z. Lin, W. Shi, Z. Wang, C. Zhang, X. Hu, C. Wang and W. Lin, J. Am. Chem. Soc., 2017, 139, 7020–7029 CrossRef CAS PubMed.
- A. K. Chaudhari, H. J. Kim, I. Han and J. Tan, Adv. Mater., 2017, 29, 1701463 CrossRef PubMed.
- J. Zhao, M. Li, J. Sun, L. Liu, P. Su, Q. Yang and C. Li, Chem. – Eur. J., 2012, 18, 3163–3168 CrossRef CAS PubMed.
- N. Stock and S. Biswas, Chem. Rev., 2012, 112, 933–969 CrossRef CAS PubMed.
- S. Zhao, Y. Wang, J. Dong, C.-T. He, H. Yin, P. An, K. Zhao, X. Zhang, C. Gao and L. Zhang, Nat. Energy, 2016, 1, 1–10 Search PubMed.
- C. Li, X. Hu, W. Tong, W. Yan, X. Lou, M. Shen and B. Hu, ACS Appl. Mater. Interfaces, 2017, 9, 29829–29838 CrossRef CAS PubMed.
- G. Hai, X. Jia, K. Zhang, X. Liu, Z. Wu and G. Wang, Nano Energy, 2018, 44, 345–352 CrossRef CAS.
- D. Zhu, C. Guo, J. Liu, L. Wang, Y. Du and S.-Z. Qiao, Chem. Commun., 2017, 53, 10906–10909 RSC.
- Y. Ning, X. Lou, C. Li, X. Hu and B. Hu, Chem. – Eur. J., 2017, 23, 15984–15990 CrossRef CAS PubMed.
- Z.-Q. Li, L.-G. Qiu, W. Wang, T. Xu, Y. Wu and X. Jiang, Inorg. Chem. Commun., 2008, 11, 1375–1377 CrossRef CAS.
- Y. Wang, L. Li, L. Yan, X. Gu, P. Dai, D. Liu, J. G. Bell, G. Zhao, X. Zhao and K. M. Thomas, Chem. Mater., 2018, 30, 3048–3059 CrossRef CAS.
- Z. W. Jiang, Y. C. Zou, T. T. Zhao, S. J. Zhen, Y. F. Li and C. Z. Huang, Angew. Chem., 2020, 132, 3326–3332 CrossRef.
- B. Garai, A. Mallick, A. Das, R. Mukherjee and R. Banerjee, Chem. – Eur. J., 2017, 23, 7361–7366 CrossRef CAS PubMed.
- K. Wang, D. Feng, T.-F. Liu, J. Su, S. Yuan, Y.-P. Chen, M. Bosch, X. Zou and H.-C. Zhou, J. Am. Chem. Soc., 2014, 136, 13983–13986 CrossRef CAS PubMed.
- S. Li, M. Dharmarwardana, R. P. Welch, Y. Ren, C. M. Thompson, R. A. Smaldone and J. J. Gassensmith, Angew. Chem., 2016, 128, 10849–10854 CrossRef.
- (a) T. Rodenas, I. Luz, G. Prieto, B. Seoane, H. Miro, A. Corma, F. Kapteijn, F. X. Llabrés i Xamena and J. Gascon, Nat. Mater., 2015, 14, 48–55 CrossRef CAS; (b) R. Makiura and O. Konovalov, Sci. Rep., 2013, 3, 2506 CrossRef PubMed; (c) H. Maeda, R. Sakamoto and H. Nishihara, Langmuir, 2016, 32, 2527–2538 CrossRef CAS PubMed.
- (a) X. Hu, Z. Wang, B. Lin, C. Zhang, L. Cao, T. Wang, J. Zhang, C. Wang and W. Lin, Chem. – Eur. J., 2017, 23, 8390–8394 CrossRef CAS PubMed; (b) M. J. Cliffe, E. Castillo-Martínez, Y. Wu, J. Lee, A. C. Forse, F. C. N. Firth, P. Z. Moghadam, D. Fairen-Jimenez, M. W. Gaultois and J. A. Hill, J. Am. Chem. Soc., 2017, 139, 5397–5404 CrossRef CAS PubMed; (c) H. S. Quah, L. T. Ng, B. Donnadieu, G. K. Tan and J. J. Vittal, Inorg. Chem., 2016, 55, 10851–10854 CrossRef CAS PubMed.
- R. Sakamoto, T. Yagi, K. Hoshiko, S. Kusaka, R. Matsuoka, H. Maeda, Z. Liu, Q. Liu, W. Wong and H. Nishihara, Angew. Chem., 2017, 129, 3580–3584 CrossRef.
- (a) Y. Yang, D. Zhang and Q. Xiang, Nanoscale, 2019, 11, 18797–18805 RSC; (b) Q. Xiang, F. Li, D. Zhang, Y. Liao and H. Zhou, Appl. Surf. Sci., 2019, 495, 143520 CrossRef CAS; (c) A. Kondo, C. C. Tiew, F. Moriguchi and K. Maeda, Dalton Trans., 2013, 42, 15267–15270 RSC.
- (a) C. J. Shearer, A. D. Slattery, A. J. Stapleton, J. G. Shapter and C. T. Gibson, Nanotechnology, 2016, 27, 125704 CrossRef PubMed; (b) P. Nemes-Incze, Z. Osváth, K. Kamarás and L. P. Biró, Carbon N. Y., 2008, 46, 1435–1442 CrossRef CAS.
- (a) S. Brunauer, P. H. Emmett and E. Teller, J. Am. Chem. Soc., 1938, 60, 309–319 CrossRef CAS; (b) C. Hermosa, B. R. Horrocks, J. I. Martínez, F. Liscio, J. Gómez-Herrero and F. Zamora, Chem. Sci., 2015, 6, 2553–2558 RSC; (c) C. Martí-Gastaldo, J. E. Warren, K. C. Stylianou, N. L. O. Flack and M. J. Rosseinsky, Angew. Chem., 2012, 124, 11206–11210 CrossRef.
- J. A. Foster, S. Henke, A. Schneemann, R. A. Fischer and A. K. Cheetham, Chem. Commun., 2016, 52, 10474–10477 RSC.
- A. C. Elder, A. B. Aleksandrov, S. Nair and T. M. Orlando, Langmuir, 2017, 33, 10153–10160 CrossRef CAS.
- Z. Kang, Y. Peng, Z. Hu, Y. Qian, C. Chi, L. Y. Yeo, L. Tee and D. Zhao, J. Mater. Chem. A, 2015, 3, 20801–20810 RSC.
- Y. Cheng, X. Wang, C. Jia, Y. Wang, L. Zhai, Q. Wang and D. Zhao, J. Membr. Sci., 2017, 539, 213–223 CrossRef CAS.
- L. Zhang, J. Ran, S.-Z. Qiao and M. Jaroniec, Chem. Soc. Rev., 2019, 48, 5184–5206 RSC.
- J. E. Mondloch, M. J. Katz, N. Planas, D. Semrouni, L. Gagliardi, J. T. Hupp and O. K. Farha, Chem. Commun., 2014, 50, 8944–8946 RSC.
- A. J. Howarth, A. W. Peters, N. A. Vermeulen, T. C. Wang, J. T. Hupp and O. K. Farha, Chem. Mater., 2017, 29, 26–39 CrossRef CAS.
- J. Bedia, V. Muelas-Ramos, M. Peñas-Garzón, A. Gómez-Avilés, J. J. Rodríguez and C. Belver, Catalysts, 2019, 9, 52 CrossRef.
- A. R. West, Solid state chemistry and its applications, John Wiley & Sons, 2014 Search PubMed.
- D. J. Ashworth and J. A. Foster, J. Mater. Chem. A, 2018, 6, 16292–16307 RSC.
- Y. Hu, Y. Huang, C. Tan, X. Zhang, Q. Lu, M. Sindoro, X. Huang, W. Huang, L. Wang and H. Zhang, Mater. Chem. Front., 2017, 1, 24–36 RSC.
- A. K. Chaudhari, S. S. Nagarkar, B. Joarder and S. K. Ghosh, Cryst. Growth Des., 2013, 13, 3716–3721 CrossRef CAS.
- Y. Wang, M. Zhao, J. Ping, B. Chen, X. Cao, Y. Huang, C. Tan, Q. Ma, S. Wu, Y. Yu, Q. Lu, J. Chen, W. Zhao, Y. Ying and H. Zhang, Adv. Mater., 2016, 28, 4149–4155 CrossRef CAS PubMed.
- Z. Qiu, T. Yang, R. Gao, G. Jie and W. Hou, J. Electroanal. Chem., 2019, 835, 123–129 CrossRef CAS.
- Z. R. Herm, E. D. Bloch and J. R. Long, Chem. Mater., 2014, 26, 323–338 CrossRef CAS.
- Z. Bao, G. Chang, H. Xing, R. Krishna, Q. Ren and B. Chen, Energy Environ. Sci., 2016, 9, 3612–3641 RSC.
- S. Chaemchuen, N. A. Kabir, K. Zhou and F. Verpoort, Chem. Soc. Rev., 2013, 42, 9304–9332 RSC.
- C. A. Scholes, K. H. Smith, S. E. Kentish and G. W. Stevens, Int. J. Greenhouse Gas Control, 2010, 4, 739–755 CrossRef CAS.
- B. Seoane, J. Coronas, I. Gascon, M. E. Benavides, O. Karvan, J. Caro, F. Kapteijn and J. Gascon, Chem. Soc. Rev., 2015, 44, 2421–2454 RSC.
- S. Jiang, X. Shi, F. Sun and G. Zhu, Chem. – Asian J., 2020, 15, 2371–2378 CrossRef CAS PubMed.
- M. T. Kallo and M. J. Lennox, Langmuir, 2020, 36, 13591–13600 CrossRef CAS PubMed.
- (a) D. Feng, T. Lei, M. R. Lukatskaya, J. Park, Z. Huang, M. Lee, L. Shaw, S. Chen, A. A. Yakovenko and A. Kulkarni, Nat. Energy, 2018, 3, 30–36 CrossRef CAS; (b) Y. Yan, Y. Luo, J. Ma, B. Li, H. Xue and H. Pang, Small, 2018, 14, 1801815 CrossRef PubMed.
- (a) C. Liu, Y. Bai, J. Wang, Z. Qiu and H. Pang, J. Mater. Chem. A, 2021, 9, 11201–11209 RSC; (b) X. Guo, Y. Xu, Y. Cheng, Y. Zhang and H. Pang, Appl. Mater. Today, 2020, 18, 100517 CrossRef; (c) B. Li, R. Zhu, H. Xue, Q. Xu and H. Pang, J. Colloid Interface Sci., 2020, 563, 328–335 CrossRef CAS PubMed; (d) Y. Zheng, S. Zheng, Y. Xu, H. Xue, C. Liu and H. Pang, Chem. Eng. J., 2019, 373, 1319–1328 CrossRef CAS.
- A. J. Clough, J. W. Yoo, M. H. Mecklenburg and S. C. Marinescu, J. Am. Chem. Soc., 2015, 137, 118–121 CrossRef CAS PubMed.
- M. Jian, H. Liu, T. Williams, J. Ma, H. Wang and X. Zhang, Chem. Commun., 2017, 53, 13161–13164 RSC.
- H.-M. Ma, J.-W. Yi, S. Li, C. Jiang, J.-H. Wei, Y.-P. Wu, J. Zhao and D.-S. Li, Inorg. Chem., 2019, 58, 9543–9547 CrossRef CAS PubMed.
- S. Roy, A. Dey, P. P. Ray, J. Ortega-Castro, A. Frontera and S. Chattopadhyay, Chem. Commun., 2015, 51, 12974–12976 RSC.
- R. Rahimi, S. Shariatinia, S. Zargari, M. Y. Berijani, A. Ghaffarinejad and Z. S. Shojaie, RSC Adv., 2015, 5, 46624–46631 RSC.
- J. Lee, O. K. Farha, J. Roberts, K. A. Scheidt, S. T. Nguyen and J. T. Hupp, Chem. Soc. Rev., 2009, 38, 1450–1459 RSC.
- A. Corma, H. García and F. X. Llabrés i Xamena, Chem. Rev., 2010, 110, 4606–4655 CrossRef CAS PubMed.
- T. He, B. Ni, S. Zhang, Y. Gong, H. Wang, L. Gu, J. Zhuang, W. Hu and X. Wang, Small, 2018, 14, 1703929 CrossRef PubMed.
- F. Afshariazar and A. Morsali, Cryst. Growth Des., 2019, 19, 4239–4245 CrossRef CAS.
- T. Guo, C. Wang, N. Zhang, Y. Zhang, T. Chen, X. Xing, Z. Lu and L. Wen, Cryst. Growth Des., 2020, 20, 6217–6225 CrossRef CAS.
- G. Zhan, L. Fan, F. Zhao, Z. Huang, B. Chen, X. Yang and S. Zhou, Adv. Funct. Mater., 2019, 29, 1806720 CrossRef.
- E. F. Pratt and M. J. Kamlet, J. Org. Chem., 1961, 26, 4029–4031 CrossRef CAS.
- M. Zhao, K. Deng, L. He, Y. Liu, G. Li, H. Zhao and Z. Tang, J. Am. Chem. Soc., 2014, 136, 1738–1741 CrossRef CAS PubMed.
- Y. Huang, M. Zhao, S. Han, Z. Lai, J. Yang, C. Tan, Q. Ma, Q. Lu, J. Chen and X. Zhang, Adv. Mater., 2017, 29, 1700102 CrossRef PubMed.
- C. He, K. Lu, D. Liu and W. Lin, J. Am. Chem. Soc., 2014, 136, 5181–5184 CrossRef CAS PubMed.
- X. Ruan, D. Liu, X. Niu, Y. Wang, C. D. Simpson, N. Cheng, D. Du and Y. Lin, Anal. Chem., 2019, 91, 13847–13854 CrossRef CAS PubMed.
- S. Arun Kumar, B. Balasubramaniam, S. Bhunia, M. K. Jaiswal, K. Verma, A. Khademhosseini, R. K. Gupta and A. K. Gaharwar, Wiley Interdiscip. Rev.: Nanomed. Nanobiotechnol., 2020, e1674 Search PubMed.
- K. Lu, C. He and W. Lin, J. Am. Chem. Soc., 2014, 136, 16712–16715 CrossRef CAS PubMed.
- (a) I. Mantasha, M. Shahid, H. A. M. Saleh, K. M. A. Qasem and M. Ahmad, CrystEngComm, 2020, 22, 3891–3909 RSC; (b) I. Mantasha, H. A. M. Saleh, K. M. A. Qasem, M. Shahid and M. Ahmad, Inorg. Chim. Acta, 2020, 511, 119787 CrossRef; (c) A. Mariyam, M. Shahid, I. Mantasha, M. S. Khan and M. S. Ahmad, J. Inorg. Organomet. Polym. Mater., 2020, 30, 1935–1943 CrossRef CAS; (d) I. Mantasha, S. Hussain, M. Ahmad and M. Shahid, Sep. Purif. Technol., 2020, 238, 116413 CrossRef CAS.
- M. Zhang, Z. Qi, Y. Feng, B. Guo, Y. Hao, Z. Xu, L. Zhang and D. Sun, Inorg. Chem. Front., 2018, 5, 1314–1320 RSC.
- N. Ahmad, H. A. Younus, A. H. Chughtai, K. Van Hecke, Z. A. K. Khattak, Z. Gaoke, M. Danish and F. Verpoort, Catal. Sci. Technol., 2018, 8, 4010–4017 RSC.
- H. Li, K. Gao, B. Mo, Q. Meng, K. Li, J. Wu and H. Hou, Dalton Trans., 2021, 50, 3348–3355 RSC.
- H.-L. Liu, Y.-J. Chang, T. Fan and Z.-Y. Gu, Chem. Commun., 2016, 52, 12984–12987 RSC.
- P.-Z. Li, Y. Maeda and Q. Xu, Chem. Commun., 2011, 47, 8436–8438 RSC.
- H. Xu, J. Gao, X. Qian, J. Wang, H. He, Y. Cui, Y. Yang, Z. Wang and G. Qian, J. Mater. Chem. A, 2016, 4, 10900–10905 RSC.
- Y. Peng, Y. Li, Y. Ban and W. Yang, Angew. Chem., Int. Ed., 2017, 56, 9757–9761 CrossRef CAS PubMed.
- G. E. Gomez, M. C. Bernini, E. V. Brusau, G. E. Narda, D. Vega, A. M. Kaczmarek, R. Van Deun and M. Nazzarro, Dalton Trans., 2015, 44, 3417–3429 RSC.
- S. Benmansour, A. Abhervé, P. Gómez-Claramunt, C. Vallés-García and C. J. Gómez-García, ACS Appl. Mater. Interfaces, 2017, 9, 26210–26218 CrossRef CAS PubMed.
- K. Hoshiko, T. Kambe, R. Sakamoto, K. Takada and H. Nishihara, Chem. Lett., 2014, 43, 252–253 CrossRef CAS.
- R. Dong, M. Pfeffermann, H. Liang, Z. Zheng, X. Zhu, J. Zhang and X. Feng, Angew. Chem., Int. Ed., 2015, 54, 12058–12063 CrossRef CAS PubMed.
- X. Huang, P. Sheng, Z. Tu, F. Zhang, J. Wang, H. Geng, Y. Zou, C.-A. Di, Y. Yi, Y. Sun, W. Xu and D. Zhu, Nat. Commun., 2015, 6, 7408–7415 CrossRef CAS PubMed.
- A. J. Clough, J. M. Skelton, C. A. Downes, A. A. De La Rosa, J. W. Yoo, A. Walsh, B. C. Melot and S. C. Marinescu, J. Am. Chem. Soc., 2017, 139, 10863–10867 CrossRef CAS PubMed.
- Y.-N. Li, S. Wang, Y. Zhou, X.-J. Bai, G.-S. Song, X.-Y. Zhao, T.-Q. Wang, X. Qi, X.-M. Zhang and Y. Fu, Langmuir, 2017, 33, 1060–1065 CrossRef CAS PubMed.
- T. Pal, T. Kambe, T. Kusamoto, M. L. Foo, R. Matsuoka, R. Sakamoto and H. Nishihara, ChemPlusChem, 2015, 80, 1255–1258 CrossRef CAS PubMed.
- X. Sun, K.-H. Wu, R. Sakamoto, T. Kusamoto, H. Maeda and H. Nishihara, Chem. Lett., 2017, 46, 1072–1075 CrossRef.
- X. Sun, K.-H. Wu, R. Sakamoto, T. Kusamoto, H. Maeda, X. Ni, W. Jiang, F. Liu, S. Sasaki and H. Masunaga, Chem. Sci., 2017, 8, 8078–8085 RSC.
- A. Pustovarenko, M. G. Goesten, S. Sachdeva, M. Shan, Z. Amghouz, Y. Belmabkhout, A. Dikhtiarenko, T. Rodenas, D. Keskin and I. K. Voets, Adv. Mater., 2018, 30, 1707234 CrossRef PubMed.
- C.-X. Yu, F.-L. Hu, J.-G. Song, J.-L. Zhang, S.-S. Liu, B.-X. Wang, H. Meng, L.-L. Liu and L.-F. Ma, Sens. Actuators, B, 2020, 310, 127819 CrossRef CAS.
- C. S. Lee, J. M. Lim, J. T. Park and J. H. Kim, Chem. Eng. J., 2021, 406, 126810 CrossRef CAS.
- X. Chen, X. Jiang, X. Lei, B. Zhang, M. Qiao, C. Yin and Q. Zhang, Cryst. Growth Des., 2020, 20, 1378–1382 CrossRef CAS.
- Q. Liu, J. Chen, P. Yang, F. Yu, Z. Liu and B. Peng, Int. J. Hydrogen Energy, 2021, 46, 416–424 CrossRef CAS.
- J. Zha and X. Zhang, Cryst. Growth Des., 2018, 18, 3209–3214 CrossRef CAS.
- K. Jayaramulu, D. P. Dubal, A. Schneemann, V. Ranc, C. Perez-Reyes, J. Stráská, Š. Kment, M. Otyepka, R. A. Fischer and R. Zbořil, Adv. Funct. Mater., 2019, 29, 1902539 CrossRef.
- H. He, Y. Song, F. Sun, N. Zhao and G. Zhu, Cryst. Growth Des., 2015, 15, 2033–2038 CrossRef CAS.
- Y. Xiao, W. Guo, H. Chen, H. Li, X. Xu, P. Wu, Y. Shen, B. Zheng, F. Huo and W. D. Wei, Mater. Chem. Front., 2019, 3, 1580–1585 RSC.
- M. Yan, J. Ye, Q. Zhu, L. Zhu, J. Huang and X. Yang, Anal. Chem., 2019, 91, 10156–10163 CrossRef CAS PubMed.
- K. Zhao, S. Liu, G. Ye, Q. Gan, Z. Zhou and Z. He, J. Mater. Chem. A, 2018, 6, 2166–2175 RSC.
- J. Chen, Y. Shu, H. Li, Q. Xu and X. Hu, Talanta, 2018, 189, 254–261 CrossRef CAS PubMed.
- C. Guo, Y. Zhang, L. Zhang, Y. Zhang and J. Wang, CrystEngComm, 2018, 20, 5327–5331 RSC.
- N. Lahiri, N. Lotfizadeh, R. Tsuchikawa, V. V. Deshpande and J. Louie, J. Am. Chem. Soc., 2017, 139, 19–22 CrossRef CAS PubMed.
| This journal is © The Royal Society of Chemistry 2021 |


