 Open Access Article
Creative Commons Attribution 3.0 Unported Licence
Mechanochromism of dynamic disulfide bonds as a chromophoric indicator of adhesion strength for epoxy adhesive†
Hsing-Ying
Tsai
ab,
Yasuyuki
Nakamura
a,
Wei-Hsun
Hu
ab,
Takehiro
Fujita
a and
Masanobu
Naito
 *ab
*ab
aData-driven Polymer Design Group, Research and Services Division of Materials Data and Integrated System (MaDIS), National Institute for Materials Science (NIMS), 1-2-1, Sengen, Tsukuba, Ibaraki 305-0047, Japan. E-mail: NAITO.Masanobu@nims.go.jp
bProgram in Materials Science and Engineering, Graduate School of Pure and Applied Sciences, University of Tsukuba, 1-1-1, Tenodai, Tsukuba, Ibaraki 305-8571, Japan
First published on 1st June 2021
Abstract
We demonstrated that the introduction of disulfide bonds into epoxy adhesive could be used as a facile chromophoric indicator to predict the adhesive strength. Once the disulfide bond was cleaved, the color of the epoxy adhesive would be changed from yellow to green due to the generation of thiyl radicals. The lifetime of this green coloration, so-called mechanochromism, was dependent on the crosslink density of the epoxy adhesive, namely, the adhesive strength.
Epoxy-based adhesive has been widely applied in the aerospace and automobile industries because of the trend of light-weight design. In general, it exhibits excellent thermal, mechanical and chemical stability due to the crosslinked thermoset network structure, providing outstanding adhesion performance. It is well accepted that there are multiple factors that affect adhesion strength, such as the chemical structure and molecular weight of the epoxy resin and hardener, surface morphology of the substrate, curing conditions, and so on.1–5 In particular, for two-component curing adhesives, such as epoxy resin, if the ratio of the main agent to the curing agent is not accurate, the adhesive performance could be greatly degraded, leading to adhesive failure. Therefore, the crosslinking density of the adhesive network is considered as an important variable, which has a significant impact on the adhesion strength. However, in practical applications, it is difficult to evaluate the crosslinking density of epoxy adhesive by its appearance; otherwise, current evaluation of crosslinking density, such as dynamic mechanical analysis (DMA), solid state nuclear magnetic resonance (NMR), and differential scanning calorimetry (DSC) is limited in the laboratory.6–8 Consequently, the more efficient indicator in the crosslinking density of the adhesive network in industrial applications is highly desired to rapidly screen the low-crosslinked adhesive network, resulting in decreasing the occurrence of failure of the adhesive joint.
To address this demand, dynamic disulfide bonding is introduced into the epoxy resin network. This polymeric material belongs to dynamic covalent networks, also known as vitrimers, which present a reversible network topology under external stimuli through exchange reaction of dynamic bonds. It has been reported that the epoxy resin incorporated with dynamic disulfide bonding exhibited both excellent vitrimer characteristics and adhesion strength even at high temperature.9–14 Disulfide bonding plays an important role not only as a dynamic covalent bond, but also in additional mechanochromic functionality for epoxy resin.15–19 Alaitz Ruiz de Luzuriaga et al. demonstrated the mechanochromic effect applied in damage detection of epoxy resin and its composite structure.15 When the composites made from disulfide-contained epoxy resin was hit by a hammer, the broken area would show green coloration and then returned to yellow after several hours at room temperature. The green coloration was attributed to the generation of sulfur-centered radicals (thiyl radical) by mechanical stress; whereas, the color turned to yellow after a certain time due to the recombination of radicals to bridge the new disulfide bonding. Here, we expected that the highly crosslinked networks with less chain mobility resulted in longer recombination time of thiyl radicals to reform the disulfide bond. In other words, this time-dependent mechanochromic property offered an approach to evaluate the crosslinking density of epoxy resin, leading to the determination of its adhesion strength.
In this study, we firstly utilized mechanochromism of disulfide bonds to assess both crosslinking density and adhesion strength as described in Scheme 1. We assumed that the duration time of the mechanochromic effect would be longer in the disulfide-contained epoxy network with higher crosslinking density and less segmental chain movement (in this case, this means higher glass transition temperature (Tg)), finally suggesting the tougher adhesion strength. Through the results obtained from this work, the mechanochromic property for the dynamic polymer applied in the crosslinking density and adhesion evaluation could be further discussed.
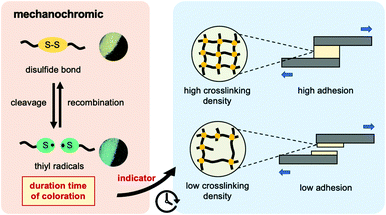 | ||
| Scheme 1 Graphical concept of mechanochromic effect applied in evaluation of crosslinking density and adhesion strength in this research. | ||
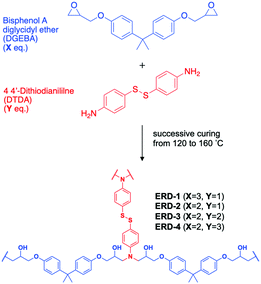
Herein, we prepared four types of disulfide-contained epoxy adhesive with different crosslinking density by adjusting the ratio between epoxy resin and diamine hardener. The disulfide-contained epoxy adhesive was synthesized by combining bisphenol A diglycidyl ether (DGEBA) and 4,4′-dithiodianiline (DTDA) as an epoxy monomer and diamine hardener, followed by mixing at 90 °C for 30 min in the ratio of 3![[thin space (1/6-em)]](https://www.rsc.org/images/entities/char_2009.gif) :
:![[thin space (1/6-em)]](https://www.rsc.org/images/entities/char_2009.gif) 1, 2
1, 2![[thin space (1/6-em)]](https://www.rsc.org/images/entities/char_2009.gif) :
:![[thin space (1/6-em)]](https://www.rsc.org/images/entities/char_2009.gif) 1, 2
1, 2![[thin space (1/6-em)]](https://www.rsc.org/images/entities/char_2009.gif) :
:![[thin space (1/6-em)]](https://www.rsc.org/images/entities/char_2009.gif) 2, and 2
2, and 2![[thin space (1/6-em)]](https://www.rsc.org/images/entities/char_2009.gif) :
:![[thin space (1/6-em)]](https://www.rsc.org/images/entities/char_2009.gif) 3, respectively. The mixture of epoxy resin and hardener was applied on the surface of treated aluminium substrates, followed by curing at 120 °C, 140 °C, and 160 °C for 2 hour each, given the epoxy resins with disulfide bonding referred to as ERD-1, ERD-2, ERD-3, and ERD-4 (Scheme 2). Details of the sample preparation conditions were provided in the ESI† and Table S1. Note that ERD-2 was the sample synthesized in a stoichiometric molar ratio, which was assumed to show the highest crosslinking density; in contrast, an extra amount of epoxy resin existed in the network of ERD-1, while excess diamine hardener was added in the network of ERD-3 and ERD-4, resulting in network structures with lower crosslinking density. Besides, in order to exclude the effect of disulfide bonding on the whole performance of an epoxy network, the control sample without disulfide bonding was prepared by synthesizing the DGEBA with 4,4′-diaminodiphenylmethane (DDM). The summarized table of its properties was supplemented as Table S2 in the ESI.† The comparison of these samples would give the relationship between the mechanochromic property and the network structure.
3, respectively. The mixture of epoxy resin and hardener was applied on the surface of treated aluminium substrates, followed by curing at 120 °C, 140 °C, and 160 °C for 2 hour each, given the epoxy resins with disulfide bonding referred to as ERD-1, ERD-2, ERD-3, and ERD-4 (Scheme 2). Details of the sample preparation conditions were provided in the ESI† and Table S1. Note that ERD-2 was the sample synthesized in a stoichiometric molar ratio, which was assumed to show the highest crosslinking density; in contrast, an extra amount of epoxy resin existed in the network of ERD-1, while excess diamine hardener was added in the network of ERD-3 and ERD-4, resulting in network structures with lower crosslinking density. Besides, in order to exclude the effect of disulfide bonding on the whole performance of an epoxy network, the control sample without disulfide bonding was prepared by synthesizing the DGEBA with 4,4′-diaminodiphenylmethane (DDM). The summarized table of its properties was supplemented as Table S2 in the ESI.† The comparison of these samples would give the relationship between the mechanochromic property and the network structure.
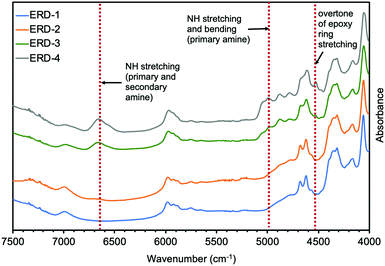
First, Fourier transform near-infrared spectroscopy (FT-nIR) was performed on all epoxy adhesives in this work to investigate the network structures (Fig. 1 and Fig. S1, ESI†). Fig. 1 showed that the spectra of all compounds were almost identical in the nIR region from 4000 cm−1 to 7500 cm−1. The difference was that the combination band of N–H stretching and bending (ca. 5000–5100 cm−1) for primary amine and the band of N–H stretching (ca. 6600–6800 cm−1) for primary and secondary amine were only observable in ERD-3 and ERD-4,20 indicating the existence of unreacted diamine hardener. Also, the combination band of the second overtone of the epoxy ring stretching with the fundamental C–H stretching (ca. 4530 cm−1), which is assigned to the unreacted epoxide ring,20 was detected in ERD-3 and ERD-4. Note that the epoxide group was not observed in the case of ERD-1. This result may be attributed to the high curing temperature, which promoted the further reaction between the hydroxyl group generated by a ring-opening reaction of an epoxide group and excess epoxide group, leading to consumption of an epoxide group. In summary, the primary and secondary amine, and epoxide groups remained in a polymeric network of ERD-3 and ERD-4, which resulted in network structures with lower crosslinking density.
To further assess the degree of crosslinking, a swelling test was performed by immersing each sample into toluene for 72 hours at room temperature. The swelling ratio after 72 hours immersion for ERD-1, ERD-2, ERD-3 and ERD-4 was 3.7%, 2.2%, 4.9%, and 6%, respectively (Table 1 and Fig. S2, ESI†). The lower swelling ratio indicated that less toluene was penetrated into the cross-linked epoxy network, indicating the higher crosslinking density of epoxy adhesive. Therefore, the crosslinking density of each formula was calculated based on the Flory–Rehner equation as stated in the ESI.† The theoretical crosslinking density is also presented in Table 1. In summary, the network of composition ERD-2 was the structure with the highest crosslinking density. Besides, the segmental motion of the high-crosslinking network would be relatively fixed and slow, leading to less chain mobility and a higher glass transition temperature (Tg). Differential scanning calorimetry (DSC) is a common experiment to determine the Tg-value (Fig. S3, ESI†). As summarized in Table 1, the specimen ERD-2 with the highest crosslinking density possessed the highest Tg-value (162 °C) as assumed, whereas, the Tg-value of ERD-4 (51 °C) was the lowest, corresponding to its decreased crosslinking density and increased chain mobility.
| Epoxy | ERD-1 | ERD-2 | ERD-3 | ERD-4 |
|---|---|---|---|---|
| Swelling ratio(Q) (%) | 3.7 ± 0.2 | 2.2 ± 0.4 | 4.9 ± 0.7 | 6.0 ± 0.4 |
| Gel fraction (%) | 97.9 ± 0.2 | 98.8 ± 0.5 | 96.6 ± 0.5 | 94.1 ± 1.0 |
| Crosslinking density (mol m−3) | 14796.8 | 19177.6 | 12560.2 | 11002.4 |
| T g (°C) | 145 | 162 | 89 | 51 |
| Adhesion strength (MPa) | 13.5 ± 1.7 | 18.9 ± 0.8 | 2.4 ± 0.2 | 1.7 ± 0.4 |
Generally, excellent adhesion performance was obtained in the adhesive network with high crosslinking density and low segmental motion. Therefore, after confirming the crosslinking density and chain mobility through a swelling test and DSC, the adhesion strength was determined by a single lap shear test (Table 1 and Fig. S4, ESI†). According to the results, ERD-2 exhibited the most increased adhesion strength, while ERD-4 showed poor adhesion performance. Also, the adhesion strength would be declined with decreasing crosslinking density and Tg-value. This result indicated that ERD-2 exhibited the highest adhesion strength due to the highly crosslinked network and low chain mobility.
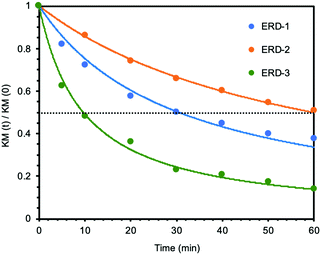
Next, we studied the mechanochromic property of these epoxy network samples. The cured bulk epoxy resin was polished by sandpaper to observe the mechanochromic effect of each network sample as summarized in Fig. 2. In general, the original color of the cured samples was brown but dissimilar due to the different ratio between epoxy resin and diamine hardener. After polishing the surface of brown bulk epoxy resin by sandpaper, the initial color of the powder in the sandpaper appeared as green, except for ERD-4. This change was derived from the generation of thiyl radicals due to the mechanical scission of a disulfide bond, which was supported by electron spin resonance (ESR) (Fig. S7, ESI†). After placing the sample at room temperature for a certain time, the green color recovered to the original brown color, which corresponded to the thiyl radicals recombining with each other again. The recombination rate of such radicals should depend on the crosslinking density and chain mobility of the whole polymer networks. Thus, in order to evaluate the mechanochromic properties, the lasting time of the color change was quantified by UV-vis spectra in the solid state as shown in Fig. 3. The new absorption corresponding to the color change was observed at 650 nm for ERD-1 and -2, and 710 nm for ERD-3. The reason for the difference in the wavelength was still unclear, however, the difference of the molecular or micro-structure of the network might be related. On the other hand, no change of spectrum was observed for ERD-4, which agreed with the visual observation in Fig. 2. The duration of the mechanochromic effect was defined as the time where the intensity of Kubelka–Munk absorbance at the wavelength corresponding to the color change was half of the initial value (t1/2). Fig. 4 indicated that the duration of coloration for ERD-1, ERD-2, and ERD-3 was 32.6 min, 60.3 min, and 9.8 min, respectively. Therefore, the results proved that the mechanochromic effect remained for the longest time in ERD-2, which was the network structure with the highest crosslinking density and adhesion strength.
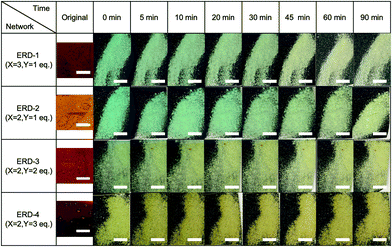 | ||
| Fig. 2 Time-dependent photographic sequence showing the mechanochromic effect for all epoxy networks in this work (scale bars indicate 3 mm). | ||
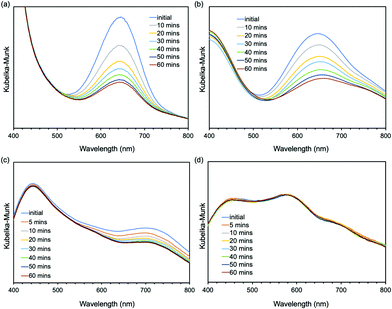 | ||
| Fig. 3 Time-dependent Kubelka–Munk absorbance of UV-vis spectra in the solid state for (a) ERD-1, (b) ERD-2, (c) ERD-3, and (d) ERD-4. | ||
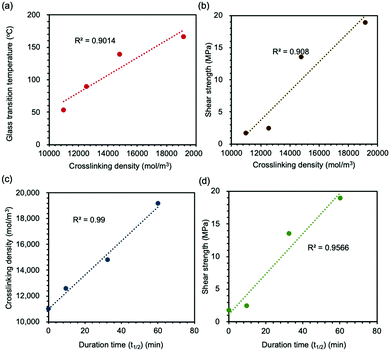
Based on these results, we plotted the correlation among each variable (Fig. 5). The R2-value for each figure was calculated to identify the relevance of each property. First, the crosslinking density of the epoxy network had an impact on both chain mobility and adhesion strength (Fig. 5(a) and (b)). In general, the network with high crosslinking density presented high Tg-value and adhesion strength since it was more difficult to proceed the segmental movement. The duration time of the mechanochromic effect was well correlated to the crosslinking density, which showed the longer duration time for the network with higher crosslink density (Fig. 5(c)). The disappearing of the mechanochromic effect corresponded to the recombination of thiyl radicals, and the rate was dependent of the mobility of the radicals in the network. Since chain mobility in the network with high crosslink density was lower than that in the network with low crosslink density (as proved in Fig. 5(a)), the observed correlation was well consistent with the mechanism of mechanochromism of this network sample. As a consequence of these studies, the lasting time of the mechanochromic effect was directly associated with adhesion strength (Fig. 5(d)), which meant that adhesion strength can be speculated based on the duration time of the color of the powder changing from green to yellow; namely, the duration of mechanochromic behavior sustained was the indicator to confirm both the crosslinking density and adhesion strength of disulfide-contained adhesive networks.
In conclusion, the crosslinking density determination could be obtained through mechanochromism in disulfide-contained epoxy adhesive; as a result, since the crosslinking density has a direct influence on adhesion strength, the property of color change could also be utilized as an indicator to determine the adhesion performance. It is foreseen that such application in terms of crosslinking density and adhesion strength evaluation could help us to develop the more effective acceptance and error-proofing methods of epoxy adhesive in practical industrial usage.
Conflicts of interest
There are no conflicts to declare.Acknowledgements
This work was supported by the Core Research for Evolutional Science and Technology (CREST) program “Evolutional material development by fusion of strong experiments with theory/data science” of the Japan Science and Technology Agency (JST), Japan, under Grant JPMJCR19J3.Notes and references
- E. M. Petrie, Handbook of Adhesives and Sealants, McGraw-Hill Education, New York, 2007 Search PubMed.
- S. Ebnesajjad and A. H. Landrock, Adhesives Technology Handbook, William Andrew Publishing, Boston, 3rd edn, 2015, pp. 1–18 Search PubMed.
- S. Pruksawan, S. Samitsu, H. Yokoyama and M. Naito, Macromolecules, 2019, 52, 2464–2475 Search PubMed.
- S. Pruksawan, S. Samitsu, Y. Fujii, N. Torikai and M. Naito, ACS Appl. Polym. Mater., 2020, 2, 1234–1243 Search PubMed.
- S. Pruksawan, G. Lambard, S. Samitsu, K. Sodeyama and M. Naito, Sci. Technol. Adv. Mater., 2019, 20, 1010–1021 Search PubMed.
- J. Hwang, S. G. Lee, S. Kim, J. S. Kim, D. H. Kim and W. H. Lee, ACS Appl. Polym. Mater., 2020, 2, 2190–2198 Search PubMed.
- C. G. Fry and A. C. Lind, Macromolecules, 1988, 21, 1292–1297 Search PubMed.
- R. Vera-Graziano, F. Hernandez-Sanchez and J. V. Cauich-Rodriguez, J. Appl. Polym. Sci., 1995, 55, 1317–1327 Search PubMed.
- S. P. Black, J. K. M. Sanders and A. R. Stefankiewicz, Chem. Soc. Rev., 2014, 43, 1861–1872 Search PubMed.
- Y. Li, Y. Zhang, O. Rios, J. K. Keum and M. R. Kessler, RSC Adv., 2017, 7, 37248–37254 Search PubMed.
- J. M. Matxain, J. M. Asua and F. Ruipérez, Phys. Chem. Chem. Phys., 2016, 18, 1758–1770 Search PubMed.
- A. Takahashi, T. Ohishi, R. Goseki and H. Otsuka, Polymer, 2016, 82, 319–326 Search PubMed.
- A. Ruiz De Luzuriaga, R. Martin, N. Markaide, A. Rekondo, G. Cabañero, J. Rodríguez and I. Odriozola, Mater. Horiz., 2016, 3, 241–247 Search PubMed.
- H.-Y. Tsai, Y. Nakamura, T. Fujita and M. Naito, Mater. Adv., 2020, 1, 3182–3188 Search PubMed.
- A. Ruiz De Luzuriaga, J. M. Matxain, F. Ruipérez, R. Martin, J. M. Asua, G. Cabañero and I. Odriozola, J. Mater. Chem. C, 2016, 4, 6220–6223 Search PubMed.
- S. Yamane, Y. Sagara, T. Mutai, K. Araki and T. Kato, J. Mater. Chem. C, 2013, 1, 2648–2656 Search PubMed.
- C. Calvino, L. Neumann, C. Weder and S. Schrettl, J. Polym. Sci., Part A: Polym. Chem., 2017, 55, 640–652 Search PubMed.
- L. Chen, S. Zhu, I. Toendepi, Q. Jiang, Y. Wei, Y. Qiu and W. Liu, Polymers, 2020, 12, 1 Search PubMed.
- Z. Li, M. Tang, S. Liang, M. Zhang, G. M. Biesold, Y. He, S.-M. Hao, W. Choi, Y. Liu, J. Peng and Z. Lin, Prog. Polym. Sci., 2021, 116, 101387 Search PubMed.
- M. González, J. C. Cabanelas and J. Baselga, In Infrared spectroscopy - mater science, engineering and Technology, ed. T. Theophile, InTech Open, 2012, pp. 261–264 Search PubMed.
Footnote |
| † Electronic supplementary information (ESI) available: Experimental, ESR, UV-vis, FT-nIR, DSC, swelling test, lap shear test, etc. See DOI: 10.1039/d1ma00252j |
| This journal is © The Royal Society of Chemistry 2021 |

