
 Open Access Article
 This Open Access Article is licensed under a Creative Commons Attribution-Non Commercial 3.0 Unported Licence
XRD/Raman spectroscopy studies of the mechanism of (de)intercalation of Na+ from/into highly crystalline birnessite†
Philipp
Scheitenberger
a,
Sylvain
Brimaud
b and
Mika
Lindén
 *a
*a
aInorganic Chemistry II, Ulm University, Albert-Einstein-Allee 11, 89081 Ulm, Germany. E-mail: mlinden(at)uni-ulm.de
bZentrum für Sonnenenergie- und Wasserstoff-Forschung Baden-Württemberg (ZSW), Helmholtzstrasse 8, 89081 Ulm, Germany
First published on 30th April 2021
Abstract
Due to its low-cost and environmental friendliness, birnessite-type manganese oxide has attracted wide interest for use as a cathode material in electrochemical energy storage applications. The mechanisms of energy storage and release have been studied in some detail during the last decade, but despite some agreement, some aspects of the storage and release mechanisms are still under debate. The main reason for this, we argue, is the varying interpretations of Raman spectroscopy data in the literature. Therefore, we undertook a detailed correlative Raman spectroscopy/XRD study in combination with cyclic voltammetry. Raman spectroscopy allowed for straightforward differentiation between symmetry changes during the (de)intercalation of Na-ions. More specifically, through the use of highly crystalline birnessite samples it is suggested that Raman spectra are sensitive to the lattice parameters β and d001, which allowed us to derive unprecedented details of the changes in the birnessite structure that occur upon Na+ (de)intercalation. Furthermore, it is shown that the reversible hexagonal/monoclinic symmetry transition during the course of a charge/discharge cycle is a prerequisite for effective charge storage. Based on the results, a detailed mechanism describing the (de)intercalation of Na+ from/into birnessite is presented.
Introduction
Layered metal oxides are attractive cathode materials for sodium-1–5 and potassium-ion6–8 batteries and pseudocapacitors. One promising material belonging to this material class is birnessite-type manganese oxide which exhibits a theoretical capacity of 243 mA h g−1.9 Its structure is composed of edge-sharing MnO6 octahedra, with water molecules and charge-balancing metal cations such as Li+, Na+, and K+ occupying the interlayer region.10 Depending on the Na-content Na-birnessite has been suggested to exhibit either a monoclinic C2/m,11 triclinic12,13 or hexagonal14 symmetry, where the unit cell angles for the triclinic symmetry lie very close to those corresponding to a monoclinic symmetry.15Different charge storage mechanisms have been proposed for birnessite.2,7,16,17 All these mechanisms have in common the fact that during charging, the deintercalation of charge balancing alkali ions is suggested to increase the interlayer charge repulsion, which in combination with the intercalation of water leads to an increase of the interlayer distance.7,18 In addition, a symmetry transition from monoclinic to hexagonal has been connected to alkali ion deintercalation.19,20 A symmetry change from either triclinic21 or monoclinic22 to hexagonal birnessite has also been observed upon for H-exchange of Na-birnessite. Here it was suggested that the driving force for the monoclinic Na-birnessite to hexagonal H-birnessite transformation is the destabilization of Mn3+-rich rows in the manganese oxide layers at low pH.22
However, since most birnessites reported in the literature exhibit a rather low crystallinity, detailed structural analysis based on X-ray diffraction, XRD, is difficult. Further complication in this respect is the preferential orientation of the crystals, leading to an orientation-dependent enhancement of the diffracted intensity for some crystal planes.23–26
In contrast, confocal Raman spectroscopy is a vibrational technique that provides unique structural information on the atomic scale on inorganic and organic compounds with high spatial resolution and short data accumulation times, and is therefore predestined for in situ studies. Since the ground-breaking study of Julien et al.,27 Raman spectroscopy has been extensively used to characterize different birnessites both ex situ and in situ.17,28–31 A high-quality confocal Raman spectrum measured for a highly crystalline, monoclinic, mixed Li,Na,K-birnessite used as the starting material in the present study is shown in Fig. 1. The spectral features are in good general agreement with literature data reported for related Li- and Na-birnessites.27,29–31
 | ||
| Fig. 1 Raman spectrum measured for pristine, monoclinic Li,Na,K-birnessite. See the text for details. | ||
According to Julien et al.,27 the Raman bands above 500 rel. cm−1 can be assigned to Mn–O vibrations,27 where the ν1 band located at around 620–650 rel. cm−1 can be viewed as the symmetric stretching vibration ν1(Mn–O) of MnO6 groups and is assigned to the A1g symmetric mode in the C2h spectroscopic space group (monoclinic). A linear correlation between the position of this band and the interlayer spacing has been proposed.20,27,30 The band located at 570–590 rel. cm−1 has been attributed to the ν2(Mn–O) stretching vibration in the basal plane of [MnO6] sheets, and the position of this band has been suggested to show a negative correlation with the interlayer spacing.28,30 The shape of the ν3 band, also assigned to Mn–O vibrations, has been correlated with the birnessite symmetry. A single band at about 500 rel. cm−1 is characteristic of the hexagonal symmetry, while splitting of this band into two is observed for lower symmetry.32 The low wavenumber bands at ∼400 rel. cm−1 (ν4) and 280 rel. cm−1 (ν5), on the other hand, have been assigned to the asymmetric stretching vibration of the Li+ or Na+ ions occupying tetrahedral or octahedral sites, respectively.23,27,33
Despite differences in the composition and degree of crystallinity of the birnessites described in the literature, the presently accepted understanding of the general evolution of the Raman spectra of birnessite during charging/oxidation and discharging/reduction can be summarized as follows: during the cathodic process, the ν1 band undergoes a red shift whereas ν2 undergoes a blue shift.30 Furthermore, due to an increasing degree of Jahn–Teller distortion upon cation intercalation, the ν2 and ν1 bands gradually broaden, at least in the case of Na+.30 At the same time, the ν3 band evolves from a singlet band to a doublet,30 and the ν4 band evolves from a doublet peak to a singlet peak,30,32 in agreement with an electrochemically driven symmetry transition (see above).20 However, due to their low intensity, a detailed analysis of the two latter bands has to the best of our knowledge never been conducted. The evolution of all bands is reversible during the anodic process. Nevertheless, a detailed correlation of cyclic voltammograms and Raman spectra is yet to be conducted, and this is also true for the correlation between Raman spectra and XRD results. The present study attempts to fill this gap, aiming at a deeper understanding of the mechanistic aspects of Na+ (de)intercalation from/into birnessite. Here we report results obtained from in situ cyclic voltammetry (CV) and in situ and ex situ Raman measurements performed in aqueous 0.5 M Na2SO4-electrolyte using a highly crystalline birnessite. It is shown that Raman spectroscopy is indeed a powerful method for analyzing both structural and chemical changes occurring upon redox-cycling of birnessites, allowing a detailed model of the ion (de)intercalation processes to be established.
Experimental
Chemicals
Acetone (Merck, spectrograde), KMnO4 (Sigma-Aldrich, 99–100.5%, puriss.), NaOH-solution (49–51 wt%) (Merck, EMSURE, p.a.), LiOH·H2O (Alfa Aesar, 98%), Na2SO4·10H2O (Merck, EMSURE, p.a.) K2SO4 (Merck, EMSURE, p.a.), H2SO4 98% (Merck, p.a.), HCl 32% (Merck, p.a.), N-methyl-2-pyrrolidone (NMP) (Sigma-Aldrich, ≥99%), and polyvinylidene difluoride (PVDF) (Gelon, ≥99.5%) were used. All solutions were freshly prepared with ultrapure water (Optima Plus, resistivity >15.0 MΩ cm). All chemicals were used as-received without further purification.Synthesis of the starting birnessite materials
Birnessite-type MnO2 was synthesized according to Bülow et al.34 and Ziller et al.29 In a typical synthesis, 0.345 g (8.22 mmol) LiOH·H2O and 4.0 g (0.05 mol) (50 wt%) NaOH solution were dissolved in 246 mL ultrapure water in a 500 mL glass beaker. Afterward, the solution was degassed for 1 h under an argon flow. The solution was heated to 65 °C and 2.375 g (15 mmol) KMnO4 were added and stirred vigorously until the KMnO4 was completely dissolved and the solution homogenized. Then 30.0 mL spectrograde acetone were added rapidly. A rapid color change from dark purple to green to brown and grey was observed accompanied by a temperature increase to 72 °C. The resulting solution was aged at 65 °C for 1 h. Then the solution was centrifuged and washed with ultrapure water until a nearly neutral pH was reached. The grey solid was dried at 60 °C for 24 h. This material is denoted Li,Na,K-bir. Na-birnessite (Na-bir) and H-birnessite (H-bir) were obtained by immersion of Li,Na,K-bir for 24 h in either 0.5 M Na2SO4 or 0.5 M Na2SO4 where the pH was adjusted to 2.80 through the addition of H2SO4, respectively. After immersion, the powders were centrifuged, washed two times with ultrapure water, and subsequently dried at 60 °C.Material characterization
For CV measurements and in situ Raman measurements 1.0 μL of the slurry containing the birnessite MnO2 was deposited on a glassy carbon electrode (ALS WA001 GC 10 × 5) with 5.0 mm in diameter and dried at 60 °C for 1 h.
For ex situ XRD/Raman measurements 6.0 μL of the birnessite slurry were deposited on a glassy carbon plate (15 × 2 mm) (HTW Hochtemperatur-Werkstoffe GmbH, Thierhaupten, Germany), followed by drying at 60 °C in air.
Electrochemical measurements/CV measurements were performed in a beaker cell in aqueous 0.5 M Na2SO4, degassed under an argon flow, with an Ag/AgCl reference electrode (ALS, RE-1CP) and a Pt-wire as the counter electrode using a Biologic SP 150. All potentials in the text refer to the Ag/AgCl scale.
Laser power was determined after microscope transit (with objective) by means of an external analyzer. Confocal Raman measurements have been accomplished using a 63× Zeiss microscope objective (NA: 0.75).
The scan area was 20 × 20 μm, and the parameter of the Raman image was 9 × 9 pixels. Laser power and the integration time per pixel were attuned for each experiment. This procedure ensures a high quality of the averaged spectra, prevents thermal decomposition,35 and minimizes the effect of local inhomogeneity.
Electrochemical preconditioning of the electrode was performed by applying 10 voltammetric cycles between −350 mV and 1100 mV with a scan rate of 10 mV s−1 prior to all measurements (see the text for details).
Cyclic voltammograms (CV) for in situ Raman measurements were measured at a potential scan rate of 0.3 mV s−1.
The acquisition time for each averaged Raman spectrum used for data evaluation was 90 seconds, leading to a resolution at a potential of 27 mV during potentiodynamic cycles. (Laser power: 1.5 mW, and integration time per pixel: 1 s.) The acquisition potential given in the following for each spectrum corresponds to the mean value of the potentials at the beginning and end of the respective spectrum acquisition. Since the changes between two successive Raman spectra are relatively small in this series of measurements, such a resolution was sufficient to track potential-dependent changes in the Raman spectra. Along the whole set of measurements, the acquisition parameters were fixed (including confocality), allowing for high comparability of the different spectra at their absolute intensities. The potential was controlled with a CH Instruments 440C potentiometer.
To prevent evaporation of electrolyte the electrode was covered with polyimide foil (Kapton) during the XRD-measurements and with a CaF2-window during the Raman measurements. The procedure was repeated for each potential step (as indicated in the Results section), first going downwards on the potential scale and then going upwards.
XRD measurements were performed within maximally 5 minutes after removing the sample from the CV cell. In order to keep the measurement time at a minimum (12 minutes), only one angular range was measured; 11–14° 2Θ for covering the range of the (001) reflection. Raman spectra measured before and after XRD-measurements indicated that the sample remained stable during the measurement time.
Results
Birnessite synthesis and characterization
To allow for a reliable correlation between birnessite symmetry and Raman spectral features, highly crystalline Li,Na,K-bir was synthesized following a synthesis route published by Bülow et al.34 and Ziller et al.29 The chemical composition as determined by ICP-AES and TGA was Li0.16Na0.19K0.02MnO1.99 × 0.63H2O, and the mean valence state of manganese as determined from the extent of splitting of the Mn 3s core levels as determined by XPS36,37 was 3.5–3.6 (see the ESI,† Fig. S2 and S3). Scanning electron microscopy (SEM) of the dried powder revealed a flaky morphology typical for layered materials, as shown in Fig. 2.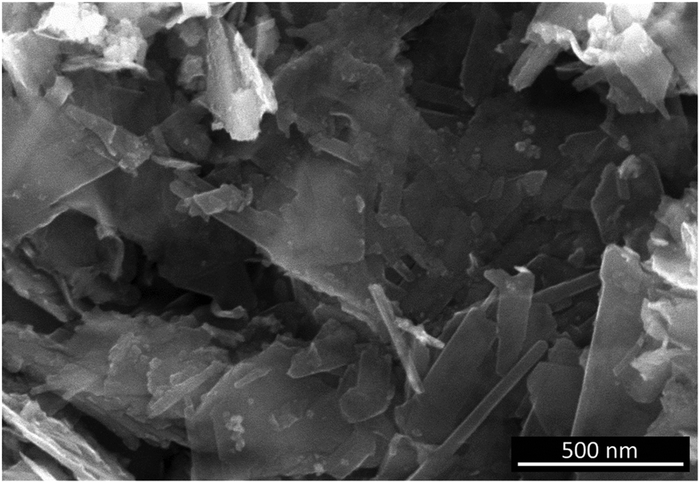 | ||
| Fig. 2 SEM image of the Li,Na,K-birnessite used as the starting material in the present study. | ||
Symmetry analysis was carried out using powder X-ray diffraction. The powder pattern of Li,Na,K-bir shown in Fig. 3(a) was in good agreement with the literature results.34 All observed reflections could be indexed to Na-birnessite exhibiting a monoclinic11 symmetry (space group C2/m, ICSD #68916). The interlayer spacing was 7.05 Å, in good agreement with the literature values reported for this mixed alkali-ion birnessite.29
 | ||
| Fig. 3 XRD-patterns of (a) Li,Na,K-bir, (b) Na-exchanged Li,Na,K-bir (Na-bir), and (c) H-exchanged Li,Na,K-bir (H-bir) (ICSD #187579). | ||
Additional highly crystalline birnessites were prepared by ion-exchange using Li,Na,K-bir as a precursor. The thus prepared birnessites were enriched in either Na+ (Na-bir) or H+ (H-bir). The reason for choosing the ion exchange method for synthesizing Na-bir and H-bir instead of a direct synthesis is that the ion exchange approach rendered all materials having the same particle morphology and size, and also ensured a high crystallinity, parameters which influence the reflex/peak intensities and full-width-at-half-maximum values in XRD and Raman spectroscopy.
The materials were characterized by X-ray diffraction (XRD), and the results are summarized in Fig. 3(b) and (c). In perfect agreement with literature data, Li,Na,K-bir and Na-bir exhibited a monoclinic symmetry,11 while H-bir exhibited a hexagonal symmetry.38
The diffractograms measured for the monoclinic birnessites were further analyzed using profile matching refinement, following the procedure introduced by Pawley.39Rwp values of 1.47 and 1.55 were obtained for Li,Na,K-bir, and Na-bir, respectively, suggesting that the model was a reasonable approximation of the birnessite structure. The calculated lattice parameters are summarized in Table 1. The values are in good agreement with the literature values for Na-bir.11
| Lattice parameter [Å]/[°] | Li,Na,K-bir | Na-bir | H-bir |
|---|---|---|---|
| a | 5.1588(5) Å | 5.1569(7) | — |
| b | 2.8461(5) Å | 2.8463(3) | — |
| c | 7.2431(4) Å | 7.2618(9) | 7.23 |
| β | 103.12(2) | 103.26(8) | 90 |
| d 001-Spacing | 7.05 | 7.08 | 7.23 |
The materials were further characterized by Raman spectroscopy, in order to study the relation between the structural material parameters and the Raman spectral features. The corresponding Raman spectra are summarized in Fig. 4.
 | ||
| Fig. 4 Raman spectra of Li,Na,K-bir, Na-bir and H-bir. | ||
The Raman spectra measured for the monoclinic Li,Na,K,-bir and Na-bir and the hexagonal H-bir are in good agreement with literature data.40 As discussed in the Introduction section, the shape of the ν3 band observed at about 500 rel. cm−1 is sensitive to the symmetry of the birnessite.32,40 As seen, this band is a doublet in the case of all other birnessites apart from H-bir, in agreement with the hexagonal symmetry of H-bir and the monoclinic symmetry of the other birnessites as determined by XRD. This conclusion is further supported by the opposite behaviour observed for the ν4 band.20,30 The band at 280 rel. cm−1, which has been assigned to the vibrational mode of MO6 units (M = alkali),23,27,33 is present for the two monoclinic birnessites but not for H-bir. Furthermore, for H-bir, clearly higher relative band intensities were observed in the 500 rel. cm−1 region, especially so for the ν1 band, while the intensities of bands in the 400 rel. cm−1 region assigned to the asymmetric stretching vibration of the M–O tetrahedra23,27,33 were much lower for H-bir as compared to the birnessites exhibiting a monoclinic symmetry. Thus, the Raman data are in excellent agreement with the XRD results, and highlight the suitability of Raman spectroscopy for determining the symmetry of birnessites.
Electrochemical characterization
The electrochemical properties of the as-prepared Li,Na,K-birnessite were investigated in a three-electrode system in 0.5 M Na2SO4 solution by cyclic voltammetry, CV. Electrochemical pre-activation of Li,Na,K-bir was conducted until a stable CV curve, which needed a couple of cycles at a sweep rate of 10 mV s−1 (Fig. S5, ESI†). When the scan rate was lowered to 0.3 mV s−1 narrower redox peaks were observed in the CV curves, suggesting that diffusional limitation played an important role in the electrochemical charging/discharging processes. This shape variation is highlighted while normalizing the CVs in current, which is performed by simply dividing the current by the scan rate just as shown in Fig. 5.41 The redox peaks were labelled as depicted in Fig. 5, where the peaks observed during the anodic scan and the cathodic scan are labelled A and C, respectively. The appearance of defined redox peaks is different from what often has been observed for a poorly crystalline, small particle size birnessite, for which nearly rectangular CV curves,42 referred to as “pseudocapacitive”, are often observed.30,43–45 Similar CV curves have, however, been observed for more crystalline birnessites in aqueous Na2SO4 electrolyte.5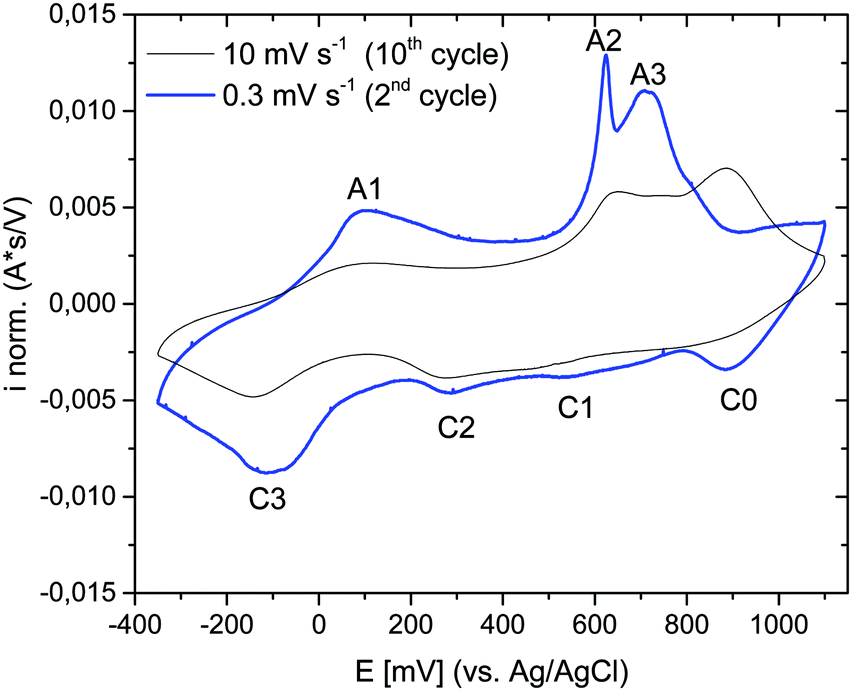 | ||
| Fig. 5 Normalized cyclic voltammograms of Li,Na,K-bir in 0.5 M Na2SO4 aqueous electrolyte (potential window: −350 mV–1100 mV (vs. Ag/AgCl)) measured at different scan rates: 10 mV s−1 (black) and 0.3 mV s−1 (blue). | ||
In order to identify the interrelation between the current peaks observed during the anodic and cathodic potential scans, additional measurements where the applied potential window was increased stepwise were conducted. Here, either the upper potential limit (1000 mV) or the lower potential limit (−350 mV) was kept constant. The scan rate was kept constant at 10 mV s−1 instead of at 0.3 mV s−1 for time reasons, but the general interrelation between the CV peaks should not be affected by the scan rate. The results are shown in Fig. 6(a) (stepwise decrease of the lower potential limit) and Fig. 6(b) (stepwise increase of the upper potential limit), respectively. All CV curves are shown in Fig. S6 and S7 (ESI†), respectively. Unfortunately, we were not able to apply an exactly defined mass of active material on the electrode and a sufficiently accurate gravimetric determination of the electrode mass (about 50 μg) was also impossible. Thus, specific capacities cannot be derived from these measurements. This also applies to the CV curves depicted in Fig. 5. However, as the discussion will be based only on relative changes, this circumstance will not influence the general conclusions.
 | ||
| Fig. 6 (a) CV curves measured at 10 mV s−1 starting from 1000 mV and with a continuously widened potential window down to −350 mV. (b) CV curves measured starting from −350 mV and with a continuously widened potential window up to 1100 mV. Electrolyte: 0.5 M Na2SO4. Scan rate: 10 mV s−1. | ||
Significant potential window and starting potential-dependent differences in the current response/capacity in the CVs were observed. If the lower potential limit was kept above 250 mV, no current peaks could be resolved (Fig. 6(a)). With a potential limit lower than 250 mV, a peak (A3) appeared during the anodic scan, and the position of this peak shifted towards higher potentials as the lower potential limit was lowered further. This peak was finally centered at 900 mV at the lowest potential limit applied (−350 mV). For −50 mV and lower potential limits, a second peak (A2) could be resolved during the positive-going potential scan, and the position of this peak shifted from ca. 500 mV to 600 mV with decreasing lower potential limit. Concurrently, ill-defined peaks (C0, C1 and C2) within the potential range of 100–900 mV evolved during the cathodic scan. This suggests that these peaks are linked to oxidation processes taking place in the region 400 to 1000 mV (A2 and/or A3)). This will be further substantiated below. Finally, a further decrease of the lower potential limit led to the resolution of the peak centered at −200 mV (C3) during the cathodic potential scan, and the appearance of a new anodic peak in the range of 0–100 mV (A1). We also note that the coulometric charge under the two peaks at the highest potentials in the positive-going potential scan (A2 and A3) continuously increased as the lower potential limit is lowered. As will be discussed in more detail below, this suggests that a significant fraction of the additional cationic species intercalated in the lowest potential region in the negative-going potential scan (C3) are de-intercalated in the highest potential region in the positive-going potential scan (A2 and A3).
Reversing the experiment, i.e. stepwise increasing the upper potential limit and a fixed lower potential limit of −350 mV, resulted in the CV curves shown in Fig. 6(b). A current response upon potential cycling became significant when the upper potential limit exceeded ca. 550 mV, i.e. as soon as the potential region corresponding to the current peak A2 was partially covered, leading to the appearance of peaks C2 centred at about 400 mV and C3 centred at about −100 mV. Upon a further increase in the upper potential limit to 700 mV, a peak centred at about 600 mV (C1) appeared during the negative-going potential scan. Peaks C1 and C2 were only visible when the upper potential limit sets between 650 mV and 900 mV and vanished at higher potential limits, possibly due to the broadening of both peaks. In particular, peak C3 increased in intensity when the upper potential limit covered peaks A2 and A3. The increase in the intensity of C3 was mirrored by an increase in the intensity of A1, suggesting that these peaks are related. Remarkably, A1 did not gain in intensity until the potential regions corresponding to current peaks A2 and A3 were covered although the observations indicate a connection between C3 and A1. It is therefore assumed that the processes underlying A2 and/or A3 determine the chemical composition and thus the redox behavior of Li,Na,K-bir in the potential range of C3.
To sum up this part, the results described in Fig. 6 highlight a very complex mechanism for the charge and discharge processes for Li,Na,K-bir. The presence of current peaks in the positive-going and negative-going potential scans is classically attributed to the (de)intercalation of the charge balancing cations due to the ongoing redox reactions involving Mn-species. The observations depicted in Fig. 6 indicate that the processes underlying the redox peaks A2 and C2 are crucial to make the “full” electrochemical capacity of Li,Na,K-bir accessible.
CV/in situ Raman spectroscopy measurements
Having established the suitability of Raman spectroscopy for symmetry identification, we employed in situ Raman spectroscopy during CV cycling. Here, the highly crystalline Li,Na,K-bir was electrochemically activated during 10 cycles in 0.5 M Na2SO4 before measurements (see the ESI,† Fig. S5). Raman intensity contour plots are shown together with the CV curves measured at a cycling rate of 0.3 mV s−1 in Fig. 7. All CV curves are depicted in the ESI,† Fig. S5, and all Raman spectra are depicted in the ESI,† Fig. S8 and S9. | ||
| Fig. 7 (a) Anodic and (c) cathodic potential scans. Scan rate: 0.3 mV s−1, electrolyte: 0.5 M Na2SO4. (b) and (d) contour plots showing simultaneous changes in the Raman spectral peak intensities for electrochemically activated birnessite MnO2. | ||
During the positive-going potential scan (oxidation), symmetry evaluations based on the Raman band splittings of bands ν3 and ν4 clearly show that the birnessite remained monoclinic up to a potential of about 630 mV, after which an abrupt symmetry change to hexagonal was observed. A similar frequency shift of ν1 was also observed by Hsu et al.31 and was also attributed to a monoclinic-to-hexagonal symmetry transition. This change in symmetry was accompanied by a pronounced and sharp current peak (A2) in the CV curve. The overall signal intensity continuously increased above about 200 mV and dropped abruptly when the potential corresponding to the current peak A2 (monoclinic-to-hexagonal transition) was exceeded. This increase in signal intensity may be caused by the build-up of internal lattice strains upon oxidation,46 and relaxation after the abrupt symmetry transition.
The broad current peak A1, observed at about 100 mV (monoclinic symmetry), was not associated with any symmetry change or changes in the shape or in the relative intensities of the individual Raman bands. After the symmetry change from monoclinic to hexagonal, the intensity of the ν1 band strongly increased, whereas the intensity of the ν2 band strongly decreased, and this was paralleled by a broad and intense current peak (A3) in the CV curve.
During the negative-going potential scan (reduction), the hexagonal-to-monoclinic symmetry transition, as determined on the Raman data, was initiated at a potential value of about 500 mV. However, here the phase transition was less abrupt as compared to that during oxidation, and did not reach completion before a potential value of about 100 mV was reached. This symmetry change was mirrored by a small and broad current peak (C2) in the CV curve. In contrast, no significant changes in the overall signal intensity were observed, which was probably caused by the much more continuous symmetry transition reducing the contribution of internal lattice strains. In general, these changes observed in the Raman spectra during the charge/discharge cycles were in agreement with the findings reported by Chen et al.30 Additionally, the observed potential dependent evolution of ν5, which was only visible in the lower potential region where the monoclinic phase is stable, was in good agreement with previous observations reported by Yang et al.33
These observations further point out the necessity of a symmetry transition during the course of a charge/discharge cycle to make the “full” electrochemical capacity accessible (see also the previous section). Such an increasing capacity after phase transition was already suggested by Vaalma et al.6 but they also pointed out an accelerated capacity fading and therefore an avoidance of these phase transitions was recommended. Based on our findings, we suggest that the phase transition is mandatory for achieving the full electrochemical capacity of birnessite, but exceeding a certain potential limit will for sure lead to an accelerated capacity fading.
In order to allow for a more quantitative analysis of the Raman spectra, deconvolution of the spectra was conducted. Three Gauss curves had to be used for the deconvolution of ν2. Since the FWHM of the three contributing bands were unclear, and it was difficult to determine the exact positions of ν2/1 and ν2/3, the integrated intensities of ν2/1, ν2/2 and ν2/3 were summarized to yield the total integrated intensity of ν2 (abs. A(ν2)). The integrated intensities of bands ν3 and ν4 were determined correspondingly. Deconvolution results for spectra measured at a potential of either −350 mV or 1100 mV are shown in Fig. 8.
 | ||
| Fig. 8 Deconvoluted Raman spectra of Li,Na,K-bir measured at electrode potentials of (a) −350 mV and (b) 1100 mV. | ||
The results of the deconvolution obtained as a function of potential and scan direction are summarized in Fig. 9. As depicted in Fig. 9(c) and (d), the total integrated intensities (abs. A(νx)) of the individual Raman bands were subject to significant potential-dependent changes, which partly were non-continuous. The most pronounced changes in the integrated intensities for both Mn–O and Na–O modes were observed between about 500 and 800 mV (anodic cycle) and about 600 and 100 mV (cathodic cycle). Only minor changes in the total integrated intensities of the Raman bands occurred in the potential regions of the redox peaks A1 and C3. This indicates firstly that changes in the mean oxidation state of Mn have little influence on the intensity change of the ν1(Mn–O) band,17,28 and secondly that the (de)intercalation of charge-balancing ions in these potential regions does not perceptibly affect the polarizability of the respective vibrational modes. The potential-dependent changes of the integrated intensities (rel. A(νx)) of the respective Raman-bands can be summarized as follows: during the anodic scan, nearly constant relative integrated intensities of the Raman bands ν1 and ν2 were observed at potentials below about 400 mV, and also above about 800 mV. Between about 400 and 800 mV, the relative areas of both bands showed different developments, whereby rel. A(ν1) increased and rel. A(ν2) decreased. The opposite behavior was observed in the course of the cathodic scan between about 700 mV and −100 mV. Within the potential regions above 700 mV and below about −50/−100 mV, no significant changes in the relative areas of ν1 and ν2 were observed upon variation of the electrode potential. The changes in the relative area of bands ν3, ν4, and ν5 occurred in roughly the same potential windows for both anodic and cathodic potential scans.
 | ||
Fig. 9 Potential dependent evolution of the individual Raman bands in the course of a CV cycle in 0.5 M Na2SO4, obtained from deconvolution. (a) and (b) CV-curves. (c) and (d) Integrated intensities. (e) and (f) Rel. integrated intensities. (g) and (h) Spectral positions of ν1 and ν2. Scan rate: 0.3 mV s−1. ν1 (■), ν2 ( ), ν3 ( ), ν3 ( ), ν4 ( ), ν4 ( ), and ν5 ( ), and ν5 ( ). ). | ||
Interestingly, as shown in Fig. 9(g) and (h), the position of the ν2 band gradually shifted towards lower wave numbers and the position of the ν1 band shifted towards higher wave numbers within a relatively narrow potential range of about 600–650 mV during oxidation. This was the potential window within which the symmetry change from monoclinic-to-hexagonal symmetry occurred, and which according to the Raman data was complete at 700 mV. At higher potential values, no further change in the positions of these bands was observed. This suggests that the positions of these bands are sensitive to the β-angle of Na-bir, which should change from the original value of about 103° for the monoclinic symmetry to 90° for the hexagonal symmetry during the transition. During reduction, the reverse behaviour was observed, but the changes occurred within a clearly broader potential window of 400–100 mV, again in full agreement with that when the potential window within which the appearance of the monoclinic symmetry was also observed in the intensity evolutions of the other relevant bands. This will be discussed in more detail below.
Ex situ Raman/XRD characterization
To shed some more light on the structural changes during electrochemical oxidation/reduction, and in order to obtain further information about the cause of the varying integrated intensity of the individual Raman bands, we further carried out combined ex situ XRD and Raman spectroscopy measurements after the electrode was kept at the target electrode potential. This measurement mode was chosen in order to exclude any influence of sample–sample differences and electrochemical history on the results. As these measurements were out of necessity carried out using individual samples for each data point, a means for normalization of the individual Raman spectra is needed. This is necessary, as the focus plane position may vary slightly between measurements, and therefore a direct comparison of the absolute integrated intensities of the respective bands is inappropriate. In previous publications, the I(ν2)/I(ν1)30 or I(ν1)/I(ν2)17 ratio was used for this purpose. However, such normalization does not reveal whether the intensity of the band under consideration or the intensity of the band to which the normalization is applied changes, which is why such a normalization procedure is not satisfactory. We, therefore, attempted to normalize the integrated intensities (abs. A(νx)) of the individual Raman bands to the total integrated intensities of the Raman bands ascribed to the Mn–O vibrations (abs. A(ν1–3)) (see Fig. 9(e) and (f)). As depicted in the ESI,† Fig. S10, the so normalized band intensities showed a quite linear dependency when plotted against the corresponding integrated intensities for all relevant bands when applied to the in situ data. In particular, for the negative-going scan direction the linearity was excellent. Thus, despite the fact that the physical meaning behind this behaviour is presently unclear, the good agreement between the so-normalized band intensities and the integrated intensities suggests that this normalization means indeed can render spectra that are mutually directly comparable, and will thus be applied for normalization of the intensities of the ex situ Raman spectra.The d001-values measured as a function of electrode potential are summarized in Fig. 10(a) (see the ESI† for Raman spectra (Fig. S11) and XRD pattern (Fig. S12)).
 | ||
| Fig. 10 (a) Potential dependent evolution of the d001-spacing and rel. A(ν1). (b) Potential dependent evolution of rel. A(ν1) as a function of the interlayer spacing (d001-spacing). (c) Potential dependent evolution of the position of the Raman bands ν1 and ν2. Electrolyte was 0.5 M Na2SO4. | ||
When the electrode potential was lowered stepwise, a continuous but slow decrease in the d001-spacing, from 7.35 Å to 7.24 Å, was observed in the potential range of 1100–400 mV, after which a sharp decay in the d001-spacing down to 7.04 Å was observed in the potential range of 400–100 mV.
Subsequently, when the electrode potential was increased stepwise, the d001-spacing only slightly increased from 7.05 Å to 7.09 Å up to potential values of about 600 mV, after which it rapidly increased to reach 7.29 Å at a potential of 850 mV. A further increase of the electrode potential only led to a minor increase of the d001-spacing, reaching 7.32 Å at a potential of 1100 mV. This value is slightly lower than the d001-spacing value measured at the beginning of the measurement and indicates a hysteresis of the d001-spacing. Interestingly, the most pronounced changes in d001-spacing during the negative-going potential steps were observed within the potential region corresponding to the monoclinic symmetry, whereas the most pronounced changes during the positive-going potential steps corresponded to the stability region of the hexagonal symmetry (see Fig. 10(c) and the ESI,† Fig. S11).
There is an obvious similarity between the potential-dependent changes in the d001-spacing (Fig. 10(a)) and the rel. A(ν1) (Fig. 9(e) and (f)) obtained from in situ Raman measurements. Therefore, the Raman spectra obtained during ex situ Raman/XRD measurements were deconvoluted, and normalized against the total integrated intensities of the bands associated with the Mn–O vibrations (abs. A(ν1–3)) as discussed above. As depicted in Fig. 10(a) and (b) (blue), the potential-dependent changes of rel. A(ν1) were in excellent accordance with the potential dependent changes in d001-spacing during the positive-going potential steps. In contrast, the correlation between rel. A(ν1) and the d001-spacing was less evident during negative-going potential steps. These observations indicate that two different chemical compositions can exhibit an identical d001-spacing. Furthermore, as shown in Fig. 10(a), a d001-spacing higher than about 7.3 Å does not lead to any relevant increase of the normalized intensity of ν1, and must therefore be assigned to additional charge repulsion-dependent effects and/or water intercalation.
Importantly, the previously suggested linear correlation between the position(s) of ν127 or ν230 and the d001-spacing (see the ESI,† Fig. S13) was not observed irrespective of the scan direction, but the positional changes of these bands can be stated to rather describe the gradual change in β-angle during the monoclinic-to-hexagonal symmetry transition during oxidation (and vice versa during reduction), although contributions from the change in the amount of intercalated water upon d001-spacing changes cannot be excluded.
As shown in the ESI,† Fig. S14, a significant, intermediate increase in the intensity of ν2/1 at 610 cm−1 was observed when the electrode potential was lowered stepwise. This elevated intensity of ν2/1 persisted down to a potential of about 350 mV, which corresponds to the onset potential of the hexagonal-to-monoclinic transition. A similar behavior was observed during the in situ Raman measurements (see the ESI,† Fig. S8 and S9). Since ν2/1 (at 610 cm−1) was also clearly visible in the Raman spectra measured for H-bir, a connection with the presence of protons within the MnO2 structure seems likely. Therefore, the increasing intensity of ν2/1, in the higher potential region where the birnessite exhibits a hexagonal symmetry is suggested to reflect the intercalation of charge balancing protons, while the decreasing intensity of ν2/1 in the further course indicates the exchange of protons against Na+. A similar mechanism was already proposed by Kanoh et al.16 As the intensity of ν1 remains nearly constant in this potential region where the intercalation of protons takes place, the normalized intensity of this band seems to be nearly unaffected by the presence of protons. In contrast, the deintercalation of Na+ leads to an increase in rel. A(ν1). Nevertheless, a (weak) relation between the d001-spacing and the rel. A(ν1) values was also evident during the negative potential scan, as soon as the hexagonal-to-monoclinic symmetry transition was initiated.
These observations could explain the pronounced potential-window-dependent hysteresis of the electrochemical behaviour and capacity of Li,Na,K-bir (see Fig. 6). When the upper potential limit is kept below the onset potential of current peak A2 (monoclinic–hexagonal symmetry transition), the symmetry remains monoclinic, and “no” charge balancing protons are intercalated in the upper potential region of the negative-going potential scan. In contrast, when the lower potential limit is kept above current peak C2 (hexagonal–monoclinic symmetry transition), the symmetry remains hexagonal, and less charge balancing Na+-ions are intercalated during the negative-going potential scan.
Potential-dependent changes within the crystal structure determined/calculated based on in situ Raman measurements
Based on the observations made in the previous sections, the potential-dependent symmetry transitions and changes in the d001-spacing during the course of a charge–discharge cycle can be estimated based on the in situ Raman data. Furthermore, if the positional changes of the bands ν1 and ν2 linearly reflect changes in the β-angle during the transition from the monoclinic to the hexagonal symmetry, even the β-angle, and then also the c value (c = d100/sin![[thin space (1/6-em)]](https://www.rsc.org/images/entities/char_2009.gif) β), can be estimated. The corresponding results are summarized in Fig. 11.
β), can be estimated. The corresponding results are summarized in Fig. 11.
 | ||
| Fig. 11 Potential dependent evolution of β (red) and d001-spacing (blue), calculated based on the positions of the ν1 and ν2 bands (Δ(ν1 − ν2) and the relative integrated intensity of ν1, respectively. The lattice parameter c (green) was calculated based on β and the d001-spacing. The current trace is included in arbitrary units for clarity. | ||
The conclusions drawn based on the ex situ data naturally remain the same for the in situ data. However, in addition, the analyses suggest that peak A2 observed in the CV curve during the anodic scan, and peak C2 observed during the cathodic scan are both mirrored by clear local minima in the c-value, suggesting that during the phase transition the MnOx sheets first slide against each other, and then the structure relaxes back to a relatively constant c value of about 7.3(3) Å observed both before and after the transition. Importantly, this indication is arrived at assuming a linear correlation between the positions of bands ν1 and ν2 and the β-angle, a correlation that still needs to be verified in future studies.
Mechanistic considerations for the Na+ charge storage in birnessite MnO2
From the overall data presented above, the following mechanistic considerations can be made, and a schematic representation is depicted in Fig. 12. | ||
| Fig. 12 Proposed mechanism of Na+ deintercalation (anodic scan), and intercalation (cathodic scan) in birnessite, and its connection to the CV curve. See the text for details. | ||
(1) Deintercalation of weakly bound Na ions, localized at undefined positions between the MnO2 layers.
(2) A further increase of the electrode potential leads to the deintercalation of strongly bound Na-ions, localized in well-defined binding sites between the MnO2-layers.
(3) Monoclinic-to-hexagonal symmetry transition.
(4) The facilitated Na+-diffusion within the hexagonal symmetry19 enables fast deintercalation of charge balancing Na-ions. Further deintercalation of Na-ions (A3) residing in well-defined bond environments and the simultaneous intercalation of water molecules16 induce a pronounced increase in the d001-distance.47
(5) At the upper potential limit, the birnessite exhibits hexagonal symmetry, the d001-spacing is about 7.3 Å, the Na+-content is low and the interlayer space is filled with a large number of water molecules.
(6) Charge balancing (mainly) through intercalation of protons accompanied by deintercalation of water molecules16 leading to a slight decrease of the d001-spacing.
(7)–(9) Charge balancing by the intercalation of Na+ into well defined binding sites. In parallel, the decreasing intensity of ν2/1 indicates the substitution of protons against Na+, as previously proposed by Kanoh et al.16 These processes go along with a continuous decrease in the d001-spacing and a continuous monoclinic/hexagonal symmetry transition.
(10) Intercalation of mainly weakly bound Na+ into undefined sites between the MnO2-sheets or an overload of the monoclinic birnessite structure with Na+ which neither significantly affects the d001-spacing nor the polarizability of the respective vibrational modes.
It is noted that the reversible phase transition is a prerequisite for effective charge storage in this highly crystalline birnessite, as clearly seen in the CV curves in Fig. 6. This transition is reflected in the anodic peak A2 and the cathodic peak C2 in the CV-curve.
Several mechanisms for Na+-(de)intercalation into birnessite were already postulated. Most of them have in common the fact that they focus mainly on the variations of the d001-spacing which were explained by the (de)intercalation of Na-ions5,17,28 or hydrated Na-ions.5 In this regard, the current response in potential regions, where no variations in d001-spacing or changes in the Raman spectra were observed, was assigned to surface processes. In contrast, in the proposed mechanism in this work, the whole current response, even in potential regions (A1 and C3) where no changes in d001-spacing, as well as in the Raman spectra, occurred was ascribed to the (de)intercalation of Na-ions or protons/diffusion processes within the interlayer space. This assumption is based on the fact that surface processes should neither exhibit a diffusional limitation for the charge transfer (Fig. 5 and ESI,† Fig. S5) nor a pronounced sensitivity to the monoclinic hexagonal symmetry transition. Surely, a certain proportion of the charge will be stored on or close to the crystal surface also in our case. Nevertheless, the CV-curves depicted in Fig. 6 indicate only a very minor contribution of superficial processes. Furthermore, the proposed mechanism considers the role of protons which is under controversial discussion16,17,28 as well as the monoclinic/hexagonal symmetry transitions, which received very limited attention in most of the previously proposed charge storage mechanisms, and which was, to our knowledge, never assigned to a certain potential/redox peak(s).
Conclusions
The electrochemically driven (de)intercalation of Na-ions from/into birnessite has been studied by ex situ and in situ Raman spectroscopy and XRD. Using a set of well-defined, highly crystalline birnessites exhibiting either a monoclinic or a hexagonal symmetry, it is shown that the Raman spectra are highly sensitive to changes in the symmetry, and in the d100-spacing of the birnessite. Furthermore, it is also preliminarily suggested that even the β-angle and the c-value can be estimated based on the Raman spectra. At the heart of this analysis is a novel means of normalization of the Raman spectra, allowing for a direct quantitative comparison between Raman spectra measured for different materials and samples. Based on the data, a detailed description of the charge–discharge mechanism of Na-bir is presented. Furthermore, our observations indicate the necessity for the monoclinic/hexagonal phase transition in the course of a charge/discharge cycle which gives access to the “full” electrochemical performance/capacity of birnessite. The analysis means described in this paper is generic in nature, and will be followed by the corresponding investigations of other birnessites carrying other charge-balancing ions.Author contributions
Philipp Scheitenberger: conceptualization, data curation, formal analysis, investigation, methodology and writing of the initial draft. Sylvain Brimaud: co-supervision and review and editing of the manuscript. Mika Lindén: supervision, project administration, funding acquisition, and review and editing of the manuscript.Conflicts of interest
There are no conflicts to declare.Acknowledgements
The authors wish to thank Christian Baur for conducting the Pawley profile fit (Helmholtz-Institut Ulm), Thomas Diemant for XPS measurements (Institut für Oberflächenchemie und Katalyse, University Ulm), Margit Lang for ICP-AES measurements (Insitut für analytische und bioanalytische Chemie, University Ulm), Samuel Blessing for XRD measurements, and Lionel Kroner for TGA measurements (Institut of Inorganic Chemistry II, University Ulm).References
- L. Athouël, R. Dugas and O. Crosnier, J. Phys. Chem. C, 2008, 7270–7277 CrossRef.
- M. Toupin, T. Brousse and D. Bélanger, Chem. Mater., 2004, 16, 3184–3190 CrossRef CAS.
- S. Komaba, A. Ogata and T. Tsuchikawa, Electrochem. Commun., 2008, 10, 1435–1437 CrossRef CAS.
- C. Tanggarnjanavalukul, N. Phattharasupakun, J. Wutthiprom, P. Kidkhunthod and M. Sawangphruk, Electrochim. Acta, 2018, 273, 17–25 CrossRef CAS.
- X. Shan, F. Guo, D. S. Charles, Z. Lebens-Higgins, S. Abdel Razek, J. Wu, W. Xu, W. Yang, K. L. Page, J. C. Neuefeind, M. Feygenson, L. F. J. Piper and X. Teng, Nat. Commun., 2019, 10, 1–11 CrossRef PubMed.
- C. Vaalma, G. A. Giffin, D. Buchholz and S. Passerini, J. Electrochem. Soc., 2016, 163, A1295–A1299 CrossRef CAS.
- R. Y. Ang Gao, M. Li, N. Guo, D. Qiu, Y. Li, S. Wang, X. Lu and F. Wang, Adv. Energy Mater., 2019, 9, 1802739 CrossRef.
- X. Wu, D. P. Leonard and X. Ji, Chem. Mater., 2017, 29, 5031–5042 CrossRef CAS.
- H. Xia, X. Zhu, T. Chen, L. Gu, J. Liu, Q. Liu, S. Lan and Y. S. Meng, Nat. Commun., 2018, 9, 1–10 CrossRef PubMed.
- P. Le Goff, J. Mater. Chem., 1994, 4, 875–881 RSC.
- J. E. Post and D. R. Veblen, Am. Mineral., 1990, 75, 477–489 CAS.
- C. L. Lopano, P. J. Heaney, J. E. Post, J. Hanson and S. Komarneni, Am. Mineral., 2007, 92, 380–387 CrossRef CAS.
- B. Lanson, V. A. Drits, Q. Feng and A. Manceau, Am. Mineral., 2002, 87, 1662–1671 CrossRef CAS.
- C. R. Fleeger, P. J. Heaney and J. E. Post, Am. Mineral., 2013, 98, 671–679 CrossRef CAS.
- J. E. Post, P. J. Heaney and J. Hanson, Powder Diffr., 2002, 17, 218–221 CrossRef CAS.
- H. Kanoh, W. Tang, Y. Makita and K. Ooi, Langmuir, 1997, 13, 6845–6849 CrossRef CAS.
- Q. Zhang, M. D. Levi, Q. Dou, Y. Lu, Y. Chai, S. Lei, H. Ji, B. Liu, X. Bu, P. Ma and X. Yan, Adv. Energy Mater., 2018, 9, 1–10 Search PubMed.
- O. Ghodbane, J. L. Pascal and F. Favier, ACS Appl. Mater. Interfaces, 2009, 1, 1130–1139 CrossRef CAS PubMed.
- S. Franger, S. Bach, J. Farcy, J. P. Pereira-Ramos and N. Baffier, J. Power Sources, 2002, 109, 262–275 CrossRef CAS.
- Y.-K. Hsu, Y.-C. Chen, Y.-G. Lin, L.-C. Chen and K.-H. Chen, Chem. Commun., 2011, 47, 1252–1254 RSC.
- F. T. Ling, P. J. Heaney, J. E. Post and X. Gao, Chem. Geol., 2015, 416, 1–10 CrossRef CAS.
- E. Silvester, A. Manceau and V. A. Drits, Am. Mineral., 1997, 82, 962–978 CAS.
- M. C. Spitale, A. Dias and R. G. Sa, Mater. Res. Bull., 2008, 43, 1528–1538 CrossRef.
- C. M. Julien, M. Massot and C. Poinsignon, Spectrochim. Acta, Part A, 2004, 60, 689–700 CrossRef CAS.
- A. Manceau, V. A. Drits, E. Silvester, C. Bartoli and B. Lanson, Am. Mineral., 1997, 82, 1150–1175 CAS.
- A. Manceau, D. Bonnin, W. E. E. Stone and J. Sanz, Phys. Chem. Miner., 1990, 17, 363–370 CrossRef CAS.
- C. Julien, M. Massot, R. Baddour-Hadjean, S. Franger, S. Bach and J. P. Pereira-Ramos, Solid State Ionics, 2003, 159, 345–356 CrossRef CAS.
- L. Yang, S. Cheng, J. Wang, X. Ji, Y. Jiang, M. Yao, P. Wu, M. Wang, J. Zhou and M. Liu, Nano Energy, 2016, 30, 293–302 CrossRef CAS.
- S. Ziller, J. F. Von Bülow, S. Dahl and M. Lindén, Dalton Trans., 2017, 46, 4582–4588 RSC.
- D. Chen, D. Ding, X. Li, G. H. Waller, X. Xiong, M. A. El-Sayed and M. Liu, Chem. Mater., 2015, 27, 6608–6619 CrossRef CAS.
- Y.-K. Hsu, Y.-C. Chen, Y.-G. Lin, L.-C. Chen and K.-H. Chen, Chem. Commun., 2011, 47, 1252–1254 RSC.
- H. An, Z. Chen, J. Yang, Z. Feng, X. Wang, F. Fan and C. Li, J. Catal., 2018, 367, 53–61 CrossRef CAS.
- L. Yang, S. Cheng, X. Ji, Y. Jiang, J. Zhou and M. Liu, J. Mater. Chem. A, 2015, 3, 7338–7344 RSC.
- J. F. Von Bülow, H. L. Zhang and D. E. Morse, Adv. Energy Mater., 2012, 2, 309–315 CrossRef.
- A. Paolone, A. Sacchetti, T. Corridoni, P. Postorino, R. Cantelli, G. Rousse and C. Masquelier, Solid State Ionics, 2004, 170, 135–138 CrossRef CAS.
- D. Alburquenque, L. Troncoso, J. C. Denardin, A. Butera, K. D. Padmasree, J. Ortiz, F. Herrera, J. F. Marco and J. L. Gautier, J. Alloys Compd., 2016, 672, 307–316 CrossRef CAS.
- E. Beyreuther, S. Grafström, L. M. Eng, C. Thiele and K. Dörr, Phys. Rev. B: Condens. Matter Mater. Phys., 2006, 73, 1–9 CrossRef.
- A. C. Gaillot, D. Flot, V. A. Drits, A. Manceau, M. Burghammer and B. Lanson, Chem. Mater., 2003, 15, 4666–4678 CrossRef CAS.
- G. S. Pawley, Comput. Programs, 1980, 13, 630–633 CAS.
- H. Boumaiza, A. Renard, M. Rakotomalala Robinson, G. Kervern, L. Vidal, C. Ruby, L. Bergaoui and R. Coustel, J. Solid State Chem., 2019, 272, 234–243 CrossRef CAS.
- E. Goikolea, B. Daffos, P. L. Taberna and P. Simon, Mater. Renew. Sustain. Energy, 2013, 2, 1–8 Search PubMed.
- C. Choi, D. S. Ashby, D. M. Butts, R. H. DeBlock, Q. Wei, J. Lau and B. Dunn, Nat. Rev. Mater., 2020, 5, 5–19 CrossRef.
- Y. Jiang, S. Tan, Q. Wei, J. Dong, Q. Li, F. Xiong, J. Sheng, Q. An and L. Mai, J. Mater. Chem. A, 2018, 6, 12259–12266 RSC.
- V. Augustyn, P. Simon and B. Dunn, Energy Environ. Sci., 2014, 7, 1597 RSC.
- Q. Li, X. Sun and Y. Mao, RSC Adv., 2013, 3, 24886–24890 RSC.
- E. Flores, N. Vonrüti, P. Novák, U. Aschauer and E. J. Berg, Chem. Mater., 2018, 30, 4694–4703 CrossRef CAS.
- X. Sun, V. Duffort, B. L. Mehdi, N. D. Browning and L. F. Nazar, Chem. Mater., 2016, 28, 534–542 CrossRef CAS.
Footnote |
| † Electronic supplementary information (ESI) available. See DOI: 10.1039/d1ma00161b |
| This journal is © The Royal Society of Chemistry 2021 |