 Open Access Article
Tailored porous carbons enabled by persistent micelles with glassy cores†
Eric R.
Williams
 a,
Paige L.
McMahon
a,
Joseph E.
Reynolds
III
b,
Jonathan L.
Snider
a,
Paige L.
McMahon
a,
Joseph E.
Reynolds
III
b,
Jonathan L.
Snider
 b,
Vitalie
Stavila
 b,
Mark D.
Allendorf
 b and
Morgan
Stefik
 *a
*a
aDepartment of Chemistry and Biochemistry, University of South Carolina, 541 Main St., Columbia, SC 29208, USA. E-mail: morgan@stefikgroup.com
bSandia National Laboratory, Livermore, CA 94551, USA
First published on 1st June 2021
Abstract
Porous nanoscale carbonaceous materials are widely employed for catalysis, separations, and electrochemical devices where device performance often relies upon specific and well-defined regular feature sizes. The use of block polymers as templates has enabled affordable and scalable production of diverse porous carbons. However, popular carbon preparations use equilibrating micelles which can change dimensions in response to the processing environment. Thus, polymer methods have not yet demonstrated carbon nanomaterials with constant average template diameter and tailored wall thickness. In contrast, persistent micelle templates (PMTs) use kinetic control to preserve constant micelle template diameters, and thus PMT has enabled constant pore diameter metrics. With PMT, the wall thickness is independently adjustable via the amount of material precursor added to the micelle templates. Previous PMT demonstrations relied upon thermodynamic barriers to inhibit chain exchange while in solution, followed by rapid evaporation and cross-linking of material precursors to mitigate micelle reorganization once the solvent evaporated. It is shown here that this approach, however, fails to deliver kinetic micelle control when used with slowly cross-linking material precursors such as those for porous carbons. A new modality for kinetic control over micelle templates, glassy-PMTs, is shown using an immobilized glassy micelle core composed of polystyrene (PS). Although PS based polymers have been used to template carbon materials before, all prior reports included plasticizers that prevented kinetic micelle control. Here the key synthetic conditions for carbon materials with glassy-PMT control are enumerated, including dependencies upon polymer block selection, block molecular mass, solvent selection, and micelle processing timeline. The use of glassy-PMTs also enables the direct observation of micelle cores by TEM which are shown to be commensurate with template dimensions. Glassy-PMTs are thus robust and insensitive to material processing kinetics, broadly enabling tailored nanomaterials with diverse chemistries.
Introduction
Prolific in functional nanomaterials are the porous carbons whose high surface areas with tunable nanoscale pore sizes and naturally low densities lend themselves well to a variety of applications spanning from adsorption1–5 to separations,6–8 catalysis,9,10 and energy conversion and storage.11–13 The direct assembly14–17 of amphiphilic block polymer templates with carbon precursors affords a robust self-assembled product with ordered periodicity through low-cost reagents. These carbon precursors are often based upon the polymerization of phenol7,18,19 and related analogs,7,19–21 which are able to be crosslinked and have a high carbon yield following carbonization.16 Generally, the block polymers contain a poly(ethylene oxide)(PEO) or other hydrogen bonding polymer block to enable selective interaction with the carbon precursors. Simultaneously, the non-interacting (usually hydrophobic) polymer block phase separates from the material-PEO domain to form discrete hydrophobic regions. A subsequent heat treatment rigidifies the carbon precursors and pyrolysis then carbonizes the precursors and removes the block polymer template to yield ordered porosity.22,23 The carbonization temperature is well known to determine the extent of graphitization.24–26The pluronic family of block polymers are popular templates due to commercial availability, though their low molecular mass limits the achievable feature size. In contrast, custom-synthesized block polymers enable much larger feature sizes through increased hydrophobic block molecular mass.27 A wide range of nanoscale porous carbons have been prepared using these and similar polymers to yield pore sizes ranging from 3.8 to 108 nm.28,29 Many custom block polymers are not directly soluble in alcohols and are thus processed from THF or other good solvents for both the polymer blocks and the carbon precursors. While convenient, this class of good-solvent approaches generally leads to dynamic micelles that change size in response to the specific solution conditions. From a materials perspective, this means that the feature dimensions (e.g., pores and walls) both change simultaneously with any recipe changes. Prior reports demonstrate this phenomenon where altering the amount of material precursors changes both the pore size and wall thickness30–33 and sometimes also leads to morphology changes.32,34–38 These are natural limitations of equilibration-based synthesis approaches where all aspects of the architecture are determined through free-energy minimization. While recent porous carbon reports have added diversity to carbon precursor chemistry,4,7,39,40 block polymer chemistries,29,41 feature sizes,29,42–44 and morphologies,43,45 none yet have demonstrated carbon materials with constant polymer template dimensions irrespective of the amount of material added.
Persistent micelle templates (PMTs) are uniquely based upon kinetically controlled micelles which enable the production of porous material series with constant pore size and varied wall thickness. The suppression of chain exchange mechanisms are needed to preserve constant micelle template diameter with an invariant micelle aggregation number. Furthermore, the use of a constant micelle template also enables isomorphic sample series where transitions to bulk phases (spheres, cylinders, lamellae etc.) are prevented. Thus, changing the amount of material precursors relative to the amount of persistent micelle templates (material:template ratio) enables the production of isomorphic (constant morphology) sample series with constant template dimensions and monotonically varied wall thickness.46 In contrast, monomicelle routes47,48 rather react material precursors around dispersed and likely-equilibrating micelles to form a stable intermediate for later assembly and have not yet demonstrated independent wall thickness control. Prior demonstration of PMT used a large thermodynamic barrier (χN) to inhibit chain exchange between micelles and thus preserve kinetic control of the template dimension. Here, the effective interaction parameter χ is a largely enthalpic term corresponding to the interface of the solvent and the core block. In prior PMT examples, this χN barrier was adjusted based upon chain size,46 trace water content,46,49–52 or solvent selection.50 In all of the prior examples, porous transition metal oxides were prepared via sol–gel chemistry where the material precursors were rapidly cross-linked by a high temperature “aging” treatment within seconds of drying via spin/dip coating. It was shown there that rapid material crosslinking was critical to preserve kinetic control.49 In other words, there is a kinetic competition between the rates of material cross-linking and micelle reorganization. This limitation has thus far prevented the use of PMTs with slowly crosslinking material chemistries, such as those used for carbon materials. Here, we present a new modality for maintaining PMT control that does not rely upon a χN thermodynamic barrier, but rather uses an immobilized glassy core block to maintain kinetic control. Our unique solvent processing conditions remove all core block solvents from solution, effectively halting core mobility and prohibiting chain exchange. It will be shown that these glassy-PMTs significantly enhance the extent of micelle persistence, with templates lasting indefinitely under suitable conditions. Furthermore, demonstrations of PMT to date have relied upon statistical measurements of porous materials to infer the micelle template dimensions after processing. Here, we report the first direct observation of the PMT mechanism with TEM images of glassy-PMTs as well as materials prepared therefrom. Glassy-PMTs maintain constant micelle core size after solvent removal for TEM whereas prior non-glassy PMTs could re-equilibrate following solvent removal. Additionally, a series of glassy-PMT design guidelines will be presented which also highlight why prior studies using e.g., PEO-b-PS14,38,42,53 and PEO-b-PMMA54 exhibited wide simultaneous variance of both pore and wall dimensions despite the apparent inclusion of a glassy core block.
Experimental reagents
Anhydrous, inhibitor-free THF (>99.9%, Fisher), phloroglucinol (99+%, anhydrous, Acros), N,N′-dicyclohexylcarbodiimide (DCC) (99%, BeanTown Chemical) and Cu(I) Br (99%, Aldrich) were all stored in an argon glovebox and used as received. Formaldehyde (37 wt% in water stabilized with 7–8% methanol, Fisher) and styrene monomer (99%, Acros) were stored inside a refrigerator until use as received. Styrene monomer was passed over a basic alumina column prior to use to remove inhibitor. Concentrated hydrochloric acid (37 wt% ACS grade, VWR), 4-dimethylaminopyridine (DMAP) (99%, TCI Chemicals), the ligand N,N,N′,N′′,N′′-pentamethyldiethylenetriamine (PMDETA) (99%, Sigma), 2-bromopropionic acid (98%, Alfa Aesar) and Cu(II) Br (99%, Aldrich) were all used as received. Poly(ethylene glycol) methyl ether (PEO) Mn 5000 g mol−1 (Sigma) and Mn 2000 g mol−1 (Alfa Aesar) were used as received. Hexanes (>98.5%, Fisher), methanol-free chloroform (99%, Aldrich), HPLC grade isopropyl alcohol (>99.9%, Honeywell), dimethyl sulfoxide (99.7%, Fisher), deionized water (ACS grade, Alfa Aesar) and 22-gauge copper wire (McMaster-Carr) were all used as received. Ethanol (200 proof, Deacon Labs) was stored over 50 w/w% molecular sieves (3 Å, 8–12 mesh, Acros Organics) for one week prior to use.55Synthesis of PEO–Br macroinitiator
A Steglich esterification was used to produce a macroinitiator for atom transfer radical polymerization (ATRP). A typical synthesis involved the dissolution of 20 g of 5000 g mol−1 (4.00 mmol) PEO methyl ether in 100 mL of chloroform. Next, 0.720 mL (8.00 mmol) of 2-bromopropionic acid was added dropwise with stirring. The flask was then chilled with an ice water bath for 10 minutes prior to the addition of 1.65 g (8.0 mmol) of DCC and 0.391 g (3.20 mmol) of DMAP. The flask was then allowed to stir for another 10 minutes before the ice bath was removed. The reaction was then stirred at room temperature for 24 hours. Next, the crude reaction mixture was gravity filtered through a Whatman 2 V filter paper with a diameter of 270 mm to remove the urea by-product. The solid by-product was then discarded, and the macroinitiator filtrate was then precipitated in 500 mL of hexanes by a dropwise addition. The solid product was collected and allowed to dry in a vacuum chamber without heat overnight prior to further purification. The product was then dissolved in 100 mL of chloroform and shook gently with an equal volume of deionized water to remove the urea by-product. This process was repeated for a total of three times. The chloroform was then removed by evaporation under reduced pressure.Synthesis of OS1
The PEO-b-PS diblock was prepared by ATRP using the following molar ratios: PEO–Br![[thin space (1/6-em)]](https://www.rsc.org/images/entities/char_2009.gif) :
:![[thin space (1/6-em)]](https://www.rsc.org/images/entities/char_2009.gif) PMDETA
PMDETA![[thin space (1/6-em)]](https://www.rsc.org/images/entities/char_2009.gif) :
:![[thin space (1/6-em)]](https://www.rsc.org/images/entities/char_2009.gif) Cu(I)Br
Cu(I)Br![[thin space (1/6-em)]](https://www.rsc.org/images/entities/char_2009.gif) :
:![[thin space (1/6-em)]](https://www.rsc.org/images/entities/char_2009.gif) Styrene of 1
Styrene of 1![[thin space (1/6-em)]](https://www.rsc.org/images/entities/char_2009.gif) :
:![[thin space (1/6-em)]](https://www.rsc.org/images/entities/char_2009.gif) 1.125
1.125![[thin space (1/6-em)]](https://www.rsc.org/images/entities/char_2009.gif) :
:![[thin space (1/6-em)]](https://www.rsc.org/images/entities/char_2009.gif) 1.125
1.125![[thin space (1/6-em)]](https://www.rsc.org/images/entities/char_2009.gif) :
:![[thin space (1/6-em)]](https://www.rsc.org/images/entities/char_2009.gif) 200. Styrene monomer was passed over a basic alumina column immediately prior to use to remove inhibitor. In a 100 mL round-bottom flask, 13.75 mL (120 mmol) of styrene was added to 3.00 g of the previously synthesized PEO–Br macroinitiator and sealed with a rubber septum. The solution was then sparged with nitrogen for 20 minutes to displace dissolved oxygen in solution. In an argon glovebox, 96.8 mg (0.675 mmol) of Cu(I)Br was combined with 140.9 μL (0.675 mmol) of PMDETA. This mixture was transferred, via an airtight stoppered syringe, to the reaction flask and added via injection through the rubber septum to initiate the polymerization. The reaction was then placed in a preheated oil bath at 110 °C and allowed to proceed until the solution became sufficiently viscous to arrest the stir bar, this took approximately 6 hours. The flask was then placed in the freezer for 3 h before exposure to air. The product was dissolved in THF and passed over a column of basic alumina to remove copper complexes. The majority of THF was then removed by rotary evaporation to yield a highly viscous liquid. The product was then precipitated in 500 mL of methanol at −78 °C (achieved with a dry ice acetone bath) and collected by gravity filtration. The product was then dried under vacuum prior to characterization.
200. Styrene monomer was passed over a basic alumina column immediately prior to use to remove inhibitor. In a 100 mL round-bottom flask, 13.75 mL (120 mmol) of styrene was added to 3.00 g of the previously synthesized PEO–Br macroinitiator and sealed with a rubber septum. The solution was then sparged with nitrogen for 20 minutes to displace dissolved oxygen in solution. In an argon glovebox, 96.8 mg (0.675 mmol) of Cu(I)Br was combined with 140.9 μL (0.675 mmol) of PMDETA. This mixture was transferred, via an airtight stoppered syringe, to the reaction flask and added via injection through the rubber septum to initiate the polymerization. The reaction was then placed in a preheated oil bath at 110 °C and allowed to proceed until the solution became sufficiently viscous to arrest the stir bar, this took approximately 6 hours. The flask was then placed in the freezer for 3 h before exposure to air. The product was dissolved in THF and passed over a column of basic alumina to remove copper complexes. The majority of THF was then removed by rotary evaporation to yield a highly viscous liquid. The product was then precipitated in 500 mL of methanol at −78 °C (achieved with a dry ice acetone bath) and collected by gravity filtration. The product was then dried under vacuum prior to characterization.
Synthesis of OS2
The small PEO-b-PS diblock was prepared via a radically deactivated reversible polymerization route (RDRP) route56 using the following conditions PEO–Br![[thin space (1/6-em)]](https://www.rsc.org/images/entities/char_2009.gif) :
:![[thin space (1/6-em)]](https://www.rsc.org/images/entities/char_2009.gif) PMDETA
PMDETA![[thin space (1/6-em)]](https://www.rsc.org/images/entities/char_2009.gif) :
:![[thin space (1/6-em)]](https://www.rsc.org/images/entities/char_2009.gif) Cu(II)Br
Cu(II)Br![[thin space (1/6-em)]](https://www.rsc.org/images/entities/char_2009.gif) :
:![[thin space (1/6-em)]](https://www.rsc.org/images/entities/char_2009.gif) Styrene of 1
Styrene of 1![[thin space (1/6-em)]](https://www.rsc.org/images/entities/char_2009.gif) :
:![[thin space (1/6-em)]](https://www.rsc.org/images/entities/char_2009.gif) 0.05
0.05![[thin space (1/6-em)]](https://www.rsc.org/images/entities/char_2009.gif) :
:![[thin space (1/6-em)]](https://www.rsc.org/images/entities/char_2009.gif) 0.36
0.36![[thin space (1/6-em)]](https://www.rsc.org/images/entities/char_2009.gif) :
:![[thin space (1/6-em)]](https://www.rsc.org/images/entities/char_2009.gif) 30. A volume of 3.43 mL (30.0 mmol) of inhibitor-free styrene was added to 2.00 g (1.00 mmol) of 2000 g mol−1 PEO–Br macroinitiator (prepared with identical molar ratio and procedure as the 5000 g mol−1 used previously) along with 3.43 mL of isopropyl alcohol in a 50 mL round-bottom flask. A 5 cm length of copper wire was activated by submerging in 37 wt% HCl, along with a stir bar, for 10 minutes. The wire was then wrapped around the stir bar in such a way as to secure it during normal stirring. An aliquot of 56 μL (0.050 mmol) of Cu(II)Br was taken from a 200 mg mL−1 aqueous stock solution and added to the reaction flask. The mixture was sparged with nitrogen for 20 minutes to displace dissolved oxygen. Then, 72 μL of PMDETA was delivered via needle and syringe through the rubber septum and the reaction mixture placed in a preheated oil bath at 60 °C. The reaction was allowed to progress for 12 h until becoming sufficiently viscous. The reaction flask was then placed in the freezer for 3 hours before exposure to air. The product was dissolved in THF and passed over a column of basic alumina to remove copper complexes. The product was then dialyzed against pure THF for a total of 48 hours with solvent exchange after the first 4, 18, and 24 hours, respectively.
30. A volume of 3.43 mL (30.0 mmol) of inhibitor-free styrene was added to 2.00 g (1.00 mmol) of 2000 g mol−1 PEO–Br macroinitiator (prepared with identical molar ratio and procedure as the 5000 g mol−1 used previously) along with 3.43 mL of isopropyl alcohol in a 50 mL round-bottom flask. A 5 cm length of copper wire was activated by submerging in 37 wt% HCl, along with a stir bar, for 10 minutes. The wire was then wrapped around the stir bar in such a way as to secure it during normal stirring. An aliquot of 56 μL (0.050 mmol) of Cu(II)Br was taken from a 200 mg mL−1 aqueous stock solution and added to the reaction flask. The mixture was sparged with nitrogen for 20 minutes to displace dissolved oxygen. Then, 72 μL of PMDETA was delivered via needle and syringe through the rubber septum and the reaction mixture placed in a preheated oil bath at 60 °C. The reaction was allowed to progress for 12 h until becoming sufficiently viscous. The reaction flask was then placed in the freezer for 3 hours before exposure to air. The product was dissolved in THF and passed over a column of basic alumina to remove copper complexes. The product was then dialyzed against pure THF for a total of 48 hours with solvent exchange after the first 4, 18, and 24 hours, respectively.
Polymer characterization
The molar mass of PS and molar mass dispersity (Đ) of all polymers were determined using nuclear magnetic resonance (NMR) spectroscopy and gel permeation chromatography (GPC), respectively. All proton NMR (1H NMR) spectra were measured using a Bruker Avance III HD 300. All GPC data were collected using a Waters gel permeation chromatography GPC instrument equipped with a 515 HPLC pump, a 2410 refractive index detector and three styragel columns (HR1, HR3, and HR4) in the effective molecular weight range of 0.1–5, 0.5–30, and 5–600 kg mol−1, respectively. The eluent used was THF at a temperature of 30 °C and a flow rate of 1 mL min−1. The instrument was calibrated with polystyrene standards (2570, 1090, 579, 246, 130, 67.5, 34.8, 18.1, 10.4, 3.4, and 1.6 kg mol−1) received from Polymer Laboratories. The GPC samples were prepared by dissolution in THF with a concentration of ∼5 mg mL−1 and were filtered through a syringe filter with a pore diameter of 0.2 μm just prior to injection.F127–EtOH Micelle preparation
Owing to the weakly hydrophobic nature of F127, 1.00 g of this pluronic polymer was readily dispersed into 20 mL of solvent composed of 90 vol% EtOH (18 mL) and 10 vol% water (2 mL).OS1–THF Micelle preparation
First, 1.00 g of OS1 was dissolved in 10 mL of THF. Next, 10 mL of deionized water was added dropwise with stirring. A volume of 80 mL of EtOH was then added gradually.OS2–EtOH Micelle preparation
The polymer OS2 was directly dispersible in EtOH with agitation. Typically, 100 mg of OS2 was dispersed directly into 10 mL of EtOH.OS1–EtOH Micelle preparation
A typical preparation involved dissolving 1.00 g of OS1 in 10 mL of THF. Next, 10 mL of deionized water was added by dropwise addition with constant wrist stirring. Then 100 mL of EtOH was added gradually to increase the amount of non-solvent for PS. Lastly, the THF was selectively removed by rotary evaporation and the removed volume was replaced with EtOH to achieve a final micelle concentration of 30 mg mL−1 with a final composition of 90 vol% EtOH and 10 vol% water. Dynamic light scattering (DLS) measurements were performed on the polymer OS1 at each stage of the micelle preparation. The DLS measurements of the micelle hydrodynamic diameter were performed using a Zetasizer Nanoseries ZEN3690 instrument. Solutions for DLS were prepared with OS1 at a concentration of 10 mg mL−1 and were filtered through a 0.2 μm syringe filter prior to measuring. All measurements were performed three times to confirm measurement reproducibility. All DLS measurements were performed at 25 °C. For pure THF, a viscosity of 0.455 cP and refractive index of 1.405 were used. For solvent-water mixtures, the viscosities of 0.916, 0.784, 0.819 and refractive indices of 1.397, 1.366, and 1.362 were used for the 50/50 vol% THF/H2O, 80/10/10 vol% EtOH/THF/H2O, and 90/10 vol% EtOH/H2O, respectively.57,58Porous carbons
A stock solution of 100 mg mL−1 phloroglucinol was prepared by dissolving 1.0 g of phloroglucinol in 10 mL of EtOH. In a 20 mL scintillation vial, one of the above micelle solutions containing 50 mg of polymer was combined with the desired amount of phloroglucinol stock. This combined mixture was then diluted with the solvent mixture (90 vol% EtOH, 10 vol% H2O) to achieve a concentration of 25 mg mL−1 for the sum of material precursors and template masses (M + T) with respect to the total solution volume. The appropriate amount of 37 wt% HCl was added such that the final concentration of HCl was 10 μL per mL of total solution. Next, the appropriate amount of formaldehyde was delivered, and the reaction solution was inverted a few times and allowed to react unperturbed. A 1![[thin space (1/6-em)]](https://www.rsc.org/images/entities/char_2009.gif) :
:![[thin space (1/6-em)]](https://www.rsc.org/images/entities/char_2009.gif) 1 molar ratio of phloroglucinol
1 molar ratio of phloroglucinol![[thin space (1/6-em)]](https://www.rsc.org/images/entities/char_2009.gif) :
:![[thin space (1/6-em)]](https://www.rsc.org/images/entities/char_2009.gif) formaldehyde was used for all samples. After ∼18 hours, two distinct phases were visible: the lower cloudy phase corresponding to carbon precursors and micelles and an upper clear phase rich in solvent. The supernatant solvent layer was discarded by decantation, and the material-micelle phase dried under vacuum without heat (termed “as made”). The samples were further cross-linked (termed “aged”) by the addition of 0.5 mL of formaldehyde solution and heating at 80 °C for 48 h. The samples were carbonized under N2 atmosphere by heating at a ramp rate of 2 °C min−1 to 450 °C and were held at this temperature for 4 hours (termed “carbonized”).
formaldehyde was used for all samples. After ∼18 hours, two distinct phases were visible: the lower cloudy phase corresponding to carbon precursors and micelles and an upper clear phase rich in solvent. The supernatant solvent layer was discarded by decantation, and the material-micelle phase dried under vacuum without heat (termed “as made”). The samples were further cross-linked (termed “aged”) by the addition of 0.5 mL of formaldehyde solution and heating at 80 °C for 48 h. The samples were carbonized under N2 atmosphere by heating at a ramp rate of 2 °C min−1 to 450 °C and were held at this temperature for 4 hours (termed “carbonized”).
Small-angle X-ray scattering (SAXS)
Small-Angle X-ray Scattering measurements were performed at the South Carolina SAXS Collaborative using a SAXSLab Ganesha instrument. A Xenocs GeniX3D microfocus source was used with a Cu target to create a monochromatic beam with a wavelength of 0.154 nm. The instrument was calibrated prior to use with a National Institute of Standards and Technology (NIST) reference material 640d silicon powder, with a reference peak position of 2θ = 28.44°, where 2θ represents the total scattering angle. A Pilatus 300 K detector (Dectris) was used to collect the two-dimensional (2D) scattering pattern. The detector exhibits a nominal pixel dimension of 172 × 172 μm2. The SAXS data was acquired with an X-ray flux of ∼4.1 million photons per second incident upon the sample and with a sample-to-detector distance of 1040 mm. The 2D images were azimuthally integrated to yield the scattering vector intensity. Peak positions were fitted using custom MATLAB software. SAXS simulations were conducted using SASFit.Transmission electron microscopy (TEM)
Electron microscopy images were collected in bright-field imaging mode using a JEOL 1400 Plus Transmission Electron Microscope with an accelerating voltage of 120 keV. Cryoultramicrotomy was performed using a Leica UC7/FC7 cryo-ultramicrotome at −55 °C using a eutectic mixture of DMSO and water. Coarse sample cuts were performed using a freshly cut-glass edge with ∼1 mm being removed before sectioning. Sectioning was performed with a diamond blade with a nominal sample thickness of 60 nm. The floating sections were transferred to bare copper grids. The micelles themselves were imaged by placing a 20 μL drop at 10 mg mL−1 concentration onto a carbon coated grid and allowing the sample to sit unperturbed for 10 min. Staining was performed by adding a 20 μL drop of 1 wt% aqueous uranyl acetate solution and wicking the grid dry after 10 min.BET porosity measurements
Gas sorption isotherms were measured with an Autosorb iQ (Quantachrome Inc., USA) gas sorption system with N2 (Matheson, 99.999% purity) as the probe gas. Prior to measurement, samples were evacuated under dynamic vacuum at 300 °C for a minimum of 2 hours and free-space correction measurements were performed with He gas (Matheson, 99.999% purity). All N2 isotherms were collected at 77 K using a liquid N2 bath in the pressure range from 0–1 bar. The specific surface area was determined using a multi-point Brunauer–Emmett–Teller (BET) method in the pressure range between 0.05–0.20P/P0. Pore size distribution was determined by application of the Barrett–Joyner–Halenda (BJH) method to the adsorption portion of the N2 isotherm. Total pore volume (Vt) was calculated at the relative pressure of ∼0.99P/P0.Differential scanning calorimetry measurements
DSC measurements were performed on a Hitachi DSC7020 with two cycles ranging from 0 °C to 150 °C at a heating and cooling rate of 10 °C min−1 in a nitrogen atmosphere. Samples were prepared in a crimped aluminium pan.Results and discussion
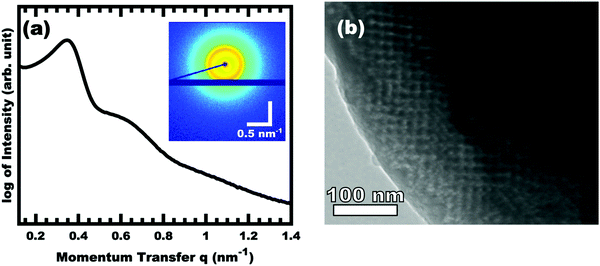
The control of micelle size through suppression of chain exchange is key to fabricating tailored nanostructures with independent tunability of pore and wall dimensions. All prior PMT examples46,49–52 relied upon a χN thermodynamic barrier to inhibit chain exchange between micelles in solution as well as rapid thermal crosslinking of the material precursors directly after evaporation. However, the slowly cross-linking nature of carbon materials chemistry necessitates the development of a template with significantly enhanced degrees of persistence within a micelle-material rich environment. Within the context of block polymer micelles, the use of a glassy core block is known to suppress micelle core mobility59,60 and halt chain exchange.61,62 Such glassy core micelles would be the most deeply trapped PMT modality to date. Although glassy-PMTs would offer many benefits towards nanomaterial synthesis, the implementation of glassy-PMTs, however, is non-trivial where the solvent selection, solvent path dependence, and polymer molar mass each play critical roles, vide infra. An example dataset from a single condition is presented first before comparing different sample conditions. Fig. 1 shows the SAXS and TEM data for OS1–EtOH-1.00, named for using polymer OS1 processed from EtOH and having M:T = 1.00. The TEM data is mostly consistent with a mixture of randomly packed spherical pores with regions of well-ordered domains. Hundreds of measurements were taken from the TEM images to yield statistically significant metrics (Fig. S6, ESI†). Here the pore size (light circles) was determined to be 10.80 nm and the wall thickness 9.07 nm (dark). The SAXS pattern features two isotropic scattering peaks with an approximate q-ratio of 1![[thin space (1/6-em)]](https://www.rsc.org/images/entities/char_2009.gif) :
:![[thin space (1/6-em)]](https://www.rsc.org/images/entities/char_2009.gif) 1.8, consistent with a randomly packed arrangement of spheres (Fig. S5, ESI†). The inset 2D SAXS pattern was isotropic, indicating a lack of preferred alignment as expected for a randomly ordered sample precipitated from solution. The d-spacing (2π/q) for the first intensity maximum was 19.32 nm, similar to the sum of the pore size and wall thickness. This correlation is subsequently used to infer PMT behavior for sample series where prior modelling established a relationship between d-spacing and the material to template (M:T) ratio.
1.8, consistent with a randomly packed arrangement of spheres (Fig. S5, ESI†). The inset 2D SAXS pattern was isotropic, indicating a lack of preferred alignment as expected for a randomly ordered sample precipitated from solution. The d-spacing (2π/q) for the first intensity maximum was 19.32 nm, similar to the sum of the pore size and wall thickness. This correlation is subsequently used to infer PMT behavior for sample series where prior modelling established a relationship between d-spacing and the material to template (M:T) ratio.
Nanostructured carbon from a pluronic polymer
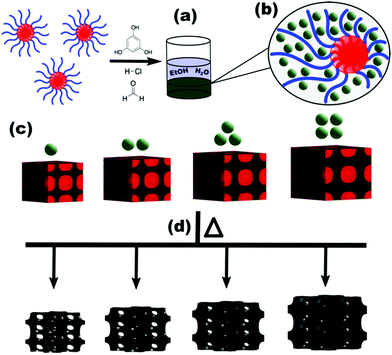
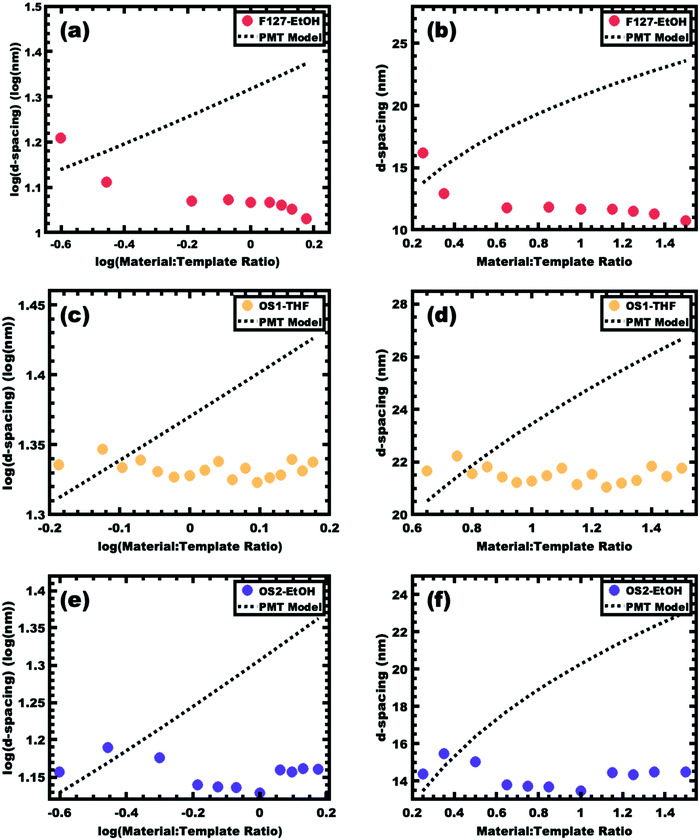
The prototypical use of poly(ethylene oxide-b-propylene oxide-b-ethylene oxide) (PEO-b-PPO-b-PEO, F127) as a template for carbon precursors is examined first. Here PPO is the hydrophobic block that forms the micelle core in typical aqueous and alcoholic solutions. The −60 °C Tg of PPO63 is well below room temperature where the corresponding micelle chains have considerable mobility under normal processing conditions. Furthermore, the typical alcohol-rich solutions used with F127 and analogs are good solvents for PPO. This implies a very low effective interaction parameter, χ, between the core block and the solvent, leading to relatively high chain exchange rates between micelles and facilitating a diverse range of bulk morphologies depending on the amount of material precursors.64,65 Carbon precursors are often templated by phase separation from a solution where the arrangement of spherical micelles is frequently preserved7,17 (Scheme 1). Prior works have widely varied such procedures with F127 where both pore and wall dimensions tend to vary simultaneously.32,37Fig. 2a and b presents the SAXS trends from sample series F127–EtOH where the d-spacing monotonically decreases with increasing M:T ratios. This material addition naturally increases the volume fraction of the walls however the SAXS lattice contraction indicates that this wall change is more than compensated for by a decrease in pore size throughout the series. In contrast, we previously reported a PMT model46 that quantitatively predicts lattice expansion as materials are added between persistent micelles. Here the corresponding lattice dimension is simple to track via SAXS measurement of d-spacing where d = 2π/q and q is the position of the first structure factor peak. The model predicts a quasi-cube-root dependence for d-spacing vs. M:T ratio based upon a simple conservation of volume argument.49 Later it was shown that a convenient log simplification of this model enables validation of SAXS data consistency with PMT behavior from SAXS data alone. Here the PMT model predicts a straight line with a slope of 1/3 in this log–log coordinate space.50 One advantage of this log–log approach is that consistency of the data with PMT behavior may be assessed prior to real space measurements with electron microscopy. This approach also identifies the M:T range of the PMT window (if applicable) prior to fitting. Thus the decreasing d-spacing with M:T for the F127–EtOH SAXS data (Fig. 2a and b) is prototypical evidence of dynamic micelles (not PMT behavior) where both the pore size and wall thickness change simultaneously. This gives rise to glassy-PMT design guideline (1): the polymer block residing in the micelle core must have a Tg above the processing temperatures, including any subsequent thermal cross-linking of the material precursors.Nanostructured carbon from PEO-b-PS and single solvent routes
The simple inclusion of a high Tg polymer block to the micelle core, however, does not guarantee persistent micelle behavior. Indeed, none of the porous carbon reports using micelles with high-Tg blocks were consistent with PMT behavior. These reports14,38,42,53,54 used poly(ethylene oxide-b-styrene) (PEO-b-PS) and poly(ethylene oxide-b-methyl methacrylate) (PEO-b-PMMA) where PS and PMMA have Tg's of ~90 and 105 °C, respectively.66–68 Several PEO-b-PS block polymers were synthesized to evaluate possible factors leading to these behaviors (Table 1). The above-mentioned reports all used THF as a processing solvent. This is convenient since THF is a good solvent for PEO, PS, and PMMA and is thus able to directly dissolve these block polymers. Such good solvents, however, are also able to plasticize polymer domains that would otherwise be glassy. This possibility was examined using a custom synthesized PEO-b-PS polymer termed OS1 (Table 1), which was confirmed by DSC to have a glass transition temperature of 99.1 °C (Fig. S2a, ESI†). Micelles of OS1 were prepared in a mixture with 80 vol% EtOH, 10 vol% water, and 10 vol% THF. Here the only good solvent for PS (THF) is present as a minority. Please note that OS1 is not directly dispersible in the mentioned solvent mixture, but rather had to be dissolved in THF initially and gradually brought dropwise towards the final solvent composition. This observation suggests that unimers are not dispersible in this solvent mixture since micelles are not able to be directly formed. Such a lack of unimer exchange would indeed cause OS1 micelles to be persistent in this solvent mixture. A series of samples were prepared as previously described where the M:T ratio was gradually swept from 0.65–1.65. An excerpt from the data series is shown in Table 2. The corresponding SAXS d-spacing trends are shown in Fig. 2c and d. These data show that the d-spacing is relatively constant with increasing M:T ratio which is not consistent with the lattice expansion that is fundamental to the PMT model. Similar to the case with F127, this lack of lattice expansion suggests the presence of dynamic micelles (not PMT behavior) where further material additions lead to a decrease in micelle size thus yielding relatively constant lattice dimensions despite the shifting volume fractions of material and template. The notion of dynamic OS1 micelles here is perhaps surprising considering the noted lack of direct dispersibility for OS1 in this solvent mixture. It may be that the micelles undergo dynamic chain exchange after combining with the carbon precursors and phase separate from the solution. The resulting carbon-rich environment would be reasonably swollen by THF, giving rise to a reduced effective interaction parameter χ combined with plasticization of the PS core, enabling dynamic chain exchange between micelles. These observations led to glassy-PMT design guideline (2): glassy micelle cores require that plasticizing agents such as THF are not present when using the templates.| M:T Ratio | Mass OS1a (mg) | Total material mass (mg) | Phloroglucinol (mMoles) | Phloroglucinolb (mg) | Formaldehyde (mMoles) | Formaldehydec (mg) |
|---|---|---|---|---|---|---|
| a Delivered via a 30 mg mL−1 micelle stock solution. b Delivered via a 100 mg mL−1 phloroglucinol stock solution. c Delivered via 37 wt% formaldehyde solution (see Experimental section). | ||||||
| 0.75 | 60 | 45.00 | 0.28 | 36.34 | 0.28 | 8.65 |
| 0.90 | 60 | 54.00 | 0.34 | 43.61 | 0.34 | 10.38 |
| 1.00 | 60 | 60.00 | 0.38 | 48.46 | 0.38 | 11.54 |
| 1.10 | 60 | 66.00 | 0.42 | 53.30 | 0.42 | 12.69 |
| 1.25 | 60 | 75.00 | 0.48 | 60.57 | 0.48 | 14.42 |
| 1.40 | 60 | 84.00 | 0.53 | 67.84 | 0.53 | 16.15 |
The exclusion of plasticizers alone also does not guarantee persistent micelle behavior from PEO-b-PS or related polymers. Polymer OS2 was prepared to mimic the low molecular mass of common pluronic polymers such as F127 with the substitution of PPO with a PS block. Unlike OS1, OS2 was able to be directly dispersed in ethanol despite it being a traditional non-solvent for PS. A series of samples were prepared as previously described where the M:T ratio was gradually swept from 0.25–1.30 and the corresponding SAXS data are shown in Fig. 2e and f. These data do not show a monotonic increase of d-spacing with increasing M:T ratio but rather relatively constant values with some scatter. Again, this lack of monotonic lattice expansion is consistent with dynamic micelles despite the presence of a PS block and the absence of plasticizers. Two factors likely contribute towards this behavior. First, a polymer's selectivity towards non-solvents decreases as the molecular mass decreases. For example, styrene monomer itself is soluble in ethanol whereas >∼5000 g mol−1 PS is not. Second, the Tg of a polymer while constant for large molar masses is typically suppressed in the low molecular mass regime. The well-known Flory-Fox relationship quantifies the Tg decrease for low molar masses where for PS the Tg = 100–1.0 × 10⁵ M−1 °C, with M being the polymer molecular mass in g mol−1.66,67 This equation estimates the PS in OS2 to have a Tg of ∼−20 °C (Fig. S2b, ESI†). This molar mass, however, is below the range used to derive the model fit and the resulting estimate thus has additional uncertainty. Regardless, this estimation shows that the Tg can certainly decrease below the processing temperature. Both of these factors enhance the mobility of low molar mass PS chains and can reasonably facilitate dynamic chain exchange when the χN barrier to chain exchange is relatively low due to the low molecular mass. These considerations give rise to two additional glassy-PMT design guidelines: (3) the molecular mass of the intended glassy block must be sufficiently large to realize a suitable Tg value and (4) the block polymer must not be directly dispersible in the processing solvent. That is, the ability to directly disperse the block polymer in the processing solvent indicates that the intended glassy core block is plasticized and thus not glassy.
Nanostructured carbon from PEO-b-PS using a multi-step processing route
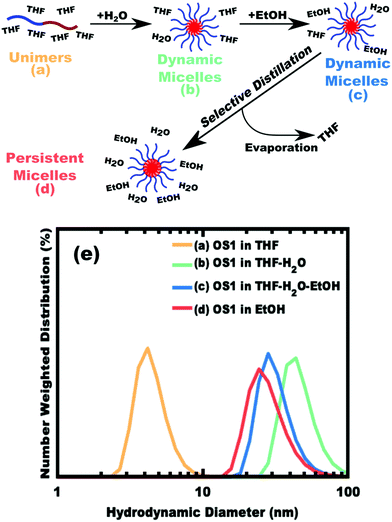
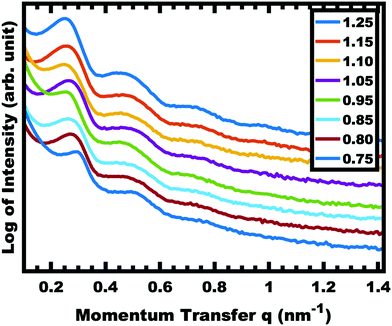
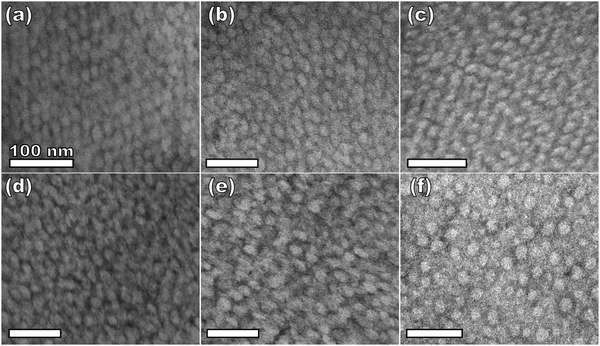
The implementation of glassy-PMTs introduces an apparent paradox in the form of guideline (4): how can one achieve a glassy micelle dispersion when the used polymer block must not be directly soluble? This implies an additional glassy-PMT guideline in that (5) an indirect dispersion route with multiple steps can satisfy guideline (4). Here the starting solvent must be a good solvent for both the polymer blocks to assure dispersion. The subsequent addition of solvent(s) that are good for the corona block and poor for the core block leads to micellization (i.e. “selective” solvent). We note that solvents and non-solvents for polymers are tabulated from various reference sources.68 As demonstrated above with series OS1–THF, however, the resulting micelle cores can be plasticized by any remaining trace good solvent at this point. Thus, an additional purification step is necessary to remove any non-selective or plasticizing solvent(s), leaving behind only the non-solvents for the core block, which are also simultaneously good solvents for the corona block. Guideline (5) was thus implemented with OS1 by dispersing the polymer in pure THF, followed by the slow addition of water to induce micellization and EtOH to quench molecular dynamics. Next rotary evaporation was used to remove the THF and yield a THF-free dispersion of OS1 in EtOH/water. This processing pathway along with the number weighted DLS of the micelle solution at each step is shown in Fig. 3 (and the intensity weighted DLS in Fig. S3, ESI†). The DLS results were consistent with OS1 unimers in THF and OS1 micelles in all subsequent solutions involving H2O or EtOH. We note that DLS is often unable to distinguish between persistent micelles and dynamic micelles since the concentration of unimers can be below the detection limit.50 The resulting glassy micelles are able to be imaged by TEM at room temperature owing to the persistence of the glassy cores (Fig. 4). In contrast, all prior PMT demonstrations utilized low Tg core blocks and would reorganize upon solvent removal. Statistics were collected from 200 TEM measurements of individual glassy OS1–EtOH micelles to yield an average template diameter of 18.68 ± 0.22 nm (Table S1, ESI†). Please note that a uranyl acetate staining agent was used to selectively stain the PEO coronas for contrast at the core–corona interface. Thus, micelles OS1–EtOH were prepared and characterized before use as templates. A series of samples (OS1–EtOH) were again prepared with the M:T ratio spanning from 0.45–1.65. In contrast to all sample series presented above, series OS1–EtOH exhibited a region of monotonic lattice expansion (decreasing q-position) as the M:T ratio increased from 0.80–1.30 (Fig. 5). TEM images of the as-made samples revealed a relatively constant template diameter of ∼17.5 nm and increasing wall thickness from 8.00 to 10.74 nm across the series. This ∼34% increase in wall thickness across the PMT window is apparent in Fig. 6. Here we note that the material, but not the micelles, were relatively sensitive to beam damage where the carbon precursors would contract somewhat upon exposure to the electron beam. We direct the reader to Fig. S6 (ESI†) for clarification on the measurement of the pore and wall dimensions.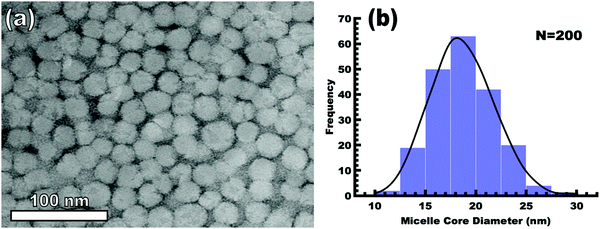 | ||
| Fig. 4 TEM image of OS1–EtOH micelles (a) and the associated micelle core size distribution (b). The mean diameter and standard-error-of-the-mean of the measured cores are 18.68 and 0.22 nm, respectively (Table S1, ESI†). The PEO corona was selectively stained with 1 wt% uranyl acetate for contrast (dark) relative to the unstained PS (light). | ||
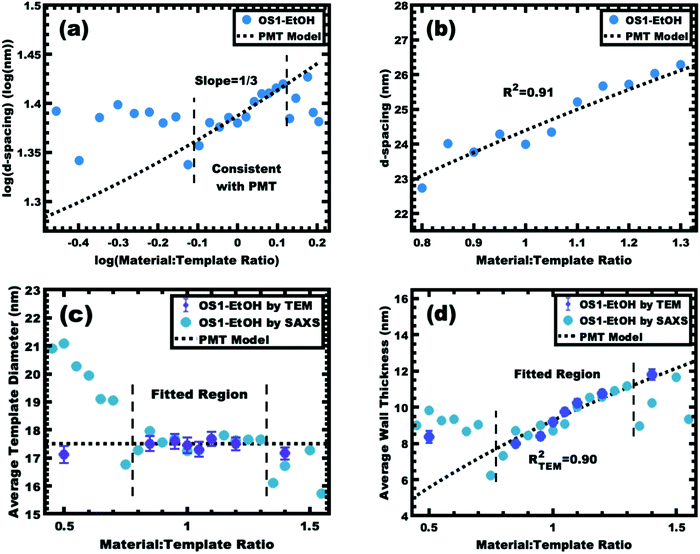
A plot of log(d-spacing) vs. log(M:T ratio) was used to identify a region with the slope of 1/3, consistent with the PMT model for lattice expansion from M![[thin space (1/6-em)]](https://www.rsc.org/images/entities/char_2009.gif) :
:![[thin space (1/6-em)]](https://www.rsc.org/images/entities/char_2009.gif) T = 0.80–1.30 (Fig. 7a). Lower M:T ratios exhibited larger d-spacings, presumably due to the low amount of material precursors limiting the contraction of the corona conformation (negative χmaterial-corona). Similarly, samples with M:T > 1.3 exhibited a relatively constant d-spacing (Fig. 7c), consistent with the corona reaching saturation where the addition of further material precursors leads to precursor phase separation (Fig. S7, ESI†). The solvent phase was evaporated to recover and quantify the amount of material precursors partitioned into that phase. While most samples in the PMT window had a relatively constant yield of carbon precursors to the micelle phase of ∼20%, there was a sharp decrease in the solution material content when M:T > 1.30 (Fig. S8, ESI†). This observation combined with the lack of further lattice expansion for higher M:T ratios suggests some precipitation of excess material precursors without micelles. The identified window consistent with the PMT model was well-fitted using the previously shown PMT model (micelle core template model), having a goodness of fit R2 = 0.91 (Fig. 7b and Table 3). Extraction of the pore size and wall thickness values from the SAXS data using the best-fit of the PMT model confirmed a relatively constant template diameter of ∼17.5 nm. Here the 11 samples within the PMT window had a template diameter interpreted by the best-fit PMT model spanning from 17.30–17.68 nm, consistent with the TEM average diameter of 17.51 nm (Fig. 7c). This nominal template dimension of ∼17.5 nm closely matched the 18.68 nm core diameter of the glassy micelles themselves, thus providing the first direct evidence of the PMT mechanism. The minor ∼1.2 nm difference was statistically significant and is perhaps associated with the carbon precursors residing partly within the PEO–PS interface region, or alternatively the latter formaldehyde treatment inducing minor expansion of the material precursors. The PMT model predicted the average wall thickness to range from 7.42–10.89 nm across the M:T range used for fitting (Fig. 7d). Similarly, the TEM measurements of wall thickness increased monotonically from 8.00 to 10.74 nm. Regardless of the wall shrinkage from the beam damage, the overall trends were well fitted by the PMT model with an R2 = 0.90. Thus, the as-made/aged series OS1–EtOH was found to be consistent with PMT behavior by both SAXS and TEM measurements. To the best of our knowledge, this is the first report of a polymer template preserving constant dimensions while varying the amount of carbon precursors. As explained using the three counter examples above, equilibration enabled by several modalities leads to a loss of kinetic template control where glassy-PMTs circumvent these challenges.
T = 0.80–1.30 (Fig. 7a). Lower M:T ratios exhibited larger d-spacings, presumably due to the low amount of material precursors limiting the contraction of the corona conformation (negative χmaterial-corona). Similarly, samples with M:T > 1.3 exhibited a relatively constant d-spacing (Fig. 7c), consistent with the corona reaching saturation where the addition of further material precursors leads to precursor phase separation (Fig. S7, ESI†). The solvent phase was evaporated to recover and quantify the amount of material precursors partitioned into that phase. While most samples in the PMT window had a relatively constant yield of carbon precursors to the micelle phase of ∼20%, there was a sharp decrease in the solution material content when M:T > 1.30 (Fig. S8, ESI†). This observation combined with the lack of further lattice expansion for higher M:T ratios suggests some precipitation of excess material precursors without micelles. The identified window consistent with the PMT model was well-fitted using the previously shown PMT model (micelle core template model), having a goodness of fit R2 = 0.91 (Fig. 7b and Table 3). Extraction of the pore size and wall thickness values from the SAXS data using the best-fit of the PMT model confirmed a relatively constant template diameter of ∼17.5 nm. Here the 11 samples within the PMT window had a template diameter interpreted by the best-fit PMT model spanning from 17.30–17.68 nm, consistent with the TEM average diameter of 17.51 nm (Fig. 7c). This nominal template dimension of ∼17.5 nm closely matched the 18.68 nm core diameter of the glassy micelles themselves, thus providing the first direct evidence of the PMT mechanism. The minor ∼1.2 nm difference was statistically significant and is perhaps associated with the carbon precursors residing partly within the PEO–PS interface region, or alternatively the latter formaldehyde treatment inducing minor expansion of the material precursors. The PMT model predicted the average wall thickness to range from 7.42–10.89 nm across the M:T range used for fitting (Fig. 7d). Similarly, the TEM measurements of wall thickness increased monotonically from 8.00 to 10.74 nm. Regardless of the wall shrinkage from the beam damage, the overall trends were well fitted by the PMT model with an R2 = 0.90. Thus, the as-made/aged series OS1–EtOH was found to be consistent with PMT behavior by both SAXS and TEM measurements. To the best of our knowledge, this is the first report of a polymer template preserving constant dimensions while varying the amount of carbon precursors. As explained using the three counter examples above, equilibration enabled by several modalities leads to a loss of kinetic template control where glassy-PMTs circumvent these challenges.
| Series name | Pore size (nm) | β | S | γ | α |
|---|---|---|---|---|---|
| a A best-fit approach was used to fit Model parameters β and α. | |||||
| F127–EtOH | 13.50 | 3.75 | 1.00 | 1.00 | N/A |
| OS1–THF | 16.63 | 3.75 | 1.00 | 1.00 | N/A |
| OS2–EtOH | 13.34 | 3.75 | 1.00 | 1.00 | N/A |
| OS1–EtOH (as-made/aged)a | 17.51 | 3.75 | 1.00 | 1.00 | 1.092 |
| OS1–EtOH (carbonized)a | 10.69 | 9.98 | 1.00 | 1.00 | 1.044 |
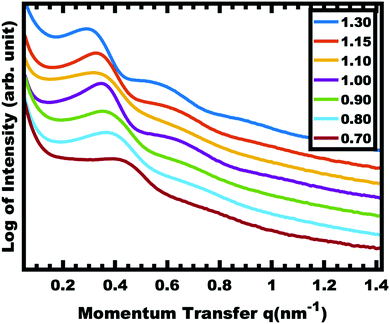
Sample series OS1–EtOH was subsequently carbonized at high temperature and characterized by a combination of SAXS, TEM, and BET. The SAXS data of the carbonized OS1–EtOH series again exhibited monotonic lattice expansion, albeit with a ∼25% contraction in d-spacing relative to the as-made samples (Fig. 8). As expected, the carbon precursors had a mass yield of 30–34% upon carbonization. TEM images of the carbonized series are shown in Fig. 9. Hundreds of measurements were made on the TEM images to collect the statistically significant descriptors of the nanostructure from unobstructed images. Here, all samples with M:T > 0.75 had a relatively constant pore size of ∼10.7 nm, a 39% contraction from the original template dimension (Table 5). Similarly the wall thickness was found to monotonically increase from 7.77–10.35 nm with increasing material content until M:T = 1.3, the point beyond which the material appeared to phase separate from the micelles. The corresponding nitrogen physisorption isotherms and Barrett, Joyner, Halenda method (BJH) analysis are shown in Fig. 10. The isotherms exhibit classic type IV shape with relatively constant offset between adsorption and desorption branches suggestive of open-ended pores rather than e.g., ink-bottle pores. The BJH pore size distributions were calculated from the adsorption branch of the isotherms where the templated mesopore volume-weighted average pore diameters ranged from 8.71–10.27 nm (Fig. 10b and Table 5). There was a monotonic size trend in average BJH pore size with M:T where the samples with thinner walls exhibited progressively further pore contraction following carbonization, a trend that is also apparent with SAXS d-spacing contraction (Fig. S9, ESI†). The samples with thinner walls (lower M:T) perhaps experienced greater lattice contraction following carbonization as a result of their lower structural integrity. However, samples with M:T > 1.3 exhibited a larger constant pore size of ∼16.6 nm (Fig. S10, ESI†). This suggests that the non-proportionate contraction tapers off with increasing M:T until reaching a constant value, similar to the original micelle diameter prior to use as templates (Fig. 4). Please note however, that the physisorption data includes contributions from any phase separated carbon precursors whereas the SAXS analysis and TEM data were principally corresponding to micelle templated materials. The lack of a monotonic trend in mesopore volume and surface area (Table 4) was attributed to this variable material contraction combined with the partial phase separation of material precursors (Fig. S7 and S9, ESI†).
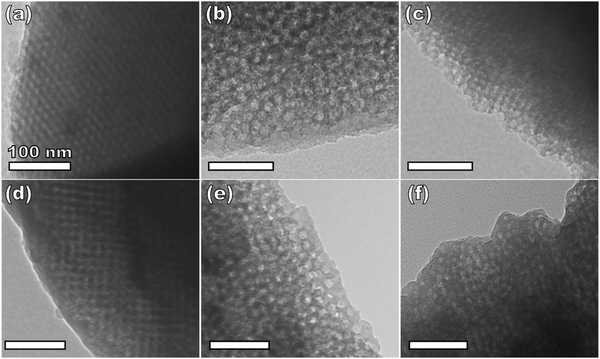 | ||
| Fig. 9 TEM of carbonized samples from the series OS1–EtOH with material:template ratios of 0.75 (a), 0.85 (b), 0.95 (c), 1.00 (d), 1.15 (e), and 1.30 (f). | ||
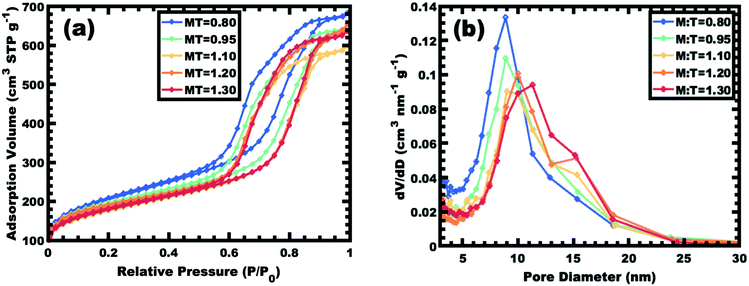 | ||
| Fig. 10 Nitrogen physisorption isotherms for select samples from series OS1–EtOH (a) along with the corresponding BJH pore size analysis from the adsorption branch of the isotherm (b). | ||
| M:T Ratio | Total surface area (m2 g−1) | Mesopore surface area (m2 g−1) | Total pore volume (cm3 g−1) | Mesopore volume (cm3 g−1) |
|---|---|---|---|---|
| 0.80 | 732.5 | 405.4 | 1.06 | 0.89 |
| 0.95 | 677.8 | 341.9 | 1.01 | 0.84 |
| 1.10 | 624.1 | 305.4 | 0.93 | 0.76 |
| 1.20 | 658.4 | 304.2 | 1.01 | 0.84 |
| 1.30 | 634.2 | 313.9 | 0.99 | 0.83 |
| 1.40 | 627.1 | 224.2 | 1.01 | 0.82 |
| 1.50 | 535.4 | 218.6 | 0.90 | 0.74 |
| 1.65 | 537.0 | 206.5 | 0.90 | 0.75 |
| M:T Ratio | d-Spacing (nm) | Average TEM pore diametera (nm) | Standard deviation of TEM pore diameterb (nm) | Average BJH pore diameterc (nm) | Average wall thicknessa (nm) | Standard deviation of wall thicknessb (nm) | Percent change in wall thickness (%) |
|---|---|---|---|---|---|---|---|
| a Average values are reported ± the standard error of the mean to indicate the uncertainty in the reported average value. b The standard deviation of the measured metric are present to indicate the statistical distribution of measured values. c The average BJH pore diameter was calculated as a volume-weighted average. | |||||||
| 0.75 | 15.41 | 10.52 ± 0.17 | 1.77 | 7.77 ± 0.16 | 1.58 | N/A | |
| 0.80 | 17.66 | 8.71 | |||||
| 0.85 | 17.66 | 10.45 ± 0.12 | 1.67 | 8.02 ± 0.10 | 1.47 | 3.2 | |
| 0.90 | 18.22 | 10.93 ± 0.17 | 1.50 | 8.65 ± 0.14 | 1.36 | 11.3 | |
| 0.95 | 19.05 | 9.34 | |||||
| 1.00 | 18.73 | 10.80 ± 0.14 | 1.40 | 9.07 ± 0.19 | 1.86 | 16.7 | |
| 1.10 | 20.27 | 9.79 | |||||
| 1.15 | 19.86 | 10.82 ± 0.18 | 1.80 | 9.91 ± 0.17 | 1.68 | 27.5 | |
| 1.20 | 20.89 | 10.11 | |||||
| 1.25 | 21.25 | 10.61 ± 0.13 | 1.67 | 9.96 ± 0.12 | 1.64 | 28.2 | |
| 1.30 | 21.65 | 10.58 ± 0.16 | 1.63 | 10.27 | 10.35 ± 0.17 | 1.78 | 33.2 |
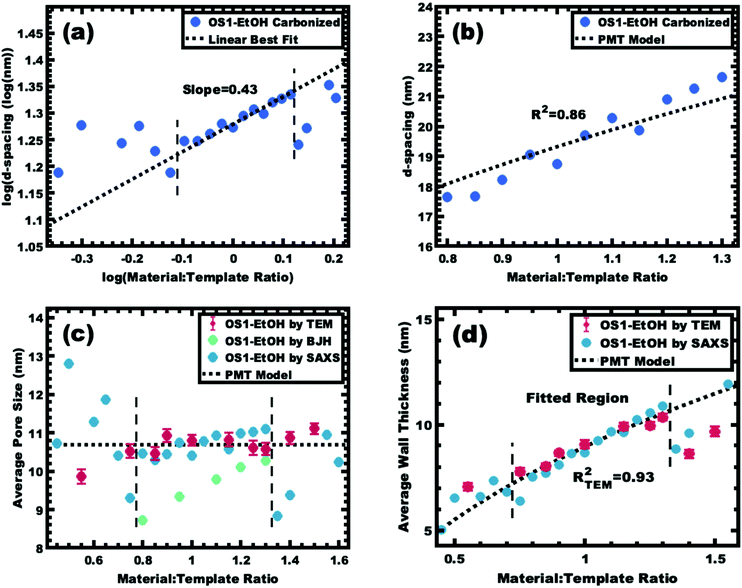
The same modelling and log–log analysis of d-spacing vs. M:T ratio was used for sample series OS1–EtOH after carbonization. A linear region with a slope of 1/3 is predicted by the PMT model (Fig. 11a), however the higher best-fit slope of ∼0.4 was attributed to non-proportionate shrinkage of feature sizes during the high temperature carbonization. Regardless, the trends in d-spacing were well fitted with the PMT model having a goodness of fit R2 = 0.86 (Fig. 11b and Table 3). The best-fit model interpretation of the SAXS data also confirmed relatively constant pore size of ∼10.7 nm, consistent with both the TEM and BJH statistics (Fig. 11c). The best-fit PMT model also agreed well with the trend in average TEM wall thickness (Fig. 11d) with a goodness of fit R2 = 0.93. Please note that the inclusion of varying BJH pore size in the model led to lower quality fits so a constant average pore diameter was used for modelling. Despite the non-proportional shrinkage during carbonization, the resulting material series exhibited relatively constant pore diameter with monotonically increasing wall thickness. Thus, the development of the glassy-PMT approach enabled custom tailored porous carbon materials with monotonic wall thickness control despite the challengingly show materials chemistry.
Conclusions
Porous nanoscale carbon materials are widely used in diverse fields, yet the tailored synthesis of these materials has remained elusive. Persistent micelle templates (PMTs) recently emerged as a novel approach to prepare nanoscale porous materials based uniquely upon kinetic control of polymer micelles. Under kinetic control, micelles maintain a constant average template diameter despite the changing solution conditions. However, a drawback with prior PMT demonstrations was limited micelle persistence after solvent evaporation, necessitating rapid thermal cross-linking of material precursors to preserve micelle persistence. This caveat has prevented the application of traditional PMT methods to porous carbons as the materials chemistry generally progresses with slower kinetics and involves the critical transition from a solvent-rich to a material-rich environment. Thus, a new PMT modality with greatly enhanced persistence was developed to enable the synthesis of custom-tailored porous carbons. A comprehensive set of 5 design guidelines were developed to enable persistent micelle templates with glassy micelle cores (glassy-PMT). In particular, these guidelines show the realization of glassy-PMT from a multistep procedure that traverses from non-selective solvent to purely selective solvent(s) for the corona block that are simultaneously non-solvents for the core block. Our unique solvent pathway yields micelles that are present exclusively in PS non-solvents with cores that are immobile and free of plasticizing agents (i.e., glassy). This highly specific processing route is likely part of why others have not broadly utilized such glassy persistent micelle templates despite the popularity of suitable PEO-b-PS and PEO-b-PMMA polymers. The development of glassy PMTs also enables the first comparison of a persistent micelle template both before and after use as a template where the dimensions were found to be comparable and are thus the first direct evidence of the PMT mechanism. The results here with porous carbons also highlight the potential of glassy-PMTs to broadly enable tailored nanoscale control with diverse material chemistries.Conflicts of interest
There are no conflicts to declare.Acknowledgements
E. R. W. and M. S. acknowledge support by the NSF CAREER program, NSF Award No. DMR-1752615. J. E. R., J. L. S., V. S. and M. D. A. gratefully acknowledge research support from the Hydrogen Materials – Advanced Research Consortium (HyMARC), established as part of the Energy Materials Network under the U.S. Department of Energy, Office of Energy Efficiency and Renewable Energy, Hydrogen and Fuel Cell Technologies Office, under Contract Numbers DE-AC04-94AL85000 and DE-AC52-07NA27344. Sandia National Laboratories is a multi-mission laboratory managed and operated by National Technology and Engineering Solutions of Sandia, LLC., a wholly owned subsidiary of Honeywell International, Inc., for the U.S. Department of Energy's National Nuclear Security Administration (NNSA) under contract DE-NA-0003525. We thank R. T. Ly for performing and providing insight into DSC measurements.References
- L. A. Jonas, Carbon, 1978, 16, 115–119 Search PubMed.
- I. P. O'koye, M. Benham and K. M. Thomas, Langmuir, 1997, 13, 4054–4059 Search PubMed.
- R. Ryoo, S. H. Joo and S. Jun, J. Phys. Chem. B, 1999, 103, 7744–7746 Search PubMed.
- M. R. Benzigar, S. N. Talapaneni, S. Joseph, K. Ramadass, G. Singh, J. Scaranto, U. Ravon, K. Al-Bahily and A. Vinu, Chem. Soc. Rev., 2018, 47, 2680–2721 Search PubMed.
- D. Gang, Z. Uddin Ahmad, Q. Lian, L. Yao and M. E. Zappi, Chem. Eng. J., 2021, 403, 126286 Search PubMed.
- S. Sircar, T. C. Golden and M. B. Rao, Carbon, 1996, 34, 1–12 Search PubMed.
- C. Liang, Z. Li and S. Dai, Angew. Chem., Int. Ed., 2008, 47, 3696–3717 Search PubMed.
- Y. Hu, J. Florek, D. Larivière, F. Fontaine and F. Kleitz, Chem. Rec., 2018, 18, 1261–1276 Search PubMed.
- S. H. Joo, S. J. Choi, I. Oh, J. Kwak, Z. Liu, O. Terasaki and R. Ryoo, Nature, 2001, 412, 169–172 Search PubMed.
- A. Lu, W. Schmidt, N. Matoussevitch, H. Bönnemann, B. Spliethoff, B. Tesche, E. Bill, W. Kiefer and F. Schüth, Angew. Chem., Int. Ed., 2004, 43, 4303–4306 Search PubMed.
- Y. Zhai, Y. Dou, D. Zhao, P. F. Fulvio, R. T. Mayes and S. Dai, Adv. Funct. Mater., 2011, 23, 4828–4850 Search PubMed.
- A. D. Roberts, X. Li and H. Zhang, Chem. Soc. Rev., 2014, 43, 4341–4356 Search PubMed.
- A. Eftekhari and Z. Fan, Mater. Chem. Front., 2017, 1, 1001–1027 Search PubMed.
- Y. Meng, D. Gu, F. Zhang, Y. Shi, H. Yang, Z. Li, C. Yu, B. Tu and D. Zhao, Angew. Chem., Int. Ed., 2005, 44, 7053–7059 Search PubMed.
- F. Zhang, Y. Meng, D. Gu, Y. Yan, C. Yu, B. Tu and D. Zhao, J. Am. Chem. Soc., 2005, 127, 13508 Search PubMed.
- C. Liang and S. Dai, J. Am. Chem. Soc., 2006, 128, 5316–5317 Search PubMed.
- T. Ma, L. Liu and Z. Yuan, Chem. Soc. Rev., 2013, 42, 3977–4003 Search PubMed.
- H. Teng and S. Wang, Carbon, 2000, 38, 817–824 Search PubMed.
- M. Inagaki, M. Toyoda, Y. Soneda, S. Tsujimura and T. Morishita, Carbon, 2016, 107, 448–473 Search PubMed.
- A. A. Zakhidov, Science, 1998, 282, 897–901 Search PubMed.
- C. Liang, S. Dai and G. Guiochon, Anal. Chem., 2003, 75, 4904–4912 Search PubMed.
- P. T. Tanev and T. J. Pinnavaia, Science, 1995, 267, 865–867 Search PubMed.
- D. Zhao, Q. Huo, J. Feng, B. F. Chmelka and G. D. Stucky, J. Am. Chem. Soc., 1998, 120, 6024–6036 Search PubMed.
- J. B. Donnet, R. C. Bansal and M. Dekker, Carbon Fibers, Wiley, New York, 1990 Search PubMed.
- C. Liang, K. Hong, G. A. Guiochon, J. W. Mays and S. Dai, Angew. Chem., Int. Ed., 2004, 43, 5785–5789 Search PubMed.
- A. P. Luz, C. G. Renda, A. A. Lucas, R. Bertholdo, C. G. Aneziris and V. C. Pandolfelli, Ceram. Int., 2017, 43, 8171–8182 Search PubMed.
- Y. Deng, T. Yu, Y. Wan, Y. Shi, Y. Meng, D. Gu, L. Zhang, Y. Huang, C. Liu, X. Wu and D. Zhao, J. Am. Chem. Soc., 2007, 129, 1690–1697 Search PubMed.
- D. Chen, Z. Li, Y. Wan, X. Tu, Y. Shi, Z. Chen, W. Shen, C. Yu, B. Tu and D. Zhao, J. Mater. Chem., 2006, 16, 1511 Search PubMed.
- H. Fei, W. Li, A. Bhardwaj, S. Nuguri, A. Ribbe and J. J. Watkins, J. Am. Chem. Soc., 2019, 141, 17006–17014 Search PubMed.
- X. X. Zhu, K. Banana and R. Yen, Macromolecules, 1997, 30, 3031–3035 Search PubMed.
- K. T. Lee and S. M. Oh, Chem. Commun., 2002, 2722–2723 Search PubMed.
- C. M. Ghimbeu, L. Vidal, L. Delmotte, J. Le Meins and C. Vix-Guterl, Green Chem., 2014, 16, 3079–3088 Search PubMed.
- Y. Zhang, Z. Yuan and Y. Zhou, Mater. Lett., 2013, 109, 124–126 Search PubMed.
- P. M. Lipic, F. S. Bates and M. A. Hillmyer, J. Am. Chem. Soc., 1998, 120, 8963–8970 Search PubMed.
- Y. Meng, D. Gu, F. Zhang, Y. Shi, L. Cheng, D. Feng, Z. Wu, Z. Chen, Y. Wan, A. Stein and D. Zhao, Chem. Mater., 2006, 18, 4447–4464 Search PubMed.
- Y. Huang, H. Cai, T. Yu, X. Sun, B. Tu and D. Zhao, Chem. – Asian J., 2007, 2, 1282–1289 Search PubMed.
- S. Tanaka, A. Doi, N. Nakatani, Y. Katayama and Y. Miyake, Carbon, 2009, 47, 2688–2698 Search PubMed.
- K. Lee, H. Song, K. H. Lee, S. H. Choi, J. H. Jang, K. Char and J. G. Son, ACS Appl. Mater. Interfaces, 2016, 8, 22516–22525 Search PubMed.
- J. Lee, J. Kim and T. Hyeon, Adv. Mater., 2006, 18, 2073–2094 Search PubMed.
- S. Herou, M. C. Ribadeneyra, R. Madhu, V. Araullo-Peters, A. Jensen, P. Schlee and M. Titirici, Green Chem., 2018, 21, 550–559 Search PubMed.
- J. Zhang, Y. Deng, J. Wei, Z. Sun, D. Gu, H. Bongard, C. Liu, H. Wu, B. Tu, F. Schüth and D. Zhao, Chem. Mater., 2009, 21, 3996–4005 Search PubMed.
- Y. Deng, T. Yu, Y. Wan, Y. Shi, Y. Meng, D. Gu, L. Zhang, Y. Huang, C. Liu, X. Wu and D. Zhao, J. Am. Chem. Soc., 2007, 129, 1690–1697 Search PubMed.
- L. Peng, C. Hung, S. Wang, X. Zhang, X. Zhu, Z. Zhao, C. Wang, Y. Tang, W. Li and D. Zhao, J. Am. Chem. Soc., 2019, 141, 7073–7080 Search PubMed.
- M. Trivedi, F. Peng, X. Xia, P. I. Sepulveda-Medina and B. D. Vogt, Langmuir, 2019, 35, 14049–14059 Search PubMed.
- C. Liu, M. Yu, Y. Li, J. Li, J. Wang, C. Yu and L. Wang, Nanoscale, 2015, 7, 11580–11590 Search PubMed.
- H. N. Lokupitiya, A. Jones, B. Reid, S. Guldin and M. Stefik, Chem. Mater., 2016, 28, 1653–1667 Search PubMed.
- K. Lan, Y. Liu, W. Zhang, Y. Liu, A. Elzatahry, R. Wang, Y. Xia, D. Al-Dhayan, N. Zheng and D. Zhao, J. Am. Chem. Soc., 2018, 140, 4135–4143 Search PubMed.
- H. Tan, J. Tang, J. Henzie, Y. Li, X. Xu, T. Chen, Z. Wang, J. Wang, Y. Ide, Y. Bando and Y. Yamauchi, ACS Nano, 2018, 12, 5674–5683 Search PubMed.
- A. Sarkar and M. Stefik, J. Mater. Chem. A, 2017, 5, 11840–11853 Search PubMed.
- A. Sarkar, L. Evans and M. Stefik, Langmuir, 2018, 34, 5738–5749 Search PubMed.
- K. A. Lantz, N. B. Clamp, W. van den Bergh, A. Sarkar and M. Stefik, Small, 2019, 15, 1900393–1900403 Search PubMed.
- A. Sarkar, A. Thyagarajan, A. Cole and M. Stefik, Soft Mater., 2019, 15, 5193–5203 Search PubMed.
- Y. Deng, J. Liu, C. Liu, D. Gu, Z. Sun, J. Wei, J. Zhang, L. Zhang, B. Tu and D. Zhao, Chem. Mater., 2008, 20, 7281–7286 Search PubMed.
- Y. Deng, C. Liu, D. Gu, T. Yu, B. Tu and D. Zhao, J. Mater. Chem., 2008, 18, 91–97 Search PubMed.
- D. B. G. Williams and M. Lawton, J. Org. Chem., 2010, 75, 8351–8354 Search PubMed.
- R. Whitfield, A. Anastasaki, V. Nikolaou, G. R. Jones, N. G. Engelis, E. H. Discekici, C. Fleischmann, J. Willenbacher, C. J. Hawker and D. M. Haddleton, J. Am. Chem. Soc., 2017, 139, 1003–1010 Search PubMed.
- T. A. Scott, J. Phys. Chem., 1946, 50, 406–412 Search PubMed.
- T. M. Aminabhavi and B. Gopalakrishna, J. Chem. Eng. Data, 1995, 40, 856–861 Search PubMed.
- J. C. Foster, R. J. Carrazzone, N. J. Spear, S. C. Radzinski, K. J. Arrington and J. B. Matson, Macromolecules, 2019, 52, 1104–1111 Search PubMed.
- T. I. Löbling, O. Ikkala, A. H. Gröschel and A. H. E. Müller, ACS Macro Lett., 2016, 5, 1044–1048 Search PubMed.
- S. Choi, T. P. Lodge and F. S. Bates, Phys. Rev. Lett., 2010, 104, 047802 Search PubMed.
- S. Choi, F. S. Bates and T. P. Lodge, Macromolecules, 2011, 44, 3594–3604 Search PubMed.
- J. A. Faucher, Polym. Lett., 1965, 3, 143–145 Search PubMed.
- M. Stefik, J. Song, H. Sai, S. Guldin, P. Boldrighini, M. C. Orilall, U. Steiner, S. M. Gruner and U. Wiesner, J. Mater. Chem. A, 2015, 3, 11478–11492 Search PubMed.
- P. C. A. Alberius, K. L. Frindell, R. C. Hayward, E. J. Kramer, G. D. Stucky and B. F. Chmelka, Chem. Mater., 2002, 14, 3284–3294 Search PubMed.
- T. G. Fox and P. J. Flory, J. Appl. Phys., 1950, 21, 581–591 Search PubMed.
- T. G. Fox and P. J. Flory, J. Polym. Sci., 1954, 14, 315–319 Search PubMed.
- J. Brandrup, E. H. Immergut and E. A. Grulke, Polymer Handbook, Wiley-Interscience, Boca Raton, FL, 1999 Search PubMed.
Footnote |
| † Electronic supplementary information (ESI) available. See DOI: 10.1039/d1ma00146a |
| This journal is © The Royal Society of Chemistry 2021 |

