 Open Access Article
Creative Commons Attribution 3.0 Unported Licence
Ba2TiMnO6 two-dimensional nanosheets for rhodamine B organic contaminant degradation using ultrasonic vibrations†
Aditi
Sharma
,
Upasana
Bhardwaj
and
H. S.
Kushwaha
 *
*
Materials Research Centre, Malaviya National Institute of Technology (MNIT), Jaipur, India. E-mail: himmatsingh.mrc@mnit.ac.in
First published on 9th March 2021
Abstract
Piezocatalyst Ba2TiMnO6 nanosheets (BTMO NS) were successfully synthesized using a hydrothermal process. Two-dimensional (2D) BTMO NS exhibited an outstanding piezocatalytic performance as compared to other piezocatalysts for rhodamine B organic contaminant degradation using ultrasonic vibrations. The piezocatalytic output of the BTMO nanosheets approached approximately 99% after 180 minutes with a degradation rate of 0.022 min−1. Our experimental findings suggest that BTMO experiences a simple flexing deformation that can lead to an increased piezoelectric potential of 10.2 volts. In addition, the free surface carrier content is increased due to the existence of sufficient surface oxygen vacancies (VO), which can often be powered by piezoelectric potential and afterwards are engaged in the production of radical species throughout the piezocatalytic process. The hydroxyl radical (˙OH) forms an active site and originates primarily from the conversion of superoxides (˙O2−). This work provides a clear discription of the piezocatalytic process, and it also elucidates a viable approach for wastewater treatment using novel piezocatalytic material.
1. Introduction
There is currently great concern over the growing worldwide pollution of the water supply caused by climate change, economization, overconsumption, and population growth.1 In recent years, many forms of dangerous drugs and carcinogenic compounds have been detected in the effluent from industrial plants. Damaging chemicals that interfere with hormone signaling such as disinfection byproducts, fluorinated compounds, bisphenol, phthalates, pesticides, and natural and synthetic estrogens are some of the main chemicals classified as water pollutants. These contaminants cause extreme disorders in living organisms because of their ability to adversely affect cellular structures and the normal biological state. It would be desirable if the wastewater could be treated and purified so that it could be reused. However, to draw the attention of stakeholders, emerging technology innovations that require low investment and operating costs are required. For this reason, the research community is focusing on creating new technologies.2There have been many chemical, biological, and physical approaches that have been conceived and implemented to dispose of organic toxins. Physical approaches such as division of gravity, ultrafiltration, and activated charcoal adsorption merely move contaminants from the wastewater solution to some other process, which can easily contribute to secondary contamination.3,4 Chemical processes require reagents to be introduced into water, which can create secondary leakage, and they cannot be used again. Many advanced oxidation analytical techniques for decomposing toxins have been developed, including photo-catalysis and Fenton oxidation, which utilize an inexpensive and non-toxic approach to the disposal of organic compounds in water but have some drawbacks, such as poor processing performance in natural solar light, conditional use, and high factory costs.5–9 Therefore, finding modern and environmentally sustainable methods for the handling of wastewater has become an imperative need.
To overcome the drawbacks of these methods, piezocatalysis can be used. The ability of any material to transform mechanical stress into electrical energy is known as piezoelectricity. Piezoelectrically mediated catalysis is called piezocatalysis, and electrochemical water splitting reactions and organic pollutant degradation have been performed with piezoelectric nanomaterials.10 Piezoelectricity contributes to the formation of electrical dipoles inside materials. Piezoelectric materials are electrically stable because of the cancelation of the positive charge by the corresponding negative charge. Nevertheless, when a piezoelectric material is exposed to tension by pressing or pulling, the atoms shift from their initial state to achieve a net electrical charge in the entire crystal, and thus, there are both negative and positive charges on the inner and outer sides of the crystal.11,12 In a standard piezocatalytic phase, the piezoelectric crystal produces an electric field in response to mechanical stress that can move free load-carriers that engage in redox reactions.13 Developed free carriers must have a potential higher than the normal redox potential for every redox reaction, i.e., greater than 1.23 eV in the instance of water splitting. Furthermore, any load potential smaller than the redox potential will not cause a redox reaction.14
Ba2TiMnO6 (BTMO) is a part of the double perovskite-type A2BB′O6 and has outstanding piezoelectric properties such as ability to degrade dyes and high piezoelectric coefficient. Previously, the synthesis of Ba2TiMnO6 was reported by the solid-state route,15 but its application in piezocatalysis has not yet been reported.
The use of Ba2TiMnO6 2D nanosheets as described herein to degrade organic pollutants provides a fascinating option because it can be combined with solar exposure to facilitate the elimination of toxins from water, which will reduce the cost of water treatment. Experimental findings show that the piezoelectric behavior of BTMO 2D nanosheets is triggered by the deformation of the sheets and the number of free charges correlated with surface excess vacancies (oxygen). In this work, we report the simple hydrothermal synthesis of 10–20 nm-thick BTMO nanosheets, and the piezocatalytic degradation of rhodamine B dye solution (as the target pollutant) in the presence of BTMO 2D nanosheets.
2. Results and discussion
2.1 Structural and morphological characterization of Ba2TiMnO6 nanosheets
The X-ray diffraction pattern of the synthesized Ba2TiMnO6 nanosheets (BTMO NS) is depicted in Fig. 1(a), revealing that BTMO exhibits a 12R structure with high-intensity peaks, denoting the highly crystalline nature of the BTMO sample.15,16 According to the Structure Prediction Diagnostic Software (SpuDs), BTMO has an R![[3 with combining macron]](https://www.rsc.org/images/entities/char_0033_0304.gif) m space group with the lattice parameter a = 7.4 Å for the respective positions at Wyckoff.17
m space group with the lattice parameter a = 7.4 Å for the respective positions at Wyckoff.17
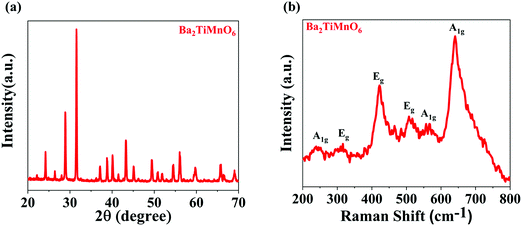 | ||
| Fig. 1 (a) X-ray diffraction patterns of BTMO 2D nanosheets. (b) Raman spectra for BTMO at room temperature, displaying mainly the Ag and Eg modes. | ||
The BTMO Raman spectrum in Fig. 1b shows that at room temperature, six phonon modes for BTMO are observed that align well with the recorded BaMn0.95Ti0.05O3.18 The mode A1g at 245 cm−1 arises due to Ba vibrations, whereas the 2Eg modes at 317 cm−1 and 422 cm−1 correspond to Mn (Ti) vibrations. The remaining 1Eg and 2A1g modes at 508 cm−1, 563 cm−1, and 640 cm−1 emerge from the vibrations of oxygen.19
X-ray photoelectron spectroscopy (XPS) analysis was conducted to identify the chemical states of the various elements present in BTMO. The XPS survey of BTMO is shown in Fig. 2a, and the peaks correlated with Ba, O, Ti, and Mn were measured. High-resolution images of the individual components are displayed in Fig. 2b–e.20 The Ti 2p XPS signal registered from 454 to 465 eV. The Ti 2p3/2 appeared at 456.8 eV, and the peak corresponding to Ti 2p1/2 appeared at 462.4 eV.21 There are 3 peaks with binding energy (BE) of roughly 528.5, 530.7, and 532.6 eV that can be considered for the O 1s spectrum. The smaller binding energy peak is allocated to O2− ions, the middle binding energy peak corresponds to O1− ions, and the highest binding energy peak corresponds to OChem, indicating that oxygen is chemically adsorbed on the surface (Fig. 2c).22 The Ba 4d spectra for BTMO are depicted in Fig. 2d, having 2 peaks with binding energies of 87.7 and 90.5 eV.23 The photoemission zone of Ba 3d, seen in Fig. 2e, is characterised by well-spaced spin–orbit elements, and the binding energies corresponding to Ba 3d5/2 and Ba 3d3/2 are 780 and 795.3 eV, respectively.24
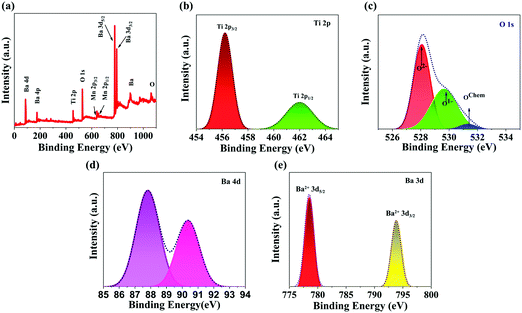 | ||
| Fig. 2 (a) XPS survey of Ba2TiMnO6 nanosheets. XPS elemental spectra of freshly prepared BTMO nanosheets: (b) the Ti 2p state, (c) the O 1s state, (d) Ba 4d state, and (e) the Ba 3d state. | ||
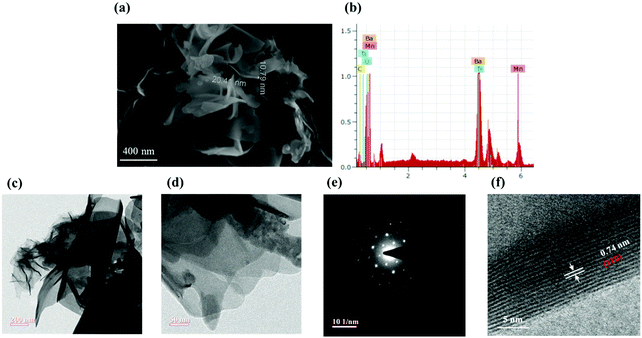
Scanning electron microscopy (SEM) photographs illustrate the morphologies of the synthesized BTMO nanosheets. As shown in Fig. 3a, BTMO consists of thin nanosheets, suggesting that the layered structures are retained after calcination. Fig. 3a also shows the thickness of the BTMO nanosheets, which varies from 10 nm to 20 nm. The entire distribution of the element is decorated in the EDX spectra, depicted in Fig. 3b.13,25 Transmission electron microscopy (TEM) photographs are shown in Fig. 3c–f. As shown in Fig. 3c and d, the obtained BTMO reveals a 2D nanosheet structure, and the surface is smooth with certain wrinkles and creases, showing the ultra-thin properties of the BTMO 2D nanosheets and demonstrating that the synthesized BTMO 2D nanosheets have a wide surface area.26 The selected area electron diffraction (SAED) pattern achieved from the BTMO 2D nanosheets is depicted in Fig. 3e. Sharp diffraction dots suggest that the as-synthesized BTMO 2D nanosheets possess high crystallinity. Fig. 3f shows the HRTEM portrait, which suggests a strong crystalline structure with 0.74 nm lattice spacing corresponding to the (110) lattice plane.27,28
2.2 Piezocatalytic performance of Ba2TiMnO6
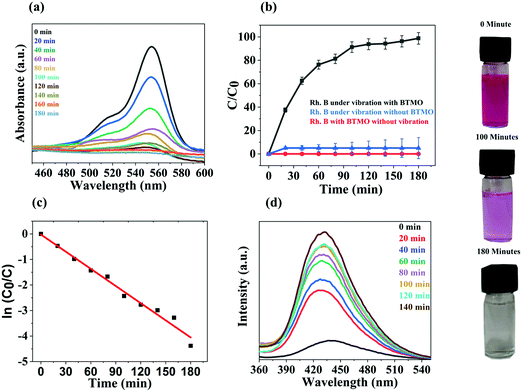
In Ba2TiMnO6 (A2BB′O6), the presence of Mn4+ at the B′ site produces additional oxygen vacancies (VO). The single ionised VO in BTMO produces Ti4+ at the B site due to charge compensation. Additional VO are produced in BTMO as the proportion of Mn4+ rises, which in turn generates more Ti4+ ions. Ti4+ are acceptor defects with energy levels near the highest occupied molecular orbital (HOMO), while VO are donors with energy levels near the lowest unoccupied molecular orbital (LUMO).29 Moreover, because of Jahn–Teller distortion, Mn4+ ions in BTMO introduce energy levels inside the bandgap. The modulation in the energy bandgap is associated with the piezocatalytic operation as a consequence of the incorporation of energy levels due to Ti4+, Mn4+, and VO in the BTMO system.The piezocatalytic behavior of BTMO nanosheets was analyzed by considering the degradation of rhodamine B under ultrasonic vibrations, as seen in Fig. 4a. There was a persistent decrease in the amplitude of the rhodamine B absorption peak (554 nm) and, in the most optimal case, the deterioration of the dye reached 99% after 180 minutes of exposure, as shown in Fig. 4a.30 Without any catalyst (bare rhodamine B solution), the sole result of ultrasonic vibrations is almost zero, with no deterioration observed after 180 minutes, i.e., the overall exposure time (see the blue curve in Fig. 4b). Without mechanical stress (rhodamine B with catalyst), there is no degradation observed after 180 minutes (red curve in Fig. 4b). At the same exposure time, a degradation efficiency of more than 95 percent was reached in the presence of a catalyst, supporting the favorable piezocatalysis activity of the BTMO nanosheets (black curve in Fig. 4b).31 The degradation efficiency (D%) of the BTMO 2D nanosheet is measured using the following equation:
| D% = 100 × [C0 − Ct]/C0 | (1) |
The deterioration profiles of the piezocatalytic experiments agree with the pseudo first order-kinetic theorem, as can be shown from the fitting curves in Fig. 4c, which also indicates a strong linear relationship between the ln(C0/C) and the time of exposure. The straight-line slope reflects the kinetic constant (0.02239 min−1).32,33 However, the piezoelectric coefficient (d33) of the BTMO can reach up to 280 pC N−1 with electrical poling in the parallel direction. Electrical poling is essential for most piezoelectric materials because the piezoelectric component has a multi-domain framework.34 The poling indicates that piezo-active synthesized BTMO 2D nanosheets were effectively synthesized. Numerous examples of piezocatalysis employed for the degradation of contaminants are described in Table 1.14
| Materials | Substrate | Reaction rate (min−1) | Catalytic conditions | Piezoelectric coefficient (d33) | Ref. |
|---|---|---|---|---|---|
| WS2NFs | Rhodamine B [10 mg L−1] | 1.152 | Ultrasound [300 W, 40 kHz] | 30 pC N−1 | 35 |
| BiOCl nanoplates | Rhodamine B [10 mg L−1] | 0.053 | Ultrasound [150W, 53 kHz] | — | 36 |
| BaTiO3 nanofibers | Rhodamine B [5 mg L−1] | 0.057 | Ultrasound | 191 pC N−1 | 16 and 37 |
| Bi4Ti3O12 | Rhodamine B [5 mg L−1] | 0.06 | Ultrasound [80 W, 40 kHz] | 17.6 pC N−1 | 38 |
| MoSe2 NFs | Rhodamine B [1 × 10⁻⁵ M] | 3.45 | Ultrasound [250 W, 40 kHz] | 45 pC N−1 | 39 |
| Ag–ZnO NWs | Rhodamine B [50 μmol L−1] | 0.052 | UV Irradiation + ultrasound | — | 40 |
| Ba 2 TiMnO 6 2D nanosheets | Rhodamine B [5 mg L −1 ] | 0.022 | Ultrasound [120 W, 40 kHz] | 280 pC N −1 | Present work |
2.3 Mechanism of piezocatalysis
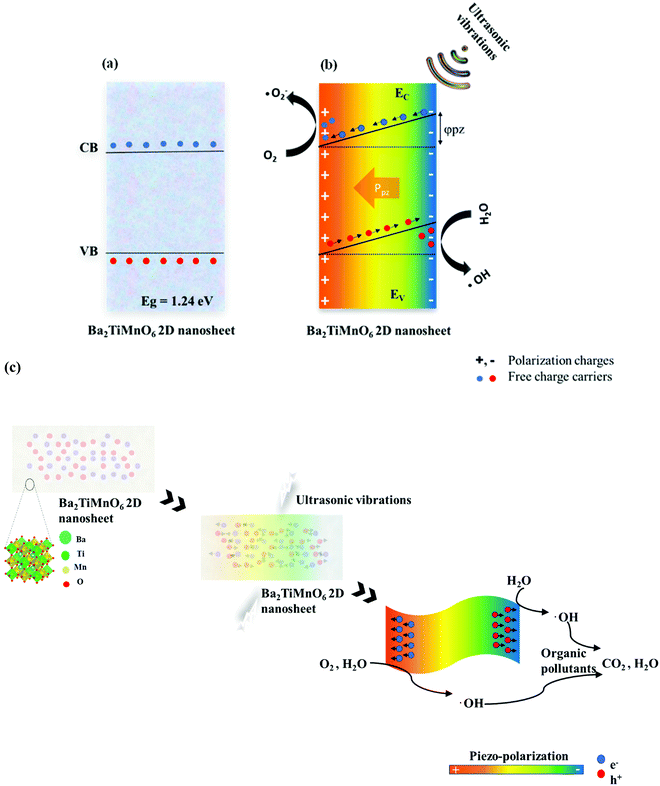
Piezocatalytic degradation can involve three phases: (i) piezoelectric phase, (ii) piezo-electrochemical phase, and (iii) catalytic degradation. During the piezoelectric phase, mechanical energy is converted to piezoelectric energy. The piezoelectricity of BTMO nanosheets occurs due to the lack of symmetry in its crystal structure. Any distortion or stress on the material can induce a non-zero dipole moment throughout the crystal lattice. Fig. 5a shows the energy band diagram of Ba2TiMnO6 with a bandgap of 1.24 eV. Because of the piezoelectric nature, the mechanical vibrations can trigger the BTMO nanosheets to generate piezoelectric polarization and create an inner electric field.Due to this generated electric field, the surface charges begin aggregating on opposite sides of BTMO nanosheets, where the electrons can interact with soluble oxygen (O2) to produce superoxide radicals (˙O2−), and the holes can interact with water to produce hydroxyl radicals (˙OH). An increase in the inner piezo potential can also arise, which supports the adsorption of activated rhodamine B molecules on the surface of the catalyst. At the very same point, both the conduction band (CB) as well as valence band (VB) are tipped by a piezoelectric potential with a slope proportional to the piezoelectric potential (Fig. 5b). The greater the piezoelectric potential, the larger the inclination of the conduction band and valence band, and the charging carriers can be moved faster and easier. Likewise, when there are no mechanical vibrations, electric charges can no longer mount on the surface of the nanosheet. Consequently, no adequate potential can be used to reduce or oxidize the molecules of rhodamine B. Also, the presence of the induced piezo potential within the catalyst enables the generation of free charge carriers that can react with rhodamine B molecules, and then break up the fluorescence groups and contribute to dye degradation.41 Based on the above findings, the piezocatalysis mechanism for the removal of rhodamine B is shown in Fig. 5c.
During the piezocatalytic process, to classify the active sites, terephthalic acid was used as an ˙OH radical probe.42 The photoluminescence (PL) method was used to observe the presence of ˙OH radical at the BTMO interface. To generate the highly fluorescent substance 2-hydroxyterephthalic acid, terephthalic acid easily reacts with ˙OH. This technique focuses on PL signals produced at the water/BTMO interface at 425 nm for terephthalic acid hydroxylation with ˙OH radical. The intensity of the ˙OH radical emitted throughout piezocatalysis is proportional to the photoluminescent intensity of 2-hydroxyterephthalic acid. This experiment involves an aqueous solution of terephthalic acid (5 × 10⁻⁴ M) with some piezocatalyst. After every 20 minutes of ultrasonic vibrations, the resulting solution was used to evaluate the increase in PL intensity at 425 nm. Fig. 4d shows the PL spectra of the terephthalic acid solution under ultrasonic vibration with increased irradiation time. A steady increase in PL intensity is observed at approximately 425 nm. Photoluminescence increased as a result of the (TAOH) 2-hydroxyterephthalic acid created by the chemical reaction between TA and ˙OH generated during the piezocatalytic process.
The production of free charges (electrons and holes) and their inclusion in redox reactions in the piezocatalytic phase results in reactions (i) to (v).43,44
| Ba2TiMnO6 + ultrasonic vibrations → Ba2TiMnO6 (e− + h+) | (i) |
At the negative polarized phase (electron-rich side of BTMO)-
| 4e− + 4H2O → 4OH− + 2H2 | (ii) |
At the positive polarized phase (hole-rich side of BTMO)
| 4OH− → 4e− + 2H2O + O2 | (iii) |
Overall reaction of the decomposition of water
| 2H2O → 2H2 + O2 | (iv) |
Dye degradation reaction-
| ˙OH + e− + h+ + rhodamine B molecule → degradation products | (v) |
2.4 Electrochemical characterizations
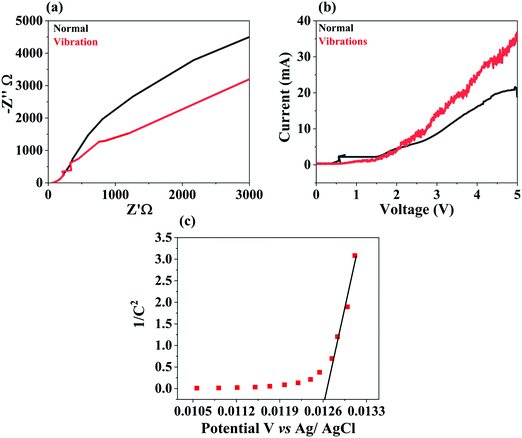
Electrochemical impedance spectra (EIS) assessment of BTMO was performed, and the findings of the investigation are reported in Fig. 6a. The spectra were recorded at an applied voltage using a typical three-electrode setup, in which the BTMO pallet, platinum wire, and KOH (0.1 M) aqueous solution served as the working electrode, reference electrode, and electrolyte, respectively.45 In the Nyquist plot, a reduced arc radius involved an efficacious separation of the piezo-induced electron (e−)–hole (h+) pairs. Fig. 6a shows that the BTMO's radius of impedance arc under ultrasonic vibrations was smaller than that without vibrations, suggesting that there were few electrons without vibrations around the electrolyte interface of BTMO.46 This indicates that BTMO degrades rhodamine B with high efficiency.The linear sweep voltammetry (LSV) of the BTMO nanosheet is shown in Fig. 6b. It has been shown that BTMO has an outstanding piezo-electrochemical performance (PEC) while undergoing ultrasonic vibrations with increasing current. The current of the BTMO with ultrasonic vibrations is 1.68 times higher than that of BTMO without vibrations.47 The semiconductor form and the material's flat band potential (EFB) can be investigated using a Mott–Schottky plot. The Mott–Schottky plot for the BTMO nanosheets is depicted in Fig. 6c. The positive slope of the plot confirms that the BTMO is an n-type.48 Also, the x-axis intercept reveals the EFB potential of the BTMO, and, as shown in Fig. 6c, the Mott–Schottky plot indicates that the EFB of BTMO was 0.0126 V (vs. Ag/AgCl).49
2.5 Piezo-potential measurement
Fig. 7a shows the open circuit voltage response of BTMO 2D nanosheets under ultrasonic vibrations, which was measured by digital scanning oscilloscope (DSO), and the maximum voltage reached was 10.2 V. The generated piezo potential produces positive signals when the ultrasonicator is ON, i.e., when stress is applied to the BTMO nanosheets, and negative signals when the ultrasonicator is OFF, which indicates that stress is released from the BTMO nanosheets. The piezoelectric effect was not observed without vibrations, which indicates that no pressure was exerted or removed from the BTMO pallet. Fig. 7b shows a schematic representation of the experimental setup. The piezoelectric effect of the BTMO 2D nanosheets was also measured using the Micro XACT SPS-2200 system's IS premier manual probe station.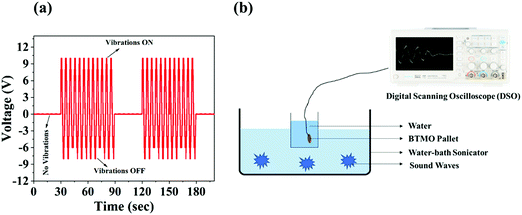 | ||
| Fig. 7 (a) The piezoelectric output voltage response of BTMO nanosheets with and without ultrasonic vibration. (b) Schematic representation of the experimental setup. | ||
Fig. S1 (ESI†) shows the piezoelectric effect by periodically introducing and releasing mechanical stress. Fig. S1a (ESI†) shows the open circuit voltage response by BTMO, which is 9.2 V. Fig. S1b (ESI†) shows the short circuit current that corresponds to BTMO, which is 4.05 Å.50,51 When stress is applied to the BTMO nanosheets, the generated piezo-potential produces positive signals, and when the stress is released from the BTMO nanosheets, negative signals are produced. Moreover, it is generally agreed that the effectiveness of piezoelectric material is controlled by the rate of load exerted and released, and a faster rate results in increased production due to the higher amount of hoarded charge over a certain period. Because our finger inserted the force here, the uncontrollable conditions of applied and released force can simply lead to some discrepancies between positive and negative signals.52
3 Experimental methods
3.1 Synthesis of Ba2TiMnO6 (BTMO) 2D ceramic nanosheets
BTMO 2D nanosheets were prepared using a standard hydrothermal method with conventional heating.53 Initially, BaCO3 (0.6 M), MnCO3 (0.4 M), TiO2 (0.3 M), and NaOH (10 M) were mixed in 100 ml deionized water and magnetically stirred for 1 h. The suspension was then placed in a Teflon-lined stainless steel reactor at 150 °C for 24 h.54,55 After cooling, the precipitate was collected and repeatedly washed with deionized water to remove unreacted elements. Samples were dried at 80 °C for 6 h, and then calcined at 400 °C for 4 h to remove impurities and to maintain their structure.563.2 Piezocatalysis activity measurements
The piezocatalytic efficiency of the BTMO 2D nanosheets was assessed by monitoring the deterioration of rhodamine B dye, using an ultrasonic cleaner (120 W, 40 kHz) to dispense ultrasonic vibrations (mechanical strain).57 First, 0.05 g of BTMO sample was dispersed in 50 ml of rhodamine B solution (10 mg L−1) in a beaker, accompanied by continuous stirring in the dark for 30 min to enter into an adsorption–desorption equilibrium between BTMO and rhodamine B molecules.58 Every 20 minutes over the course of degradation, 2 ml of the mixture was extracted and centrifuged. The rhodamine B concentration was analyzed by measuring the absorption spectra using a UV-visible spectrophotometer.59,603.3 Electrochemical measurements
A Biologic EC Lab SP-150 electrochemical workstation with a standard three-electrode device was used for the electrochemical measurements of EIS, LSV, and Mott–Schottky. A platinum wire was used as the counter electrode, Ag/AgCl as the reference electrode, and BTMO pallet as the working electrode, while 0.1 M KOH solution was used as an electrolyte.61 During measurements, the initial bias of the BTMO pallet was zero. Vibrations were produced by an ultrasonic generator (120 W, 40 kHz). The BTMO pallet was prepared using a hydraulic press.624. Material characterization
The phase structure of BTMO nanosheets was examined by X-ray diffraction patterns with Cu Kα radiation (2θ = 20–80°, λ = 1.5406 Å). Microstructures were characterized using an EI Nova Nano FESEM 450 scanning electron microscope. Compositional, tropological, crystalline, and morphological information for BTMO was determined using a TECNAI G220 (FEI)-twin transmission electron microscope and field-emission high-resolution transmission electron microscopy (FE-HRTEM). The elemental distribution in samples was analyzed by X-ray photoelectron spectroscopy (XPS) (ESCA + Omicron Nano Technology). The crystallographic orientation of a sample was determined using an IRIX STR 500 Raman spectrometer. The samples were recorded at 25 °C with Ar ion laser excitation at 532 nm (approximately 1 mW, 50× objective).63 A dual-beam U-3300 Hitachi UV-VIS-NIR spectrophotometer was used to study the optical absorption spectra of the BTMO nanosheets. The formation of hydroxyl radicals was analyzed with an LS 55 (PerkinElmer) fluorescence spectrometer with an excitation range of 200–800 nm. The piezoelectric measurements were obtained using the Micro XACT SPS-2200 system's IS premier manual probe station.5. Conclusions
Herein, a hydrothermal process was used to prepare Ba2TiMnO6 2D nanosheets, and their piezocatalytic activity was studied in the process of destroying rhodamine B dye molecules under ultrasonic vibrations. BTMO exhibits an outstanding piezoelectric catalytic property that is primarily related to its 2D structure. The simple deformation of the 2D nanosheets allows mechanical energy to be converted into piezoelectric energy. In the overall piezoelectric process, BTMO produces ample potent superoxide (˙O2−) and hydroxyl radicals (˙OH), which play a vital role in the decomposition of dye molecules. The piezocatalytic mechanism and the creation of these radicals are provisionally proposed. The current study offers a further explanation of piezocatalysis as well as a fruitful approach to the preparation of successful piezocatalysts.Author contributions
Aditi Sharma: conceptualization, research methodology, investigation, original draft writing and proofreading. Upasana Bhardwaj: electrochemical investigation. H. S. Kushwaha: writing review and proofreading, supervision.Conflicts of interest
The authors declare that they have no known competing financial interests or personal relationships that could have appeared to influence the work reported in this paper.Acknowledgements
The authors would gratefully acknowledge the Department of Science and Technology (DST), New Delhi under INSPIRE faculty award-2018 (MS-146), India, for providing the financial support for this research work.References
- K. Janowska, V. Boffa, M. K. Jørgensen, C. A. Quist-Jensen, F. Hubac, F. Deganello, F. E. B. Coelho and G. Magnacca, npj Clean Water, 2020, 3, 1–7 CrossRef.
- P. Xu, G. M. Zeng, D. L. Huang, C. L. Feng, S. Hu, M. H. Zhao, C. Lai, Z. Wei, C. Huang, G. X. Xie and Z. F. Liu, Sci. Total Environ., 2012, 424, 1–10 CrossRef CAS PubMed.
- F. Duarte, F. J. Maldonado-Hódar and L. M. Madeira, Appl. Catal., B, 2013, 129, 264–272 CrossRef CAS.
- T. Warang, N. Patel, R. Fernandes, N. Bazzanella and A. Miotello, Appl. Catal., B, 2013, 132–133, 204–211 CrossRef CAS.
- S. Wang, Z. Wu, J. Chen, J. Ma, J. Ying, S. Cui, S. Yu, Y. Hu, J. Zhao and Y. Jia, Ceram. Int., 2019, 45, 11703–11708 CrossRef CAS.
- C. Aprile, A. Corma and H. Garcia, Phys. Chem. Chem. Phys., 2008, 10, 769–783 RSC.
- J. Herney-Ramirez, M. A. Vicente and L. M. Madeira, Appl. Catal., B, 2010, 98, 10–26 CrossRef CAS.
- N. Sabari Arul, D. Mangalaraj and T. Whan Kim, Appl. Phys. Lett., 2013, 102, 1–5 CrossRef.
- X. Xu, L. Xiao, Y. Jia, Y. Hong, J. Ma and Z. Wu, J. Electron. Mater., 2018, 47, 536–541 CrossRef CAS.
- Y. Zhang, M. Xie, V. Adamaki, H. Khanbareh and C. R. Bowen, Chem. Soc. Rev., 2017, 46, 7757–7786 RSC.
- Z. Gao, J. Zhou, Y. Gu, P. Fei, Y. Hao, G. Bao and Z. L. Wang, J. Appl. Phys., 2009, 105, 1–7 Search PubMed.
- G. Mantini, Y. Gao, A. D’Amico, C. Falconi and Z. L. Wang, Nano Res., 2009, 2, 624–629 CrossRef CAS.
- Q. Nie, Y. Xie, J. Ma, J. Wang and G. Zhang, J. Cleaner Prod., 2020, 242, 118532 CrossRef CAS.
- Z. Liang, C. F. Yan, S. Rtimi and J. Bandara, Appl. Catal., B, 2019, 241, 256–269 CrossRef CAS.
- T. Aoba, T. Tiittanen, H. Suematsu and M. Karppinen, J. Solid State Chem., 2016, 233, 492–496 CrossRef CAS.
- X. Xu, Z. Wu, L. Xiao, Y. Jia, J. Ma, F. Wang, L. Wang, M. Wang and H. Huang, J. Alloys Compd., 2018, 762, 915–921 CrossRef CAS.
- C. E. Deluque-Toro, D. A. Landínez-Téllez and J. Roa-Rojas, Dyna, 2018, 85, 27–36 CrossRef.
- D. P. Kozlenko, N. T. Dang, T. L. Phan, S. E. Kichanov, L. H. Khiem, S. G. Jabarov, T. A. Tran, T. V. Manh, A. T. Le, T. K. Nguyen and B. N. Savenko, J. Alloys Compd., 2017, 695, 2539–2548 CrossRef CAS.
- B. Poojitha, A. Rathore and S. Saha, J. Magn. Magn. Mater., 2019, 483, 212–218 CrossRef CAS.
- I. C. Amaechi, G. Kolhatkar, A. H. Youssef, D. Rawach, S. Sun and A. Ruediger, RSC Adv., 2019, 9, 20806–20817 RSC.
- R. Ren, Z. Wen, S. Cui, Y. Hou, X. Guo and J. Chen, Sci. Rep., 2015, 5, 1–11 Search PubMed.
- L. Q. Wu, Y. C. Li, S. Q. Li, Z. Z. Li, G. D. Tang, W. H. Qi, L. C. Xue, X. S. Ge and L. L. Ding, AIP Adv., 2015, 9, 097210 CrossRef.
- K. Maiti, J. Fink, S. De Jong, M. Gorgoi, C. Lin, M. Raichle, V. Hinkov, M. Lambacher, A. Erb and M. S. Golden, Phys. Rev. B: Condens. Matter Mater. Phys., 2009, 80, 165132 CrossRef.
- M. Vrankić, A. Šarić, S. Bosnar, D. Pajić, J. Dragović, A. Altomare, A. Falcicchio, J. Popović, M. Jurić, M. Petravić, I. J. Badovinac and G. Dražić, Sci. Rep., 2019, 9, 1–11 Search PubMed.
- Y. Zhang, J. Lu, S. Shen, H. Xu and Q. Wang, Chem. Commun., 2011, 47, 5226–5228 RSC.
- J. Ma, W. Bai and J. Zheng, Microchim. Acta, 2019, 186, 1–8 CrossRef CAS PubMed.
- L. Nie, X. Ke and M. Sui, Nanomaterials, 2019, 9, 15–21 Search PubMed.
- A. Mushtaq, S. Ghosh, A. S. Sarkar and S. K. Pal, ACS Energy Lett., 2017, 2, 1879–1885 CrossRef CAS.
- P. Wang, X. Li, S. Fan, X. Chen, M. Qin, D. Long, M. O. Tadé and S. Liu, Appl. Catal., B, 2020, 279, 119340 CrossRef CAS.
- A. Hao, X. Ning, Y. Cao, J. Xie and D. Jia, Mater. Chem. Front., 2020, 4, 2096–2102 RSC.
- Z. Wang, K. Wang, Y. Li, L. Jiang and G. Zhang, Appl. Surf. Sci., 2019, 498, 143850 CrossRef CAS.
- O. Amiri, K. Salar, P. Othman, T. Rasul, D. Faiq and M. Saadat, J. Hazard. Mater., 2020, 394, 122514 CrossRef CAS PubMed.
- J. Erhart, Phys. Educ., 2013, 48, 438–447 CrossRef.
- E. Lin, Z. Kang, J. Wu, R. Huang, N. Qin and D. Bao, Appl. Catal., B, 2021, 285, 119823 CrossRef CAS.
- S. Masimukku, Y. C. Hu, Z. H. Lin, S. W. Chan, T. M. Chou and J. M. Wu, Nano Energy, 2018, 46, 338–346 CrossRef CAS.
- D. Shao, L. Zhang, S. Sun and W. Wang, ChemSusChem, 2018, 11, 527–531 CrossRef CAS PubMed.
- J. Gao, D. Xue, W. Liu, C. Zhou and X. Ren, Actuators, 2017, 6(3), 24 CrossRef.
- J. Wu, N. Qin, E. Lin, B. Yuan, Z. Kang and D. Bao, Nanoscale, 2019, 11, 21128–21136 RSC.
- M. H. Wu, J. T. Lee, Y. J. Chung, M. Srinivaas and J. M. Wu, Nano Energy, 2017, 40, 369–375 CrossRef CAS.
- J. H. Chang and H. N. Lin, Mater. Lett., 2014, 132, 134–137 CrossRef CAS.
- M. Laurenti, N. Garino, N. Garino, G. Canavese, S. Hernandéz, S. Hernandéz and V. Cauda, ACS Appl. Mater. Interfaces, 2020, 12, 25798–25808 CrossRef CAS PubMed.
- Y. Wei, Y. Zhang, W. Geng, H. Su and M. Long, Appl. Catal., B, 2019, 259, 118084 CrossRef CAS.
- S. Lan, J. Feng, Y. Xiong, S. Tian, S. Liu and L. Kong, Environ. Sci. Technol., 2017, 51, 6560–6569 CrossRef CAS PubMed.
- F. Meng, W. Ma, C. Duan, X. Liu, Z. Chen, M. Wang, J. Gao and Z. Zhang, Appl. Catal., B, 2019, 252, 187–197 CrossRef CAS.
- D. Zhong, W. Liu, P. Tan, A. Zhu, Y. Liu, X. Xiong and J. Pan, Appl. Catal., B, 2018, 227, 1–12 CrossRef CAS.
- X. Chu, G. Shan, C. Chang, Y. Fu, L. Yue and L. Zhu, Front. Environ. Sci. Eng., 2016, 10, 211–218 CrossRef CAS.
- W. Zhao, Q. Zhang, H. Wang, J. Rong, L. E and Y. Dai, Nano Energy, 2020, 73, 104783 CrossRef CAS.
- K. Patel, G. K. Solanki, K. D. Patel, P. Pataniya, V. M. Pathak, M. Tannarana, P. Chauhan and M. Patel, AIP Conf. Proc., 2019, 2115, 0–4 CAS.
- S. J. A. Moniz, R. Quesada-Cabrera, C. S. Blackman, J. Tang, P. Southern, P. M. Weaver and C. J. Carmalt, J. Mater. Chem. A, 2014, 2, 2922–2927 RSC.
- S. Lu, Q. Liao, J. Qi, S. Liu, Y. Liu, Q. Liang, G. Zhang and Y. Zhang, Nano Res., 2016, 9, 372–379 CrossRef CAS.
- X. Xue, W. Zang, P. Deng, Q. Wang, L. Xing, Y. Zhang and Z. L. Wang, Nano Energy, 2015, 13, 414–422 CrossRef CAS.
- C. K. Jeong, I. Kim, K. Il Park, M. H. Oh, H. Paik, G. T. Hwang, K. No, Y. S. Nam and K. J. Lee, ACS Nano, 2013, 7, 11016–11025 CrossRef CAS PubMed.
- L. M. Sikhwivhilu, S. Sinha Ray and N. J. Coville, Appl. Phys. A: Mater. Sci. Process., 2009, 94, 963–973 CrossRef CAS.
- G. Jian, Y. Jiao, Q. Meng, Y. Cao, Z. Zhou, K. S. Moon and C. P. Wong, J. Mater. Sci., 2020, 55, 6903–6914 CrossRef CAS.
- J. Yang, J. Zhang, C. Liang, M. Wang, P. Zhao, M. Liu, J. Liu and R. Che, ACS Appl. Mater. Interfaces, 2013, 5, 7146–7151 CrossRef CAS PubMed.
- L. A. Al-Hajji, A. A. Ismail, A. Al-Hazza, S. A. Ahmed, M. Alsaidi, F. Almutawa and A. Bumajdad, J. Mol. Struct., 2020, 1200, 127153 CrossRef CAS.
- J. Ling, K. Wang, Z. Wang, H. Huang and G. Zhang, Ultrason. Sonochem., 2020, 61, 104819 CrossRef CAS PubMed.
- H. Lei, H. Zhang, Y. Zou, X. Dong, Y. Jia and F. Wang, J. Alloys Compd., 2019, 809, 151840 CrossRef CAS.
- R. Zhang, X. Wu, Y. Li, W. Shao, Y. Zhang, Z. Liu, J. Nie, J. Tan and W. Ye, RSC Adv., 2020, 10, 7443–7451 RSC.
- J. Wu, N. Qin and D. Bao, Nano Energy, 2018, 45, 44–51 CrossRef CAS.
- W. Feng, J. Yuan, L. Zhang, W. Hu, Z. Wu, X. Wang, X. Huang, P. Liu and S. Zhang, Appl. Catal., B, 2020, 277, 119250 CrossRef CAS.
- A. Zhang, Z. Liu, B. Xie, J. Lu, K. Guo, S. Ke, L. Shu and H. Fan, Appl. Catal., B, 2020, 279, 2–13 Search PubMed.
- R. Singhal, J. Bhardwaj, R. Vishnoi and S. Aggarwal, J. Alloys Compd., 2018, 767, 733–744 CrossRef CAS.
Footnote |
| † Electronic supplementary information (ESI) available. See DOI: 10.1039/d1ma00106j |
| This journal is © The Royal Society of Chemistry 2021 |

