
 Open Access Article
 This Open Access Article is licensed under a
 Creative Commons Attribution 3.0 Unported Licence
A self-assembling, biporous, metal-binding covalent organic framework and its application for gas separation†
Veronica
Spaulding
 a,
Katarina
Zosel
b,
Phuoc H. H.
Duong
c,
Katie D.
Li-Oakey
c,
Bruce A.
Parkinson
ad,
Diego A.
Gomez-Gualdron
*b and
John O.
Hoberg
*a
a,
Katarina
Zosel
b,
Phuoc H. H.
Duong
c,
Katie D.
Li-Oakey
c,
Bruce A.
Parkinson
ad,
Diego A.
Gomez-Gualdron
*b and
John O.
Hoberg
*a
aDepartment of Chemistry, University of Wyoming, Laramie, Wy 82071, USA
bDepartment of Chemical and Biological Engineering, Colorado School of Mines, Golden, CO 80401, USA. E-mail: dgomezgualdron@mines.edu
cDepartment of Chemical Engineering, University of Wyoming, Laramie, Wy 82071, USA
dSchool of Energy Resources, University of Wyoming, Laramie, Wy 82071, USA
First published on 8th April 2021
Abstract
We report a unique synthesis of a nanoporous two-dimensional covalent organic framework (COF) from a single self-assembling monomer. The novel 2D-COF (DPCOF) contains two chemically distinct nanopores, one that can coordinate transition metals and a second more unreactive pore that is approximately the size of small gas molecules. We then demonstrate the synthetic flexibility of the material by coordination of various transition metals into the framework and finally its application as a membrane for degasification and gas separation. Density functional theory (DFT) and molecular mechanics (MM) calculations were used to inform the computational construction of material models, allowing for the interpretation of pXRD data to elucidate the crystallographic structure of the novel materials, including the revelation that disordered monomer vacancies are likely present in the material.
Introduction
In the past decade there has been increasing interest in covalent two-dimensional organic frameworks (2D-COFs) due to their synthetic flexibility and highly ordered porous structures.1–3 These polymers have enormous potential in the areas of separations,4–7 gas storage,8 energy storage,9–11 and catalysis.12–14 Schiff-base chemistry, i.e. the formation of imine bonds by reaction of an aldehyde or ketone with a primary amine, is one of the primary methods of COF formation.2,15 These reactions are centered on the judicious selection of two or more building blocks that, under appropriate reaction conditions, can reversibly form strong covalent linkages to produce highly ordered materials. Thus, an important challenge is “the match of both shapes and angles of the building units to construct the regular pores of COFs”.15 Schiff-based chemistry for COF synthesis provides multiple features such as enhanced chemical stability and synthetic flexibility. However, given a considerable focus on COFs, to date only one strategy has emerged that utilizes a single precursor that contains both carbonyl and amine functional groups allowing for self-assembly of a 2D-COF, (this report constructed COFs nearly identical to previously known materials as a proof-of-concept).16 COF self-assembly can greatly reduce disorder, inherent in many two reactant 2D-COF formations, potentially resulting in higher crystallinity.10,17–20 In addition, the optimization of the synthetic protocols is greatly simplified since variables such as order of monomers addition, rates of mixing of the two or more reactants, and the often required excess of one reactant to drive the reaction to completion are not in play. Herein, we present such a strategy for synthesis of a highly ordered 2D-COF with two chemically distinct pores one with the inherent ability to strongly bind metal atoms. This ability achieves a still active and long-standing goal in 2D-materials of creating arrays of stable single metal catalytic sites.21 As illustrated below, our strategy allows for the construction of a nanoporous material with highly-ordered arrays of metal atoms in the backbone.Results and discussion
The synthetic strategy is illustrated in Scheme 1, where formation of 2 is achieved by condensation of hexaketocyclohexane with diamine 1, which incorporates two additional tosyl protected amines. Conveniently, 1 is synthesized in three steps in an overall 92% yield using easily scaled up literature methods.22 Facile coupling of three equivalents of 3 with 2 provides monomer 4 in excellent yield where both the required dicarbonyl and protected diamines are incorporated into the 2D-COF precursor. Furthermore, the hexanitro analog of 2 is readily available23 and also undergoes coupling with 3, demonstrating additional variability for the starting monomer. Formation of 4 generates the first pore, labeled A, with a diazaphenanthrene moiety that can bind three metals. Removal of the tosyl (Ts) protecting groups liberates the amine groups for condensation with the carbonyls under microwave (MW) heating24 resulting in self-assembly of the highly conjugated dual pore 2D-COF (DPCOF) containing the second pore (B) in 91% yield.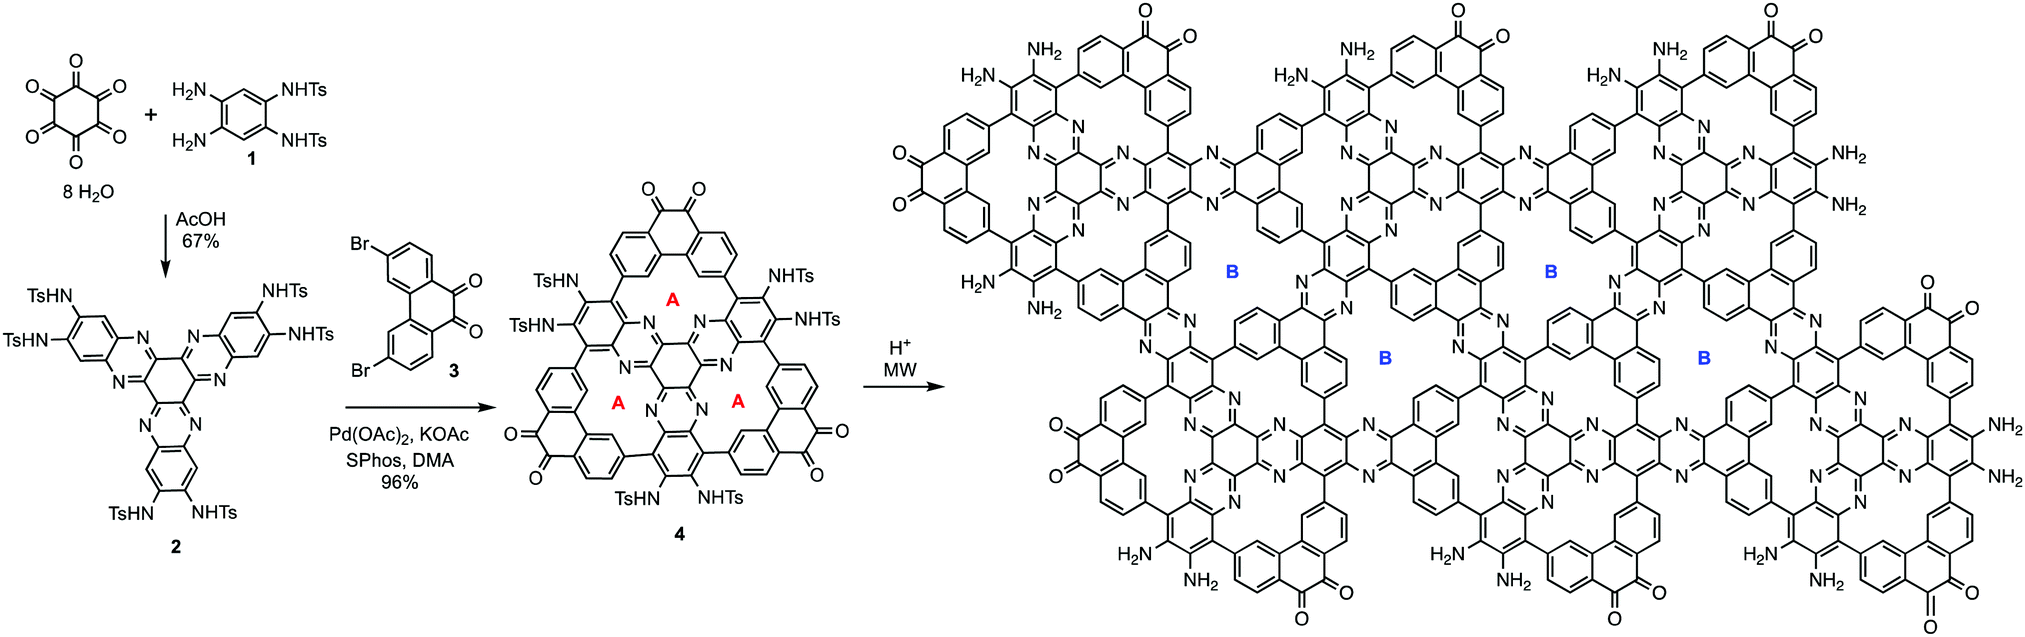 | ||
| Scheme 1 Synthetic pathway for the self-assembly of the two-pore DPCOF. | ||
The space filling model in Fig. 1 illustrates that the C3-symmetry of 4, with its six carbonyls (red) and six amines (blue), enables the nucleation and growth of the 2D-COF via self-assembly to produce DPCOF; with pore B as illustrated in the right structure by the small white pores. DFT modelling indicates that the pore size of B is ∼3 Ångstroms measured from opposing phenanthrene hydrogens.
 | ||
| Fig. 1 Left: 3D space-filling models of seven monomers of 4 in a pre-polymerization configuration, gray = carbon, blue = nitrogen, red = oxygen, green represents either an empty pore or metal atom, hydrogens omitted. Right: 3D space-filling model of the resulting COF. | ||
Both 4 and DPCOF were characterized by multiple techniques to confirm their structures. MALDI-TOF displayed the correct M + H peak for 4 (ESI,† Fig. S3), and IR displayed carbonyl stretches at 1700 cm−1 (ESI,† Fig. S4). Characterization via NMR was unsuccessful as 4 is insoluble in NMR solvents. Synthesis of 4 is quite noteworthy since it represents the formation of six carbon–carbon bonds achieved through six C–H bond activating reactions in excellent yield.
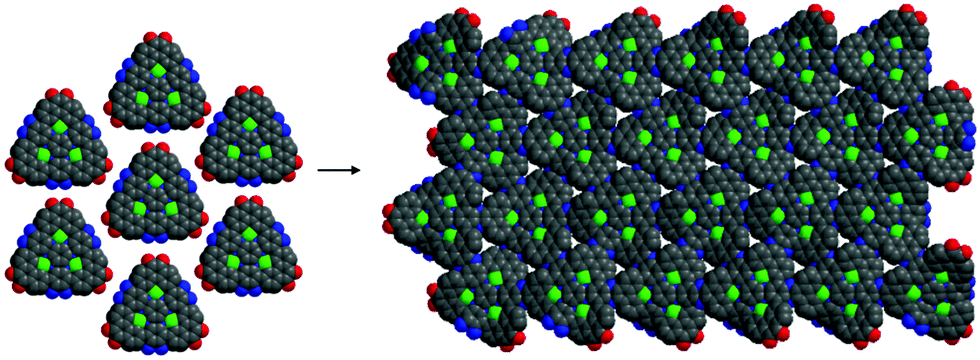
The proposed structure of DPCOF is supported by HRTEM where thin platelet features were imaged, Fig. 2a and b. HRTEM imaging revealed lattice fringes on thin layers of the frameworks, demonstrating the crystallinity of these materials. In addition, selected area electron diffraction (SAD) exhibited many orders of diffraction spots with the expected near hexagonal symmetry (Fig. 2c). Fast Fourier Transform (FFT) performed on theoretical space-filling models confirmed the hexagonal symmetry (see ESI,† Fig. S8) seen in the experimental diffraction patterns.
 | ||
| Fig. 2 TEM images (a) and (b). Diffraction of DPCOF spacing which corresponds to 2 theta 18–19°. The CTEM image displays clear hexagonal symmetry and crystalline order which can be seen in DPCOF SAD (c) diffraction from (b). | ||
To further elucidate the structure of the synthesized DPCOF, we built plausible computational structure models informed by density functional theory (DFT) and molecular mechanics (MM) calculations, using the Gaussian 16![[thin space (1/6-em)]](https://www.rsc.org/images/entities/char_2009.gif) 25 and Materials Studio software,26 respectively. The model that most faithfully reproduced the features of experimentally collected PXRD patterns for the synthesized materials was determined and considered to be the optimum crystallographic structure. This strategy has been used with success by some of us to elucidate the structure of both MOFs27 and COFs.28
25 and Materials Studio software,26 respectively. The model that most faithfully reproduced the features of experimentally collected PXRD patterns for the synthesized materials was determined and considered to be the optimum crystallographic structure. This strategy has been used with success by some of us to elucidate the structure of both MOFs27 and COFs.28
The subsequent paragraphs provide details used to construct models using a bottom-up approach where a sheet of DPCOF was “grown” by methodically piecing together smaller subsections of the sheet to form larger subsections, that were in turn pieced together until an infinitely repeating pattern became apparent, allowing the identification of the periodically repeating unit. Subsequently a unit cell hosting the periodically repeating unit was constructed to reproduce an infinitely extended DPCOF sheet in the a and b crystallographic directions with infinitely stacked sheets in the c direction.
Unit cell construction (pristine model)
The procedure started by using non-periodic DFT calculations with the B3LYP functional and the 6-31+g* basis set to optimize the geometry of the two hypothesized subsections of the DPCOF sheet models (Fig. 3 blue) for the hypothesized monomer 4 (Scheme 1), which contains three A pores, but extended just enough to model the linkage to other monomers. The second subsection (Fig. 3b) models the hypothesized B pore (Scheme 1) corresponding to the “gaps” between connected monomers. In these optimizations, the electronic structure was solved by converging the electron density matrix until the root mean square (RMS) of changes and maximum change of its elements is less than 10−8 and 10−6, respectively. The geometries were evolved until the RMS of forces and maximum force in atoms was less than 4.5 × 10⁻⁴ and 3.0 × 10⁻⁴, respectively (these criteria are all in atomic units). A salient feature of these DFT-optimized subsections was their curvature, suggesting the DPCOF sheet to be rippled rather than flat (Fig. 3). Notably, this rippling was maintained when reoptimizing these subsections using other functionals such as M06L and ωB97XD (ESI† Fig. S11). | ||
| Fig. 3 Overlap between DFT-optimized B3LYP/6-31+g* (blue) and MM-optimized (UFF, orange) subsections of hypothesized DPCOF structure. (a) Subsection centered around monomer 4. (b) Subsection centered around B pore. Perspective view illustrates the inherent curvature of DPCOF chemical “building blocks.”. | ||
At this point, it became apparent that to fully understand the rippling of the DPCOF sheet we needed to optimize the geometry of larger pieces of the hypothesized DPCOF structure. However, because DFT calculations on these larger pieces would be intractable (the subsections shown in Fig. 3 already feature more than 100 atoms), MM calculations using classical force fields were used from this point on. We settled for the universal force field (UFF),29 because optimizations using this force field yielded similar geometries (most notably, similar curvature patterns) for the smallest DPCOF pieces in the DFT calculations (Fig. 3 orange).
Confident in the suitability of MM calculations with UFF for our calculations, we proceeded to piece together and optimize increasingly large subsections, composed of 4, 7 and 13 assembled monomers, respectively (Fig. 4). These non-periodic calculations evaluate whether the “rippling” pattern remains consistent as DPCOF sheet size increases and allows identification of a periodic repeating pattern to enable extraction of a unit cell. These optimizations were done using the Forcite module in Materials Studio. Atom types to assign UFF parameters were based on atom hybridization and bond type. Structures were optimized until energy changes fell below 10−5 kcal mol−1.
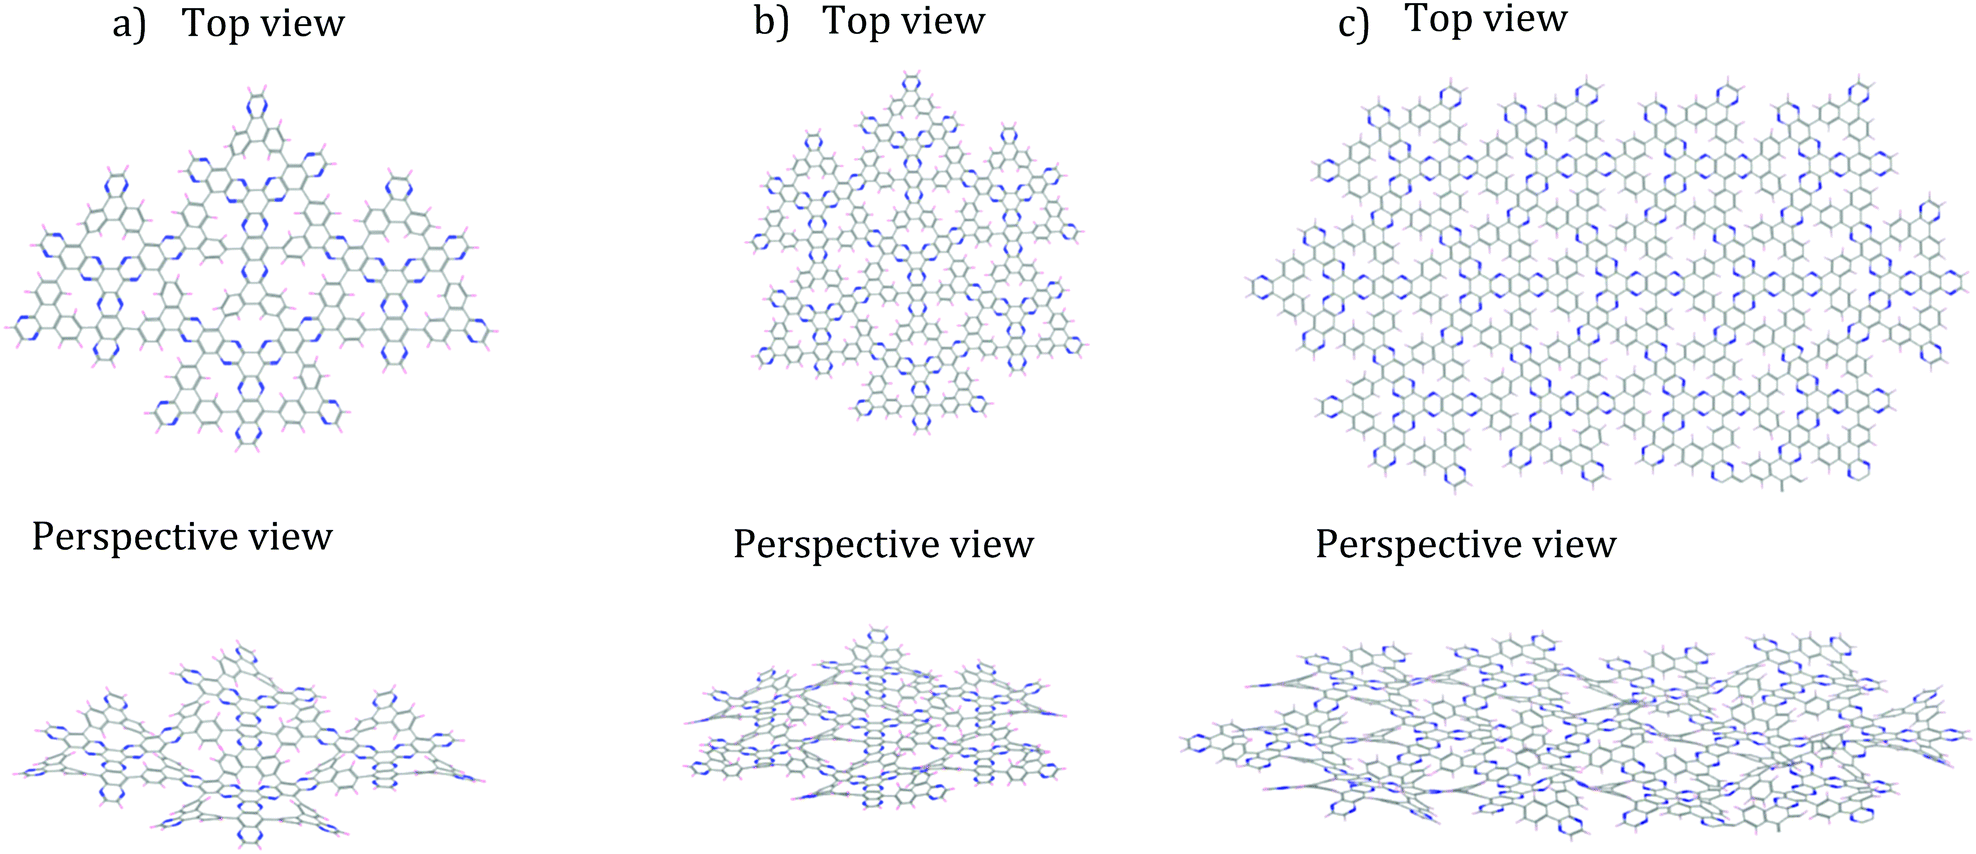 | ||
| Fig. 4 Finite DPCOF sheets made up by n monomers 4 optimized with non-periodic MM calculations. (a) n = 4, (b) n = 7, (c) n = 13. The observed rippling is maintained as the sheet increases in size. | ||
As the sheet size increased, the rippling tended to flatten somewhat, but for the most part the rippling pattern was maintained as observed by overlaying the monomer over the 4-monomer sheet, and the 4-monomer sheet over the 13-monomer sheet (see ESI,† Fig. S9). The 13-monomer sheet was then used to identify the periodic pattern (red diamond in Fig. 5a for the proposed DPCOF structure), from which a prototype periodic DPCOF model using the Crystal Builder Module in Materials Studio was built. Unit cell dimensions were made equal to the measured dimensions of the red diamond in Fig. 5a, which again, was determined from the 13-monomer sheet. Once the prototype was obtained, atom positions were optimized while the lattice was kept fixed.
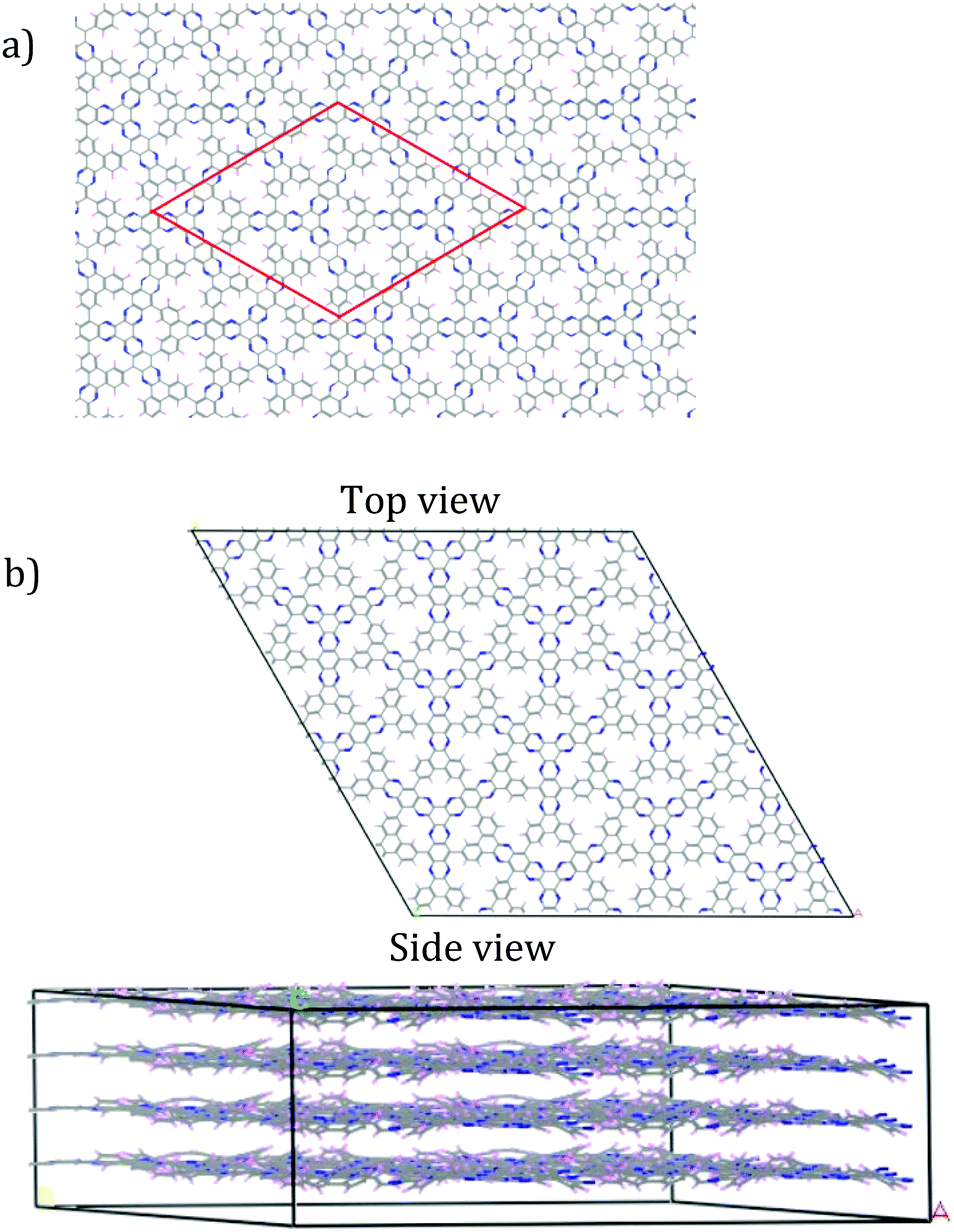 | ||
| Fig. 5 Construction of periodic model for preliminary DPCOF structure. (a) Repeating pattern illustrated by red-diamond identified from the 13-monomer sheet in Fig. 4. (b) An illustrative 2 × 2 × 4 supercell constructed from the obtained DPCOF unit cell. | ||
Comparison of simulated and experimental PXRD patterns
The construction of the DPCOF unit cell allowed us to simulate its PXRD pattern and compare it to the experimental pattern (Fig. S10, ESI†). Low incidence angle thin film PXRD characterization using a drop-cast film was performed allowing the identification of any structural defects in a 2D orientated thin film. Based on the procedure described in the preceding subsection, the unit cell on which the pattern was simulated had a = 31.00 Å, b = 31.20 Å and c =4.9 Å, α = 90°, β = 90°, γ = 120°. The parameter c was modified to match the pXRD peak at 2θ = 18.1 Å, which corresponds to the separation between stacked DPCOF layers. Thus, the c values revealed an interlayer spacing of 4.9 Å. At this point, we were able to match several peaks between the simulated and measured pXRD patterns, including some peaks related to the expected separation patterns for pores A and B (Fig. S10, ESI†). However, with this pristine DPCOF model many other features were still left unmatched such as experimental peaks at 2θ = 4.6° and 2θ = 4.1°, and a broad experimental feature between 2θ = 6.5° and 2θ = 9.5°Because the pristine DPCOF model could not account for above mentioned reflections, and the d-spacing that would be associated with some of those reflections was somewhat commensurate with the size of a monomer building block (e.g., 2θ = 4.1 Å corresponds to d spacing of ∼19.21 Å), we hypothesized that these reflections could be associated with the presence of monomer vacancy defects in the otherwise ordered DPCOF structure. To examine this possibility, vacancy defects were introduced in the DPCOF model, testing different arrangements for monomer removal (Fig. 6). Once a monomer was (computationally) removed, the “dangling bonds” were capped by Ts protecting groups and oxygen as observed on the edges of the final structure in Scheme 1 and as might be expected in the actual synthetic reaction.
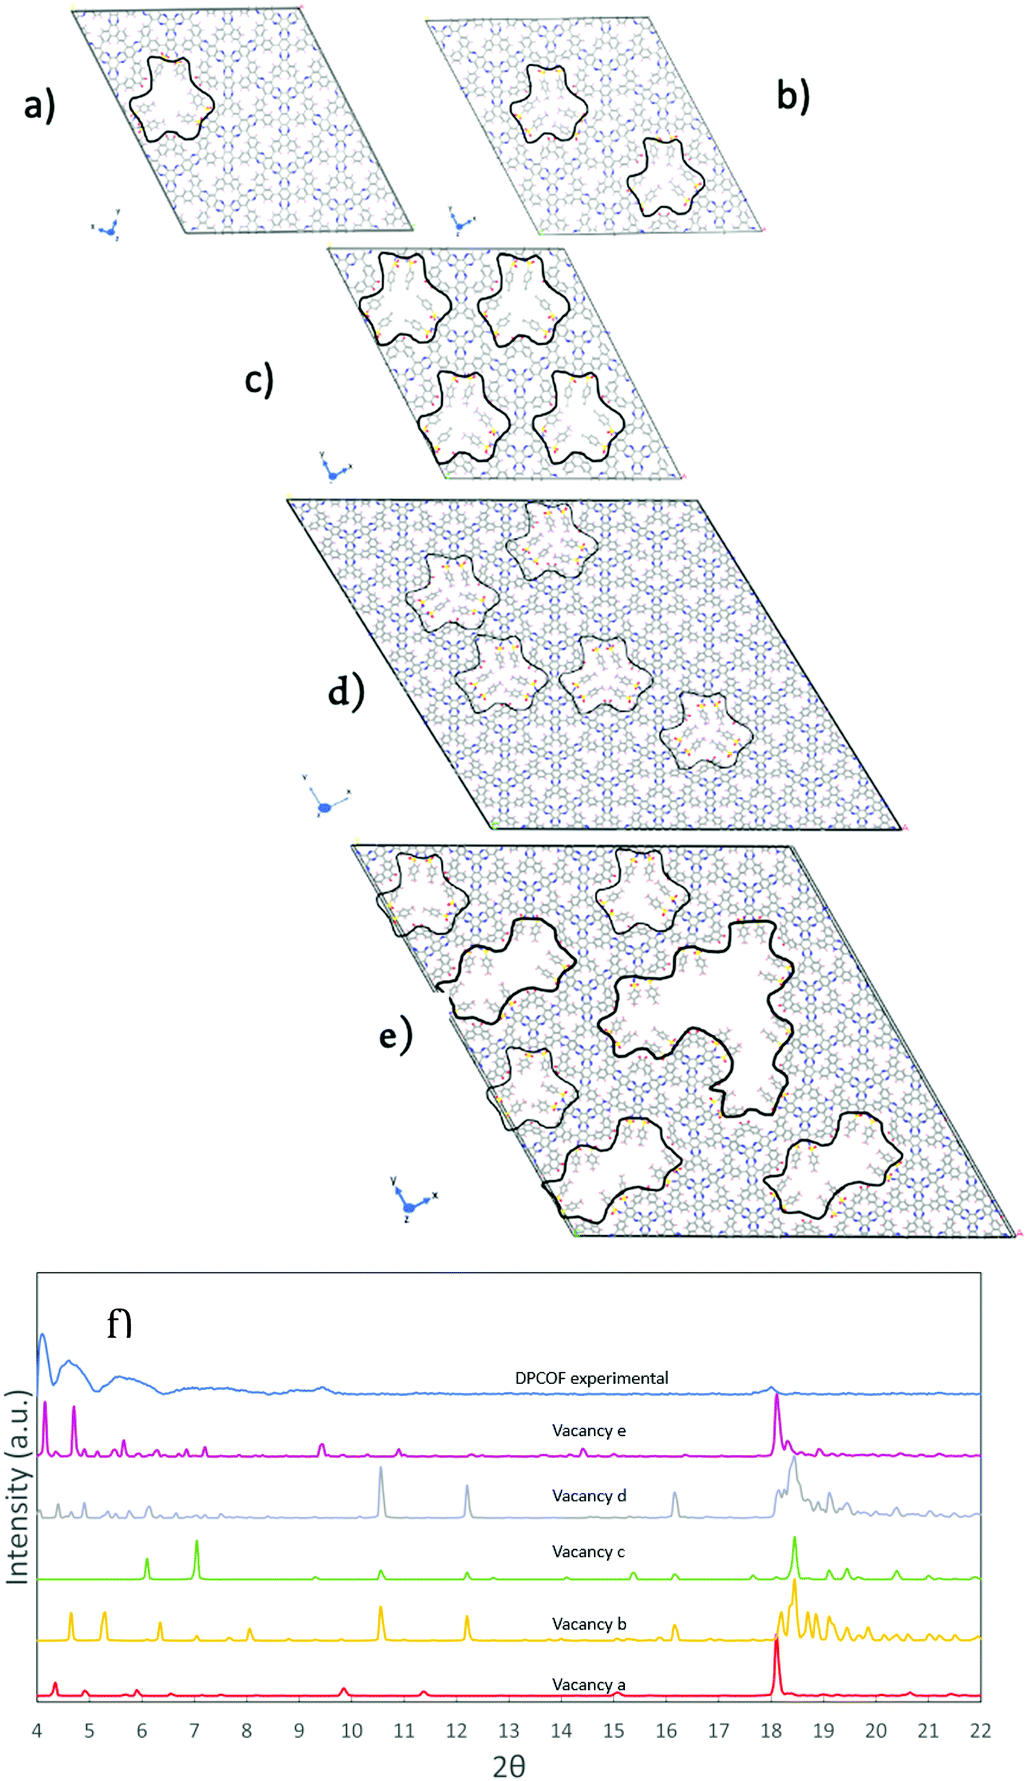 | ||
| Fig. 6 (a–e) DPCOF models including vacancy patterns obtained by removing monomers from pristine DPCOF model, and then capping with Ts protecting groups. (f) Simulated pXRD patterns for the DPCOF models with the vacancy patterns a–e. We deemed the model with “super-vacancies” (e) as the most representative of the atomic structure of the synthesized DPCOF. | ||
Removing a monomer from a 2 × 2 × 4 supercell (Fig. 6a) did give rise to reflections for 2θ values in the 4–5° range, but not to the extent observed in the experimental pattern. On the other hand, creating a second vacancy (Fig. 6b) shifted the lowest 2θ peaks from the range on interest, and upon creating the maximum possible number of monomer vacancies (i.e., four) for the 2 × 2 × 4 supercell (Fig. 6c) these reflections vanish again, because the highly ordered vacancies created a homogenous material of similar symmetry to the pristine DPCOF model. At this point, considering that these vacancies would be present in a random fashion as a DPCOF layer grows during synthesis, we aimed to introduce some degree of disorder by creating a 4 × 4 × 4 supercell and creating five vacancies in a pattern that does not follow the underlying symmetry of the pristine DPCOF layer. This resulted in larger numbers of reflections in the 4° to 5° range to reappear. Additionally, when a higher density of random vacancies (including some super-vacancies) is introduced in the 4 x 4 x 4 supercell (Fig. 6e) and the a, b parameters are expanded 4.8% to account for the tosyl group capping (a = 130 Å, b = 130 Å) and to correct for the force field tendency to somewhat underestimate unit cell size in MOFs and COFs,30 the six main peaks for the experimental DPCOF were aligned and also observed in the PXRD.
Notice that with our inherently periodic models we cannot escape long-range order when we create these vacancies, therefore the simulated patterns present “artifact” reflections at 2θ values below the lower experimental bound (2θ = 3.5 Å) as the vacancy pattern in one supercell would appear exactly in the same way in the reproduced periodic images of the model. However, from work with modelling defective MOFs, it is well-known that those kinds of reflections do not appear in experimental patterns,3131hence were ignored here. Additionally, the inherent periodicity of the model also makes it that the peaks associated with vacancy formation are well-defined in the simulation. However, as in the synthesized DPCOF sample these vacancies appear in disordered fashion, in the experimental pattern the peaks associated with these vacancies are broad and merge to form even broader features. For example, the second, third, and fourth leftmost peaks in the pXRD for the vacancy pattern e likely combine to make the second leftmost peak in the experimental pXRD (Fig. 6f).
Nitrogen adsorption isotherms were also measured (Fig. S12, ESI†). As noted above, the pore size of these COFs results in small voids and if the layers on either face of a single sheet are offset so as not to produce a passage for nitrogen gas in the structure, little to no sorption would result. Even if it did and with the proposed vacancies, the pores might only contain one or two nitrogen molecules making it indistinguishable from the simple surface area. Thus, the Brunauer–Emmett–Teller (BET) characterization confirms only the 2D surface area of the sheets, as noted previously.32,33
Metal functionalized COFs
As indicated above, pore A has the potential to complex metals within the pore as it has the same structure as many monomeric metal macrocyclic complexes that contain phenanthrene and phenanthroline moieties. Metals that are known for C–H insertion, with concurrent nitrogen coordination in metal biphenyl and bipyridyl complexes,34,35–37 were therefore investigated for reaction with 4 as shown in Scheme 2. Successful insertion of iridium, platinum and nickel into the pores was accomplished in high yields using microwave heating. It should be noted that attempts at using thermal conditions did not result in insertion of the metals into 4 in reasonable yields and time scales. This attribute of microwave-heated synthesis in organometallic reactions has been noted previously38 along with mechanistic discussions on C–H activation of arene systems.39 Again, MALDI characterization of monomers 5–7 showed the correct isotopic patterns and mass values with the incorporated metals (see ESI,† Fig. S5–S7). Metal nanoparticles were observed in XRD and TEM images only for platinum in the formation of 6, which is likely due to the higher dissociation energy of the Pt–Cl bond. The use of Pt(OAc)2 did not resolve this issue. This highlights the requirements for judicious choice of the metal based on dissociation energies of the metal ligand bonds. Metal incorporated 2D COFs were obtained by deprotection of 5–7 with microwave heating to produce IrCOF, PtCOF and NiCOFs. As illustrated in Fig. 1 above, the use of monomers 5–7 perpetuates the ordered arrangement of these single metal atoms throughout the COF to produce ordered arrays of metal containing 2D-materials.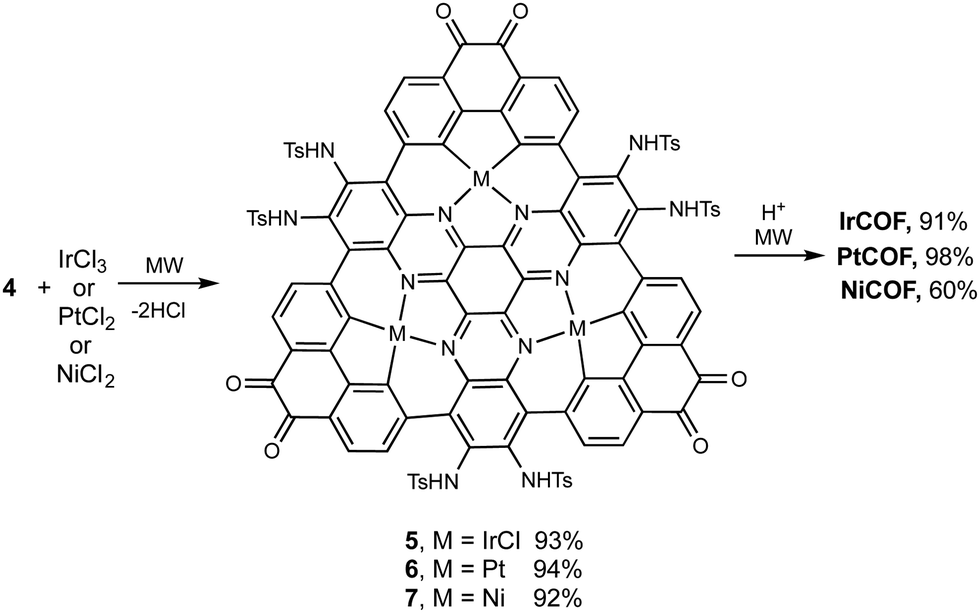 | ||
| Scheme 2 Incorporation of metals into monomer 4 and formation of COFs. See Fig. 1 for COF drawings in which green represents metals. | ||
The metalated COFs also exhibit plate-like structures spanning several hundred nanometers, often with hexagonal shapes and 120° angles as exhibited in the TEM image in Fig. 7a. Multilayers, related to various possible layer stacking polytypes, produced TEM images with complex order such as shown in Fig. 7b and the corresponding complex selected area diffraction which shows distinctive crystalline patterns in Fig. 7c. (see also ESI,† Fig. S13). The high contrast in the TEM images of the metalated COFs is related to the presence of the much heavier metal atoms in the structure.
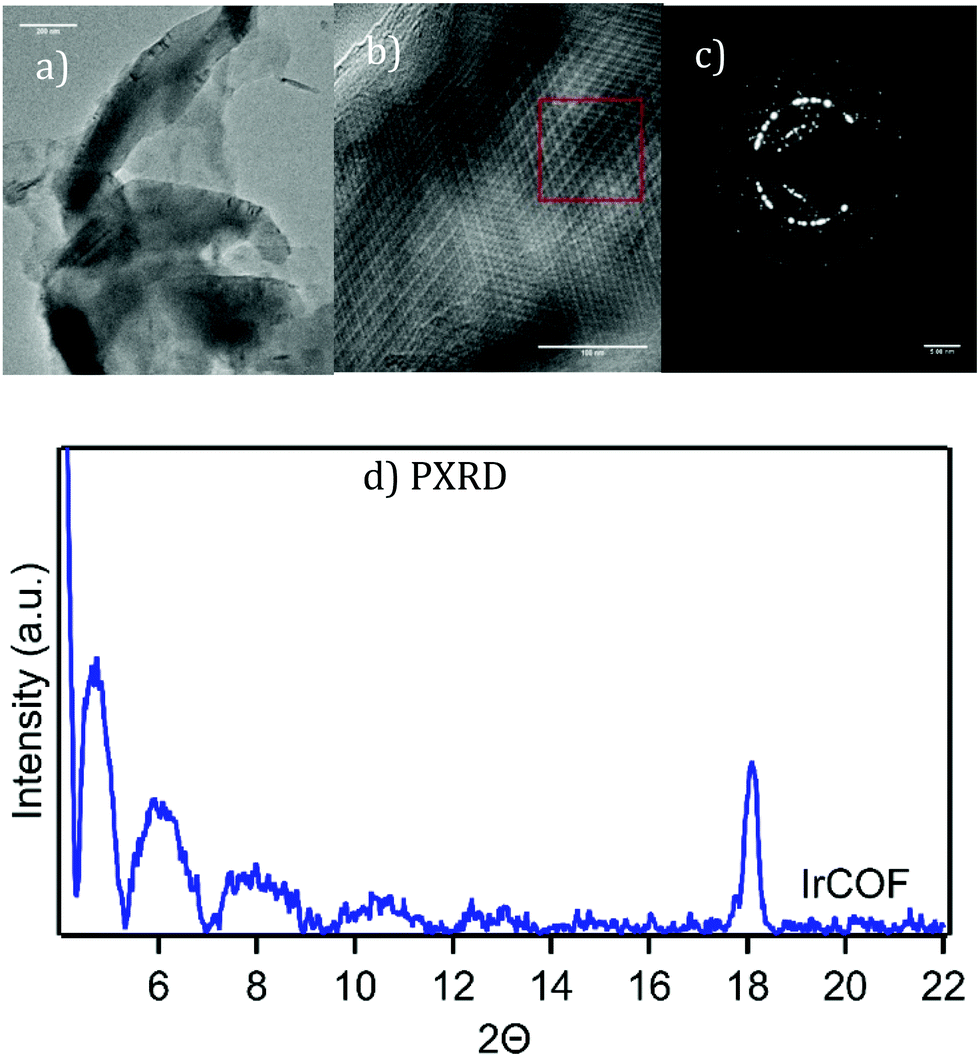 | ||
| Fig. 7 (a) and (b) HRTEM images of IrCOF showing platelet structures, ordered multilayers, see ESI† Fig. S13 for enlargement of (b) and (c) a selected area of diffraction of the area in red box. See ESI,† Fig. S14–S19 for additional images including PtCOF & NiCOF including PXRD. (d) Thin-film PXRD of experimental IrCOF. | ||
The PXRD pattern of the metalated COFs, after treatment with scCO2 extraction, show the same low angle peaks between 4–5° range (Fig. 7d),40 presumably due to the presence of similar vacancies. The PtCOF had additional broad lines due to the presence of platinum nanoparticles that were also identified in TEM, STEM and EDAX, as well as in XPS analysis showing the presence of Pt(0) (ESI,† Fig. S17 and 18). The NiCOF and IrCOF, however, did not show the presence of metal nanoparticles in the product. EDX of IrCOF exhibited the expected Ir:Cl:N ratios (see ESI,† Fig. S13) confirming the presence of the IrCl moiety in the COF.
Finally, 1H cross-polarized magic angle spinning (CP-MAS) solid-state NMR was conducted on monomer 4, DPCOF and PtCOF (ESI,† Fig. S20). 1H solid-state NMR was chosen over 13C NMR as the protons in pore B would be expected to experience a noticeable chemical shift upon polymerization. As expected, a perceptible change in the 1H NMR spectrum was observed after the formation of the COFs with significant broadening of the signals suggesting a very rigid polymeric material.41 Additionally, the loss of the NH resonance and shifting of the aromatic protons were also observed, further confirming the formation of the COFs.
Membranes were fabricated by low vacuum assisted filtration of an exfoliated DPCOF solution onto a 20 nm pore size anodic aluminum oxide (AAO) membrane support producing a thickness of 300–500 nm. Liquid filtration tests were performed under a trans-membrane pressure of 10 bar using ethanol, water and hexane as feeds. Pure gas permeance of H2, O2, and N2 were measured under a transmembrane pressure of 5 psi (0.344 bar) at room temperature. Table 1 illustrates the results in which clear separation capabilities are observed. As seen, permeance of both polar and nonpolar solvents are negligible especially compared to high performance membranes in which permeance values are in the thousands.4,5 Alternatively, permeance of gases through the same membrane displayed extraordinary gas permeance easily surpassing current benchmarks.45–47
| Liquid feed | Liquid permeance (L m−2 h−1 bar−1) | Gas feed | Gas permeance | |
|---|---|---|---|---|
| (L m−2 h−1 bar−1) | GPUa | |||
| a Data converted to GPU for direct comparison of our results to those reported.46 GPU = 1 × 10⁻⁶ cm3 (STP) cm−2 s−1 cm−1 Hg−1). | ||||
| Ethanol | 1.4 | H2 | 246000 |
91000 |
| Water | 0.91 | O2 | 159000 |
59000 |
| Hexane | 0.14 | N2 | 124000 |
46000 |
Further studies were performed to determine whether gas separations with metalated COFs are affected by the proposed vacancies. The effect of vacancies would be influenced both by their number and whether or not the vacancies align between layers in the membranes that consist of many COF layers potentially providing a more direct path through the membranes.
In these studies, given its size, hydrogen would be expected to more easily pass through a COF membrane, while larger gases such propane and SF6 would be blocked. Using PtCOF on a track etched polycarbonate membrane support, a series of gases were tested for flow rates and separation factors. A membrane cell (see ESI,† Fig. S21) was fitted with the membrane and flow was measured at the entry and outlet ports to ascertain the flow reduction due to the membrane. As illustrated in Table 2 hydrogen flows unimpeded through the membrane with no measurable loss of rate. The rates for both CO2 and SF6 were reduced by a factor of 5 and the complete exclusion of C3H8 was observed. It does appear that the metal may have some effect as DPCOF produced a lowered reduction in flow rate for SF6. Finally, we tested the ability to separate H2 from propane. In this experiment, an equal mixture of the gases was introduced, and the composition outlet gas was analyzed for its composition. As expected, a gas enriched with hydrogen rich gas was measured.
| Gas | Inlet rate | Outlet rate | DPCOF rate |
|---|---|---|---|
| a Units in L per minute. | |||
| H2 | 0.5 | 0.5 | — |
| CO2 | 0.5 | 0.1 | — |
| SF6 | 0.5 | 0.1 | 0.2 |
| C3H8 | 1.0 | 0.0 | — |
Although the exclusion of propane in PtCOF is impressive, when compared to published COF membranes, the separation factor of other gases is better.7 However, given the likely inclusion of vacancies in the COFs, the permeance of gases through the membrane is significant and compares extremely well to other membranes.44–46 The selectivity of H2/C3H8 coupled with the high permeance of gases suggests this framework would be ideal for dehydrogenation and subsequent separation of H2 from propene, which is a goal for future work.
Conclusions
Using a single small molecule as the building block, we have constructed a covalent organic framework via a novel self-assembly reaction.20 These materials are suitable for many applications due to their low mass densities, high order, inclusion of metals and permanent porosity.3 While the condensation reaction did not create a perfectly ordered COF, significant control of the lattice structures desired in the final 2D material yielding highly ordered polymeric materials with grain sizes on the order of microns was achieved. HRTEM and diffraction display the highly crystalline nature of the COF materials with platelet morphology and hexagonal diffraction patterns. The result of this successful synthesis also achieves a long-standing goal in 2D materials – highly ordered single metal incorporation. In comparison to other 2D materials, where metals are incorporated using a post synthetic strategy, our strategy introduces the functional metals directly into the monomer prior to COF formation. The result is a fully metalated COF that is decorated in a completely ordered array as illustrated in Fig. 1. This achievement allows for tunable chemical properties depending on the desired application; for instance, using transition metals in pore A, cross-linked materials using bifunctional ligands such as diamines or diphosphines can be envisioned. Furthermore, the variety of metals that are included in these COFs range from 1st and 3rd row transition metals and incorporate the oxidation states used in a variety of catalytic processes. Equally significant are the variations on this theme that can be imagined with the use of diverse linkers, the use of phenanthrolines vs. the phenanthrene used in 4 and any number of mixed metals in 4 (i.e. a mixture of monomers 4 in which one contains iridium atoms and another platinum or a statistical array of different metals in each monomer). In addition, a significant potential application of these materials has been demonstrated for degasification based on size with selectivity towards very small gas molecules. Studies are also underway to address the vacancies via the use of annealing with monomeric units and/or the use of alternative nitrogen protecting groups that are more easily removed compared to tosylates. A novel method of monitoring this process should be feasible with the use of thin-film PXRD.Author contributions
V. S. synthetic investigations, K. Z./D. G. G. modelling investigations, P. H. H. D. membrane fabrication, K. L. O. membrane supervision, B. P. conceptualization and writing, J. H. conceptualization and writing.Conflicts of interest
There are no conflicts to declare.Acknowledgements
The authors acknowledge generous support from DOE-BES grant #DE-SC0020100, the University of Wyoming's School of Energy Resources, NSF REU grant #1358498, Ronald E. McNair Post baccalaureate Achievement Program (V. S.), Wyoming Research Scholars Program (V. S.), and the Colorado School Mines Undergraduate Research (MURF) Fellowship (K. Z.)Notes and references
- C. S. Diercks and O. M. Yaghi, Science, 2017, 355, eaal1585 CrossRef PubMed.
- P. J. Waller, F. Gándara and O. M. Yaghi, Acc. Chem. Res., 2015, 48, 3053–3063 CrossRef CAS PubMed.
- X. Feng, X. Ding and D. Jiang, Chem. Soc. Rev., 2012, 41, 6010 RSC.
- V. A. Kuehl, J. Yin, P. H. H. Duong, B. Mastorovich, B. Newell, K. D. Li-Oakey, B. A. Parkinson and J. O. Hoberg, J. Am. Chem. Soc., 2018, 140, 18200–18207 CrossRef CAS.
- P. H. H. Duong, V. A. Kuehl, B. Mastorovich, J. O. Hoberg, B. A. Parkinson and K. D. Li-Oakey, J. Membr. Sci., 2019, 574, 338–348 CrossRef CAS.
- C. Zhang, B.-H. Wu, M.-Q. Ma, Z. Wang and Z.-K. Xu, Chem. Soc. Rev., 2019, 48, 3811–3841 RSC.
- S. Yuan, X. Li, J. Zhu, G. Zhang, P. Van Puyvelde and B. Van der Bruggen, Chem. Soc. Rev., 2019, 48, 2665–2681 RSC.
- H. Furukawa and O. M. Yaghi, J. Am. Chem. Soc., 2009, 131, 8875–8883 CrossRef CAS PubMed.
- C.-Y. Lin, D. Zhang, Z. Zhao and Z. Xia, Adv. Mater., 2018, 30, 1703646 CrossRef PubMed.
- X. Feng, L. Liu, Y. Honsho, A. Saeki, S. Seki, S. Irle, Y. Dong, A. Nagai and D. Jiang, Angew. Chem., Int. Ed., 2012, 51, 2618–2622 CrossRef CAS PubMed.
- T. Banerjee, K. Gottschling, G. Savasci, C. Ochsenfeld and B. V. Lotsch, ACS Energy Lett., 2018, 3, 400–409 CrossRef CAS PubMed.
- H. Wang, H. Wang, Z. Wang, L. Tang, G. Zeng, P. Xu, M. Chen, T. Xiong, C. Zhou, X. Li, D. Huang, Y. Zhu, Z. Wang and J. Tang, Chem. Soc. Rev., 2020, 49, 4135–4165 RSC.
- S.-Y. Ding, J. Gao, Q. Wang, Y. Zhang, W.-G. Song, C.-Y. Su and W. Wang, J. Am. Chem. Soc., 2011, 133, 19816–19822 CrossRef CAS PubMed.
- H.-C. Ma, G.-J. Chen, F. Huang and Y.-B. Dong, J. Am. Chem. Soc., 2020, 142, 12574–12578 CrossRef CAS PubMed.
- J. L. Segura, M. J. Mancheño and F. Zamora, Chem. Soc. Rev., 2016, 45, 5635–5671 RSC.
- Y. Li, Q. Chen, T. Xu, Z. Xie, J. Liu, X. Yu, S. Ma, T. Qin and L. Chen, J. Am. Chem. Soc., 2019, 141, 13822–13828 CrossRef CAS PubMed.
- V. Nguyen and M. Grünwald, J. Am. Chem. Soc., 2018, 140, 3306–3311 CrossRef CAS PubMed.
- B. Gole, V. Stepanenko, S. Rager, M. Grüne, D. D. Medina, T. Bein, F. Würthner and F. Beuerle, Angew. Chem., Int. Ed., 2018, 57, 846–850 CrossRef CAS PubMed.
- H. S. Sasmal, A. Halder, S. K. H., K. Dey, A. Nadol, T. G. Ajithkumar, P. R. Bedadur and R. Banerjee, J. Am. Chem. Soc., 2019, 141, 20371–20379 CrossRef CAS PubMed.
- J. F. Dienstmaier, D. D. Medina, M. Dogru, P. Knochel, T. Bein, W. M. Heckl and M. Lackinger, ACS Nano, 2012, 6, 7234–7242 CrossRef CAS PubMed.
- M. Babucci, F. E. Sarac Oztuna, L. Debefve, A. Boubnov, S. R. Bare, B. C. Gates, U. Unal and A. Uzun, ACS Catal., 2019, 9, 9905–9913 CrossRef CAS.
- J. A. Rombouts, J. Ravensbergen, R. N. Frese, J. T. M. Kennis, A. W. Ehlers, J. C. Slootweg, E. Ruijter, K. Lammertsma and R. V. A. Orru, Chem. – Eur. J., 2014, 20, 10285–10291 CrossRef CAS PubMed.
- S. Marder, B. Kaafarani, S. Barlow, B. Kippelen, B. Domercq, Q. Zhang and T. Kondo, Charge-Transport Materials, Methods of Fabrication Thereof, and Methods of Use Thereof, WO 2005/123737 A2, 2005 Search PubMed.
- B. Díaz de Greñu, J. Torres, J. García-González, S. Muñoz-Pina, R. de Los Reyes, A. M. Costero, P. Amorós and J. V. Ros-Lis, ChemSusChem, 2021, 14, 208–233 CrossRef PubMed.
- M. J. Frisch, G. W. Trucks, H. B. Schlegel, G. E. Scuseria, M. A. Robb, and J. R. Cheeseman, Gaussian 16, Revision C.01, 2016.
- BIOVIA, Dassault Systèmes, Materials Studio-6.0, San Diego: Dassault Systèmes, 2016.
- P. Li, N. A. Vermeulen, C. D. Malliakas, D. A. Gómez-Gualdrón, A. J. Howarth, B. L. Mehdi, A. Dohnalkova, N. D. Browning, M. O’Keeffe and O. K. Farha, Science, 2017, 356, 624–627 CrossRef CAS PubMed.
- Y.-L. Wu, N. E. Horwitz, K.-S. Chen, D. A. Gomez-Gualdron, N. S. Luu, L. Ma, T. C. Wang, M. C. Hersam, J. T. Hupp, O. K. Farha, R. Q. Snurr and M. R. Wasielewski, Nat. Chem., 2017, 9, 466–472 CrossRef CAS PubMed.
- A. K. Rappe, C. J. Casewit, K. S. Colwell, W. A. Goddard and W. M. Skiff, J. Am. Chem. Soc., 1992, 114, 10024–10035 CrossRef CAS.
- D. A. Gómez-Gualdrón, Y. J. Colón, X. Zhang, T. C. Wang, Y.-S. Chen, J. T. Hupp, T. Yildirim, O. K. Farha, J. Zhang and R. Q. Snurr, Energy Environ. Sci., 2016, 9, 3279–3289 RSC.
- M. J. Cliffe, W. Wan, X. Zou, P. A. Chater, A. K. Kleppe, M. G. Tucker, H. Wilhelm, N. P. Funnell, F.-X. Coudert and A. L. Goodwin, Nat. Commun., 2014, 5, 4176 CrossRef CAS PubMed.
- C. Zhao, C. S. Diercks, C. Zhu, N. Hanikel, X. Pei and O. M. Yaghi, J. Am. Chem. Soc., 2018, 140, 16438–16441 CrossRef CAS PubMed.
- G. Ji, X. Gao, S. Smart, S. K. Bhatia, G. Wang, K. Hooman and J. C. D. da Costa, Processes, 2018, 6, 239 CrossRef CAS.
- D. A. Laviska, T. Zhou, A. Kumar, T. J. Emge, K. Krogh-Jespersen and A. S. Goldman, Organometallics, 2016, 35, 1613–1623 CrossRef CAS.
- F. Roudesly, J. Oble and G. Poli, J. Mol. Catal. Chem., 2017, 426, 275–296 CrossRef CAS.
- R. Giri, B.-F. Shi, K. M. Engle, N. Maugel and J.-Q. Yu, Chem. Soc. Rev., 2009, 38, 3242 RSC.
- S. B. Kalidindi, K. Yusenko and R. A. Fischer, Chem. Commun., 2011, 47, 8506–8508 RSC.
- C. K. Lombard, K. L. Myers, Z. H. Platt and A. W. Holland, Organometallics, 2009, 28, 3303–3306 CrossRef CAS.
- W. E. Christman, T. J. Morrow, N. Arulsamy and E. B. Hulley, Organometallics, 2018, 37, 2706–2715 CrossRef CAS.
- X. Feng, Y. Dong and D. Jiang, CrystEngComm, 2013, 15, 1508–1511 RSC.
- A. J. Simpson, B. Lam, M. L. Diamond, D. J. Donaldson, B. A. Lefebvre, A. Q. Moser, A. J. Williams, N. I. Larin and M. P. Kvasha, Chemosphere, 2006, 63, 142–152 CrossRef CAS PubMed.
- I. T. Meireles, S. C. Fraga, R. M. Huertas, C. Brazinha, I. M. Coelhoso and J. G. Crespo, J. Membr. Sci., 2018, 562, 1–8 CrossRef CAS.
- J. Su and Y. Wei, J. Water Proc. Eng., 2019, 30, 100572 CrossRef.
- S.-Y. Yan, Y.-J. Wang, H. Mao and Z.-P. Zhao, RSC Adv., 2019, 9, 19164–19170 RSC.
- H. B. Park, J. Kamcev, L. M. Robeson, M. Elimelech and B. D. Freeman, Science, 2017, 356, eaab0530 CrossRef PubMed.
- R. W. Baker and B. T. Low, Macromolecules, 2014, 47, 6999–7013 CrossRef CAS.
- M. Qasim, M. Badrelzaman, N. N. Darwish, N. A. Darwish and N. Hilal, Desalination, 2019, 459, 59–104 CrossRef CAS.
Footnote |
| † Electronic supplementary information (ESI) available: All experimental and characterization data for the synthesis of 1–7, IR and TEM data of COFs DPCOF, IrCOF, PtCOF and NiCOF. (CP-MAS) solid-state NMR for monomer 4, DPCOF and PtCOF. Experimental protocol for membrane formation and testing. See DOI: 10.1039/d1ma00056j |
| This journal is © The Royal Society of Chemistry 2021 |