
 Open Access Article
 This Open Access Article is licensed under a Creative Commons Attribution-Non Commercial 3.0 Unported Licence
Simultaneous improvement of kinetics and thermodynamics based on SrF2 and SrF2@Gr additives on hydrogen sorption in MgH2†
Vivek
Shukla
a,
Ashish
Bhatnagar
b,
Satish K.
Verma
a,
Anant P.
Pandey
a,
Alok K.
Vishwakarma
a,
Pankaj
Srivastava
c,
T. P.
Yadav
a and
O. N.
Srivastava
 *a
*a
aHydrogen Energy Centre, Department of Physics, Banaras Hindu University, Varanasi-221005, India. E-mail: heponsphy@gmail.com; heponsphy.bhu@gmail.com; Tel: +91 05422368468
bDepartment of Physics and Materials Science and Engineering, Jaypee Institute of Information Technology, Noida, Sector-62, 201309, India
cDepartment of Chemistry, Banaras Hindu University, Varanasi-221005, India
First published on 8th February 2021
Abstract
Herein we describe and discuss the effect of significant advantages of the alkaline earth fluoride additive SrF2 on the improvement of the kinetics, thermodynamics, and cyclability of the frontier hydrogen storage material MgH2. Strontium fluoride, SrF2, which has been used as an additive for the first time in the present study, has an elemental electronegativity difference of 3.04 (the highest amongst the fluorides) as compared to 2.38 for NbF5, one of the best-known catalysts so far for MgH2. Therefore, SrF2 is highly ionic and will readily react with MgH2, which is not only ionic but also has a polar covalent character. SrF2 reacts with MgH2 to yield magnesium fluoride (MgF2) and strontium hydride (SrH2) which act as catalysts. The present investigations have revealed that both (MgF2 + SrH2) and their graphene templated version, (MgF2 + SrH2)@Gr, work as better catalysts for MgH2 than NbF5. Thus the desorption of H2 from ball-milled MgH2 catalyzed by (MgF2 + SrH2) corresponds to 5.30 wt% in 15 min, and for (MgF2 + SrH2)@Gr the desorption is 6.01 wt% in 15 min at 290 °C. Also, the onset desorption temperatures for MgH2 with (MgF2 + SrH2) and (MgF2 + SrH2)@Gr catalysts are 261 °C and 231 °C, respectively, which are 95 °C and 125 °C lower than that for ball-milled MgH2. The H2 absorption for (MgF2 + SrH2) catalyzed MgH2 is found to be 6.00 wt% in 5 min at 290 °C. For (MgF2 + SrH2)@Gr catalyzed MgH2 the hydrogen absorption is 6.16 wt% in 2 min at 290 °C. The change in desorption enthalpy for MgH2–(MgF2 + SrH2)@Gr is 67.60 kJ mol−1 as compared to 74.84 kJ mol−1 for MgH2–(MgF2 + SrH2). The storage capacity for MgH2–(MgF2 + SrH2)@Gr remains ∼6.00 wt% even after 15 cycles, which corresponds to excellent cyclability. A feasible catalytic mechanism arising from (MgF2 + SrH2) and (MgF2 + SrH2)@Gr catalysts on hydrogen sorption in MgH2 has been proposed based on X-ray diffraction, Raman spectroscopy, Fourier transmission infrared spectroscopy, and transmission/scanning electron microscopic studies. The present study is the first of its type where absorption/desorption kinetics, thermodynamics, and cyclability for MgH2 have all been improved by the use of the single additive SrF2 and the derived catalyst MgF2 + SrH2.
1 Introduction
Since the dawn of civilization, energy demands of human beings have been mostly met by fossil fuels.1,2 Even if the availability of these can be assured until the end of this century, the deleterious effect which ensues due to the emission of CO2 causing climate change may prohibit their use in the coming decades.3,4 At present the CO2 concentration in the atmosphere is 414 ppm.5 It has to be reduced to ∼200 ppm (50% of current levels) so that by 2050 the temperature change of the environment is no more than 2 °C.6 If climate change is not checked, the earth will become uninhabitable in a few decades. Another issue is the large gap between the supply and demand of energy. This continues to increase as the human population increases. The population of the earth will be 10 billion by the year 2050.7 We need clean, abundant, and renewable energy that fulfills our energy demand for the long term. Decades of research have suggested that, out of various options, the most attractive candidate is hydrogen.8 Hydrogen is produced from water, and it turns back to water upon high-temperature combustion, e.g., IC engines or cold combustion in fuel cells. There has been a recent upsurge in research on the production, storage, and application of hydrogen. Out of these, the storage of hydrogen is the most crucial aspect, which cuts through production/distribution, safety, and application. The storage of hydrogen in the form of metal hydrides is the most efficient and safe mode of storage.9,10 However, despite the intensive search for a hydride that fulfills the essential required limits, any viable hydride has not yet emerged. The limit required by the DOE for a solid-state storage system is 4.5 wt% and 36 g H2 L−1.11 Such a system limit can be achieved only if the storage material shows a storage capacity higher than 4.5 wt% and 36 g L−1 of hydrogen. Research carried out in recent years suggests that MgH2 may be such a storage material. It has a gravimetric storage capacity of 7.6 wt% and a volumetric storage capacity of 110 g H2 L−1 and its storage is also reversible.12 Mg is abundantly available on the earth's crust and in the sea. Thus it is a viable hydrogen material, but it has two hurdles related to high sorption temperature (∼400 °C) and sluggish kinetics (<1 wt% min−1).13In the aforementioned background, many studies have been conducted to overcome the aforementioned difficulties associated with MgH2. Partial success has been achieved in these efforts.14 The most useful way in which efforts have been made to lower sorption temperature and improve kinetics is through the use of catalysts/additives. The most deployed catalysts are transition metals such as Ti, Fe, Co, Ni, Mn, Nb, V, and Zr, and their compounds.15 Regarding the transition metal compounds, oxides and halides are potential candidates. Out of these, Nb2O5 and NbF5 have received particular attention. However, it has been found that the addition of NbF5 to MgH2 leads to a better hydrogen sorption behavior than that of Nb2O5.16,17 It has been found that, during cycling at higher temperature, Nb2O5 starts to get dissociated, leading to the formation of an increasing amount of MgO. In yet another study by Floriano et al.,18 the superiority of NbF5 over Nb2O5 in regard to the hydrogen desorption characteristics of MgH2 has been elucidated. NbF5 has been generally found to be a very effective catalyst for improving the hydrogen sorption characteristics of MgH2.17 The investigation carried out by Recham et al.19 has shown that NbF5 is a better additive than Nb2O5 as well as NbCl5 for enhancing the hydrogen sorption kinetics. A detailed study on the effect of several transition metal halides, including NbF5, has been conducted by Malka et al.20,21 They have found the significant effect of NbF5 on hydrogen sorption in MgH2. Only ZrF4 was found to be somewhat better than NbF5.16,17,19–23 These authors have also shown that, of the two halides NbF5 and NbCl5, the former is a better additive for MgH2.
More recently, Santigo et al.16 conducted a detailed study of the effect of NbF5, which led to the formation of MgF2 and NbH0.9, on the hydrogen sorption kinetics in MgH2. They have used two types of NbH0.9 catalyst: one formed on milling MgH2 with NbF5 and the other separately synthesized. They have shown that NbF5 exhibits excellent hydrogen sorption kinetics due to the homogeneous distribution of NbH0.9 in the form of fine particles in MgH2. However, they have found a significant decrease in the achievable hydrogen storage capacity. Contrary to the studies of Santiago et al.,17 Jain et al.23 have found that, when MgH2 and MgF2 are milled together, MgF2 remains intact, does not dissociate and persists throughout the hydrogen sorption cycling. In these studies, (MgH2 + MgF2) has been shown to exhibit better hydrogen sorption than MgH2 alone.
Fluorine has an electronegativity of 3.95, which is the highest out of all elements. Hence fluorides will be highly ionic and react readily with MgH2, which is ionic but also has a polar covalent character.24 As outlined above, so far, NbF5 has been found to be the most suitable additive for MgH2.17,19 Here we have used a new fluoride SrF2. This has a larger elemental electronegativity difference of 3.05 (Sr: 0.93 and F: 3.98) as compared to NbF5, for which it is 2.38 (Nb: 1.60, F: 3.98). In fact, SrF2 has the largest electronegativity difference out of all non-radioactive fluorides. We have shown that SrF2 works as a significantly better additive for hydrogen sorption in MgH2. The additive SrF2 reacts with MgH2 while it is heated for dehydrogenation and produces two compounds MgF2 and SrH2. These remain stable and are present throughout the hydrogen sorption cycling and act as catalysts. They lead to the improvement of hydrogen sorption kinetics and thermodynamics. As a further factor for the improvement of hydrogen sorption in MgH2, we have used graphene templation of SrF2 and (MgF2 + SrH2). (MgF2 + SrH2) and (MgF2 + SrH2)@Gr catalyzed MgH2 show onset desorption temperatures of 261 °C and 231 °C, respectively, which are 95 °C and 125 °C lower than that of ball-milled MgH2, for which it is 356 °C. MgH2 catalyzed by (MgF2 + SrH2)@Gr shows superior dehydrogenation kinetics. It desorbs 6.01 wt% in 15 min at 290 °C. It also shows better rehydrogenation kinetics by absorbing 6.16 wt% in 2 min at 290 °C and 18 atm H2 pressure. The storage capacity remains ∼6 wt% even up to 15 cycles. Thus MgH2–(MgF2 + SrH2)Gr shows excellent cyclability. Therefore, in contrast to earlier studies with NbF5,16 the storage capacity remains intact during cycling with the SrF2@Gr additive. The change in desorption enthalpy for MgH2–7 wt% (MgF2 + SrH2) and MgH2–7 wt% (MgF2 + SrH2)@Gr samples was found to be 74.84 kJ mol−1 and 67.60 kJ mol−1, respectively. These are significantly lower than the desorption enthalpy of MgH2, which is 80.66 kJ mol−1. It may be mentioned that earlier studies16 employing the MgF2–NbH0.9 catalyst do not suggest any improvement in enthalpy (thermodynamics). Also, in these studies, the storage capacity significantly decreases on cycling.16 The present catalysts (MgF2 + SrH2) and (MgF2 + SrH2)@Gr lead to the improvement of both the hydrogen sorption kinetics and thermodynamics of hydrogen sorption in MgH2. The present study forms one of the few cases and, to the best of our knowledge, the first case for a fluoride–hydride catalyst which leads to the improvement of all hydrogen sorption characteristics, namely, kinetics, thermodynamics and cyclability.
2 Experimental section
2.1. Synthesis of SrF2@Gr
Strontium fluoride (Alfa Aesar) was ball-milled at 180 rpm for 24 hours with a ball-to-powder ratio of 50![[thin space (1/6-em)]](https://www.rsc.org/images/entities/char_2009.gif) :1 under 5 atm hydrogen pressure before further use. High quality graphene has been routinely produced in our laboratory.25 SrF2 was templated on graphene using the following steps. Firstly, sodium dodecyl sulfate (SDS) (0.004 g), Gr (0.0145 g), and dimethylformamide (DMF) (∼50 mL) were mixed. Then the resultant solution was mixed homogeneously by using an ultrasonicator at 20 kHz for 2 hours. Finally, 0.582 g of the SrF2 base material was added to the above solution, followed by sonication at room temperature until a homogeneous dark solution was formed. The material so obtained was dried overnight in a vacuum at 60 °C, collected, and characterized. The resulting material, as confirmed by XRD and Raman spectroscopy, corresponds to SrF2@Gr. This was further used as the additive for hydrogen sorption in Mg/MgH2. Our previous studies have shown the synthesis protocol and detailed procedure of graphene templation.26–28
:1 under 5 atm hydrogen pressure before further use. High quality graphene has been routinely produced in our laboratory.25 SrF2 was templated on graphene using the following steps. Firstly, sodium dodecyl sulfate (SDS) (0.004 g), Gr (0.0145 g), and dimethylformamide (DMF) (∼50 mL) were mixed. Then the resultant solution was mixed homogeneously by using an ultrasonicator at 20 kHz for 2 hours. Finally, 0.582 g of the SrF2 base material was added to the above solution, followed by sonication at room temperature until a homogeneous dark solution was formed. The material so obtained was dried overnight in a vacuum at 60 °C, collected, and characterized. The resulting material, as confirmed by XRD and Raman spectroscopy, corresponds to SrF2@Gr. This was further used as the additive for hydrogen sorption in Mg/MgH2. Our previous studies have shown the synthesis protocol and detailed procedure of graphene templation.26–28
2.2. Synthesis of MgH2 admixed with graphene templated SrF2 (SrF2@Gr)
MgH2 (99.99%) was purchased from Nanoshel (UK). 7 wt% of SrF2@Gr was added to the pure MgH2 sample. MgH2–SrF2@Gr was synthesized by mechanical milling of SrF2@Gr with MgH2. The mixture was ball-milled at 180 rpm for 25 hours with a ball-to-powder ratio of 50:1 (by weight) using a Retsch PM 400 planetary ball miller. For brevity, instead of writing 7 wt% SrF2, we will henceforth mention it simply as SrF2. The quantity 7 wt% will be implied. Also, all samples including Mg alone were prepared through ball milling. Hence, we will not add the suffix B.M. to the samples and it is taken to be implied. The concentration of the additive (SrF2@Gr) was taken to be 7 wt% of MgH2. It was found that 7 wt% of the additive (SrF2@Gr) is optimum (in terms of desorption temperature and hydrogen storage capacity) for hydrogen sorption in Mg/MgH2. To avoid contamination from air during ball milling, the vial containing materials was filled with hydrogen gas with 5 atm pressure. All samples were transferred and loaded inside a N2 filled glove box (MBRAUN MB-10 compact) with O2 and H2O levels <1 ppm.
2.3. Characterization techniques
For the structural characterization of the prepared samples, XRD data were collected with a Panalytical Empyrean X-ray diffractometer equipped with an area detector (256 × 256 pixels) at 0.02 °C step size in 2θ range from 10°–110° with CuKα radiation (λ = 1.5415 Å) operated at 40 kV, 40 mA. All the samples were wholly covered with parafilm to prevent the sample reactions from atmospheric contamination during XRD. The microstructures of the samples were studied by transmission electron microscopy (TEM), and selected area electron diffraction (SAED) patterns using TEM: TECNAI 20 G2 at an accelerating voltage of 200 kV. The surface morphology and energy dispersive X-ray analysis (EDAX) with the color mapping of elements of as-prepared samples was done by using a scanning electron microscope (SEM): FEI Quanta 200 with operating voltage 25 kV in a high vacuum (∼10−5 torr). Fourier transform infrared (FTIR) spectroscopy was carried out using a PerkinElmer (Spectrum 100) spectrometer in transmission mode with wavenumbers ranging from the mid-infrared region (400–4000 cm−1).The dehydrogenation properties of the as-prepared samples were analyzed by temperature-programmed desorption (TPD) at a heating rate of 3 °C min−1. TPD analysis of the catalyzed and uncatalyzed MgH2 was started under vacuum (10−3 torr) using dynamic heating conditions with a precision of ±0.2 °C. Rehydrogenation kinetics was measured in the soak mode at 290 °C under 15 atm pressure. Dehydrogenation kinetics was measured using the release mode of the instrument at 290 °C under 1 atm pressure. All the de/rehydrogenation measurements were performed using an automated two-channel volumetric Sievert type apparatus supplied by Advanced Materials Corporation Pittsburgh, USA.
3 Results and discussion
3.1 (a) Synthesis of SrF2@Gr
In order to verify the templation of the additive over graphene, transmission electron microscopy analysis of the SrF2@Gr sample was performed. Fig. 1 shows a representative TEM micrograph of the templated version of nano-SrF2 over graphene. Fig. 1(a) shows a representative TEM micrograph of graphene. The expected wrinkled microstructure of graphene is visible. The SAED pattern of graphene shows (002) and (110) graphitic peaks (Fig. 1(b)). Indexing of the diffraction pattern by a diffraction ring profiler can be seen in Fig. 1(c). Fig. 1(d) shows the TEM micrograph of SrF2@Gr, which confirms the templation of SrF2 over graphene. Fig. 1(c) and (f) has been again indexed with a diffraction ring profiler. It may be noted that, during the TEM analysis, the SrF2 samples templated on graphene were taken out and then inserted again. As verified by several such runs, the SrF2 particles remained on graphene and did not fall off. This showed that the SrF2 particles are anchored on graphene (Fig. 1(d)). Fig. 1(f) has been again indexed with a diffraction ring profiler.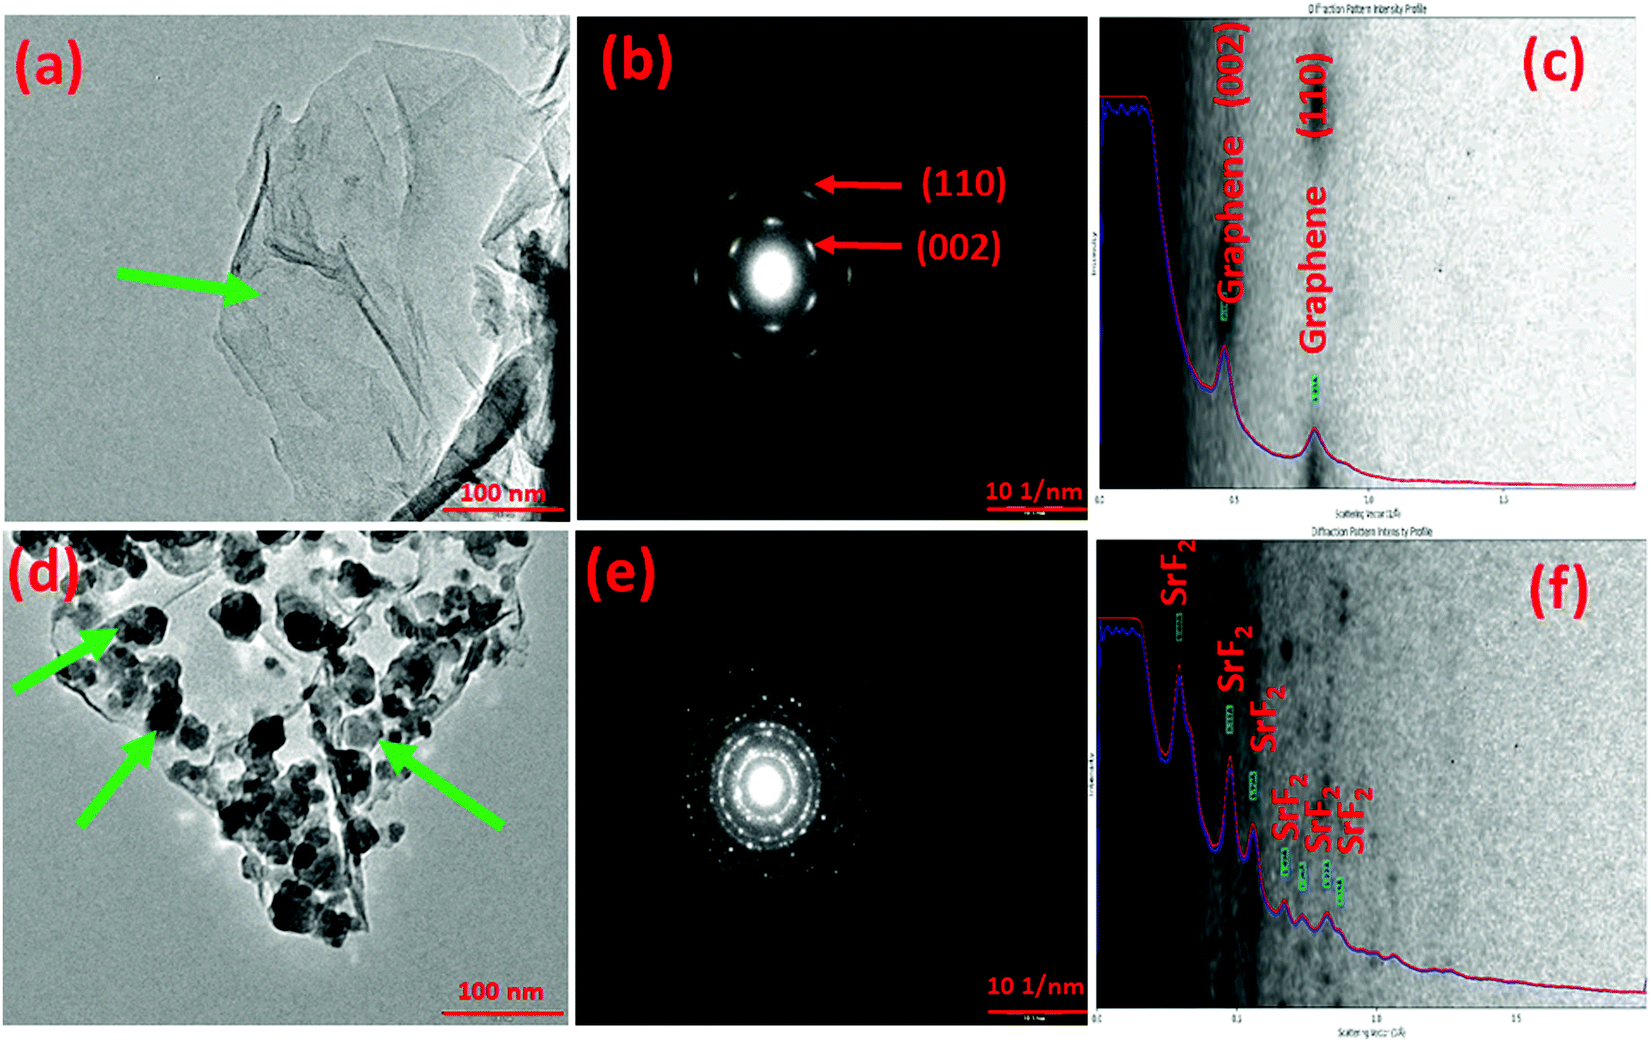 | ||
| Fig. 1 TEM micrographs of (a) graphene, (b) SAED pattern of graphene, (c) diffraction ring profiler indexing of graphene, (d) SrF2@Gr, (e) SAED pattern of SrF2@Gr, and (f) diffraction ring profiler indexing of SrF2@Gr. | ||
3.1 (b) Characterization of MgH2 admixed with SrF2 templated on graphene (MgH2–SrF2@Gr)
A quantity of 7 wt% of SrF2 was added to MgH2. The concentrations of the additives SrF2 and SrF2@Gr were found to be optimum for catalyzing MgH2. A schematic diagram of the templation of SrF2 on Gr is shown in Fig. 2.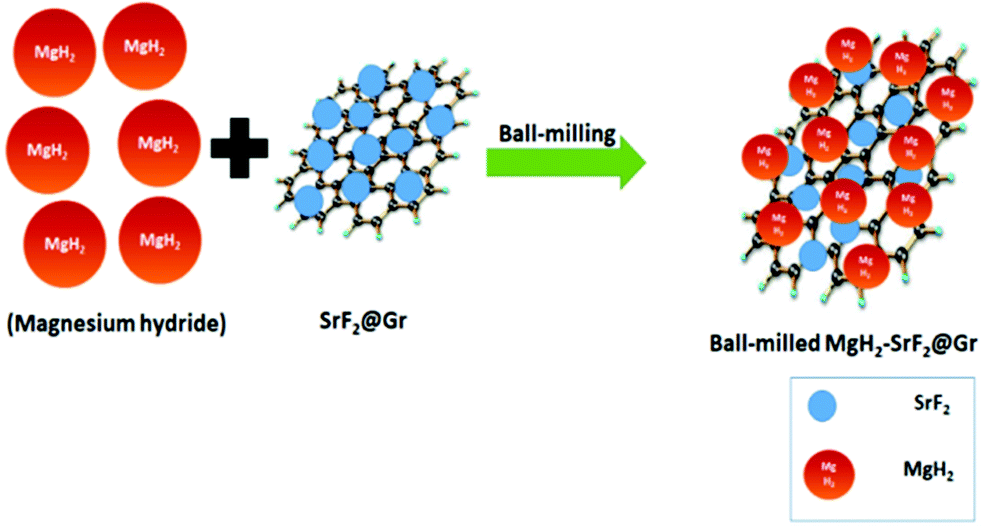 | ||
| Fig. 2 Schematic diagram for MgH2 admixed with SrF2 templated on graphene (MgH2–SrF2@Gr). | ||
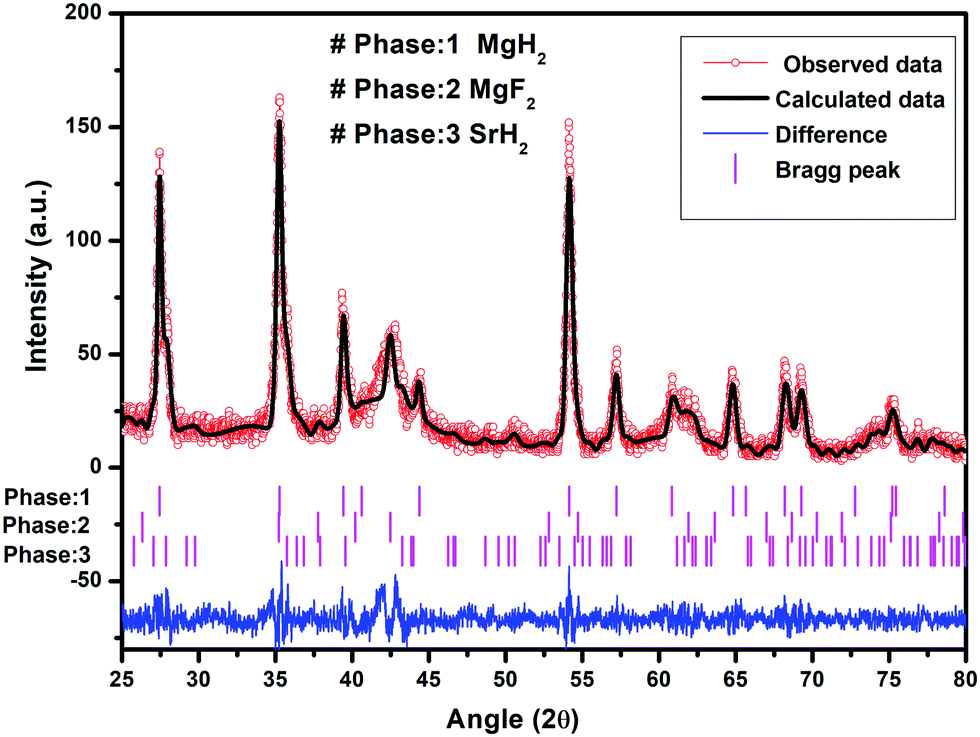
To check the obtained XRD data with the standard crystallographic data and phases present in the sample, we performed multiphase Le Bail fitting of the XRD patterns using JANA software.26 The XRD data (2θ = 20–80°) for MgH2 and the admixed version of MgH2 samples are also shown in Fig. S1(i) (ESI†). Fig. 3(a)–(c) show the XRD fitting (difference plot with model and experimental data) of MgH2 and the admixed version of the MgH2 sample. The peak from 20° to 25° has been left intentionally as 2θ = 21.16° and 23.50°, which corresponds to the peak of the parafilm, which is used as a cover on the XRD holder to avoid contamination of the sample from air and moisture. Fig. 3(a)–(c) and Fig. S1(a–c) (ESI†) show the XRD patterns of the ball-milled MgH2 additive with SrF2 and SrF2@Gr. Fig. 3(a) shows the XRD pattern of the ball-milled MgH2, where all the XRD peaks tally with the known XRD peaks of β-MgH2. No evidence of high-pressure γ-MgH2 has been found. Fig. 3(b) shows the XRD pattern of SrF2 admixed with MgH2, where the phases of SrF2 and MgH2 have been indexed in XRD. Fig. 3(c) shows the XRD pattern of MgH2 admixed with SrF2 templated on graphene (SrF2@Gr). The phases of MgH2 and SrF2 can be clearly seen in the XRD pattern. The analysis of the XRD pattern of SrF2@Gr added MgH2 indicates that all the peaks are of MgH2 and SrF2 NPs. The Gr peaks are very weak and broad (Fig. 1). They get obliterated in the background and with peaks of MgH2 and SrF2.
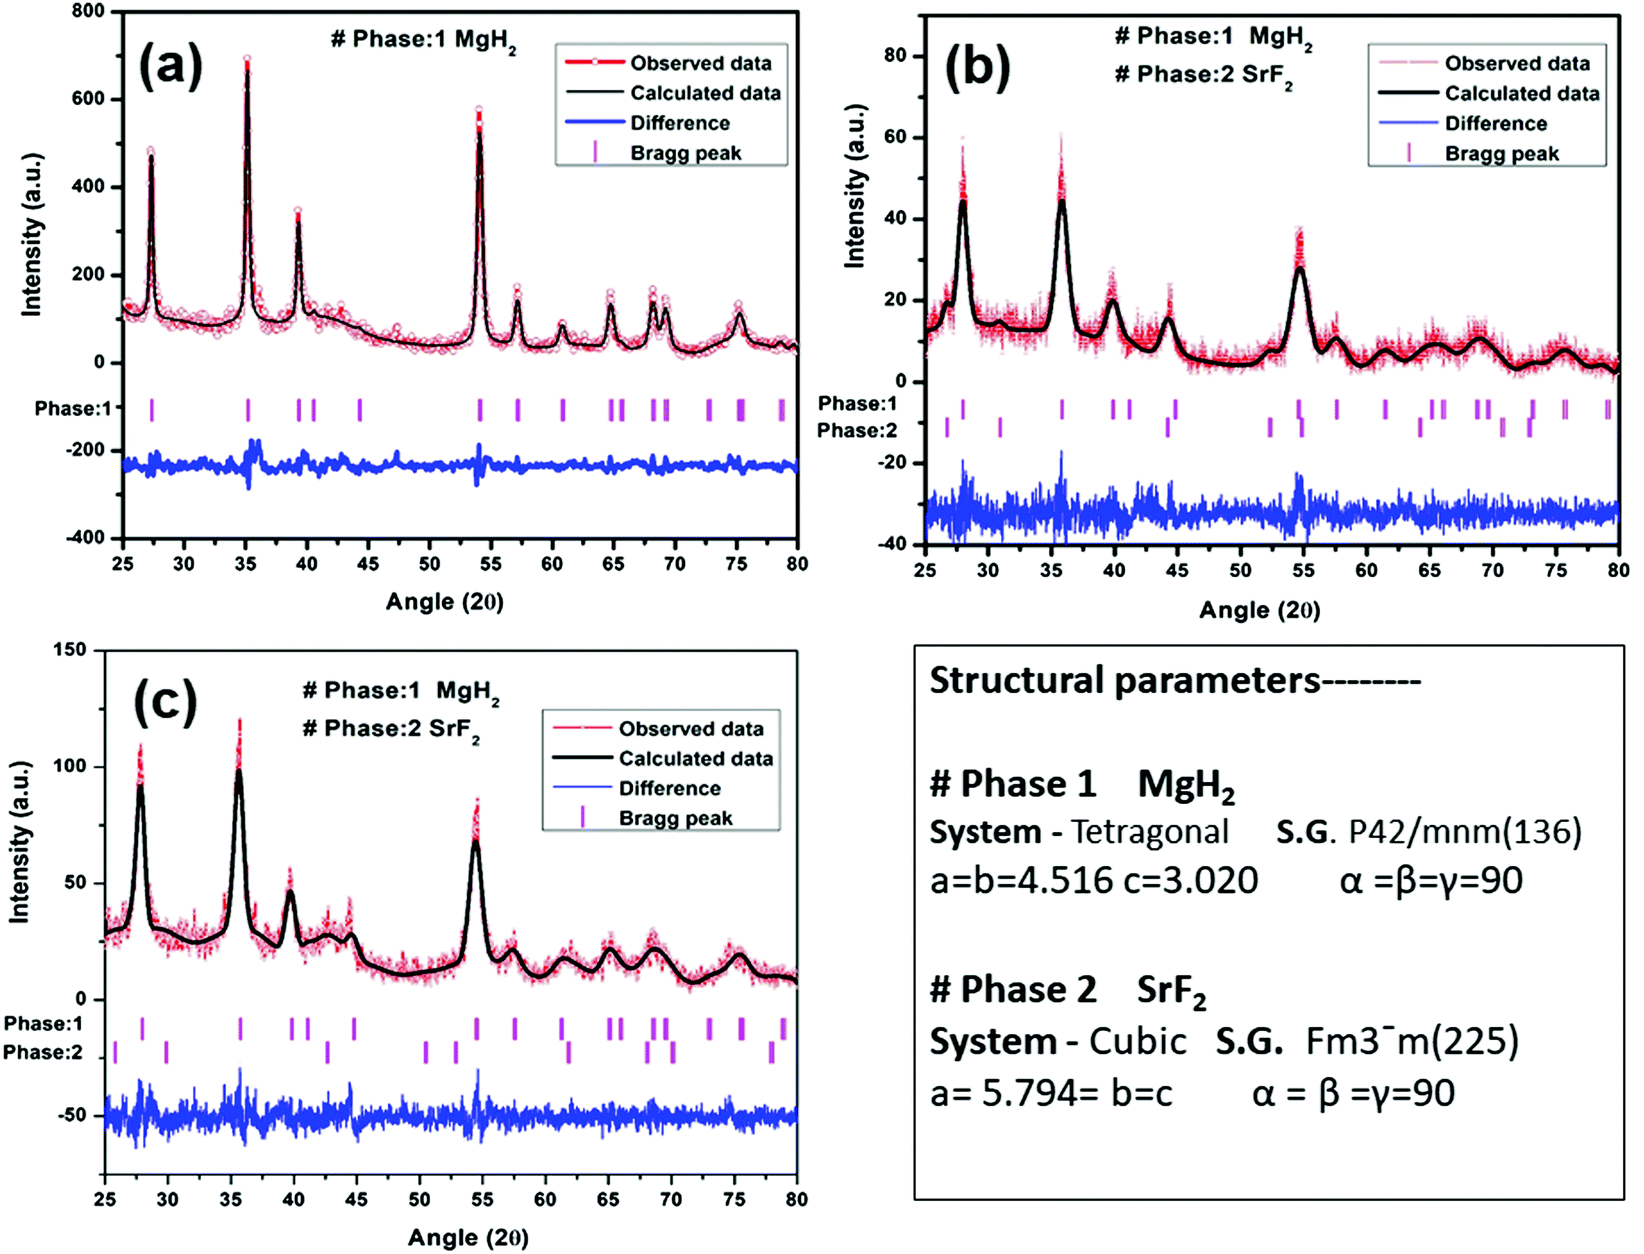 | ||
| Fig. 3 XRD patterns of MgH2 admixed with SrF2 and SrF2 templated on graphene (SrF2@Gr) with Le Bail fitting using Jana software: (a) MgH2, (b) MgH2–SrF2, and (c) MgH2–SrF2@Gr. | ||
Fig. 4 shows the Raman spectra of graphene (Gr) and the SrF2@Gr added MgH2 sample. Fig. 4(a) shows the Raman spectrum of graphene. As is known, the G band corresponds to the in-plane vibration of sp2 hybridized carbon. The D band represents the vibrations of carbon atoms at defect sites, including the carbon at the edge atoms forming dangling bonds.28,29 The D and G bands together with the 2D band can be seen in Fig. 4(a). Fig. 4(b) shows the Raman spectrum of the ball-milled SrF2@Gr with added MgH2 sample. The D and G bands are present together as a 2D band. It can be said that the Raman spectra helps to identify the nanostructured carbon catalyst, which has not been clearly revealed from the XRD results. If we compare Fig. 4(a) and (b), the ID/IG ratio is less than one (ID/IG < 1) for graphene and greater than one (ID/IG > 1) for SrF2@Gr with added MgH2. This may be due to the creation of defects during ball milling due to which the intensity of the D band is enhanced. This reveals the fact that there is an interaction between Gr and SrF2, which may lead to the displacement of carbon atoms in graphene. The TEM micrographs shown in Fig. 1(a)–(f) show SrF2 nanoparticles located on graphene (Gr). Even when the sample (SrF2@Gr) was taken out from the TEM and inserted again, there was no displacement of SrF2 nanoparticles. This shows that SrF2 (NPs) are anchored on graphene. Experiments covering several de/rehydrogenation samples have shown that SrF2 (NPs) remain anchored on graphene.
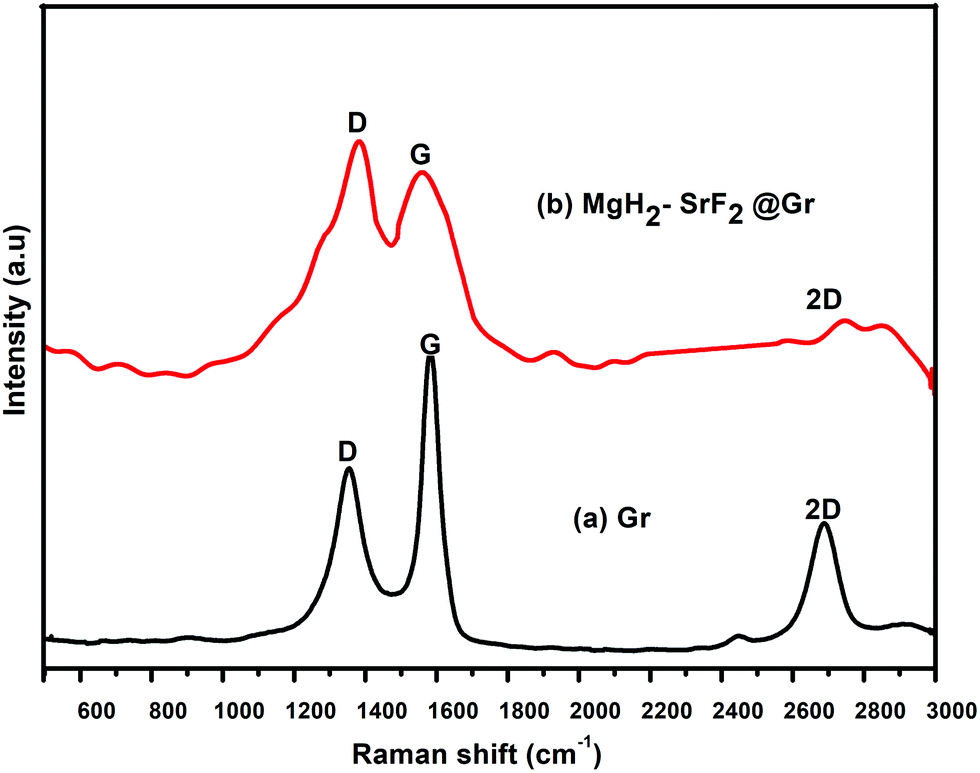 | ||
| Fig. 4 Raman spectra of (a) graphene (Gr) and (b) MgH2–SrF2@Gr. | ||
3.2 Hydrogen sorption studies
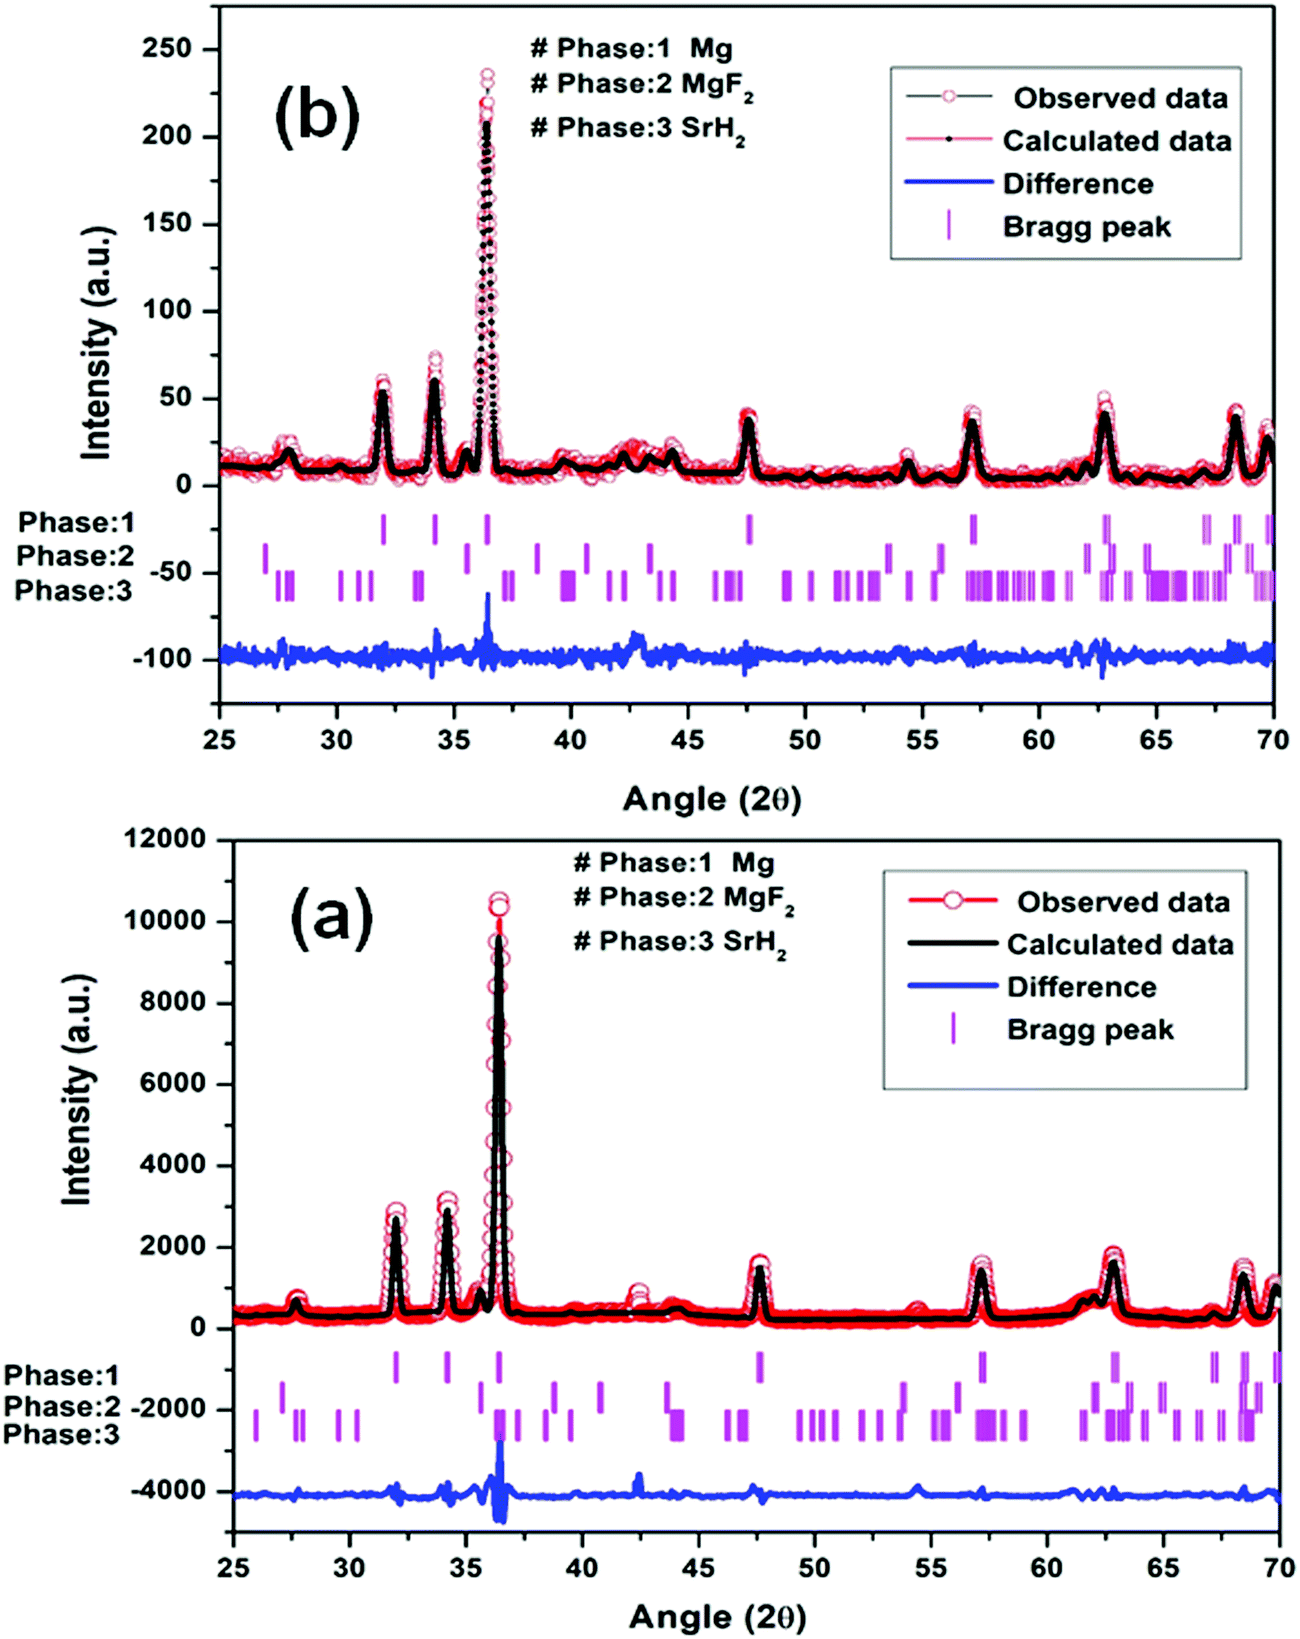 | ||
| Fig. 5 Le Bail fitting of XRD patterns using JANA software at different steps: (a) Mg–(MgF2 + SrH2) (1st dehydrogenation) and (b) Mg–(MgF2 + SrH2)@Gr (1st dehydrogenation). | ||
The reaction of MgH2 and SrF2 can be described as follows.
(1) When MgH2 reacts with SrF2 (molar ratio 1:1) it forms
| MgH2 + SrF2 → MgF2 + SrH2 | (1) |
(2) When MgH2 desorbs to Mg, it forms
| MgH2 → Mg + H2 | (2) |
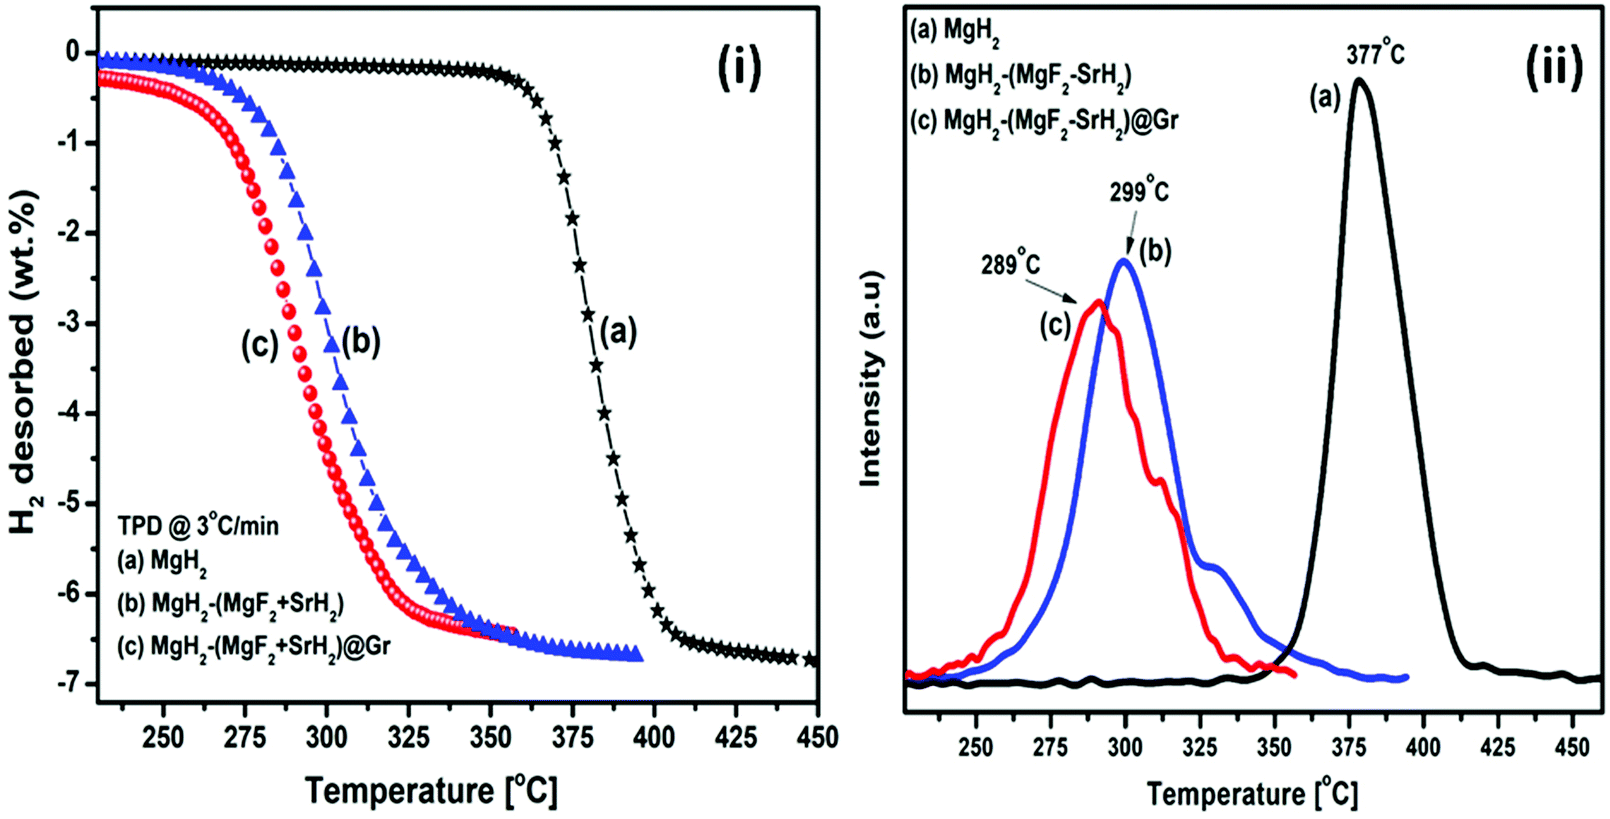 | ||
| Fig. 6 (i) TPD of MgH2 catalyzed by (a) MgH2, (b) MgH2–(MgF2 + SrH2), (c) MgH2–(MgF2 + SrH2)@Gr and (ii) TPD (peak intensity vs. temperature) of (a) MgH2, (b) MgH2–(MgF2 + SrH2), and (c) MgH2–(MgF2 + SrH2)@Gr. | ||
It may be pointed out that, after the first dehydrogenation reaction, besides Mg, the products which result, namely, MgF2 and SrH2, are present in all absorption/desorption runs. Further hydrogen (absorption/desorption) runs showed a significant improvement in kinetics, thermodynamics, activation energy and cyclability. Apparently the improvements in hydrogen sorption in MgH2 are due to (MgF2 + SrH2) and (MgF2 + SrH2)@Gr which act as catalysts.
We now proceed to describe and discuss hydrogen sorption studies in (MgF2 + SrH2) and (MgF2 + SrH2)@Gr catalyzed MgH2.
The TPD of MgH2 catalyzed by (MgF2 + SrH2) and also (MgF2 + SrH2)@Gr was conducted at a heating rate of 3 °C min−1. Fig. 6(i, a–c) show the TPD of ball-milled MgH2 and the catalyzed versions of MgH2. Fig. 6(i-a) showing the TPD of the ball-milled MgH2 sample exhibits the onset of desorption at 356 °C. The complete dehydrogenation of MgH2 has been found at 418 °C with a desorption capacity of 6.60 wt%. The onset desorption temperature for MgH2 catalyzed by (MgF2 + SrH2) has been found at 261 °C. The complete dehydrogenation takes place at 351 °C showing a storage capacity of 6.41 wt%. The onset desorption temperature for (MgF2 + SrH2)@Gr catalyzed MgH2 has been found to be 231 °C. Nearly 3.41 wt% of hydrogen is desorbed at the temperature of 292 °C, showing a complete dehydrogenation capacity of 6.32 wt% is obtained at 320 °C. The onset desorption temperature for (MgF2 + SrH2)@Gr catalyzed MgH2 has been found to be lower by 125 °C and 30 °C than those for MgH2 and (MgF2 + SrH2) catalyzed MgH2, respectively. Thus it can be said that the hydrogen sorption characteristics of (MgF2 + SrH2)@Gr catalyzed MgH2 are superior to those of (MgF2 + SrH2) alone. It may be pointed out that the present onset desorption temperature of 231 °C is one of the lowest onset temperatures observed for MgH2 catalyzed by various catalysts.23,26–28,30–35
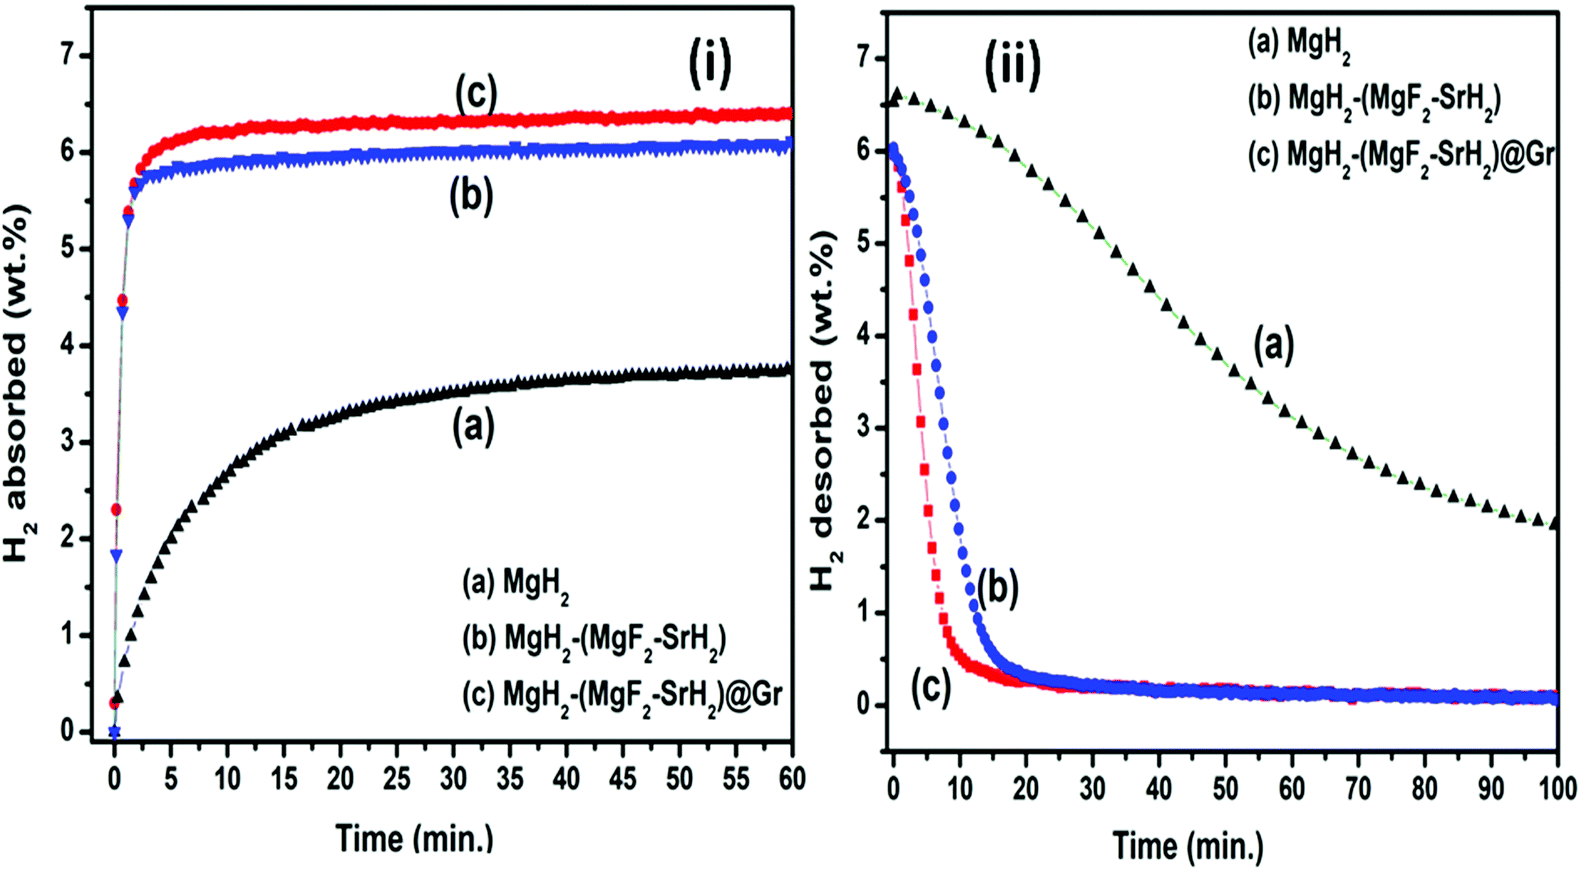 | ||
| Fig. 7 De/rehydrogenation kinetics profile. (i) Rehydrogenation kinetics curve at 290 °C and 1.8 MPa H2 pressure: (a) MgH2, (b) MgH2–(MgF2 + SrH2), and (c) MgH2–(MgF2 + SrH2)@Gr. (ii) Dehydrogenation kinetics curve at 290 °C and 0.1 MPa H2 pressure: (a) MgH2, (b) MgH2–(MgF2 + SrH2), and (c) MgH2–(MgF2 + SrH2)@Gr. | ||
| S. no. | Catalyst/additive used | Rehydrogenation kinetics in 2 min (wt%) | Ref. |
|---|---|---|---|
| 1. | TiF3 | 4.5 | 32 |
| 2. | VF4 | 3.5 | 32 |
| 3. | NbF5 | 4.5 | 17 and 32 |
| 4. | NiF2 | 3.2 | 32 |
| 5. | ZrF4 | 3.6 | 32 |
| 6. | CrF2 | 3.1 | 32 |
| 7. | FeF2 | 3.2 | 32 |
| 8. | CeF3 | 4.6 | 33 |
| 9. | LaF3 | 4.5 | 33 |
| 10. | MgF2 | 3.0 | 23 |
| 11. | MgF2 + SrH2 | 5.9 (Tabs −290 °C) | Present study |
| 12. | MgF2 + SrH2@Gr | 6.2 (Tabs −290 °C) | Present study |
Fig. 7(ii, a–c) show the dehydrogenation kinetics of MgH2, MgH2–(MgF2 + SrH2), and MgH2–(MgF2 + SrH2@Gr) samples, respectively. The dehydrogenation kinetics was performed at 290 °C and 0.1 MPa H2 pressure. Fig. 7(ii-a) shows the dehydrogenation kinetics profile of the MgH2 sample. As shown in Fig. 7(ii-a), the MgH2 sample desorbs 0.19 wt% in 5 min and 0.56 wt% in 15 min. The desorption of 4.69 wt% of H2 has been observed in 100 min. Fig. 7(ii-b) shows the dehydrogenation kinetics of the MgH2-(MgF2 + SrH2) sample, the dehydrogenation kinetics for this sample is improved, and it desorbs 1.68 wt% in 5 min and 5.59 wt% in 15 min. Fig. 7(ii-c) shows the dehydrogenation kinetics of (MgH2)–(MgF2 + SrH2)@Gr. The MgH2 sample with the graphene templated catalyst (MgF2 + SrH2) desorbs 4.08 wt% in 5 min and 6.01 wt% in 15 min. MgH2–(MgF2 + SrH2)@Gr desorbs 6.11 wt% in 25 min. Thus the dehydrogenation kinetics of MgH2 catalyzed by the (MgF2 + SrH2)@Gr sample shows better dehydrogenation compared to our recent and other studies.23,26–28,30–35
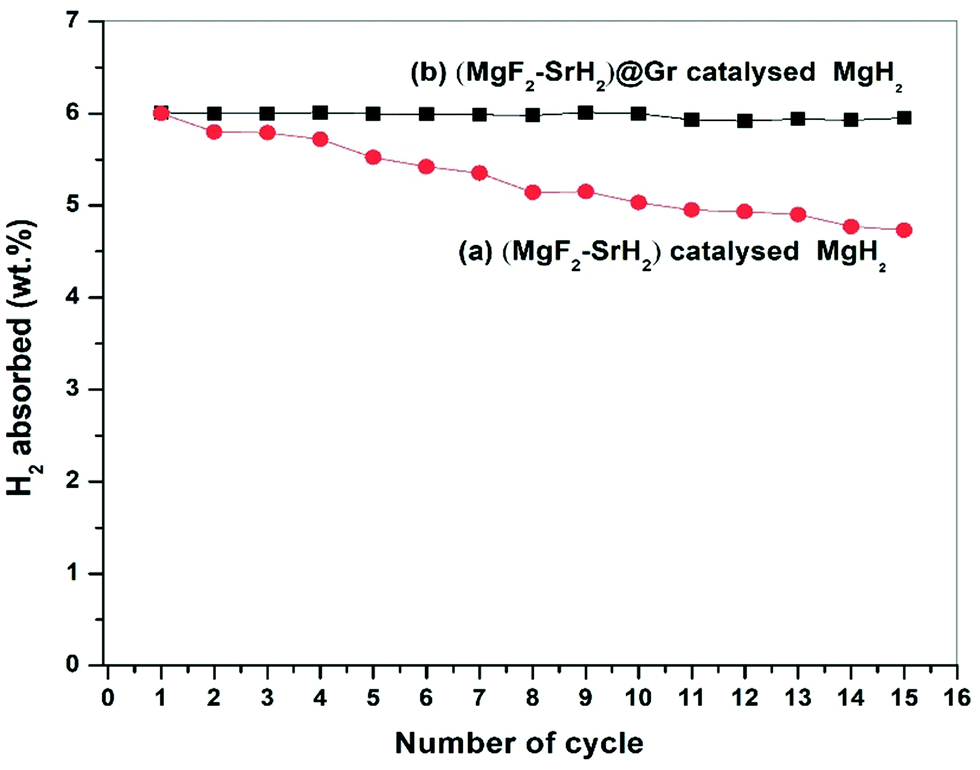 | ||
| Fig. 8 Cycling stability up to 15 cycles of (a) (MgF2 + SrH2) catalysed MgH2 and (b) (MgF2 + SrH2)@Gr catalysed MgH2. | ||
To find the activation energy using the Kissinger equation36,37 the peak desorption temperature at different heating rates was used.
| ln(β/Tp2) = (−Ea/RTp) + ln(ko) | (3) |
4 Proposed mechanism for the hydrogen sorption of MgH2 with the additive SrF2@Gr derived catalyst (MgF2 + SrH2)@Gr
The de/rehydrogenation of MgH2–(MgF2 + SrH2)@Gr can be understood based on the results obtained from XRD, TEM, SEM, FTIR and Raman spectroscopic studies conducted in the present investigation.The microstructure of (MgF2 + SrH2)@Gr catalyzed MgH2 before and after cycling was analyzed by employing TEM. Fig. 12(a)–(i) show the typical TEM micrographs and the related selected area electron diffraction (SAED) patterns after ball milling and cycling. Also the EDAX analysis of (MgF2 + SrH2)@Gr catalyzed MgH2 was conducted (Fig. 12(j)). The EDAX analysis is in keeping with the XRD studies (Fig. 3(c) and Fig. S1(c), ESI†) wherein the presence of MgH2 and SrF2 has been found through SAED patterns.
The presence of MgF2 and SrH2 even after cycling as evidenced by (Fig. 12(g)–(i)) MgH2 and SrF2 shows that these catalysts leads to improvements in hydrogen sorption all through. This confirms that they are indeed the catalysts. Also as shown in Fig. 12(g) and Fig. S4(c) (ESI†), there is no agglomeration of MgF2 and SrH2. This implies that MgF2 and SrH2 are anchored on graphene. Fig. 12(g) and Fig. S4(c) (ESI†) show that MgF2 and SrH2 after 15 cycles (Fig. 12(g) or Fig. S4(c), ESI†) are nearly homogeneously dispersed. From the SAED patterns and EDAX analysis of SEM (Fig. 12(j) and Fig. S4(c), ESI†), one can also identify the presence of Mg, Sr, C, and F (some oxygen is also present, which may be due to some oxidation during the transfer of the specimen in the TEM and SEM chambers), showing that the catalysts remain stable even after 15 cycles of de/rehydrogenation. Because of the aforementioned feature, the catalytic activity will not degrade and the storage capacities will not vary with cycling as observed in our investigation (Fig. 8).
It is to be noted that, in the reactivity series,41 Sr is placed above MgH2 and hence is highly reactive as compared to Mg. Therefore, there is every possibility of displacement of Mg by Sr. Therefore, the formation of MgF2 and the associated compound SrH2 will take place. MgH2 exhibits an ionic-covalent bond42 with charge densities as Mg1.509+ and H−0.754. Khatabi et al.42 have shown that the bonding between Mg and H can be weakened by using a suitable catalyst having active d orbitals. MgF2 type compounds have active d orbitals in their orbital geometry.43 MgF2 is highly ionic owing to the elemental electronegativity difference of 2.67 (Mg: 1.31, F: 3.98), which is higher as compared to the electronegativity difference for MgH2 which is 0.79 (Mg: 1.31, H: 2.10) being a polar molecule with a high electronegative character and the dominant contribution of the d orbital will readily interact with polar covalent MgH2, destabilize the Mg–H bond and improve the kinetics. Because of the above reason, MgF2 will play a dominant role in improving the kinetics. This is in keeping with the known catalytic activity of MgF2 for hydrogen sorption in MgH2.23 In regards to SrH2 which has a lower elemental electronegativity difference of 0.15 (Sr: 0.95, H: 2.10), it may play a minor role in destabilizing the Mg–H bond. It is known that, if MgH2 assumes a smaller size in the nanoparticle range, the thermodynamics is improved.44–46 Fine particles of MgH2 <5 nm in size were observed in the present studies on mechanical milling. It may thus be considered that SrH2 plays a major role in improving thermodynamics. This is in conformity with the results obtained in the present investigations. The formation enthalpy of the catalyzed MgH2 has been found to change from 76 kJ mol−1 to 61.54 kJ mol−1 (an improvement of 14.46 kJ mol−1). The above discussion suggests that, whereas MgF2 plays a role in improving the kinetics, SrH2 helps in the positive tuning of thermodynamics. The two catalysts taken together improve the kinetics and thermodynamics. In regards to the presence of MgF2 and SrH2 throughout hydrogen sorption, we have already shown through XRD that these are present even after 15 sorption cycles (Fig. 9). In order to further verify this, we have performed FTIR analyses of the samples at the beginning when MgF2 and SrH2 were formed and then after 15 cycles of hydrogen sorption. Fig. S7 (ESI†) presents the representative FTIR spectra. The spectra were analyzed based on the known IR absorption characteristics of the various molecules embodied in the materials. The Mg-H vibration is known to give its signature from 400 to 900 cm−1 and 900 to 1300 cm−1, MgF2 around 1492–1500 cm−1 and SrH2 around 1140 cm−1.47–49 The typical graphene C–H stretching vibration at 2850 and 2930 cm−1 can also be noted.50 The presence of all these can be clearly seen in the FTIR spectra shown in Fig. S6, ESI.†
 | ||
| Fig. 9 Le Bail fitting of the XRD pattern using JANA software after 15 cycles of H2 de/rehydrogenation of MgH2–(MgF2 + SrH2)@Gr. | ||
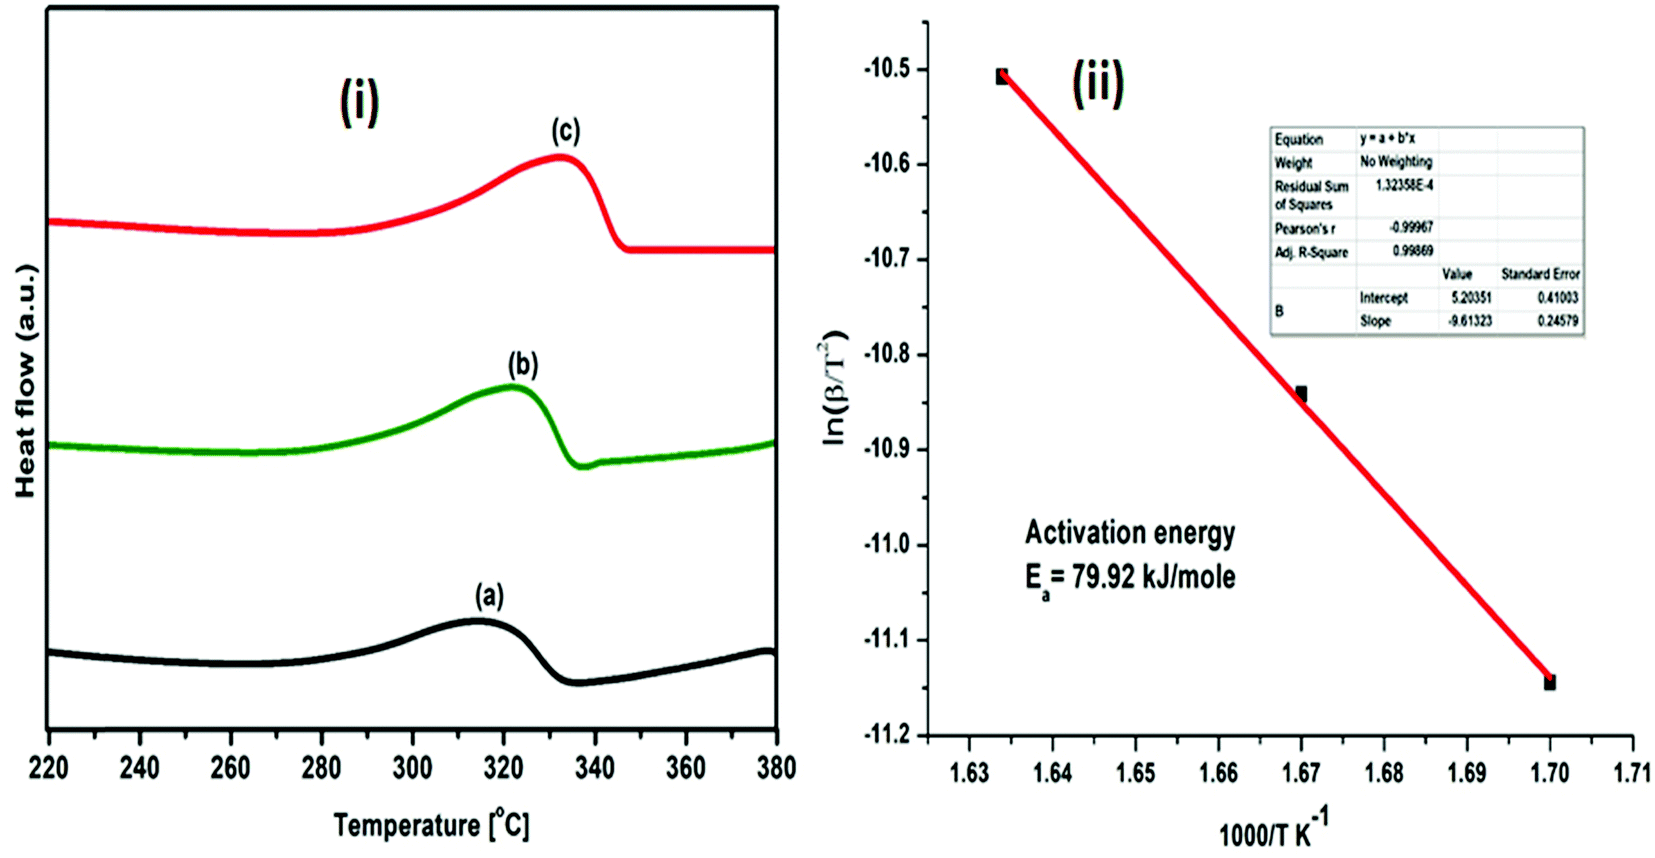 | ||
| Fig. 10 (i) DSC profiles of (MgF2 + SrH2)@Gr catalyzed MgH2 under heating at (a) 5 °C min−1, (b) 7 °C min−1 and (c) 10 °C min−1; (ii) Kissinger plot for evaluating activation energy. | ||
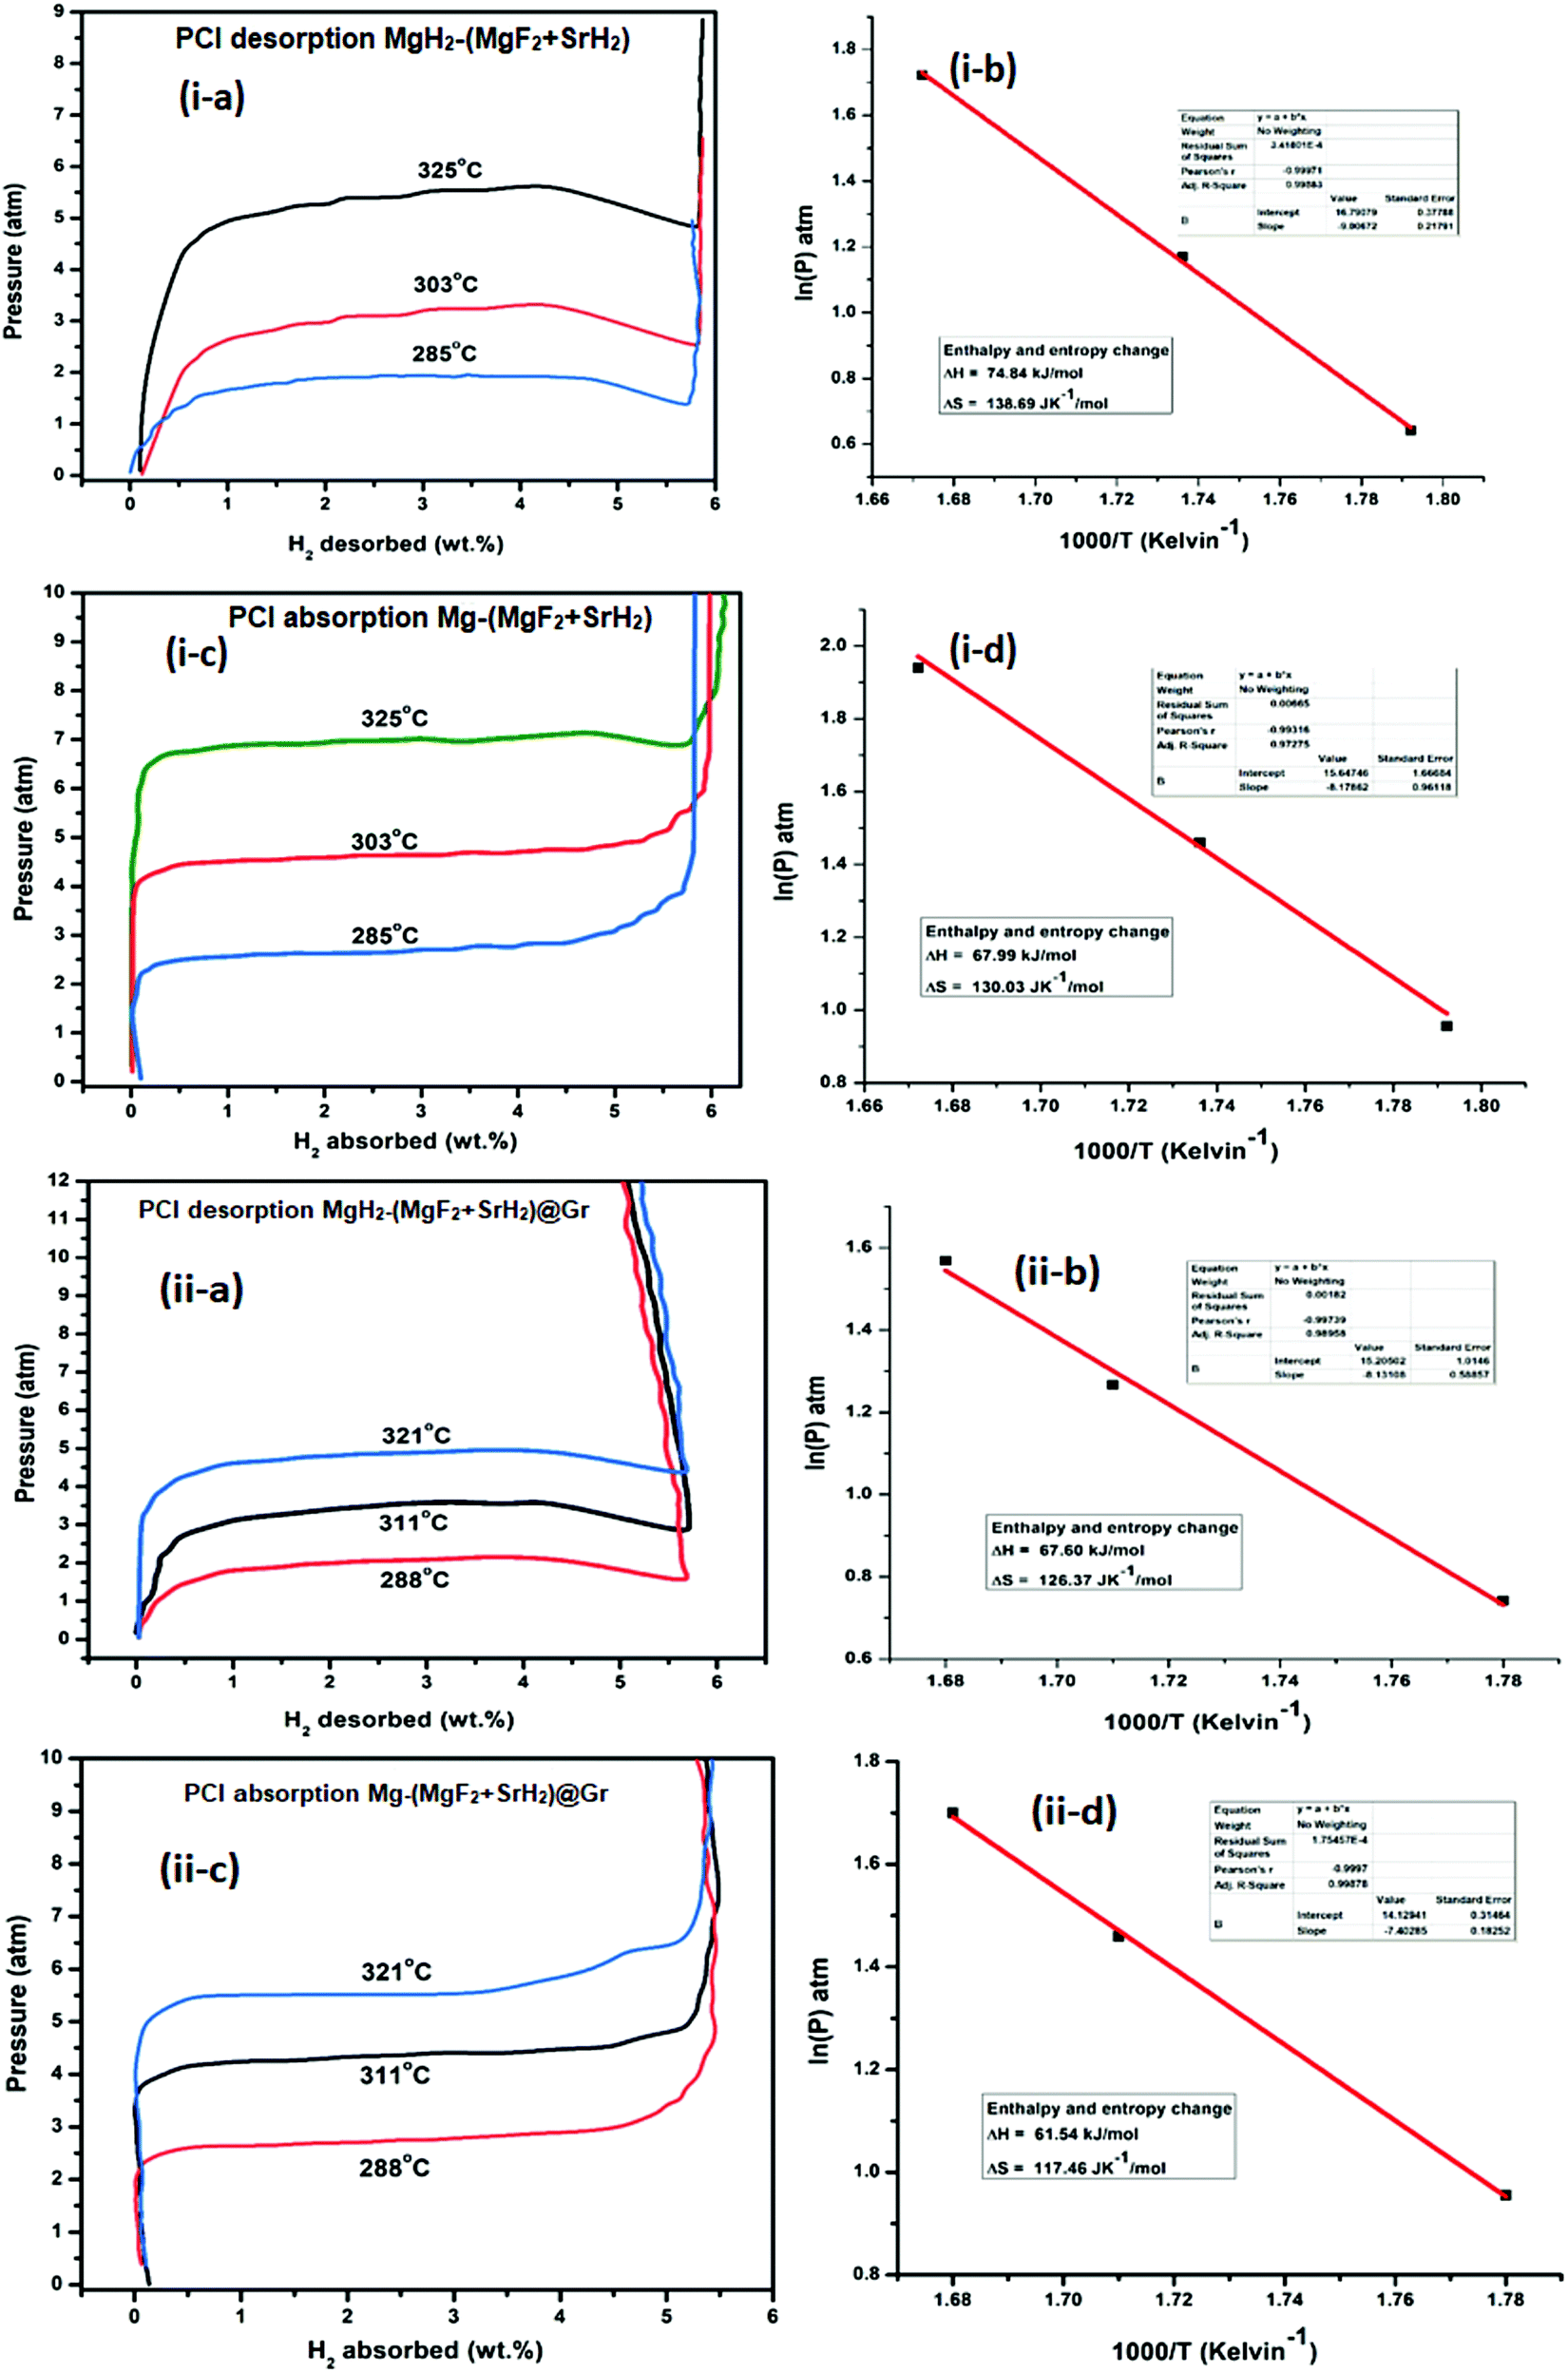 | ||
| Fig. 11 PCI isotherm of MgH2 catalysed with: (i-a) PCI desorption at three different temperatures for the MgH2–(MgF2 + SrH2) sample; (i-b) van’t Hoff plot for the calculation of change in enthalpy; (i-c) PCI absorption at three different temperatures for the MgH2–(MgF2 + SrH2) sample; (i-d) van’t Hoff plot for the calculation of change in enthalpy; (ii-a) PCI desorption at three different temperatures for the MgH2–(MgF2 + SrH2)@Gr sample; (ii-b) van’t Hoff plot for the calculation of change in enthalpy; (ii-c) PCI absorption at three different temperatures for the MgH2–(MgF2 + SrH2)@Gr sample; and (ii-d) van’t Hoff plot for the calculation of change in enthalpy. | ||
 | ||
| Fig. 12 TEM micrographs of (a and b). MgH2–SrF2, (c) SAED pattern of MgH2–SrF2, (d and e) Mg–(MgF2 + SrH2)Gr (1st dehydrogenation), (f) SAED pattern of Mg–(MgF2 + SrH2)Gr (1st dehydrogenation), (g and h) MgH2–(MgF2 + SrH2)@Gr (15 cycles of rehydrogenation), (i) SAED pattern of MgH2–(MgF2 + SrH2)@Gr (15 cycles of rehydrogenation), and (j) EDAX spectrum after 15th cycle of rehydrogenation of (MgF2 + SrH2)Gr catalyzed MgH2. | ||
Recent studies have shown that the hydride catalyst moves from within MgH2 to the surface during dehydrogenation and vice versa during hydrogenation.44,45 Such movement will buffer the variation of the volume of MgH2 due to repeated expansion and contraction during de/rehydrogenation. The volume change during repeated de/rehydrogenation is one of the causes for degradation in the cyclic performance of MgH2. As discussed earlier (Sections 3.1(a) and 3.2(d)), TEM studies reveal that MgF2 and SrH2 are anchored on graphene. They do not agglomerate and as outlined earlier this improves the cyclability. The role of graphene in promoting the possible conversion of MgF2 to MgF2−x and SrH2 to SrH2−x cannot be ruled out. Thus the enhancement in kinetics, positive tuning of thermodynamics and very good cyclability can be attributed to the synergistic effect between MgF2, SrH2 and Gr. This is outlined in the schematic diagram shown in Fig. 13. The simultaneous improvement of all three crucial characteristics, namely, the kinetics, thermodynamics and cyclability, of hydrogen sorption in MgH2 makes the present investigation different than other studies on fluoride catalyzed MgH2.
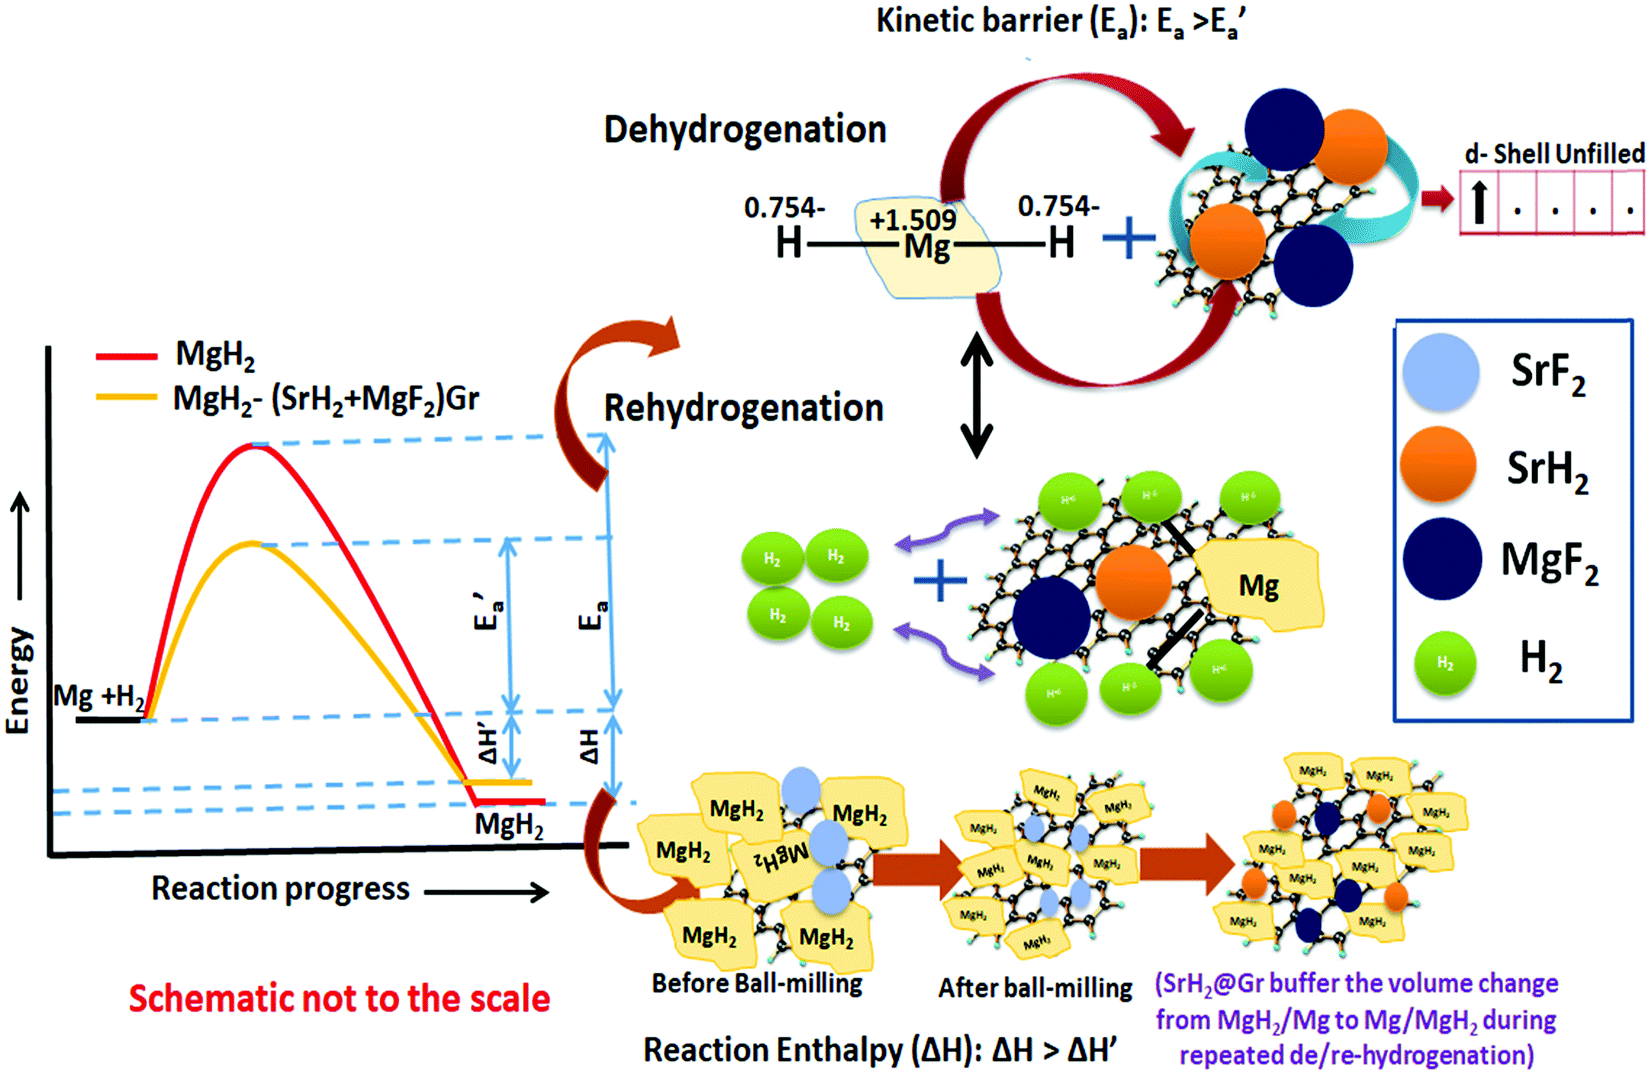 | ||
| Fig. 13 Schematic diagram of the de/rehydrogenation of MgH2–(MgF2 + SrH2)@Gr. | ||
5 Conclusion
The present study deals with the role of one of the most ionic additives SrF2 in the formation of the catalysts MgF2 and SrH2 and their role in the improvement of hydrogen sorption in MgH2. Besides the additive SrF2 alone and the resulting catalyst (MgF2 + SrH2), their graphene templated versions were synthesized and deployed for hydrogen sorption in MgH2. It is shown that the catalysts (MgF2 + SrH2) and (MgF2 + SrH2)@Gr both show better hydrogen sorption characteristics than the presently known best fluoride additive/catalyst NbF5/(MgF2 + NbH0.9). The catalyst (MgF2 + SrH2)@Gr shows very fast hydrogen absorption kinetics of 6.16 wt% in 2 min and desorption kinetics of 6.01 wt% in 15 min in Mg/MgH2 at 290 °C. The change in desorption enthalpy for (MgF2 + SrH2)@Gr catalyzed MgH2 was found to be 67.60 kJ mol−1 (7.42 kJ mol−1 lower than the desorption enthalpy of MgH2–(MgF2 + SrH2)). Also the storage capacity of MgH2 employing the aforementioned catalyst remains 6.10 wt% up to 15 cycles exhibiting excellent cyclability. It has been shown that, whereas MgF2 plays a major role in improving the kinetics, SrH2 allows positive tuning of the thermodynamics. All in all, the improvement of the important hydrogen sorption characteristics (kinetics, thermodynamics and cyclability) arises due to the synergistic effect of MgF2, SrH2 and Gr.Conflicts of interest
There are no conflicts to declare.Acknowledgements
The financial support from the Ministry of New and Renewable Energy (Mission Mode Project on Hydrogen Storage), DST (FIST), SPARC, DRDO, ISRO and the University Grants Commission is thankfully acknowledged. Vivek Shukla would like to thank CSIR New Delhi for providing CSIR-SRF (file no. 09/013(0761)/2018-emr-i).References
- M. Momirlan and T. N. Veziroglu, Renewable Sustainable Energy Rev., 2002, 6, 141–179, DOI:10.1016/S1364-0321(02)00004-7.
- S. Singh, A. Bhatnagar, V. Dixit, V. Shukla, M. A. Shaz, A. S. K. Sinha and O. N. Srivastava, Int. J. Hydrogen Energy, 2016, 41, 3561–3570, DOI:10.1016/j.ijhydene.2015.12.174.
- S. A. Abbasi and N. Abbasi, Appl. Energy, 2000, 65, 121–144, DOI:10.1016/S0306-2619(99)00077-X.
- J. Murray and D. King, Nature, 2012, 481, 433–435, DOI:10.1038/481433a.
- D. J. Wuebbles and A. K. Jain, Fuel Process. Technol., 2001, 71, 99–119, DOI:10.1016/S0378-3820(01)00139-4.
- T. Matsuno, K. Maruyam and J. Tsutsui, Proc. Jpn. Acad., Ser. B, 2012, 88, 368–384, DOI:10.2183/pjab.88.368.
- T. Searchinger, R. Waite, C. Hanson and J. Ranganathan, World Resour. Rep., 2019, 558 Search PubMed . https://www.wri.org/publication/creating-sustainable-food-future?segid=cecb10dd-9466-45e1-a5b8-5693ccfc9cdd.
- M. Ball and M. Wietschel, The Future of Hydrogen-Opportunities and Challenges, Int. J. Hydrogen Energy, 2009, 34, 615–627, DOI:10.1016/j.ijhydene.2008.11.014.
- L. Schlapbach and A. Züttel, Materials Sustainable Energy, Co-Published with Macmillan Publishers Ltd, UK, 2010, pp. 265–270 DOI:10.1142/9789814317665_0038.
- V. Shukla, A. Bhatnaga, P. K. Soni, A. K. Vishwakarma, M. A. Shaz, T. P. Yadav and O. N. Srivatava, Phys. Chem. Chem. Phys., 2017, 19, 9444–9456, 10.1039/C6CP08333A.
- M. Momirlan and T. Veziroglu, Int. J. Hydrogen Energy, 2005, 30, 795–802, DOI:10.1016/j.ijhydene.2004.10.011.
- J. O. Abe, A. P. I. Popoola, E. Ajenifuja and O. M. Popoola, Int. J. Hydrogen Energy, 2019, 44, 15072–15086, DOI:10.1016/j.ijhydene.2019.04.068.
- R. R. Shahi, A. Bhatanagar, S. K. Pandey, V. Shukla, T. P. Yadav, M. A. Shaz and O. N. Srivastava, Int. J. Hydrogen Energy, 2015, 40, 11506–11513, DOI:10.1016/j.ijhydene.2015.03.162.
- T. Sadhasivam, H. T. Kim, S. Jung, S. H. Roh, J. H. Park and H. Y. Jung, Renewable Sustainable Energy Rev., 2017, 72, 523–534, DOI:10.1016/j.rser.2017.01.107.
- G. Liang, J. Huot, S. Boily, A. Van Neste and R. Schulz, J. Alloys Compd., 1999, 292, 247–252, DOI:10.1016/S0925-8388(99)00442-9.
- S. A. Pighin, B. Coco, H. Troiani, F. J. Castro and G. Urretavizcaya, Int. J. Hydrogen Energy, 2018, 43, 7430–7439, DOI:10.1016/j.ijhydene.2018.02.151.
- S. A. Pighin, G. Urretavizcaya and F. J. Castro, Int. J. Hydrogen Energy, 2015, 40, 4585–4596, DOI:10.1016/j.ijhydene.2015.01.153.
- R. Floriano, S. Deledda, B. C. Hauback, D. R. Leiva and W. J. Botta, Int. J. Hydrogen Energy, 2017, 42, 6810–6819, DOI:10.1016/j.ijhydene.2016.11.117.
- N. Recham, V. V. Bhat, M. Kandavel, L. Aymard, J.-M. Tarascon and A. Rougier, J. Alloys Compd., 2008, 464, 377–382, DOI:10.1016/j.jallcom.2007.09.130.
- I. E. Malka, T. Czujko and J. Bystrzycki, Int. J. Hydrogen Energy, 2010, 35, 1706–1712, DOI:10.1016/j.ijhydene.2009.12.024.
- I. E. Malka, M. Pisarek, T. Czujko and J. Bystrzycki., Int. J. Hydrogen Energy, 2011, 36, 12909–12917, DOI:10.1016/j.ijhydene.2011.07.020.
- A. Jain, S. Agarwal, S. Kumar, S. Yamaguchi, H. Miyaoka, Y. Kojima and T. Ichikawa, J. Mater. Chem. A, 2017, 5, 15543–15551, 10.1039/C7TA03081A.
- P. Jain, V. Dixit, A. Jain, O. N. Srivastava and J. Huot, Energies, 2015, 8, 12546–12556, DOI:10.3390/en81112330.
- T. Noritake, M. Aoki, S. Towata, Y. Seno, Y. Hirose and E. Nishibori, Appl. Phys. Lett., 2002, 81, 2008–2010, DOI:10.1063/1.1506007.
- K. Awasthi, R. Kumar, H. Raghubanshi, S. Awasthi, R. Pandey, D. Singh and O. N. Srivastava, Bull. Mater. Sci., 2011, 34, 607, DOI:10.1007/s12034-011-0170-9.
- S. K. Verma, A. Bhatnagar, V. Shukla, P. K. Soni, A. P. Pandey, T. P. Yadav and O. N. Srivastava, Int. J. Hydrogen Energy, 2020, 45, 19516–19530, DOI:10.1016/j.ijhydene.2020.05.031.
- S. Singh, A. Bhatnagar, V. Shukla, A. K. Vishwakarma, P. K. Soni, S. K. Verma and O. N. Srivastava, Int. J. Hydrogen Energy, 2020, 45, 774–786, DOI:10.1016/j.ijhydene.2019.10.204.
- A. Bhatnagar, S. K. Pandey, A. K. Vishwakarma, S. Singh, V. Shukla, P. K. Soni and O. N. Srivastava, J. Mater. Chem. A, 2016, 4, 14761–14772, 10.1039/C6TA05998H.
- A. C. Ferrari, J. C. Meyer, V. Scardaci, C. Casiraghi, M. Lazzeri and F. Mauri, Phys. Rev. Lett., 2006, 97, 187401, DOI:10.1103/PhysRevLett.97.187401.
- N. N. Sulaiman and M. Ismail, Dalton Trans., 2016, 45, 19380–19388, 10.1039/C6DT03646E.
- X. Yang, L. Ji, N. Yan, Z. Sun, X. Lu and L. Zhang, Dalton Trans., 2019, 48, 12699–12706, 10.1039/C9DT02084E.
- S.-A. Jin, J.-H. Shim, Y. Cho and K.-W. Yi, J. Power Sources, 2007, 172, 859–862, DOI:10.1016/j.jpowsour.2007.04.090.
- P. K. Soni, A. Bhatnagar, M. A. Shaz and O. N. Srivastava, Int. J. Hydrogen Energy, 2017, 42, 20026–20035, DOI:10.1016/j.ijhydene.2017.05.233.
- A. Valentoni, G. Mulas, S. Enzo and S. Garroni, Phys. Chem. Chem. Phys., 2018, 20, 4100–4108, 10.1039/C7CP07157D.
- S. A. Pighin, G. Urretavizcaya and F. J. Castro, J. Alloys Compd., 2017, 708, 108–114, DOI:10.1016/j.jallcom.2017.02.297.
- V. Shukla, A. Bhatnagar, S. K. Pandey, R. R. Shahi, T. P. Yadav, M. A. Shaz and O. N. Srivastava, Int. J. Hydrogen Energy, 2015, 40, 12294–12302, DOI:10.1016/j.ijhydene.2015.07.039.
- V. Shukla, A. Bhatnagar, S. Singh, P. K. Soni, S. K. Verma, T. P. Yadav and O. N. Srivastava, Dalton Trans., 2019, 48, 11391–11403, 10.1039/C9DT02270H.
- M. Ismail, Int. J. Hydrogen Energy, 2014, 39, 2567–2574, DOI:10.1016/j.ijhydene.2013.11.084.
- S. T. Sabitu, O. Fagbami and A. Goudy, J. Alloys Compd., 2011, 509, S588–S591, DOI:10.1016/j.jallcom.2010.11.174.
- D. Pukazhselvan, N. Nasani, P. Correia, E. Carbo-Argibay, G. Otero-Irurueta, D. G. Stroppa and D. P. Fagg, J. Power Sources, 2017, 362, 174–183, DOI:10.1016/j.jpowsour.2017.07.032.
- W. F. Kieffer, J. Chem. Educ., 1950, 27, 659, DOI:10.1021/ed027p659.
- M. El Khatabi, S. Naji, M. Bhihi, A. Benyoussef, A. El Kenz and M. Loulidi, J. Alloys Compd., 2018, 743, 666–671, DOI:10.1016/j.jallcom.2017.11.083.
- L. Seijo, Z. Barandiarán and S. Huzinaga, J. Chem. Phys., 1991, 94, 3762, DOI:10.1063/1.459748.
- A. Bhatnagar, J. K. Johnson, M. A. Shaz and O. N. Srivastava, J. Phys. Chem. C, 2018, 122, 21248–21261, DOI:10.1021/acs.jpcc.8b07640.
- J.-S. Youn, D.-T. Phan, C.-M. Park and K.-J. Jeon, Int. J. Hydrogen Energy, 2017, 42, 20120–20124, DOI:10.1016/j.ijhydene.2017.06.130.
- R. R. Shahi, R. K. Mishra, V. Shukla, A. Bhatnagar and O. N. Srivastava, Int. J. Hydrogen Energy, 2017, 42, 29350–29359, DOI:10.1016/j.ijhydene.2017.09.174.
- X. Wang and L. Andrews, J. Phys. Chem. A, 2004, 108, 11511–11520, DOI:10.1021/jp046410h.
- A. Lashgari, S. Ghamami, M. Golzani, G. Salgado-Morán, D. Glossman-Mitnik, L. Gerli-Candia and B. Abdolmaleki, J. Chil. Chem. Soc., 2016, 61, 3201–3205, DOI:10.4067/S0717-97072016000400010.
- U. Magg, H. Birk and H. Jones, Chem. Phys. Lett., 1988, 14, 263–266, DOI:10.1016/0009-2614(88)85286-2.
- M. Coroş, F. Pogacean, T. Ioan-Alexandru, M. Dan, C. Grosan and I.-O. Pana, Phys. E, 2020, 119, 113971, DOI:10.1016/j.physe.2020.113971.
Footnote |
| † Electronic supplementary information (ESI) available: Fig. S1: XRD spectra of (a) MgH2, (b) MgH2–SrF2 and (c) MgH2–SrF2@Gr. Fig. S2: FTIR spectra of (a) MgH2, (b) B.M. MgH2–SrF2, (c) Gr, (d) SrF2@Gr and (e) MgH2–SrF2@Gr. Fig. S3: XRD spectra of (a) Mg–(MgF2 + SrH2) (1st dehydrogenation) and (b) Mg–SrF2@Gr (1st dehydrogenation). Fig. S4: Scanning electron micrographs of (a) B.M. MgH2–SrF2, (b) 1st desorption of B.M. MgH2–SrF2 (Mg–(MgF2 + SrH2)@Gr), (c) B.M. MgH2–SrF2@Gr, and (d) after cycling of B.M. MgH2–SrF2@Gr (MgH2–(MgF2 + SrH2)@Gr), (e) EDAX spectra after cycling of the MgH2–(MgF2 + SrH2)@Gr sample and (f) elemental mapping after cycling of MgH2–(MgF2 + SrH2)@Gr. Fig. S5: XRD spectra of (a) MgH2–SrF2@Gr and (b) after 15th adsorption run of Mg/MgH2–(MgF2 + SrH2)@Gr. Fig. S6: DSC plot of ball milled MgH2 for 25 h at different heating rates: (a) 5 °C min−1, (b) 7 °C min−1 and (c) 10 °C min−1. (ii) Kissinger plot for the calculation of activation energy. Fig. S7: FTIR spectra of (a) Mg–(SrH2–MgF2)@Gr (1st dehydrogenation), (b) Mg–(SrH2–MgF2)@Gr (after 14 cycles of dehydrogenation) and (c) MgH2–(SrH2–MgF2)@Gr (after 15 cycles of rehydrogenation). See DOI: 10.1039/d1ma00012h |
| This journal is © The Royal Society of Chemistry 2021 |