 Open Access Article
Biodegradable Zn-ion battery with a lignin composite electrode and bio-ionic liquid based electrolyte: possible in situ energy generation by lignin electrocatalysis†
Abhishek
Lahiri
 *ab,
Li
Yang
a,
Oliver
Höfft
 a and
Frank
Endres
*a
aInstitute of Electrochemistry, Clausthal University of Technology, Arnold-Sommerfeld-Str. 6, 38678 Clausthal-Zellerfeld, Germany. E-mail: abhishek.lahiri@brunel.ac.uk; frank.endres@tu-clausthal.de
bDepartment of Chemical Engineering, Brunel University London, London UB8 3PH, UK
First published on 8th March 2021
Abstract
Electrochemical energy storage with lignin-based composite electrodes offers a cheap and renewable source for batteries. Lignin composites have mainly been used in supercapacitors and little has been investigated related to applying these composites in batteries. Here we show a biodegradable hybrid Zn-ion battery with a polymer/lignin composite electrode as a cathode, a Zn anode and bio-ionic liquid electrolytes. Interestingly, the polymer/lignin composite cathode led to a higher discharge capacity compared to the charge capacity over the entire 100 charge/discharge cycling process. It was observed that the lignin concentration in the composite polymer electrode was crucial in obtaining such a phenomenon. Using SEM, electrochemical analysis and NMR, we showed that lignin electrocatalytically oxidizes during battery charging, which produced the extra energy. This results in obtaining a higher discharge capacity compared to the charge capacity. It is anticipated that such an electrocatalytic technique can be extended to other battery systems to harness clean electrochemical energy from biomass.
Introduction
Development of batteries with sustainable materials is important to reduce the battery cost as well as reduce the complexity of the end-of-life battery recycling process. Biomass composite electrodes are potential alternatives to metal oxide electrodes due to its abundance and biodegradable properties. Besides electrodes, current batteries use toxic and flammable electrolytes, which makes battery recycling a challenging aspect. Therefore, new environmentally friendly electrolytes are equally necessary to develop safe batteries.Among different biomass, lignin is a naturally occurring biopolymer present in plant cells. It has a complex polymeric structure comprising mainly hydroxybenzene, guaiacyl (4-alkyl-2-methoxyphenol) and syringyl (4-alkyl-2,5-dimethoxyphenol).1–3 Due to its vast availability, effective valorization of lignin is of significant interest. Until now, main attention has been given towards lignin fractionation and/or depolymerisation using green chemistry routes to form value-added aromatics as products.2,4–6 However, the feasibility beyond the lab-scale has been questioned mainly due to the complex structure of lignin and its heterogeneity.6 In comparison to depolymerisation, some recent studies have shown the prospect of directly catalyzing lignin to electricity using a biomass fuel cell which works at elevated temperatures between 80 and 550 °C.7–9 However, the low conversion efficiency, costly electrodes (usually noble metals), elevated temperatures and low power density hinder further exploitation of the process.
Lignin derivatives such as lignosulfonates and its composites with conducting polymers have shown some promise in energy storage.10–13 The quinone groups formed by electrooxidation of guaiacyl and syringyl in lignin are excellent moieties for reversible redox reactions, which has been exploited for sensing molecules and for charge storage.12–14 Lignin based composite electrodes have been tested as capacitors in acidic or alkaline solutions.10–13 For batteries, lignin has been used as binders and electrodes15,16 wherein the electrodes were made by carbonizing lignin.16–19 Casado et al. showed the possibility of Na ion storage in a lignin/poly(3,4-ethylenedioxythiophene) composite electrode in ionic liquids, which showed a capacity of 70 mA h g−1 at a low current density of 25 mA g−1.20
Here, we demonstrate a new phenomenon in which lignin present in a polypyrrole composite electrode not only acts as a charge storage medium but also acts as an energy generating source during running of a Zn-ion battery in bio-ionic liquid electrolytes. This in situ energy generation in effect leads to >100% coulombic efficiency.
Results and discussion
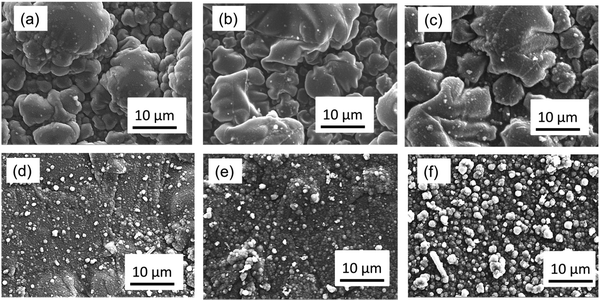
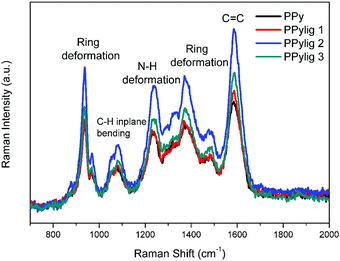
The composite electrode of polypyrrole (PPy) and lignin was obtained by electropolymerisation. The microstructures of the PPy and PPy/lignin composite electrodes are shown in Fig. 1. PPy shows the formation of coagulated large particles (Fig. 1a). The PPy/lignin composite shows a slightly different morphology as the concentration of lignin in the electrolyte is changed. As higher concentrations of lignin is incorporated in PPy, a much smoother morphology (Fig. 1d and e) is obtained with the presence of small particles of around 1 μm in size. An increase in particle size is again observed with further increase in lignin concentration (Fig. 1f). Comparing the microstructures of various composites in Fig. 1, it is evident that lignin significantly changes the PPy morphology.The Raman and X-ray photoelectron spectroscopy (XPS) of PPy and the PPy/lignin composites are shown in Fig. 2 and 3, respectively. The Raman spectra in Fig. 2 show characteristic peaks of polypyrrole.21 From Raman, it can be observed that, on addition of lignin to polypyrrole, almost insignificant shifts are observed. Most of the lignin peaks get merged within the polypyrrole structure. However, changes in the Raman intensity are evident. With the addition of 0.5 mg mL−1 lignin in the electrolyte, a slight increase in the Raman intensity is observed, which increases on addition of lignin to 2.5 mg mL−1 to the electrolyte and decreases on further addition of lignin. This indicates that the number of active functional groups/cross-linkages in the composite is the highest with the electrolyte containing 2.5 mg mL−1 of lignin. Due to the overlap of lignin modes and polypyrrole modes, it is not possible to distinguish the concentration of lignin in the polymer.
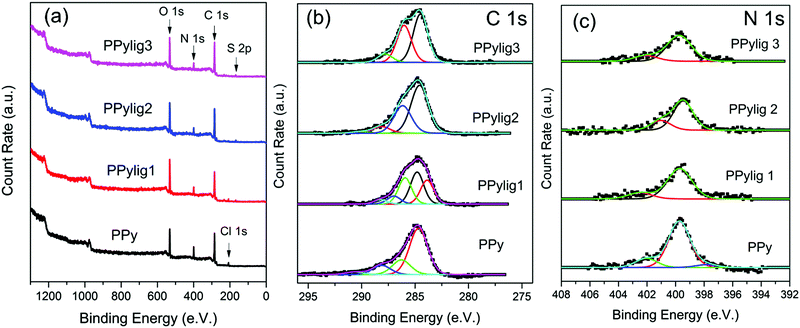
The XPS spectra of the PPy and PPy/lignin composite electrodes are compared in Fig. 3. From the XPS survey spectra in Fig. 3a, peaks related to C 1s, N 1s, O 1s, Cl 1s and S 2p are observed. The S 2p and Cl 1s come from lignosulfonate and LiClO4 present in the electrolyte, respectively. The presence of S 2p confirms the formation of the PPy/lignin composite electrode. The C 1s detailed spectra are shown in Fig. 3b. PPy shows three peaks at 284.8 eV (C–C bond), 286.3 eV (C–OH, C–N) and 288.1 eV (C![[double bond, length as m-dash]](https://www.rsc.org/images/entities/char_e001.gif) O).22,23 The presence of lignin in PPy broadens the C 1s spectra and an increase in the intensity at 286.3 eV is evident. This peak increase is due to the presence of p-hydroxyphenyl, guaiacyl, and syringyl moieties of lignin. The N 1s detailed spectra also show some changes. On addition of lignin in PPy, the N 1s spectra in Fig. 3c change from a symmetric peak to an asymmetric peak. Furthermore, a shoulder at 401 eV is observed, which clearly indicates additional lignin moieties present in the PPy matrix.
O).22,23 The presence of lignin in PPy broadens the C 1s spectra and an increase in the intensity at 286.3 eV is evident. This peak increase is due to the presence of p-hydroxyphenyl, guaiacyl, and syringyl moieties of lignin. The N 1s detailed spectra also show some changes. On addition of lignin in PPy, the N 1s spectra in Fig. 3c change from a symmetric peak to an asymmetric peak. Furthermore, a shoulder at 401 eV is observed, which clearly indicates additional lignin moieties present in the PPy matrix.
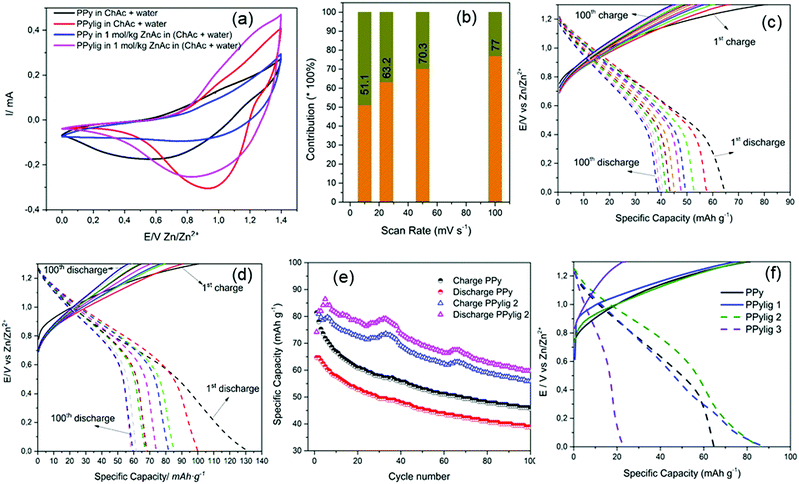
Fig. 4a shows the cyclic voltammetry curves of polypyrrole (PPy) and the PPy/lignin composite in 50 wt% choline acetate (ChAc) + 50 wt% water and 1 mol kg−1 of Zn acetate (ZnAc2) in (50 wt% ChAc + 50 wt% water). PPy shows almost a capacitive behavior in 50 wt% ChAc + 50 wt% water in the presence and absence of ZnAc2, whereas in the PPy/lignin composite electrode an oxidation peak at 1.04 V and a large reduction wave centered at 0.95 V are observed in 50 wt% ChAc + 50 wt% water. The oxidation/reduction peak is attributed to quinone moieties formed by guaiacyl and syringyl oxidation in lignin.14 On addition of ZnAc2 in the electrolyte, a shift in the oxidation peak to 1 V and reduction peak to 0.81 V is observed. The shift in the oxidation/reduction peaks confirms that Zn ions are being stored in the biopolymer matrix. The contribution of the capacitive process in the PPy/lignin composite electrode was determined by plotting log of the current (at a particular voltage) versus log of the scan rate according to the equation i = aνb where a is a constant and b is a value ranging from 0.5 (diffusion controlled contribution) to 1 (capacitive contribution).24–26 The current was chosen at the peak potentials at 0.95 V and 0.76 V in the anodic and cathodic processes (from Fig. S1a, ESI†), respectively. From Fig. S1b (ESI†), the value of b was found to be 0.73 and 0.65 for the cathodic and anodic processes, respectively, which suggests the capacitive process to be the main contribution to charge storage. The contribution of capacitive and faradaic processes is shown in Fig. 4b, from which it is evident that with an increase in the scan rate the capacitive process becomes more prominent. The hybridization of both faradaic and capacitive processes is an added benefit in high energy density battery systems27 for fast charging of the battery.
Fig. 4c and d compare the charge discharge of the PPy and PPy/lignin composite electrodes in Zn-ion batteries. In PPy the charge discharge curve shows that an initial discharge capacity of 65 mA h g−1 is achieved for Zn storage and the charging process takes a considerably longer time. In comparison, on addition of lignin to PPy, a remarkable change in the charge–discharge behavior is observed in Fig. 4d. A synergic effect is seen with a higher initial discharge capacity of almost 130 mA h g−1, which can be related to the presence of lignin which acts as additional Zn storage sites and leads to an initial higher discharge capacity. However, strangely the discharge capacity is higher than the charge capacity, which can occur due to irreversibility or a secondary reaction that generates in situ energy during the charge process. Irreversibility would be detrimental to the battery performance as Zn would be consumed with cycling, leading to lower battery performance; however, in situ energy generation might lead to new battery chemistry.
The galvanostatic charge–discharge curves with the number of cycles of PPy and the PPy/lignin composite are compared in Fig. 4e. Compared to Fig. 4d, it is evident that in the first cycle the charge capacity is higher than the discharge capacity for the PPy/lignin composite. However, from the second cycle a higher discharge capacity compared to the charge capacity is observed. Repeated experiments with different PPy/lignin composites showed that such a behavior is observed sometimes in the first cycle but reverses from the second cycle. The instability in the charge/discharge behavior in Fig. 4e can be ascribed to the heterogeneous and complex structure of lignin. With a change in the lignin concentration in PPy, a similar behavior of an increased discharge capacity compared to the charge capacity is seen (Fig. 4f and Fig. S2, ESI†) until a certain concentration. With a higher concentration of lignin in PPy, not only is a significant decrease in capacity storage observed but also the charge capacity becomes higher than the discharge capacity (PPylig3, Fig. 4f). This might be due to a phase change in the PPy/lignin composite (see Fig. 1 wherein a significant change in the morphology is observed with varying lignin in the biopolymer matrix), which inhibits the secondary reaction from taking place. Also, a higher concentration of lignin leads to lowering of the active sites in the polymer as seen from Fig. 2. The galvanostatic charge–discharge curves of different PPy/lignin composites are shown in Fig. S2 (ESI†). Except for the case of PPylig3, it is evident that in all the cases the discharge capacity is higher than the charge capacity (Fig. S2, ESI†).
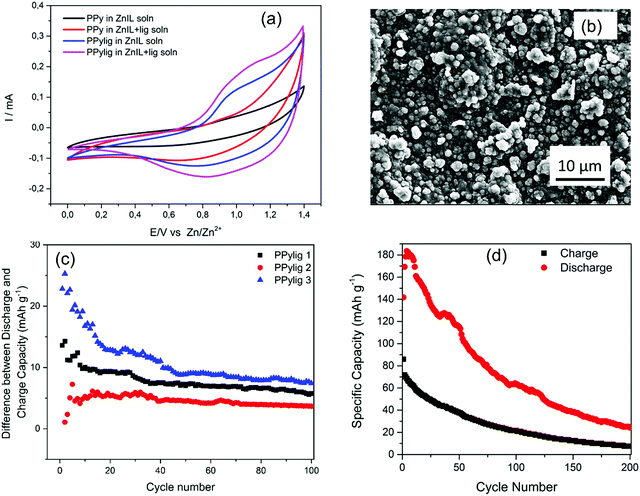
To understand the influence of lignin in generating energy during charging, the electrolyte and electrode were analyzed. The CV of PPy and the PPy/lignin composite in the Zn ion containing electrolyte with and without lignin is shown in Fig. 5a. PPy in the electrolyte shows a capacitive behavior. However, on addition of lignosulfonate in the electrolyte, a clear increase in current from 0.95 V is observed (red line, Fig. 5a), which can be associated with electrocatalytic oxidation/dissolution of lignin.25 In the PPy/lignin composite electrode the CV shows an oxidation/reduction behavior, which is related to the quinone redox process. However, with lignosulfonate in the electrolyte, an increase in current as well as a shift in the oxidation potential by less than 100 mV (pink line, Fig. 5a) is evident.
It has been shown that Zn can accelerate the depolymerisation of lignin in formic acid2 and therefore the increase in current in Fig. 5a along with the reduced potential can be associated with the increase in electrocatalytic oxidation/dissolution of lignin. Therefore, on running the battery, the increase in discharge capacity compared to charge capacity can be associated with the electrons generated by the electrocatalytic oxidation/dissolution of lignin during battery charging. To prove the electrocatalytic oxidation/dissolution behavior from the PPy/lignin composite electrode, CV cycles were run in the 50 wt% ChAc + 50 wt% water electrolyte (Fig. S3, ESI†). It is evident from the CV curves (Fig. S3b, ESI†) that with cycling the current related to the redox reaction increases and reaches almost saturation after about 40 cycles. This is in contrast with that observed in PPy (Fig. S3a, ESI†) in the same electrolyte, wherein a decrease in the redox reaction took place. This indicates that lignin is electrocatalytically oxidized/dissolved and generates energy during this process. Furthermore, the microstructure of the PPy/lignin composite observed after CV cycles in Fig. 5b shows formation of a number of particles of about 1 μm in size compared to fewer particles observed in Fig. 1d. Furthermore, on plotting the difference between the discharge capacity and charge capacity with the cycle number for different PPy/lignin composite electrodes (Fig. 5c), it is evident that the capacity difference fades with cycling, which confirms the irreversible lignin oxidation/dissolution during the charge process. However, with different lignin concentration in PPy, an additional average energy of about 5 mA h g−1 is still present even after 50 cycles. This suggests that the electrooxidation/dissolution of lignin in this electrolyte is slow. It has been shown that lignin dissolution is difficult in ionic liquids with low yields of 6% at 110 °C.28 Therefore, it is anticipated that the lignin powered battery would result in producing additional energy for a long time and less energy will be needed to charge the battery. In order to relegate the effect of the carbon current collector in producing extra energy, the PPy/lignin composite was deposited on ITO and the battery was tested in the same electrolyte. Fig. 5d again shows a higher discharge compared to charge, which decreases with the cycle number. Although the specific capacity decreases significantly with the cycle number, the discharge is more than the charge even after 200 cycles, which clearly indicates that the current collector has no role in producing extra energy during charging. However, repeated experiments showed that the battery capacity is significantly affected (Fig. S4, ESI†), which might be due to the heterogeneous structure of lignin resulting in different polymer composites. From Fig. S4 (ESI†), it is noted that the specific capacity difference between discharge and charge lies in the range of 0.2–0.8 mA h g−1 and at times shows this phenomenon to be reversed. Furthermore, ageing of pyrrole was found to be critical as only the PPy/lignin composite from aged pyrrole resulted in obtaining a higher discharge capacity compared to the charge capacity (see the Experimental section). Our repeated experiments showed that 80% of the time we can obtain a higher discharge capacity compared to the charge capacity.
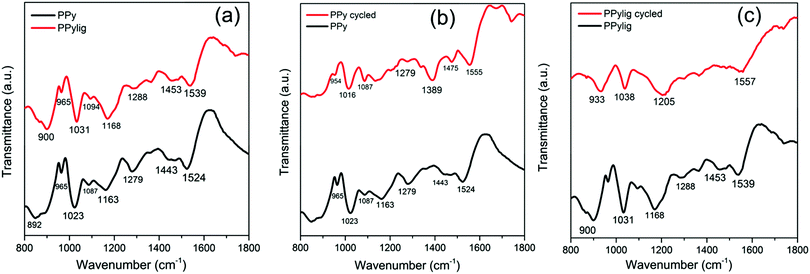
To understand the electrocatalysis phenomena of lignin in the battery, FTIR, NMR and XPS were used. Fig. 6 compares the changes in the FTIR spectra of PPy and PPy/lignin. The FTIR spectra of PPy and PPy/lignin mainly show a blue-shift in the composite electrode, which has been reported to be due to the masking effect of the conducting electrode even at higher concentrations of lignin in the composite.29 The region between 1200 and 1500 cm−1 (related to monolignol vibrations and C–C and C–O stretching in lignin and C–N and N–H in-plane bending in PPy) has been shown to be the region where both lignin and polypyrrole vibrations overlap. Therefore, the change in this region in the case of the cycled PPy/lignin composite would indicate that the electrocatalytic oxidation of lignin has taken place. Fig. 6b compares the IR spectra of polypyrrole before and after cycling in a Zn-ion battery, from which it is evident that between 1400 and 1500 cm−1 a blue shift in the PPy spectrum is observed after cycling.
In the region between 1100 and 1400 cm−1, new peaks are formed and a prominent peak at 1389 cm−1 appears. These new peaks can be related to Zn–N bonds formed in the electrode. In comparison to PPy, if we look into the PPy/lignin composite in Fig. 6c, it becomes evident that between 1205 and 1500 cm−1 most of the peaks disappear. As this region is related to the lignin vibrations, the disappearance of the peaks might be related to the electrocatalytic oxidation/dissolution of lignin, which must have provided the extra energy during charging of the battery.
To further prove lignin dissolution, the electrolyte was analyzed using 1H NMR. Comparing the 1H NMR spectra (Fig. S5–S8, ESI†), it is evident that certain changes take place in the choline region at 2.88, 3.19 and 3.73 ppm and acetate region at 1.66 ppm.30 On performing charge–discharge cycles with the PPy electrode, a downfield shift in both the choline and acetate region by 0.04 and 0.03 ppm is observed, whereas the electrolyte cycled in PPy/lignin shows an upfield shift by 0.06 and 0.07 ppm, respectively, compared to the ZnAc2 containing electrolyte. This clearly indicates that the lignin in the PPy/lignin electrode might have dissolved in the electrolyte. Xu et al. found similar results wherein both the cation and anion are affected on dissolution of lignin in choline carboxylate ionic liquids.30
The electrode was further investigated with XPS to evaluate the structural changes in the electrodes. XPS of the as synthesized PPy and PPy/lignin and after cycling in the Zn-ion battery are compared in Fig. S9 (ESI†). A stark difference in the cycled PPy and PPy/lignin is observed, wherein the survey spectra (Fig. S9a, ESI†) show the presence of Zn which gets trapped into the polymer matrix during cycling,31 thereby reducing the capacity with the cycle number. Also, there is a loss in the C 1s and S 2p peaks, which can be related to anion exchange from C 1s by CH3COO−, and dissolution of sulfur species in the bio-ionic liquid, respectively. From the C 1s spectra (Fig. S9b, ESI†), PPy shows a peak split, whereas PPy/lignin shows broadening of the peak. In PPy, the deconvoluted peaks are attributed to C, C–O/C–N and C![[double bond, length as m-dash]](https://www.rsc.org/images/entities/char_e001.gif) O, whereas in PPy/lignin, besides these peaks, an additional peak related to COOH is seen at 288.5 eV.31,32 The N 1s spectra in Fig. S9c (ESI†) show peak splitting in both PPy and PPy/lignin after cycling. In PPy peak splits are observed at 402 eV and 398.3 eV, whereas in PPy/lignin two peaks at 402.5 and 399.7 eV are distinguished. In PPy, the peaks are due to C
O, whereas in PPy/lignin, besides these peaks, an additional peak related to COOH is seen at 288.5 eV.31,32 The N 1s spectra in Fig. S9c (ESI†) show peak splitting in both PPy and PPy/lignin after cycling. In PPy peak splits are observed at 402 eV and 398.3 eV, whereas in PPy/lignin two peaks at 402.5 and 399.7 eV are distinguished. In PPy, the peaks are due to C![[double bond, length as m-dash]](https://www.rsc.org/images/entities/char_e001.gif) N+ and Zn–N,33 respectively, whereas in PPy/lignin the peaks can be attributed to C
N+ and Zn–N,33 respectively, whereas in PPy/lignin the peaks can be attributed to C![[double bond, length as m-dash]](https://www.rsc.org/images/entities/char_e001.gif) N+ and C
N+ and C![[double bond, length as m-dash]](https://www.rsc.org/images/entities/char_e001.gif) N.29 This shift in the peak arises due to the change in Zn coordination with the cathode. From the O 1s spectra (Fig. S9d, ESI†), it is evident that the presence of lignin in PPy changes the O 1s spectra from a symmetric to an asymmetric peak with a shoulder occurring at 530.6 eV. The change in the peak occurs due to the additional p-hydroxyphenyl, guaiacyl, and syringyl moieties present in lignin. The peaks at 532.0 ± 0.5 eV and 533.5 ± 0.5 eV occur due to C
N.29 This shift in the peak arises due to the change in Zn coordination with the cathode. From the O 1s spectra (Fig. S9d, ESI†), it is evident that the presence of lignin in PPy changes the O 1s spectra from a symmetric to an asymmetric peak with a shoulder occurring at 530.6 eV. The change in the peak occurs due to the additional p-hydroxyphenyl, guaiacyl, and syringyl moieties present in lignin. The peaks at 532.0 ± 0.5 eV and 533.5 ± 0.5 eV occur due to C![[double bond, length as m-dash]](https://www.rsc.org/images/entities/char_e001.gif) O and C–O, respectively.34 After cycling, a shift in O 1s for PPy is observed to 531.5 and 530.2 eV. The lower binding energy can be attributed to the presence of Zn in the PPy matrix, which forms ZnO, whereas the higher binding energy peak is related to C
O and C–O, respectively.34 After cycling, a shift in O 1s for PPy is observed to 531.5 and 530.2 eV. The lower binding energy can be attributed to the presence of Zn in the PPy matrix, which forms ZnO, whereas the higher binding energy peak is related to C![[double bond, length as m-dash]](https://www.rsc.org/images/entities/char_e001.gif) O. In contrast, the cycled PPy/lignin composite shows an almost symmetric curve similar to the original PPy, which clearly indicates that the lignin moieties have oxidized/dissolved in the electrolyte.
O. In contrast, the cycled PPy/lignin composite shows an almost symmetric curve similar to the original PPy, which clearly indicates that the lignin moieties have oxidized/dissolved in the electrolyte.
Conclusion
In conclusion, we have shown a unique battery chemistry wherein a higher discharge capacity is obtained compared to the charge capacity in a biomass based composite electrode with a bio-ionic liquid electrolyte. It was found that a secondary reaction takes place during charging of the battery which is triggered by lignin electrocatalysis in the bio-ionic liquid, which generates additional energy. From the charge–discharge curves, although a significant drop in the battery capacity is observed, the discharge capacity remains higher than the charge capacity. The present results open up new avenues of exploiting lignin based composite electrodes not only for energy storage but also for a combined energy production/storage hybrid system, which might have applicability in different batteries.Experimental methods
The ionic liquid, choline acetate (ChAc), was purchased from IO-LI-TEC, Germany (99%). Zinc acetate and lithium perchlorate (99.99%) were obtained from Sigma-Aldrich (99%) and pyrrole (>98%) was purchased from Alfa Aeser. The pyrrole was distilled prior to use and was stored in a refrigerator. Fresh pyrrole and aged pyrrole (after 3 weeks in the refrigerator) were used to deposit polypyrrole. GCMS results showed that in aged pyrrole a partial polymerization process takes place (Fig. S10, ESI†). The polypyrrole/lignin composites were deposited from the electrolyte containing different concentrations of lignosulfonate sodium salt (Sigma Aldrich). For battery testing, the Zn ion containing electrolyte was 1 mol kg−1 of ZnAc2 in (50 wt% ChAc + 50 wt% water).The polypyrrole and polypyrrole/lignin composite cathodes were prepared on carbon paper and ITO by running ten cyclic voltammetry (CV) cycles between −0.4 V and 1.1 V vs. Ag/AgCl (3 M NaCl) from aqueous electrolyte containing 0.05 M LiClO4 and 0.1 M pyrrole (2.5 mg mL−1 lignosulfonate sodium salt). After the deposition, the deposit was washed thoroughly in isopropanol. The loading mass was 0.2 mg cm−2.
Electrochemical measurements were conducted in a flooded cell containing the polymer as the working electrode, 1 mol kg−1 ZnAc2 in (50 wt% ChAc + 50 wt% water) as the electrolyte, and a Zn wire/sheet as counter and reference electrodes, respectively. Prior to the experiments, the Zn wire/sheets were mechanically polished to remove the oxide layer. Cyclic voltammetry (CV) was carried out using a VersaStat III (Princeton Applied Research) potentiostat/galvanostat controlled by Power-CV, and galvanostatic charge–discharge test experiments were carried out using a battery tester (Arbin BT2000).
SEM of the samples was carried out with a JEOL JSM7610F. FTIR was performed on an ATR Vertex 70×. Proton nuclear magnetic resonance (1H NMR) spectra were recorded with an Avance III 600 MHz FT-NMR spectrometer (Bruker, Germany). The solvent used for the NMR spectroscopy was D2O.
X-ray photoelectron spectra (XPS) were obtained using an ultrahigh vacuum (UHV) apparatus with a base pressure below 1 × 10⁻¹⁰ h Pa. The sample was irradiated using the Al K alpha line (photon energy of 1486.6 eV) of a non-monochromatic X-ray source (Omicron DAR 400). Electrons emitted were detected by a hemispherical analyser (Omicron EA125) under an angle of 45° to the surface normal with a calculated resolution of 0.8 eV for detailed spectra and 2.1 eV for survey spectra. All XPS spectra were displayed as a function of the binding energy with respect to the Fermi level.
Conflicts of interest
There are no conflicts to declare.Acknowledgements
Financial support by the BMBF project ZIB 03XP0204C is gratefully acknowledged. We also thank Guozhu Li for XPS measurements, CUTEC for GCMS measurements and Dr. J. C. Namyslo for NMR measurements.References
- R. Ma, M. Guo and X. Zhang, Catal. Today, 2018, 302, 50–60 CrossRef.
- A. Rahimi, A. Ulbrich, J. J. Coon and S. S. Stahl, Nature, 2014, 515, 249–252 CrossRef CAS PubMed.
- C. Wang, H. Li, M. Li, J. Bian and R. Sun, Sci. Rep., 2017, 7, 593 CrossRef PubMed.
- Z. Sun, B. Fridrich, A. de Santi, S. Elangovan and K. Barta, Chem. Rev., 2018, 118, 614–678 CrossRef CAS PubMed.
- W. Schutyser, T. Renders, S. Van den Bosch, S.-F. Koelewijn, G. T. Beckham and B. F. Sels, Chem. Soc. Rev., 2018, 47, 852–908 RSC.
- S. Gillet, M. Aguedo, L. Petitjean, A. R. C. Morais, A. M. da Costa Lopes, R. M. Lukasik and P. T. Anastas, Green Chem., 2017, 19, 4200–4233 RSC.
- R. B. Lima, R. Raza, H. Qin, J. Li, M. E. Lindström and B. Zhu, RSC Adv., 2013, 3, 5083–5089 RSC.
- W. Liu, W. Mu, M. Liu, X. Zhang, H. Cai and Y. Deng, Nat. Commun., 2014, 5, 3208 CrossRef PubMed.
- W. Liu, W. Mu and Y. Ding, Angew. Chem., Int. Ed., 2014, 53, 13558–13562 CrossRef PubMed.
- G. Milczarek and O. Inganäs, Science, 2012, 335, 1468–1471 CrossRef CAS PubMed.
- D. H. Nagaraju, T. Rebis, R. Gabrielsson, A. Elfwing, G. Milczarek and O. Inganäs, Adv. Energy Mater., 2014, 4, 1300443 CrossRef.
- S. Chaleawlert-umpon, T. Berthold, X. Wang, M. Antonietti and C. Liedel, Adv. Mater. Interfaces, 2017, 4, 1700698 CrossRef.
- C. Che, M. Vagin, U. Ail, V. Gueskine, J. Phopase, R. Brooke, R. Gabrielsson, M. P. Jonsson, W. C. Mak, M. Berggren and X. Crispin, Adv. Sustainable Syst., 2019, 3, 1900019 Search PubMed.
- G. Milczarek, Langmuir, 2009, 25, 10345–10353 CrossRef.
- T. C. Nirmale, B. B. Kale and A. J. Verma, Int. J. Biol. Macromol., 2017, 103, 1032–1043 CrossRef PubMed.
- J. L. Espinoza-Acosta, P. I. Torres-Chávez, J. L. Olmedo-Martínez, A. Vega-Rios, S. Flores-Gallardo and E. A. Zaragoza-Contreras, J. Energy Chem., 2018, 27, 1422–1438 CrossRef.
- W. E. Tenhaeff, O. Rios, K. More and M. A. McGuire, Adv. Funct. Mater., 2014, 24, 86–94 CrossRef CAS.
- Y. Li, Y.-S. Hu, H. Li, L. Chen and X. Huang, J. Mater. Chem. A, 2016, 4, 96–104 RSC.
- X. Dou, I. Hasa, M. Hekmatfar, T. Diemant, R. J. Behm, D. Buchholz and S. Passerini, ChemSusChem, 2017, 10, 2668–2676 CrossRef CAS.
- N. Casado, M. Hilder, C. Pozo-Gonzalo, M. Forsyth and D. Mecerreyes, ChemSuSChem, 2017, 10, 1783–1791 CrossRef CAS.
- M. J. L. Santos, A. G. Brolo and E. M. Girotto, Electrochim. Acta, 2007, 52, 6141–6145 CrossRef.
- C. Malitesta, I. Losito, L. Sabbatini and P. G. Zambonin, J. Electron. Spectrosc., 1995, 76, 629–634 CrossRef.
- H. Ge, E. Qi, E.-T. Kang and K. G. Neoh, Polymer, 1994, 35, 504–508 CrossRef.
- V. Augustyn, J. Come, M. A. Lowe, J. W. Kim, P. L. Taberna, S. H. Tolbert, H. D. Abruňa, P. Simon and B. Dunn, Nat. Mater., 2013, 12, 518–522 CrossRef PubMed.
- C. Chen, Y. Wen, X. Hu, X. Ji, M. Yan, L. Mai, P. Hu, B. Shan and Y. Huang, Nat. Commun., 2015, 6, 6929 CrossRef PubMed.
- D. Chao, P. Liang, Z. Chen, L. Bai, H. Shen, X. Liu, X. Xia, Y. Zhao, S. V. Savilov, J. Lin and Z. X. Shen, ACS Nano, 2016, 10, 10211–10219 CrossRef PubMed.
- M. R. Lukatskaya, B. Dunn and Y. Gogotsi, Nat. Commun., 2016, 7, 1264 Search PubMed.
- E. Reichert, R. Wintringer and D. A. Volmer, Phys. Chem. Chem. Phys., 2012, 14, 5214–5221 RSC.
- F. N. Ajjan, M. J. Jafari, T. Rębiś, T. Ederth and O. Inganäs, J. Mater. Chem. A, 2015, 3, 12927–12937 RSC.
- A. Xu, X. Guo, Y. Zhang, Z. Li and J. Wang, Green Chem., 2017, 19, 4067–4073 RSC.
- A. Lahiri, L. Yang, G. Li and F. Endres, ACS Appl. Mater. Interfaces, 2019, 11, 45098–45107 CrossRef.
- H. Ge, G. Qi, E. T. Kang and K. G. Neoh, Polymer, 1994, 35, 504–508 CrossRef.
- M. B. Haider, Nanoscale Res. Lett., 2017, 2, 5 CrossRef PubMed.
- K. Idla, A. Talo, H. E. M. Niemi, O. Forsén and S. Yläsaari, Surf. Interface Anal., 1997, 25, 837–854 CrossRef.
Footnote |
| † Electronic supplementary information (ESI) available. See DOI: 10.1039/d0ma00954g |
| This journal is © The Royal Society of Chemistry 2021 |

