
 Open Access Article
 This Open Access Article is licensed under a Creative Commons Attribution-Non Commercial 3.0 Unported Licence
Metal-doped carbons from polyurea-crosslinked alginate aerogel beads†
Grigorios
Raptopoulos
a,
Maria
Papastergiou
a,
Despoina
Chriti
a,
Eleni
Effraimopoulou
a,
Tomaž
Čendak
 b,
Nikolaos
Samartzis
c,
Gregor
Mali
b,
Theophilos
Ioannides
c,
Pavel
Gurikov
d,
Irina
Smirnova
e and
Patrina
Paraskevopoulou
*a
b,
Nikolaos
Samartzis
c,
Gregor
Mali
b,
Theophilos
Ioannides
c,
Pavel
Gurikov
d,
Irina
Smirnova
e and
Patrina
Paraskevopoulou
*a
aInorganic Chemistry Laboratory, Department of Chemistry, National and Kapodistrian University of Athens, Panepistimiopolis Zografou 15771, Athens, Greece. E-mail: paraskevopoulou@chem.uoa.gr
bNational Institute of Chemistry, Hajdrihova 19, 1000 Ljubljana, Slovenia
cFoundation for Research & Technology-Hellas, Institute of Chemical Engineering Sciences (FORTH/ICE-HT), 26504 Patras, Greece
dLaboratory for Development and Modelling of Novel Nanoporous Materials, Hamburg University of Technology, Eißendorfer Straße 38, 21073 Hamburg, Germany
eInstitute of Thermal Separation Processes, Hamburg University of Technology, Eißendorfer Straße 38, 21073 Hamburg, Germany
First published on 24th March 2021
Abstract
Metal-doped polyurea-crosslinked alginate aerogel beads (X–M–alginate; M: Ca, Co, Ni, Cu) were prepared via the reaction of an aromatic triisocyanate (Desmodur RE) with the –OH groups on the surface of pre-formed M–alginate wet gels, and with adsorbed gelation water. The X–M–alginate aerogels consisted of 49–63% polyurea and contained 2–7% metal ions; they were fibrous macro/meso/microporous materials with porosities up to 94% v/v, and BET surface areas 245–486 m2 g−1, comparable to those of native M–alginate aerogels (258–542 m2 g−1). The pyrolysis of X–M–alginate aerogels (M: Co, Ni, Cu) at 800 °C yielded carbon aerogels (X–M–C; 33–37% yield) doped with the corresponding metal (as well as with Cu2O in the case of X–Cu–C), with crystallite sizes of around 22 nm. The X–M–C aerogels retained the general fibrous morphology of their precursor (X–M–alginate) aerogels, and while X–Co–C and X–Ni–C appeared similar, the fibrous morphology of X–Cu–C was distinctly different, indicating an effect of the metal on the nanostructure of the corresponding carbon. The porosities of all X–M–C aerogels were in the range of 88–92% v/v, including macro-, meso- and micropores. Their BET surface areas were in the range of 426–541 m2 g−1, of which 208–319 m2 g−1 was allocated to micropores. In addition to the metals, XPS, Raman and FTIR analyses showed the presence of oxygen and nitrogen functionalities. Carbon in the X–M–C aerogels showed signs of stacking of graphene oxide sheets (14–15 nm), but also a low degree of graphitization and a large number of defects. This work provides a direct, inexpensive method for the preparation of fibrous metal-, oxygen- and nitrogen-doped carbon aerogels with potential for catalytic and electrochemical applications.
1. Introduction
Aerogels were discovered in the early 1930s by Kistler1 and they are defined as solid colloidal or polymeric networks of nanoparticles expanded throughout their entire volume by a gas.2,3 Silica aerogels were the first prepared, followed soon after by other inorganic oxide aerogels, while organic aerogels, based on organic polymers or biopolymers, hybrid organic–inorganic aerogels, or carbon aerogels, were developed later.4 Along with the development of the different classes of aerogels came their exploitation for various applications, taking advantage of the combination of the chemical composition of the materials and their unique properties related to their nanoporous structure, i.e., high surface areas, low thermal conductivities, low dielectric constants, and high acoustic attenuation. The most wide-spread application of aerogels is thermal insulation;5 however aerogels have also been used for energy storage, acoustic insulation, dielectrics, adsorption, sensors and actuators, environmental remediation, catalysis, biomedicine, and in the food industry.4Carbon aerogels, in particular, are chemically inert, have a high electrical conductivity, are highly-porous materials (often with a significant portion of microporosity) and have very high specific surface areas.6 These properties, in combination with heteroatom functionalities, including nitrogen and oxygen species as well as nano-sized metals that are homogeneously distributed throughout the entire network, make them excellent candidates for several applications, including, but not limited to, electrochemical applications (e.g., double-layer capacitors, electrodes in fuel cells), water desalination, and also for adsorption, heterogeneous catalysis and in biomedical applications.6
Carbon aerogels are generally obtained via the pyrolysis of organic aerogels under inert gas (Ar or N2). They have been prepared as monoliths, thin films, microspheres or powders. Several organic aerogels have been used as precursors for carbon aerogels, including various phenolic resins,7–9 but also polyurea,10 polyimide,11,12 polyamide,13,14 polyacrylonitrile15 aerogels, or bio-based aerogels, such as alginate,16–24 cellulose,25 chitosan26,27 aerogels, and others. In some cases, the addition of carbon nanotubes or graphene oxide to organic sols yields organic polymer/carbon allotrope composite aerogels, which after pyrolysis yield carbon nanotube or graphene aerogels, respectively.19,28–31
Recently, we introduced a new class of aerogels, polyurea-crosslinked biopolymer (X-alginate and X-chitosan) aerogels,32,33 expanding the polymer-crosslinking (X-aerogel) technology that was developed for silica aerogels34–37 and was later applied to a wide range of metal oxide aerogels.38–43 In the X-aerogel technology the surface of pre-formed wet-gel networks can be modified, via reaction of the functional groups present on the surface (e.g., –OH or –NH2) with multifunctional reagents (e.g., multifunctional isocyanates), leading to the formation and accumulation of a nano-thin conformal polymer coating over the entire skeletal framework of the inorganic or biopolymer aerogel.
Alginate (Scheme 1) aerogels are carbonizable and advantageous precursors for the preparation of metal-doped aerogels, since they are biopolymers, biocompatible, and can be very easily synthesized in water.44,45 It was reasoned that X-alginate aerogels, crosslinked with a polyurea that is also carbonizable, would be good precursors for metal-doped carbon aerogels with higher carbonization yields compared with native alginate aerogels. Besides that, the resulting carbons would be nitrogen-enriched, as the polyurea contains nitrogen. To that end, this study presents a group of X–M–alginate (M: Ca, Co, Ni, Cu) aerogels, prepared from the corresponding M–alginate wet-gels and the aromatic triisocyanate triphenylmethane-4,4′,4′′-triisocyanate (TIPM; Scheme 1), and their pyrolysis to the corresponding carbon (X–M–C) aerogels. The choice of TIPM was based on the fact that all aerogels derived from this triisocyanate, including polyurea,10 poly(urethane acrylate)46 and polyamide13,14 aerogels, are carbonizable, with carbonization yields up to 57%. X–M–C aerogels are not only metal-doped, but they also contain oxygen and nitrogen functional groups, which are highly desirable for electrochemical applications, as they are known to improve surface wettability and conductivity, and sometimes to provide pseudo-capacitance.24
 | ||
| Scheme 1 Structures of calcium alginate and of the isocyanates Desmodur N3300 (trimer of hexamethylene diisocyanate) and Desmodur RE (triphenylmethane-4,4′,4′′-triisocyanate; TIPM). | ||
2. Experimental section
2.1. Materials and methods
Two different sodium alginate sources with different guluronic acid (G) contents were used: PROTANAL LF 240 D, G 30–35% (referred to as G35) and PROTANAL LF 200 S, G 65–75% (referred to as G75). CaCl2, CoCl2·6H2O, Ni(NO3)2·6H2O and CuCl2·2H2O were purchased from Sigma. Desmodur RE (27% w/w triphenylmethane-4,4′,4′′-triisocyanate (TIPM) solution in ethyl acetate (EA)) was generously provided by Covestro AG. MeCN (HPLC grade) and acetone were purchased from Fisher and were used as received.SCF drying was carried out in an autoclave (E3100, Quorum Technologies, East Sussex, UK). Wet-gels were placed in the autoclave at 12 °C and were covered with acetone. Liquid CO2 was added into the autoclave; acetone was drained out as it was being displaced by the liquid CO2 (5×; 1 per 30 min). Afterwards, the temperature of the autoclave was raised to 45 °C and was maintained for 1 h. Finally, the pressure was gradually released, allowing SCF CO2 to escape as a gas, leaving the dry-gels (aerogels).
13C Cross-Polarization Magic Angle Spinning (CPMAS) NMR spectra were obtained using a 600 MHz Varian spectrometer (Varian, Palo Alto, CA, USA) operating at 150.80 MHz for 13C. For 13C ramped CPMAS spectra, the spinning rate used was 20 kHz. ATR-FTIR spectra were obtained using a PerkinElmer Spectrum 100 Spectrometer. Raman spectra were recorded with the 514.5 nm laser line, while the scattered light was analyzed using a T64000 micro-Raman spectrometer (Jobin Yvon). A microscope objective of 50× magnification was used with a spot size of 2–3 μm. The Raman band of crystalline Si at 520 cm−1 was used to calibrate the wavenumber scale.
The surface chemistry of the samples was analyzed by means of X-ray Photoelectron Spectroscopy in an ultrahigh vacuum chamber (5 × 10⁻¹⁰ mbar) equipped with a SPECS Phoibos 100-1D-DLD hemispherical electron analyzer. XP spectra were acquired using the MgKa 1253.6 eV photon energy and an analyzer pass energy of 10 eV, resulting in a full width at half maximum (FWHM) of 0.85 eV for the Ag 3d5/2 peak. The diameter of the analyzed area spot was 3 mm, while the atomic ratios were calculated using the intensity (peak area) of the XPS peaks weighted with the corresponding relative sensitivity factors (RSF). The RSFs were derived from the Scofield cross-section, taking into account the electron transport properties of the matrix (namely, the inelastic mean free path (IMFP) λi and the elastic-scattering correction factor Q which depend mainly on the corresponding electron kinetic energy (KE)) and the transmission function of the energy analyzer. For the spectral collection and fitting, SpecsLab Prodigy (Specs GmbH, Berlin) commercial software was used. Samples were pressed onto In substrates. For the X–Ni–C sample an AlKa 1486.6 eV photon energy was also employed, so that the In MNN Auger peak does not overlap with the Ni2p3/2 photoemission peak. The binding energy scale was calibrated using the 284.5 eV photoemission peak of sp2 carbon.
Thermogravimetric analysis (TGA) was performed using a Mettler-Toledo TGA/DSC1 instrument (Schwerzenbach, Switzerland). Samples were placed in platinum crucibles. An empty platinum crucible was used as a reference. Samples were heated from ambient temperatures to 800 °C in a 50 mL min−1 flow of N2 at a heating rate of 10 °C min−1.
N2-sorption and CO2-adsorption measurements were obtained using a Micromeritics Tristar II 3020 surface area and porosity analyzer (Micromeritics, Norcross, GA, USA). Skeletal densities (ρs) were determined by He pycnometry, using a Micromeritics AccuPyc II 1340 pycnometer (Micromeritics, Norcross, GA, USA). Bulk densities (ρb) of the samples were calculated from their weight and natural dimensions.
Scanning electron microscopy (SEM) characterization was conducted with Pt-coated samples adhered to a conductive double-sided adhesive carbon tape, using a high resolution FESEM JEOL JSM 7401f instrument. Scanning electron microscopy (SEM) and energy dispersive X-ray (EDX) spectroscopy experiments were carried out on free-surface, gold-coated dried aerogel filings, adhered on conductive double-sided adhesive carbon tape, using a Jeol JSM 5600 SEM instrument, equipped with an Oxford ISIS 300 micro-analytical device with software ZAF correction quantitative analysis. Examination in the backscattered electron (BSE) mode permitted the localization of bright areas where tungsten was concentrated. The system was operating at 20 kV, 0.5 nA and 50 sec time of analysis.
Powder X-Ray Diffraction (PXRD) measurements were conducted using a Siemens D5005 instrument with Cu radiation operating at 40 kV and 40 mA, in the 2-theta range from 3 to 45°, step size 0.01° s−1 and evaluation was conducted using DIFRAC PLUS v2.2 software from Siemens.
The metal content of the X–M–alginate aerogels was determined by atomic emission spectroscopy (AES) employing a Varian SpectrAA 200 instrument (Varian, Mulgrave, Australia), following wet digestion of the beads with 65% Suprapur HNO3.
2.2. Synthesis of M–alginate aerogel beads
A solution of sodium alginate in H2O (2% w/w) was prepared by dissolving sodium alginate (2.00 g; G35 or G75) in H2O (98.00 g) at 25 °C. The solution was added dropwise, using a 25 mL-burette, to a 0.2 M solution of a metal salt (CaCl2, CoCl2·6H2O, Ni(NO3)2·6H2O or CuCl2·2H2O) under gentle magnetic stirring. Spherical hydrogel M–alginate beads were formed instantly and were left to age for 18 h. Afterwards, they were stepwise solvent-exchanged with acetonitrile/H2O mixtures (30, 60, 90% v/v), with dry acetonitrile (4×), with dry acetone (3×), and they were dried with SCF CO2 to produce the corresponding aerogels (referred to as native M–alginate or M–alg aerogel beads).2.3. Synthesis of crosslinked M–alginate aerogel beads
A solution of the triisocyanate in EA/MeCN was prepared by mixing Desmodur RE (60.0 mL, 16.52 g TIPM, 0.045 mol TIPM in EA) with dry MeCN (20 mL). The M–alginate hydrogel beads from Section 2.2 were solvent-exchanged with MeCN/H2O mixtures (30, 60, 90% v/v) and then with MeCN (4×). Afterwards, they were immersed in a solution of the triisocyanate (the volume of the solution was 4× the volume of the beads) and they were kept in that solution for 24 h, allowing the triisocyanate to diffuse into the wet-gel beads. Subsequently, the system was transferred into an oven at 70 °C for 72 h to accelerate the crosslinking reaction. After that time period, the crosslinked M–alginate wet-gel beads were solvent-exchanged with acetone (3×) and were dried with SCF CO2 to produce the corresponding crosslinked aerogels (referred to as X–M–alginate or X–M–alg aerogel beads).2.4. Pyrolysis of crosslinked M–alginate (X–M–alginate) aerogel beads
The X–M–alginate aerogel beads were transferred into an MTI GSL1600X-80 tube furnace (MTI Corporation, Richmond, CA, USA) (alumina 99.8% pure, 72/80 mm inner/outer diameters, 457 mm heating zone). The temperature was raised to 800 °C at 2.5 °C min−1 under flowing Ar (150 mL min−1) for 5 h. Afterwards, the temperature was returned to room temperature at 2.5 °C min−1 under constant flow of Ar (150 mL min−1). After pyrolysis the corresponding carbon aerogels were obtained (referred to as X–M–C aerogel beads).3. Results and discussion
3.1. Preparation of crosslinked M–alginate (X–M–alginate) aerogel beads
The M–alginate (M: Ca, Co, Ni, Cu) wet-gels of this study were crosslinked with TIPM (Desmodur RE), to provide materials with an aromatic polyurea (PUA) coating that is carbonizable.10 Crosslinking of the M–alginate beads with TIPM (Desmodur RE) was studied for both G35 and G75 sodium alginate gelled by Ca2+ ions, for G35 alginate gelled by Cu2+ ions, and for G75 alginate gelled by Co2+ and Ni2+ ions. Co- and Ni–alginate hydrogel beads derived from G35 alginate suffered severe shrinkage during solvent-exchange with MeCN, even though the solvent exchange from water to MeCN was gradual. Hence, the crosslinking of those samples with TIPM was not studied. On the other hand, the reaction of Cu-containing G75 alginate with TIPM was attempted, but purification of the crosslinked beads was not possible even after numerous washings. Therefore, those materials were not studied further.The synthetic protocol for the preparation of M–alginate (M: Ca, Co, Ni, Cu) hydrogel and aerogel beads is presented in Scheme 2. The M–alginate hydrogel beads were prepared by the dropwise addition of an aqueous sodium alginate solution into an aqueous metal salt solution. Gelation was observed immediately. More specifically, the mechanism of gelation is the same for all metals studied and involves immediate reaction of the sodium alginate containing water droplets with the metal ions in the aqueous receiving solution. This reaction forms a solid porous crust around the droplets, so the internal solution of those droplets does not get dispersed in the receiving solution. Gelation inside the solid droplets is completed as more metal ions diffuse in from the surrounding solution and coordinate to the carboxylate groups of the alginate that is dissolved within the droplets.47 This method of gelation, namely inducing phase separation by slow mixing of one phase with another, dates back to the 1930s and in fact was used for the preparation of aerogels by their inventor, Kistler himself.48 The beads were aged in the metal salt solution for 18 h, and then they were either processed to the corresponding native M–alginate aerogels, or they were crosslinked with Desmodur RE (TIPM; Scheme 1) to produce the corresponding crosslinked aerogels (X–M–alginate aerogels), according to well-established procedures.32,33 In brief, M–alginate wet-gel beads were first solvent-exchanged with acetonitrile, and then they were immersed in a solution of the triisocyanate for 24 h, so that the triisocyanate was diffused into the wet-gels. Next, they were kept in an oven at 70 °C for 72 h for the crosslinking reaction to be completed. Representative optical photographs of the X–M–alginate aerogel beads are shown in Scheme 2. Optical photographs, mean diameters and size distributions of the M–alginate and X–M–alginate aerogel beads are shown in Fig. S1 and S2 (ESI†). Native M–alginate aerogel beads were smaller than those of X–M–alginate aerogel beads due to higher shrinkage during the solvent exchange and SCF drying. This higher shrinkage is also reflected in the bulk densities of those materials (see Section 3.3 below).
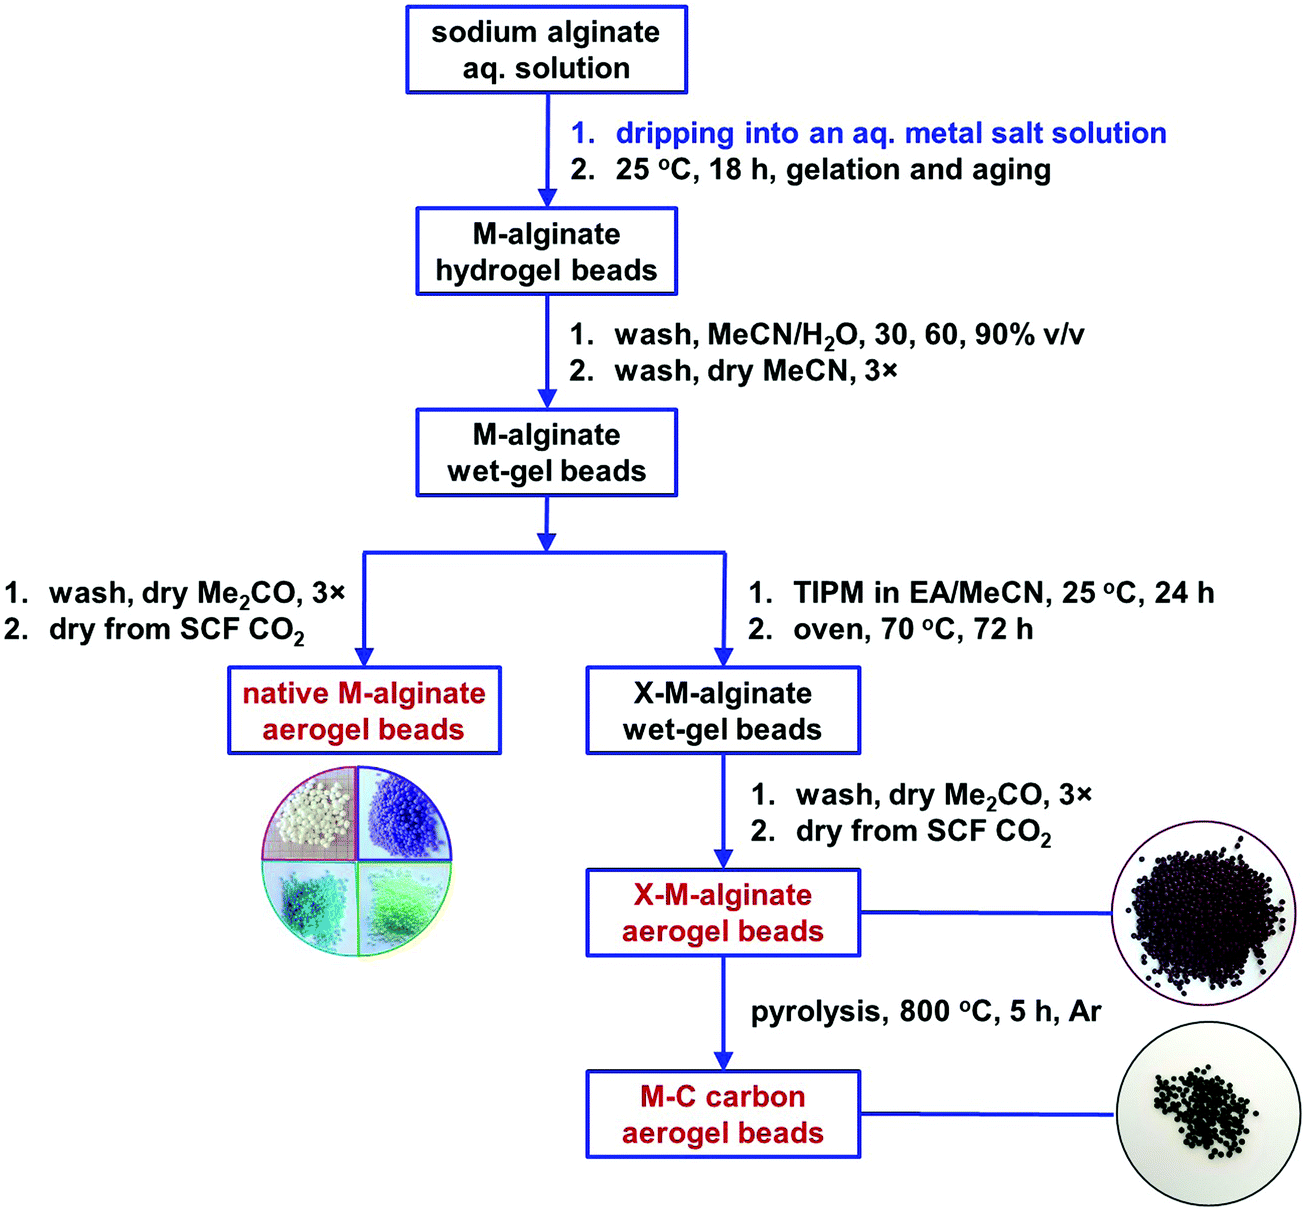 | ||
| Scheme 2 Synthesis of native (M–alginate), crosslinked (X–M–alginate) and carbon (X–M–C; M: Ca, Co, Ni, Cu) wet-gel and aerogel beads. | ||
The crosslinking reaction is shown in Scheme 3. As has recently been described in the literature,32,33 the triisocyanate is being “attached” to the alginate backbone through urethane linkages that are formed from the reaction of the –OH groups of the alginate with one of the –NCO groups of the triisocyanate. The remaining –NCO groups of the triisocyanate are hydrolyzed by water adsorbed on the surface of the alginate wet-gel network and form amines, which react with free triisocyanate in the pores and form urea groups. Hydrolysis of the new dangling –NCO groups continues, followed by reaction with new triisocyanate molecules, until the alginate network is coated with PUA. Some unreacted –NCO groups are detected (by ATR-FTIR presented in Section 3.2 below) in the X–M–alginate aerogels. Unreacted –NCO groups were not observed in X–Ca–alginate aerogels crosslinked with the aliphatic triisocyanate Desmodur N3300.32,33 That can be attributed to the relative flexibility of the two polymers: the one based on the flexible/aliphatic Desmodur N3300 (Scheme 1) vs. the one based on the rigid/aromatic Desmodur RE (TIPM; Scheme 1).
 | ||
| Scheme 3 The reaction of crosslinking M–alginate (M: Ca, Co, Ni, Cu) wet gels with an aromatic triisocyanate. | ||
3.2. Chemical characterization of crosslinked M–alginate (X–M–alginate) aerogel beads
Native M–alginate and X–M–alginate aerogels were chemically characterized by ATR-FTIR (Fig. 1), 13C CPMAS (Fig. 2), TGA (Fig. 3), atomic emission spectroscopy (Table 1) and EDX analyses (Fig. S3, ESI†). | ||
| Fig. 1 ATR-FTIR spectra of native (Ca–alg) and crosslinked (X–M–alg) aerogel beads (M: Ca, Co, Ni, Cu), as indicated. Dashed lines show the positions of the characteristic peaks for Ca–alg (light blue) and X–M–alg (dark blue) aerogels as discussed in the text. | ||
 | ||
| Fig. 2 13C CPMAS NMR spectra of native (Cu–alg) aerogel beads, of Desmodur RE-derived PUA, and of crosslinked (X–M–alg) aerogel beads (M: Ca, Co, Ni, Cu), as indicated. | ||
 | ||
| Fig. 3 Thermogravimetric analysis (TGA, under Ar) and differential thermogravimetric analysis (DTG) of native (M–alg – dotted lines) and crosslinked (X–M–alg – solid lines) aerogel beads (M: Ca, Co, Ni, Cu), as indicated. | ||
ATR-FTIR spectra of the X–M–alginate aerogels are shown in Fig. 1. A representative spectrum of a native M–alginate aerogel (of a Ca–alginate aerogel) is also shown for comparison. In agreement with the literature,32,33,49–51 the spectra of both native and X-alginate aerogels show the characteristic symmetric and asymmetric stretching vibrations of the carboxylate groups coordinated to Ca2+ ions around 1600 cm−1 and 1420 cm−1, respectively, and the corresponding stretching vibrations of the C–O–C groups on the sugar ring around 1080 cm−1 and 1030 cm−1. The spectra of the X–M–alginate aerogels, in addition to the above, show all of the characteristic peaks expected for PUA derived from Desmodur RE,10,52 that is the stretching vibration of the carbonyl of the urea group between 1660 and 1650 cm−1 (in some cases this appears as a shoulder), the scissoring vibration of the N–H group around 1530 cm−1, and the stretching vibrations of the aromatic double bonds at 1506 and 1410 cm−1. Small peaks around 2270 cm−1, assigned to the antisymmetric stretching vibration of the –NCO group, are seen in almost all cases, showing that some of the –NCO groups of the aromatic triisocyanate have not reacted.
The 13C CPMAS NMR spectra of the X–M–alginate aerogel beads are shown in Fig. 2 along with the spectra of native Cu–alginate and Desmodur RE-derived PUA for comparison purposes. The spectrum of the Cu–alginate aerogel beads is similar to the spectrum of the Ca–alginate aerogel beads,33 the only difference being the peak of the acetate carbonyls centered at 176 ppm, which is a doublet in the Cu–alginate spectrum. The peaks of the acetal carbons –C–O–![[C with combining low line]](https://www.rsc.org/images/entities/i_char_0043_0332.gif) –O– on the alginate rings and of the alginate ring carbons attached to oxygen (–OH or ether) appear at 100 and 72 ppm, respectively, as expected. The CPMAS NMR spectra of the Co–alginate and Ni–alginate aerogels could not be recorded because nuclear-spin relaxation was too fast to allow efficient cross polarization; the reason for the accelerated relaxation is in the closeness of the 1H and 13C nuclei to the paramagnetic centers of Co2+ and Ni2+ ions. The corresponding X–M–alginate aerogels showed analogous behavior during the solid-state NMR experiments. Although spectra could be recorded for all five X–M–alginate aerogels (M: Ca, Co, Ni, Cu), the spectra of X–Co–alginate and X–Ni–alginate aerogels do not show any of the characteristic peaks of the alginate backbone, but only the peaks of the aromatic PUA formed after the crosslinking reaction, which also predominate in the spectra of X–Ca–alginate and X–Cu–alginate. (Again, the signals of the backbone are missing because of the proximity of the corresponding 13C nuclei to the paramagnetic centers.) The peaks of the aromatic PUA appear at 154 ppm (urea –C
–O– on the alginate rings and of the alginate ring carbons attached to oxygen (–OH or ether) appear at 100 and 72 ppm, respectively, as expected. The CPMAS NMR spectra of the Co–alginate and Ni–alginate aerogels could not be recorded because nuclear-spin relaxation was too fast to allow efficient cross polarization; the reason for the accelerated relaxation is in the closeness of the 1H and 13C nuclei to the paramagnetic centers of Co2+ and Ni2+ ions. The corresponding X–M–alginate aerogels showed analogous behavior during the solid-state NMR experiments. Although spectra could be recorded for all five X–M–alginate aerogels (M: Ca, Co, Ni, Cu), the spectra of X–Co–alginate and X–Ni–alginate aerogels do not show any of the characteristic peaks of the alginate backbone, but only the peaks of the aromatic PUA formed after the crosslinking reaction, which also predominate in the spectra of X–Ca–alginate and X–Cu–alginate. (Again, the signals of the backbone are missing because of the proximity of the corresponding 13C nuclei to the paramagnetic centers.) The peaks of the aromatic PUA appear at 154 ppm (urea –C![[double bond, length as m-dash]](https://www.rsc.org/images/entities/char_e001.gif) O) 137, 129 and 118 ppm (aromatic carbons) and 55 ppm (–CH).10,52 Peaks corresponding to the urethane carbonyl (observed as a shoulder at 157 ppm in the spectra of X–Ca–alginate crosslinked with Desmodur N3300)32,33 are not visible, reflecting the fact that the amount of urethane groups is small, as those are only the links of PUA to the alginate framework. Peaks corresponding to the –NCO groups (an expected peak around 120 ppm) are not visible either, because of the small amount of unreacted –NCO groups and because of the overlap with the peak at 118 ppm.
O) 137, 129 and 118 ppm (aromatic carbons) and 55 ppm (–CH).10,52 Peaks corresponding to the urethane carbonyl (observed as a shoulder at 157 ppm in the spectra of X–Ca–alginate crosslinked with Desmodur N3300)32,33 are not visible, reflecting the fact that the amount of urethane groups is small, as those are only the links of PUA to the alginate framework. Peaks corresponding to the –NCO groups (an expected peak around 120 ppm) are not visible either, because of the small amount of unreacted –NCO groups and because of the overlap with the peak at 118 ppm.
Thermal characterization (Fig. 3) of the native M–alginate aerogels showed three pyrolysis regions: the first one is below 150 °C, the second one is between 150 °C and 500 °C, and the third one is above 500 °C. The first region can be attributed to loss of water. The second region, where the major weight loss was observed, is attributed to degradation of the polymer chain. The third region is where a slower degradation was observed, corresponding to the lowest weight loss. It has been reported in the literature that in this region (and maybe as early as at 300 °C) secondary pyrolytic reactions, such as tar cracking, char formation, and/or degradation of thermally robust inorganic components, may take place.53 The thermal stability and the decomposition of M–alginate aerogels of this study follow the general trends that have been reported in the literature for M–alginate materials, keeping in mind that the thermal stability of the alginate materials depends on both the alginate source (as alginates are natural materials), and on the metal cation.53–55 The thermal decomposition of X–M–alginate aerogels followed more or less the same trend, but they have a higher residue at 800 °C (around 30% for M: Ca and Co and around 40% for M: Ni and Cu), compared with the residue of native aerogels (in the range of 10 to 30%). That high residue for the X–M–alginate aerogels is due to the aromatic PUA and has been observed for all Desmodur RE-derived aerogels in the literature.10,13,46,52,56–58 Therefore, these materials are very good candidates for pyrolysis and conversion to the corresponding carbons (see Section 3.4 below).
To complete the chemical characterization of the new materials, atomic emission spectroscopy has been used to calculate the metal content of X–M–alginate aerogels. The results are presented in Table 1. The metal content was in the range of 1.8 to 7.1% w/w, with X–Co–alginate aerogels having the highest metal content per weight. It is also noted that the moles of M in 100 g of X–Ni–alginate and X–Cu–alginate aerogels were about the same (0.05–0.06 mol) while in X–Co–alginate the moles of Co were about double than the other two cases (0.12 mol). The Na residue (from sodium alginate) is lower than 0.1% in all aerogels. The very low Na residue is confirmed with EDX spectra (Fig. S3, ESI†), in which no Na peaks are observed. Table 1 also shows the PUA content, which has been calculated from the skeletal densities reported in Table 2 and which has been found to be in the range of 49–61% (Table 1).
| Samplea | M contentb (%) | PUA contentd (%) | |
|---|---|---|---|
| Mc | Na | ||
a The concentration of the sodium alginate solution was 2% w/w. The two different alginates used in this study are denoted in parentheses.
b
Metal content determined using atomic emission spectroscopy (AES).
c M: Ca, Co, Ni, Cu.
d PUA content calculated according to formula: %PUA (w/w) = [(ρs![[thin space (1/6-em)]](https://www.rsc.org/images/entities/char_2009.gif) PUA/ρsX–M–alginate) × (ρsnativeM–alginate − ρsX–M–alginate)/(ρsnativeM–alginate − ρsPUA)] × 100.32 Values for ρsnativeM–alginate and ρsX–M–alginate were taken from Table 2 and the value for ρsPUA was taken as being equal to 1.24 g cm−3 for Desmodur RE-derived PUA.10 PUA/ρsX–M–alginate) × (ρsnativeM–alginate − ρsX–M–alginate)/(ρsnativeM–alginate − ρsPUA)] × 100.32 Values for ρsnativeM–alginate and ρsX–M–alginate were taken from Table 2 and the value for ρsPUA was taken as being equal to 1.24 g cm−3 for Desmodur RE-derived PUA.10
|
|||
| X–Ca–alg (G35) | 2.0 | 0.05 | 61 |
| X–Ca–alg (G75) | 1.8 | 0.04 | 55 |
| X–Co–alg (G75) | 7.1 | 0.09 | 49 |
| X–Ni–alg (G75) | 3.6 | 0.06 | 61 |
| X–Cu–alg (G35) | 3.7 | 0.04 | 63 |
| Samplea | Bulk densityρb (g cm−3) | Skeletal density ρs (g cm−3) | PorositybΠ (% v/v) | BET surf. area σ (m2 g−1) [micropore surf. area]c | V Total (V1.7–300nm)e (cm3 g−1) | Av. pore diam.f (4VTotal/σ) (nm) | Particle radiusg (nm) |
|---|---|---|---|---|---|---|---|
| a The concentration of the sodium alginate solution was 2% w/w. The two different alginates used in this study are denoted in parentheses. b Porosity calculated according to the formula: (ρs − ρb)/ρs, where ρs: skeletal density and ρb: bulk density. c Micropore surface area via t-plot analysis, according to the Harkins and Jura model. d Total pore volume calculated according to the formula: 1/ρb − 1/ρs. e Cumulative volume of pores between 1.7 and 300 nm from N2-sorption data and the BJH desorption method. f Calculated using the 4V/σ method; V was set equal to the maximum volume of N2 adsorbed along the isotherm as P/Po → 1.0. For the number in parentheses, V was set equal to VTotal from the previous column. g Particle radius calculated using the formula: r = 3/(ρs × σ), where σ: BET surface area. For the number in parentheses, σ was set equal to the external surface area, σext, calculated from the BET surface area minus the micropore surface area. | |||||||
| Ca–alg (G35)33 | 0.072 ± 0.001 | 2.07 ± 0.02 | 97 | 304 [67] | 13 (0.5) | 7.9 (176) | 5.7 (6.1) |
| X–Ca–alg (G35) | 0.133 ± 0.001 | 1.468 ± 0.004 | 91 | 296 [20] | 6.8 (0.6) | 8.8 (92) | 6.9 (7.4) |
| Ca–alg (G75)33 | 0.148 ± 0.001 | 1.934 ± 0.006 | 92 | 542 [83] | 6.2 (4.9) | 36 (46) | 2.9 (3.4) |
| X–Ca–alg (G75) | 0.146 ± 0.001 | 1.477 ± 0.006 | 90 | 486 [25] | 6.2 (2.5) | 21 (51) | 4.2 (4.4) |
| Co–alg (G75) | 0.115 ± 0.001 | 1.90 ± 0.01 | 94 | 258 [47] | 8.2 (0.5) | 8.0 (127) | 6.1 (7.5) |
| X–Co–alg (G75) | 0.119 ± 0.009 | 1.508 ± 0.005 | 92 | 245 [10] | 7.7 (0.5) | 9.0 (126) | 8.1 (8.5) |
| Ni–alg (G75) | 0.172 ± 0.001 | 1.98 ± 0.01 | 91 | 393 [58] | 5.3 (1.2) | 13 (54) | 3.9 (4.5) |
| X–Ni–alg (G75) | 0.16 ± 0.01 | 1.449 ± 0.004 | 89 | 276 [27] | 5.6 (0.9) | 15 (81) | 7.5 (8.3) |
| Cu–alg (G35) | 0.10 ± 0.01 | 2.00 ± 0.03 | 95 | 408 [73] | 9.2 (1.6) | 16 (90) | 3.7 (4.5) |
| X–Cu–alg (G35) | 0.096 ± 0.007 | 1.44 ± 0.02 | 93 | 331 [22] | 9.7 (1.2) | 15 (118) | 6.3 (6.7) |
3.3. Material properties of crosslinked M–alginate (X–M–alginate) aerogel beads
All aerogels (native and crosslinked) were characterized with N2-sorption porosimetry, helium pycnometry and SEM. The selected material properties of all aerogels are summarized in Table 2. In general, the aerogels of this study have low bulk densities. Unlike the X–Ca–alginate aerogels studied before,32,33 of which the bulk density was always higher compared with the bulk density of the corresponding native aerogels, in the present study there is no clear trend. For example, X–Ni–alginate and X–Cu–alginate aerogel beads have almost the same bulk densities with the corresponding native aerogels. That finding can be explained because native aerogel beads exhibit higher shrinkage during solvent-exchange and SCF drying, and because of the rigid core of TIPM that provides more open structures. It can be further supported by the fact that X–Ca–alginate aerogel beads crosslinked with Desmodur N330033 have higher bulk densities compared with those crosslinked with Desmodur RE (0.157 g cm−3vs. 0.146 g cm−3 for G75-derived materials), although they were both prepared from sodium alginate solutions of the same concentration (2% w/w) and have the same PUA content (53% vs. 55%). Skeletal densities are consistently lower for X–M–alginate aerogel beads compared with the corresponding native aerogels.All aerogels are highly porous, with porosities up to 97% v/v for the native M–alginate aerogels and 94% v/v for X–M–alginate aerogels (Table 2). Although the porosities are compromised a little during crosslinking, they still remain very high. All aerogels are mostly macroporous materials (VTotal > V1.7–300nm), and all show some microporosity, although the portion of the surface area that is assigned to micropores is lower for the X–M–alginate aerogels compared with the corresponding native aerogels. The fact that the X–M–alginate aerogels have microporosity is attributed to the rigid aromatic core of TIPM: all aerogels that have been reported from TIPM (Desmodur RE), including polyurea,10,52 polyurethane,57 poly(urethane norbornene),56,58 poly(urethane acrylate),46,58 and polyamide13,14 aerogels, have small amounts of microporosity. On the other hand, X–Ca–alginate aerogels from Desmodur N3300 that have been reported previously32,33 were also macroporous materials and they had no microporosity. Finally, the plot of 1/ρbvs. VTotal is linear for both native M–alginate and X–M–alginate aerogels (Fig. S5, ESI†), which strongly suggests that there is no closed porosity.
The N2-sorption isotherms (Fig. S4, ESI†) have a small loop and do not reach saturation, also indicating macroporous materials with some mesoporosity. The Barrett–Joyner–Halenda (BJH) curves (Fig. S4, ESI†), for pores in the range of 1.7–300 nm, showed maxima in the range of 27–34 nm for native materials and in the range of 32–44 nm for crosslinked materials, together with broad distributions, as expected for networks formed after particle aggregation. BET surface areas (Table 2) were still high (245–486 m2 g−1), and were not much lower compared with the native aerogels (258–542 m2 g−1). The average pore sizes did not change significantly after crosslinking, either, while the size of the primary particles increased a little (from 2.9–6.1 nm to 4.2–8.1 nm). The above observations are consistent with PUA formation starting from the alginate network, coating the primary particles and extending in the secondary particles, but PUA did not fill the space within secondary particles completely.
SEM (Fig. 4) showed that all samples were fibrous. As has been observed before for X–Ca–alginate aerogels prepared using Desmodur N3300,32,33 PUA coated the alginate network conformally and the micromorphology remained the same. The fact that the primary particle radii, calculated from N2-sorption and skeletal density data (Table 2), were larger after crosslinking is a strong indication that the polymer growth on the skeletal network followed the contours of the network down to the primary particle level. SEM images of the surface of the beads revealed the presence of a thin skin with a denser fibrous morphology. Although much denser, the skin is still porous allowing gases to go through it into the interior of the beads, i.e., during N2-sorption porosimetry or He-pycnometry. An analogous observation has been made in PUA beads prepared from Desmodur N3300 and ethylenediamine,59 and X–Ca–alginate and X-chitosan beads from Desmodur N3300.33 In all cases the formation of the skin was attributed to the higher concentration of the gelation agent and/or catalyst on the surface of the droplet containing Desmodur N3300, which caused a fast reaction and the formation of a crust on the surface, while the diffusion of the gelation agent and/or catalyst inside the droplet established a concentration gradient, which caused a slower gelation of the interior. The fibrous structure formed for M–alginate hydrogels is retained in the native biopolymer aerogel,60 and later on in the X-biopolymer aerogel.32,33
 | ||
| Fig. 4 Representative SEM images of native (M–alg) and crosslinked (X–M–alg) aerogel beads (M: Ca, Co, Ni, Cu), as indicated. SEM images of native Ca–alginate beads have also been reported in ref. 33. | ||
3.4. Pyrolysis of crosslinked M–alginate (X–M–alginate) aerogel beads
The pyrolysis of X–M–alginate aerogels (M: Co, Ni, Cu) at 800 °C resulted in carbon aerogels (X–M–C) with yields in the 33–37% w/w range. X–M–C aerogels retained the spherical shape of their precursor (X–M–alginate) aerogels, although they were significantly smaller (diameters: 1.6–1.8 mm; Fig. S6, ESI†) compared with the X–M–alginate beads (diameters: 2.7–3.9 mm; Fig. S2, ESI†). Those carbons were doped with the corresponding metal, as shown by PXRD (Fig. 5 and Fig. S7–S9, ESI†), as a result of carbothermal reduction of the corresponding metal ions. In the case of the X–Cu–alginate aerogels, both metallic Cu and Cu2O were detected. The formation of Cu2O can be attributed to the well-known redox reaction of Cu2+ and sugars to form Cu2O.61 Using the Scherrer equation,62 the crystallite sizes were calculated at around 22 nm for all three metals. The broad peak at 13° was assigned to carbon with some stacking of graphene oxide sheets; the wider d-spacing compared with graphite was due to the presence of oxygen functionalities (O, OH, H2O).63,64 The metal content of the X–M–C aerogels was calculated from thermogravimetric analysis under O2 (Fig. S10, ESI†) and from skeletal density data.32,33 The results from the two methods are in good agreement (Table 3). Co in X–Co–C is almost twice as high as Ni or Cu in the corresponding carbon aerogels, reflecting the relative amounts of metal in the parent X–M–alginate aerogels (Table 1).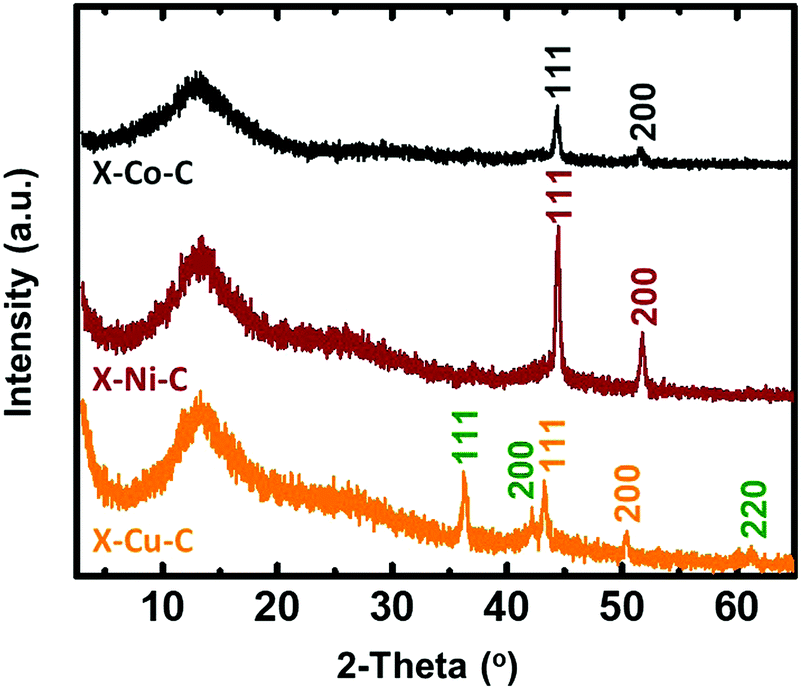 | ||
| Fig. 5 PXRD patterns of carbon (X–M–C; M: Co, Ni, Cu) aerogel beads. Planes shown on the spectra correspond to the metals Co (gray), Ni (wine red), Cu (orange) and to the oxide Cu2O (green). | ||
| Samplea | M (%) from TGA under O2b | M (%) from skeletal density datac |
|---|---|---|
|
a Carbon aerogel beads (X–M–C) derived from the pyrolysis of the corresponding X–M–alginate (M: Co, Ni, Cu) aerogel beads at 800 °C under Ar for 5 h.
b Metal (M) content calculated from thermogravimetric analysis data under O2 (Fig. S10, ESI). The residue at 800 °C was attributed to the corresponding oxides (Co3O4, NiO and CuO) and the metal was calculated.
c Metal (M) content calculated according to the formula: [(ρsM/ρsX–M–C) × (ρscarbon − ρsX–M–C)/(ρscarbon − ρsM)] × 100.32 Values for ρsX–M–C were taken from Table 6 below, and the values for ρscarbon (2 g cm−3) and ρsM (8.900 g cm−3 for Co, 8.908 g cm−3 for Ni, 8.96 g cm−3 for Cu and 6 g cm−3 for Cu2O) were taken from the literature.
d Both Cu and Cu2O are formed during the pyrolysis of X–Cu–alg (as shown by the PXRD data; Fig. 5).
|
||
| X–Co–C | 22 | 28 |
| X–Ni–C | 17 | 15 |
| X–Cu–C | 12 | 19 d |
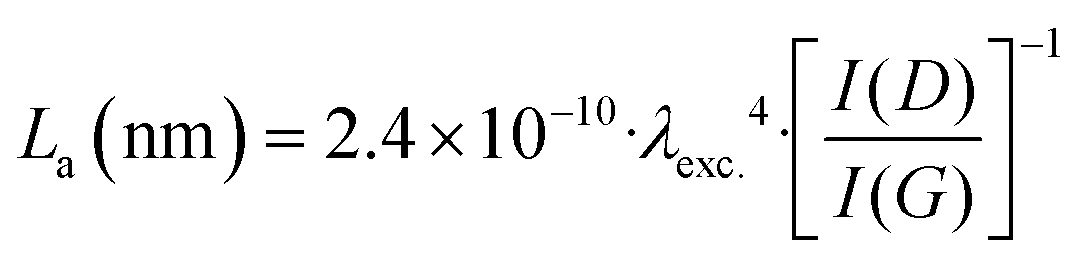
The Raman spectra of the X–M–C aerogels (Fig. 6 left) exhibited D bands (breathing mode) located around 1355 cm−1 and G bands (stretching mode) located around 1580 cm−1 (Fig. S11, ESI†). The corresponding values for the carbon aerogels obtained from Desmodur RE-derived PUA were at 1352 cm−1 (D) and 1597 cm−1 (G).10 The high overlap of these two bands, and especially the width of the D band, indicate a high degree of disorder, apparent also from the I(D)/I(G) ratio (Fig. S11, ESI†), which is higher than 1.1 in all cases, indicating also a low degree of graphitization and a large number of defects.27 Among the three metals studied (Co, Ni, Cu), Co showed the highest degree of graphitization. In addition, the broad low-intensity bump observed in the second-order band regime (around 2800 cm−1) suggests the presence of a higher-ordered structure.27 The crystallite size (La) of the graphitic domains of X–M–C was calculated using eqn (1),65 and it was found to be 14–15 nm for all three aerogels.
 | (1) |
 | ||
| Fig. 6 Representative Raman spectra (left) and ATR-FTIR spectra (right) of carbon (X–M–C; M: Co, Ni, Cu) aerogel beads, as indicated. Dashed lines show the position of the characteristic peaks discussed in the text. | ||
XPS surface analysis detected C, O, N and the respective metals (M: Co, Ni, Cu) in all X–M–C aerogels (Fig. 7 and Fig. S12, in agreement with the EDX data shown in Fig. S13, ESI†). Mg (unknown contaminant) was also detected in one case (<1%). Table 4 shows the atomic concentration (%) of the above elements, as derived from C1s, O1s, N1s, M2p, Mg2p. The C/O and C/N ratios were not very different for the three samples; the C/O ratio increased slightly in the order X–Cu–C > X–Ni–C > X–Co–C. The C/M ratio increased in the reverse order. Table 5 summarizes the percent atomic allocation of carbon, oxygen and nitrogen to the various groups. The C1s peaks (Fig. 7D–F) are comprised of five components, namely the sp2 and sp3 components located at 284.5–284.6 eV and 285.4–285.5 eV, respectively, the C–(O,N) component at 286.8–286.9 eV, the CO carbonyl component at 287.8–288.3 eV66,67 and also the π–π* satellite at 290.6–290.8 eV.68 The deconvoluted O1s peaks (Fig. 7G–I) show the presence of the following groups in all three carbon aerogels: (a) metal(II) oxide (MIIO) at 529.8–530.2 eV,69 (b) O−70,71 or O atoms at defect sites23 or HO− or M(OH)269 at 531.0–531.6 eV, (c) carbonyl oxygen (CO) at 532.2–532.6 eV,72,73 and (d) epoxide (C–O–C)72,73 or pyrylium (C–O+C)74 oxygen at 533.3–533.8 eV. Based on control experiments with authentic samples, the peak at 533.1–534.3 eV in the carbon aerogels derived from phenolic polymers has been assigned to heteroaromatic pyrylium oxygen and the peak at 530.9–531.6 eV to O−,8,75 thus accounting for charge compensation. In addition to the above, Fig. 7I shows one more contribution at 530.5 eV for the oxygen of Cu2O,69 which has also been detected with PXRD (Fig. 5). The deconvoluted N1s photoemission peaks (Fig. 7J–L) show the presence of only two nitrogen groups: pyridinic nitrogen at 398.2–398.5 eV and graphitic nitrogen at 400.8–400.9 eV.76 Graphitic and pyridinic N are considered as active sites for the oxygen reduction reaction (ORR), while other N species (e.g., pyrrolic N) have a disputable role in the ORR.21 Therefore, it is considered positive that X–M–C aerogels show only graphitic and pyridinic N, as opposed to most alginate-derived carbons from the literature. The deconvoluted 2p3/2 photoemission peaks of Co, Ni and Cu are shown in Fig. S12 (ESI†). They all show that the metal can be found in the 2+ oxidation state, as the corresponding oxides or hydroxides.69 Cobalt was found as CoO (peak at 780.6 eV and satellite peak at 786.9 eV) or Co(OH)2 (783.3 eV). Nickel was also found as NiO (854.2 eV) or Ni(OH)2 (855.9 eV). The latter peak could also be attributed to a component of NiO, which is due to multiplet splitting. The strong satellite of Ni2p3/2 located at 861.8 eV is due to contributions arising from both NiO and Ni(OH)2. Copper was found in both the +1 and the +2 oxidation states. The peaks at 932.4 eV and 933.4 eV were attributed to Cu2O and CuO, respectively, and the peak at 934.7 eV to Cu(OH)2. The two satellites located at 941.3 eV and 944.2 eV are typical of Cu2+. It should be noted that no crystalline phase wherein the metal was in its +2 oxidation state was observed by PXRD in any of the X–M–C aerogels (refer to Fig. 5). The formation of those species could be attributed to post-pyrolysis reactions of the metals on the surface of the material with air,21 thus also explaining the absence of XPS peaks due to metallic Co, Ni or Cu.
 | ||
| Fig. 7 (A–C) Survey scans of carbon (X–M–C; M: Co, Ni, Cu) aerogel beads, as indicated. Photoemission peaks attributed to the substrate (In) are noted in red. (D–L) Deconvoluted C1s (D–F), O1s (G–I) and N1s (J–L) XP spectra of carbon (X–M–C; M: Co, Ni, Cu) aerogel beads, as indicated. Experimental points are shown with black circles, cumulative fit plots with black solid lines and the Shirley baseline with dashed black lines. Peak maxima (eV) are provided within the frames. | ||
| Sample | C | O | N | M | Mg | C/O | C/N | C/M |
|---|---|---|---|---|---|---|---|---|
| X–Co–C | 86.68 | 8.51 | 3.20 | 1.61 | — | 10.19 | 27.09 | 53.84 |
| X–Ni–C | 87.30 | 6.70 | 2.92 | 2.19 | 0.89 | 13.03 | 29.90 | 39.86 |
| X–Cu–C | 87.21 | 5.61 | 3.72 | 3.46 | — | 15.55 | 23.44 | 25.21 |
| Peak max. (eV) | X–Co–C | X–Ni–C | X–Cu–C | |
|---|---|---|---|---|
| C1s | ||||
| sp2 C | 284.5–284.6 | 47.70 | 39.84 | 45.00 |
| sp3 C | 285.4–285.5 | 24.06 | 21.18 | 23.18 |
| sp2/sp3 | 1.98 | 1.88 | 1.94 | |
| C–(O,N) | 286.8–286.9 | 8.31 | 20.07 | 13.71 |
| CO |
287.8–288.3 | 13.04 | 11.29 | 10.07 |
| π → π* | 290.6–290.8 | 7.97 | 7.62 | 8.03 |
| O1s | ||||
| MIIO | 529.8–530.2 | 21.11 | 7.62 | 8.99 |
| Cu2O | 530.5 | 27.83 | ||
| O− or O or HO− | 531.0–531.6 | 35.08 | 31.21 | 22.22 |
| CO |
532.2–532.6 | 33.22 | 26.21 | 17.31 |
| C–O–C or C–O+C |
533.3–533.8 | 10.59 | 34.96 | 23.65 |
| N1s | ||||
| Pyridinic N | 398.2–398.5 | 27.97 | 39.39 | 34.00 |
| Graphitic N | 400.8–400.9 | 72.03 | 60.61 | 66.00 |
| Graphitic/pyridinic | 2.58 | 1.54 | 1.94 | |
| Samplea | Yield of pyrolysis (%) | Bulk density ρb (g cm−3) | Skeletal density ρs (g cm−3) | PorositybΠ (% v/v) | BET surf. area σ (m2 g−1) [micropore surf. area]c | V Total (V1.7–300nm)e (cm3 g−1) | Av. pore diam.f (4VTotal/σ) (nm) | Particle radiusg (nm) |
|---|---|---|---|---|---|---|---|---|
| a Carbon (X–M–C) aerogel beads derived from the pyrolysis of the corresponding X–M–alginate (M: Ca, Co, Ni, Cu) aerogel beads at 800 °C under Ar for 5 h. b Porosity calculated according to the formula: (ρs − ρb)/ρs, where ρs: skeletal density and ρb: bulk density. c Micropore surface area via t-plot analysis, according to the Harkins and Jura model. d Total pore volume calculated according to the formula: 1/ρb − 1/ρs. e Cumulative volume of pores between 1.7 and 300 nm from N2-sorption data and the BJH desorption method. f Calculated using the 4V/σ method; V was set equal to the maximum volume of N2 adsorbed along the isotherm as P/Po → 1.0. For the number in parentheses, V was set equal to VTotal from the previous column. g Particle radius calculated using the formula: r = 3/(ρs × σ), where σ: BET surface area. For the number in parentheses, σ was set equal to the external surface area, σext, calculated from the BET surface area minus the micropore surface area. | ||||||||
| X–Ca–C | 23 | 0.76 ± 0.06 | 1.119 ± 0.002 | 32 | <10 | — | — | — |
| X–Co–C | 33 | 0.23 ± 0.02 | 2.58 ± 0.04 | 91 | 426 [208] | 3.8 (0.6) | 12 (38) | 2.7 (5.3) |
| X–Ni–C | 34 | 0.32 ± 0.07 | 2.26 ± 0.01 | 86 | 460 [301] | 2.7 (0.8) | 8.0 (23) | 2.9 (8.3) |
| X–Cu–C | 37 | 0.25 ± 0.02 | 2.35 ± 0.02 | 89 | 541 [319] | 3.6 (1.1) | 9.0 (26) | 2.4 (5.8) |
In agreement with XPS data, the FTIR spectra of the X–M–C aerogels (Fig. 6 right) showed peaks around 3430 cm−1 (O–H stretching), 1725 cm−1 (CO stretching), 1627 cm−1 (CC or CN or adsorbed water), 1540 cm−1 (C–C(O) stretching of pyrylium),74,77 1115 cm−1 (C–O stretching) and 798 cm−1 (C–N heterocycle stretching).78 The low intensity of the CO stretching peak indicates only a minor contribution from carbonyl groups.
 | ||
| Fig. 8 Left: CO2-sorption diagrams of carbon (X–M–C; M: Co, Ni, Cu) aerogel beads, as indicated. Right: Pore size distribution calculated from CO2 adsorption data using the DFT method. | ||
Selected material properties of the X–M–C aerogels (M: Co, Ni, Cu) are summarized in Table 6. The same properties of X–Ca–C are included in Table 6 for comparison; however, this carbon material did not show any BET surface area, and it was not pursued further. That was attributed to the Ca2+ ions, which cannot be reduced carbothermally, and was considered as a first indication that the metal has a profound effect on the formation of the carbon material, which is further discussed below. Bulk densities were higher than those of the corresponding X–M-aerogels, despite the mass loss, reflecting the large shrinkage of those materials during pyrolysis. Skeletal densities are all higher than 2 g cm−3. The values of bulk and skeletal densities were not very much different for the three different aerogels; therefore, the porosities were also very similar (92% v/v for X–Co–C and X–Cu–C and 88% v/v for X–Ni–C).
The evaluation of open porosity (accessible from outside) was conducted by comparing VTotal (the total pore volume) with V1.7–300nm (the total volume of N2 adsorbed during N2-sorption porosimetry as P/Po → 1.0; Table 6). The VTotal values are significantly higher than V1.7–300nm, showing that the materials are mostly macroporous, in agreement with the shape of N2-sorption plots (Fig. S14, ESI†). As observed for both native M–alginate and X–M–alginate aerogels, the plot of 1/ρbvs. VTotal was linear (Fig. S5, ESI†), indicating that the X–M–C aerogels had no closed porosity. Pore size distributions by the BJH method (Fig. S14, ESI†), for pores in the range of 1.7–300 nm, showed maxima around 45 nm for X–Co–C and X–Ni–C and at 34 nm for X–Cu–C.
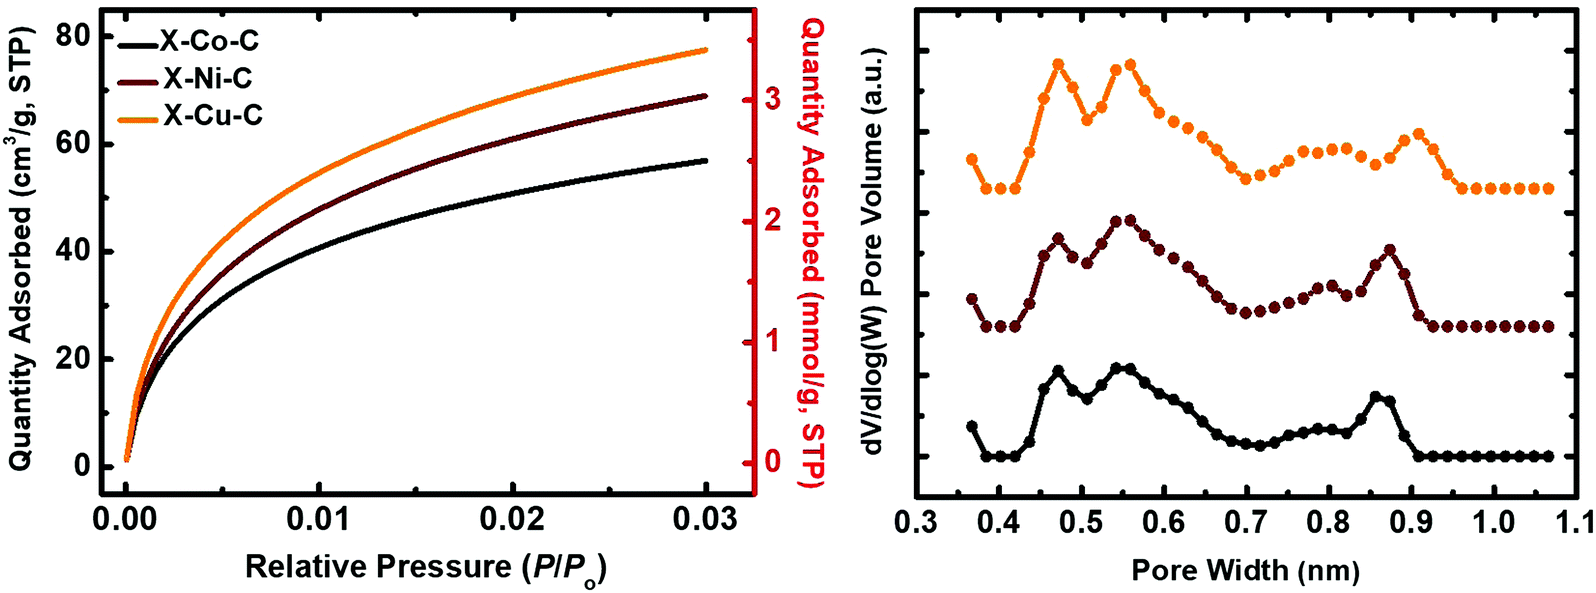
The BET surface areas of the X–M–C aerogels were significantly higher than those of their parent aerogels (by a factor of 1.7). More importantly, the micropore surface areas were increased significantly and are now in the range of 49 to 65% of the total BET surface area. Microporosity was probed with CO2 adsorption porosimetry up to 1 bar at 0 °C (Fig. 8). The amount of CO2 adsorbed was similar for X–Cu–C (3.5 mmol g−1) and X–Ni–C (3.1 mmol g−1), and lower for X–Co–C (2.5 mmol g−1). Pore size distributions (for pores smaller than <1 nm) were calculated from the CO2-adsorption isotherms using the DFT method (Fig. 8).79 The three DFT plots were almost identical, with micropores distributed in the range of 0.4–1.0 nm. To check whether or not the materials include micropores larger than 1 nm (that cannot be accounted for by the DFT method), the Dubinin–Radushkevich (DR) method was employed, which has been developed based on volume-filling of microporous carbons, by recognizing the fact that micropores are of the same order of magnitude as the adsorbate itself.79 DR plots are shown in Fig. S15 (ESI†). The specific pore volumes calculated from the DR method were higher than those from the DFT method (Table 7), indicating the presence of small pores larger than 1 nm. Average pore diameters derived from the DR method (Table 7) indicate that most of those pores could not be classified as large micropores (e.g., in the range of 1–2 nm), but rather as small mesopores.
| Samplea | Specific micropore volume (cm3 g−1) | Av. pore diam.b (nm) | CO2 uptake (mmol g−1) | |||
|---|---|---|---|---|---|---|
| DFT method | DR method | DR method | Measured | From BET surf. areac | From micropore surf. aread | |
| a Carbon (X–M–C) aerogel beads derived from the pyrolysis of the corresponding X–M–alginate (M: Co, Ni, Cu) aerogel beads at 800 °C under Ar for 5 h. b Calculated using the 4V/σ′ method; V was set equal to the micropore volume calculated from the Dubinin–Radushkevich (DR) method and σ′ was set equal to the micropore surface area (Table 3). c Calculated by dividing the BET surface area over the area occupied by each CO2 molecule (0.17 nm2), over the Avogadro number. d Calculated by dividing the micropore surface area over the area occupied by each CO2 molecule (0.17 nm2), over the Avogadro number. | ||||||
| X–Co–C | 0.10 | 0.17 | 3.3 | 2.5 | 4.2 | 2.0 |
| X–Ni–C | 0.11 | 0.22 | 2.9 | 3.1 | 4.5 | 2.9 |
| X–Cu–C | 0.13 | 0.24 | 3.0 | 3.5 | 5.3 | 3.1 |
Experimental CO2 uptake is presented in Table 7, and is compared with the theoretical uptake values calculated for: (a) monolayer coverage of the entire BET surface area with CO2 (0.17 nm2 per molecule)79 and (b) monolayer coverage of the micropore surface area only. By comparison, it is obvious that the experimental uptake correlates very well with the monolayer coverage of the micropore surface area, showing that CO2 is adsorbed only in the micropores. The CO2 uptake of all three carbon aerogels is very similar (2.5–3.5 mmol g−1) and is comparable to that of carbon aerogels obtained from the pyrolysis of polyamide (3.07 mmol g−1)13 or poly(urethane acrylate) (2.50 mmol g−1)46 aerogels prepared using Desmodur RE.
SEM images of X–M–C aerogels (Fig. 9) showed that the three different aerogels did not have the same morphology, unlike native M–alginate and X–M–alginate aerogels that all had the same morphology (Fig. 4), as discussed above. The metals affect the nanostructure of the corresponding carbons. The morphologies of X–Co–C and X–Ni–C are very similar, while the morphology of X–Cu–C is quite different. This property is interesting and will be further investigated. The morphology of X–Ca–C is completely different (Fig. S16, ESI† left). It is featureless and one can also see large chunks of calcium species (CaO or Ca(OH)2). After treatment with an aqueous HCl solution and removal of the calcium species, the morphology of the remaining carbon resembles the morphology of the X–Cu–C aerogel, although the fibers were thicker (Fig. S16, ESI† right). This also supports the finding that the metal ion clearly affects the carbonization process and the resulting materials.
 | ||
| Fig. 9 Representative SEM images of carbon (X–M–C; M: Co, Ni, Cu) aerogel beads, as indicated. | ||
4. Conclusions
We have prepared polyurea-crosslinked alginate aerogels (X–M–alginate; M: Ca, Co, Ni, Cu) and the corresponding carbon aerogels (X–M–C; M: Co, Ni, Cu). The X–M–alginate aerogels were prepared via reaction of an aromatic triisocyanate (Desmodur RE) with both the –OH groups on the surface of pre-formed M–alginate wet gels, forming urethane groups, and with water adsorbed on the inner surface of the wet gels, leading to the formation and accumulation of a nanometer-thick conformal polyurea (PUA) coating over the skeletal framework of the biopolymer aerogel. The X–M–alginate aerogels consisted of 49–63% PUA and their metal content was in the range of 2–7%. Microscopically, all the X–M–alginate aerogels were fibrous, just like the corresponding native M–alginate aerogels, and were practically identical to each other with porosities up to 94% v/v, including macropores, mesopores and micropores, and BET surface areas in the range of 245–486 m2 g−1, which is roughly the same with that of the native alginate aerogels (258–542 m2 g−1). Pyrolysis of the X–M–alginate aerogels (M: Co, Ni, Cu) at 800 °C yielded carbon aerogels (X–M–C; 33–37% w/w yield). These X–M–C aerogels retained the spherical shape of their parent X–M–alginate aerogel beads, although they were significantly smaller (diameters: 1.6–1.8 mm) compared with the X–M–alginate beads (diameters: 2.7–3.9 mm). Those carbon aerogels were doped with the corresponding metal, as a result of carbothermal reduction of the corresponding metal ions. In the case of X–Cu–alginate aerogels, both metallic Cu and Cu2O were detected. The crystallite sizes were calculated from XRD data at around 22 nm for all three metals. X–M–C aerogels were porous (88–92% v/v), containing macropores, mesopores and micropores, with BET surface areas in the range of 426–541 m2 g−1, and micropore surface areas in the range of 208–319 m2 g−1. The SEM data showed that the three carbon aerogels were fibrous, yet did not have the same morphology (the morphologies of X–Co–C and X–Ni–C were very similar, whereas the morphology of X–Cu–C was different), showing a structure-directing effect of the metal on the nanostructure of the corresponding carbons. PXRD, XPS, Raman and FTIR data showed the presence of oxygen and nitrogen functionalities, in addition to metals. The X–M–C aerogels consisted of carbon with some stacking of graphene oxide sheets (14–15 nm), and also a low degree of graphitization and a large number of defects. This work provides a direct method for the preparation of fibrous metal-, oxygen- and nitrogen-doped carbon aerogels in the form of beads, or any other desirable macroscopic shape, from inexpensive biopolymer aerogels. These carbon aerogels have the potential for catalytic and electrochemical applications that will be explored in the future along with optimization of the material properties relevant to the specific application.Author contributions
Conceptualization, methodology, project administration and writing (PP), investigation, validation, review and editing (GR, MP, DC, EE, TČ, NS, GM, TI, PG, IS, PP), funding acquisition and resources (GM, TI, PG, IS, PP).Conflicts of interest
There are no conflicts to declare.Acknowledgements
Work carried out in the frame of the COST-Action “Advanced Engineering and Research of aeroGels for Environment and Life Sciences” (AERoGELS, ref. CA18125) funded by the European Commission. This project has received funding from the European Union's Horizon 2020 research and innovation programme under Grant Agreement No. 685648. This publication reflects the views only of the authors, and the Commission cannot be held responsible for any use, which may be made of the information contained therein. We also thank the General Secretariat for Research and Technology, Greece, and the Special Account of Research Grants of the National and Kapodistrian University of Athens for partial support. PP and MP acknowledge the CERIC-ERIC (proposal number 20187018) for access to experimental facilities and financial support. NS and TI acknowledge support by the project “Materials and Processes for Energy and Environment Applications” (MIS 5002556), which was implemented under the “Action for the Strategic Development on the Research and Technological Sector”, funded by the Operational Program “Competitiveness, Entrepreneurship and Innovation” (NSRF 2014–2020) and co-financed by Greece and the European Union (European Regional Development Fund). We thank Dr Vassilis Vamvakas and Ms Maria-Christina Skoulikidou (Nanotechnology and Microsystems Laboratory (NML), Institute of Nanoscience and Nanotechnology, NCSR ‘Demokritos’, Athens, Greece) for the SEM characterization, Prof. Ariadne Argyraki, Dr Zacharenia Kypritidou and Mr Vassilis Skounakis (Department of Geology and Geosciences, NKUA, Athens, Greece) for the EDX and PXRD spectra, Dr Aikaterini Sakellari and Dr Sotirios Karavoltsos (Department of Chemistry, NKUA, Athens, Greece) for the AES data, and Prof. Eleni Efthimiadou (Department of Chemistry, NKUA, Athens, Greece) for the ATR-FTIR spectra. Finally, we are grateful to Covestro AG for kindly providing samples of Desmodur RE.References
- S. S. Kistler, Nature, 1931, 127, 741 CrossRef CAS.
- N. Leventis, A. Sadekar, N. Chandrasekaran and C. Sotiriou-Leventis, Chem. Mater., 2010, 22, 2790–2803 CrossRef CAS.
- J. P. Vareda, A. Lamy-Mendes and L. Durães, Microporous Mesoporous Mater., 2018, 258, 211–216 CrossRef CAS.
- M. A. Aegerter, N. Leventis and M. M. Koebel, Aerogels Handbook, Springer Science & Business Media, 2011 Search PubMed.
- C. J. Stepanian, G. L. Gould and R. Begag, US Pat., US7078359 B2, 2006.
- A. Arenillas, J. A. Menéndez, G. Reichenauer, A. Celzard, V. Fierro, F. J. Maldonado Hodar, E. Bailon-Garcia and N. Job, Properties of Carbon Aerogels and Their Organic Precursors, in Organic and Carbon Gels: From Laboratory Synthesis to Applications, ed. M. A. Aegerter and M. Prassas, Springer International Publishing, Cham, 2019, pp. 87–121 Search PubMed.
- R. W. Pekala, C. T. Alviso, F. M. Kong and S. S. Hulsey, J. Non-Cryst. Solids, 1992, 145, 90–98 CrossRef CAS.
- H. M. Far, S. Donthula, T. Taghvaee, A. M. Saeed, Z. Garr, C. Sotiriou-Leventis and N. Leventis, RSC Adv., 2017, 7, 51104–51120 RSC.
- S. Mahadik-Khanolkar, S. Donthula, C. Sotiriou-Leventis and N. Leventis, Chem. Mater., 2014, 26, 1303–1317 CrossRef CAS.
- N. Leventis, C. Sotiriou-Leventis, N. Chandrasekaran, S. Mulik, Z. J. Larimore, H. Lu, G. Churu and J. T. Mang, Chem. Mater., 2010, 22, 6692–6710 CrossRef CAS.
- W. Rhine, J. Wang and R. Begag, US Pat., US7074880B2, 2006.
- C. Chidambareswarapattar, Z. Larimore, C. Sotiriou-Leventis, J. T. Mang and N. Leventis, J. Mater. Chem., 2010, 20, 9666 RSC.
- A. M. Saeed, P. M. Rewatkar, H. Majedi Far, T. Taghvaee, S. Donthula, C. Mandal, C. Sotiriou-Leventis and N. Leventis, ACS Appl. Mater. Interfaces, 2017, 9, 13520–13536 CrossRef CAS PubMed.
- A. M. Saeed, C. A. Wisner, S. Donthula, H. Majedi Far, C. Sotiriou-Leventis and N. Leventis, Chem. Mater., 2016, 28, 4867–4877 CrossRef CAS.
- A. G. Sadekar, S. S. Mahadik, A. N. Bang, Z. J. Larimore, C. A. Wisner, M. F. Bertino, A. K. Kalkan, J. T. Mang, C. Sotiriou-Leventis and N. Leventis, Chem. Mater., 2012, 24, 26–47 CrossRef CAS.
- Z. Zhai, B. Ren, Y. Xu and Z. Liu, IOP Conf. Ser. Mater. Sci. Eng., 2019, 592, 012077 CrossRef CAS.
- Y. Liu, J. Chen, Z. Liu, H. Xu, Z. Shi, Q. Yang, G.-H. Hu and C. Xiong, J. Colloid Interface Sci., 2020, 576, 119–126 CrossRef CAS.
- W. Niu, Z. Xiao, S. Wang, S. Zhai, L. Qin, Z. Zhao and Q. An, J. Alloys Compd., 2021, 853, 157123 CrossRef CAS.
- L. Liu, X. Yang, C. Lv, A. Zhu, X. Zhu, S. Guo, C. Chen and D. Yang, ACS Appl. Mater. Interfaces, 2016, 8, 7047–7053 CrossRef CAS PubMed.
- H.-B. Zhao, J.-B. Cheng and Y.-Z. Wang, J. Alloys Compd., 2018, 736, 71–79 CrossRef CAS.
- J. Shu, Q. Niu, N. Wang, J. Nie and G. Ma, Appl. Surf. Sci., 2019, 485, 520–528 CrossRef CAS.
- L. Liu, X. Xu, Y. Li, R. Su, Q. Li, W. Zhou, B. Gao and Q. Yue, Chem. Eng. J., 2020, 382, 122780 CrossRef CAS.
- Z. Zhai, B. Ren, Y. Xu, S. Wang, L. Zhang and Z. Liu, Org. Electron., 2019, 70, 246–251 CrossRef CAS.
- W. Chen, M. Luo, K. Yang and X. Zhou, Int. J. Biol. Macromol., 2020, 158, 265–274 CrossRef CAS.
- Y. Hu, X. Tong, H. Zhuo, L. Zhong, X. Peng, S. Wang and R. Sun, RSC Adv., 2016, 6, 15788–15795 RSC.
- P. Hao, Z. Zhao, Y. Leng, J. Tian, Y. Sang, R. I. Boughton, C. P. Wong, H. Liu and B. Yang, Nano Energy, 2015, 15, 9–23 CrossRef CAS.
- X. Liu, I. S. Amiinu, S. Liu, K. Cheng and S. Mu, Nanoscale, 2016, 8, 13311–13320 RSC.
- M. A. Worsley, S. O. Kucheyev, J. H. Satcher, A. V. Hamza and T. F. Baumann, Appl. Phys. Lett., 2009, 94, 073115 CrossRef.
- M. A. Worsley, P. J. Pauzauskie, T. Y. Olson, J. Biener, J. H. Satcher and T. F. Baumann, J. Am. Chem. Soc., 2010, 132, 14067–14069 CrossRef CAS PubMed.
- J. Liang, Z. Cai, L. Li, L. Guo and J. Geng, RSC Adv., 2014, 4, 4843–4847 RSC.
- Q. Luo, H. Zheng, Y. Hu, H. Zhuo, Z. Chen, X. Peng and L. Zhong, Ind. Eng. Chem. Res., 2019, 58, 17768–17775 CrossRef CAS.
- P. Paraskevopoulou, I. Smirnova, T. Athamneh, M. Papastergiou, D. Chriti, G. Mali, T. Čendak, M. Chatzichristidi, G. Raptopoulos and P. Gurikov, ACS Appl. Polym. Mater., 2020, 2, 1974–1988 CrossRef CAS.
- P. Paraskevopoulou, I. Smirnova, T. Athamneh, M. Papastergiou, D. Chriti, G. Mali, T. Čendak, G. Raptopoulos and P. Gurikov, RSC Adv., 2020, 10, 40843 RSC.
- N. Leventis, Acc. Chem. Res., 2007, 40, 874–884 CrossRef CAS PubMed.
- N. Leventis, C. Sotiriou-Leventis, G. Zhang and A.-M. M. Rawashdeh, Nano Lett., 2002, 2, 957–960 CrossRef CAS.
- G. Zhang, A. Dass, A.-M. M. Rawashdeh, J. Thomas, J. A. Counsil, C. Sotiriou-Leventis, E. F. Fabrizio, F. Ilhan, P. Vassilaras, D. A. Scheiman, L. McCorkle, A. Palczer, J. C. Johnston, M. A. Meador and N. Leventis, J. Non-Cryst. Solids, 2004, 350, 152–164 CrossRef CAS.
- C. Mandal, S. Donthula, H. M. Far, A. M. Saeed, C. Sotiriou-Leventis and N. Leventis, J. Sol-Gel Sci. Technol., 2019, 92, 84–100 CrossRef CAS.
- N. Leventis, N. Chandrasekaran, A. G. Sadekar, C. Sotiriou-Leventis and H. Lu, J. Am. Chem. Soc., 2009, 131, 4576–4577 CrossRef CAS PubMed.
- N. Leventis, P. Vassilaras, E. F. Fabrizio and A. Dass, J. Mater. Chem., 2007, 17, 1502–1508 RSC.
- P. M. Rewatkar, R. U. Soni, C. Sotiriou-Leventis and N. Leventis, ACS Appl. Mater. Interfaces, 2019, 11, 22668–22676 CrossRef CAS PubMed.
- H. Luo, G. Churu, E. F. Fabrizio, J. Schnobrich, A. Hobbs, A. Dass, S. Mulik, Y. Zhang, B. P. Grady, A. Capecelatro, C. Sotiriou-Leventis, H. Lu and N. Leventis, J. Sol-Gel Sci. Technol., 2008, 48, 113–134 CrossRef CAS.
- N. Leventis, C. Sotiriou-Leventis, S. Mulik, A. Dass, J. Schnobrich, A. Hobbs, E. F. Fabrizio, H. Luo, G. Churu, Y. Zhang and H. Lu, J. Mater. Chem., 2008, 18, 2475–2482 RSC.
- P. M. Rewatkar, T. Taghvaee, A. M. Saeed, S. Donthula, C. Mandal, N. Chandrasekaran, T. Leventis, T. K. Shruthi, C. Sotiriou-Leventis and N. Leventis, Chem. Mater., 2018, 30, 1635–1647 CrossRef CAS.
- I. Smirnova and P. Gurikov, Annu. Rev. Chem. Biomol. Eng., 2017, 8, 307–334 CrossRef PubMed.
- R. Subrahmanyam, P. Gurikov, P. Dieringer, M. Sun and I. Smirnova, Gels, 2015, 1, 291–313 CrossRef PubMed.
- M. Papastergiou, A. Kanellou, D. Chriti, G. Raptopoulos and P. Paraskevopoulou, Materials, 2018, 11, 2249 CrossRef PubMed.
- S. H. Ching, N. Bansal and B. Bhandari, Crit. Rev. Food Sci. Nutr., 2017, 57, 1133–1152 CrossRef CAS PubMed.
- S. S. Kistler, J. Phys. Chem., 1931, 36, 52–64 CrossRef.
- P. Paraskevopoulou, P. Gurikov, G. Raptopoulos, D. Chriti, M. Papastergiou, Z. Kypritidou, V. Skounakis and A. Argyraki, Polyhedron, 2018, 154, 209–216 CrossRef CAS.
- D. Filipiuk, L. Fuks and M. Majdan, J. Mol. Struct., 2005, 744–747, 705–709 CrossRef CAS.
- S. K. Papageorgiou, E. P. Kouvelos, E. P. Favvas, A. A. Sapalidis, G. E. Romanos and F. K. Katsaros, Carbohydr. Res., 2010, 345, 469–473 CrossRef CAS PubMed.
- N. Leventis, C. Sotiriou-Leventis, A. M. Saeed, S. Donthula, H. Majedi Far, P. M. Rewatkar, H. Kaiser, J. D. Robertson, H. Lu and G. Churu, Chem. Mater., 2016, 28, 67–78 CrossRef CAS.
- J. S. Rowbotham, P. W. Dyer, H. C. Greenwell, D. Selby and M. K. Theodorou, Interface Focus, 2013, 3, 20120046 CrossRef CAS PubMed.
- T. S. Pathak, J. S. Kim, S.-J. Lee, D.-J. Baek and K.-J. Paeng, J. Polym. Environ., 2008, 16, 198–204 CrossRef CAS.
- A. B. Ross, C. Hall, K. Anastasakis, A. Westwood, J. M. Jones and R. J. Crewe, J. Anal. Appl. Pyrolysis, 2011, 91, 344–351 CrossRef CAS.
- A. Kanellou, G. C. Anyfantis, D. Chriti, G. Raptopoulos, M. Pitsikalis and P. Paraskevopoulou, Molecules, 2018, 23, 1007 CrossRef PubMed.
- C. Chidambareswarapattar, P. M. McCarver, H. Luo, H. Lu, C. Sotiriou-Leventis and N. Leventis, Chem. Mater., 2013, 25, 3205–3224 CrossRef CAS.
- A. Bang, C. Buback, C. Sotiriou-Leventis and N. Leventis, Chem. Mater., 2014, 26, 6979–6993 CrossRef CAS.
- D. Chriti, G. Raptopoulos, M. Papastergiou and P. Paraskevopoulou, Gels, 2018, 4, 66 CrossRef PubMed.
- M. Robitzer, L. David, C. Rochas, F. D. Renzo and F. Quignard, Macromol. Symp., 2008, 273, 80–84 CrossRef CAS.
- N. N. Greenwood and A. Earnshaw, Chemistry of the Elements, Elsevier, 2012 Search PubMed.
- A. L. Patterson, Phys. Rev., 1939, 56, 978–982 CrossRef CAS.
- O. C. Compton and S. T. Nguyen, Small, 2010, 6, 711–723 CrossRef CAS PubMed.
- W. Zhao, G. Kido, K. Hara and H. Noguchi, J. Electroanal. Chem., 2014, 712, 185–193 CrossRef CAS.
- L. G. Cançado, K. Takai, T. Enoki, M. Endo, Y. A. Kim, H. Mizusaki, A. Jorio, L. N. Coelho, R. Magalhães-Paniago and M. A. Pimenta, Appl. Phys. Lett., 2006, 88, 163106 CrossRef.
- M. Athanasiou, N. Samartzis, L. Sygellou, V. Dracopoulos, T. Ioannides and S. N. Yannopoulos, Carbon, 2021, 172, 750–761 CrossRef CAS.
- E. Raymundo-Piñero, F. Leroux and F. Béguin, Adv. Mater., 2006, 18, 1877–1882 CrossRef.
- C. Bosch-Navarro, F. Busolo, E. Coronado, Y. Duan, C. Martí-Gastaldo and H. Prima-Garcia, J. Mater. Chem. C, 2013, 1, 4590–4598 RSC.
- N. S. Mcintyre and M. G. Cook, Anal. Chem., 1975, 47, 2208–2213 CrossRef CAS.
- C. M. Kim, H. S. Jeong and E. H. Kim, Surf. Sci., 2000, 459, L457–L461 CrossRef CAS.
- L. Q. Wu, S. Q. Li, Y. C. Li, Z. Z. Li, G. D. Tang, W. H. Qi, L. C. Xue, L. L. Ding and X. S. Ge, Appl. Phys. Lett., 2016, 108, 021905 CrossRef.
- D. Briggs and G. Beamson, Anal. Chem., 1993, 65, 1517–1523 CrossRef CAS.
- G. P. López, D. G. Castner and B. D. Ratner, Surf. Interface Anal., 1991, 17, 267–272 CrossRef.
- M. Lawrinenko and D. A. Laird, Green Chem., 2015, 17, 4628–4636 RSC.
- H. M. Far, P. M. Rewatkar, S. Donthula, T. Taghvaee, A. M. Saeed, C. Sotiriou-Leventis and N. Leventis, Macromol. Chem. Phys., 2019, 220, 1800333 CrossRef.
- M. Inagaki, M. Toyoda, Y. Soneda and T. Morishita, Carbon, 2018, 132, 104–140 CrossRef CAS.
- A. T. Balaban, G. D. Mateescu and M. Elian, Tetrahedron, 1962, 18, 1083–1094 CrossRef CAS.
- M. P. Kumar, T. Kesavan, G. Kalita, P. Ragupathy, T. N. Narayanan and D. K. Pattanayak, RSC Adv., 2014, 4, 38689–38697 RSC.
- P. A. Webb and C. Orr, Analytical Methods in Fine Particle Technology, Micromeritics Instrument Corporation, Norcross, GA, 1997 Search PubMed.
Footnote |
| † Electronic supplementary information (ESI) available. See DOI: 10.1039/d0ma01025a |
| This journal is © The Royal Society of Chemistry 2021 |