 Open Access Article
Creative Commons Attribution 3.0 Unported Licence
Rare earth oxynitrides: promising visible-light-driven photocatalysts for water splitting†
Shijia
Jiang
,
Yanxin
Liu
and
Jun
Xu
 *
*
Center for Rare Earth and Inorganic Functional Materials, Tianjin Key Lab for Rare Earth Materials and Applications, School of Materials Science and Engineering& National Institute for Advanced Materials, Nankai University, Tianjin, 300350, China. E-mail: junxu@nankai.edu.cn
First published on 31st December 2020
Abstract
Photocatalytic water splitting is a potential solution for the global energy crisis. However, most photocatalysts only respond to ultraviolet light irradiation, which is not the main component of sunlight. Photocatalysis driven by visible light has therefore become a challenging and cutting-edge research topic. In recent years, perovskite-type rare earth oxynitrides with a formula of ABOxNy (A = rare earth ions; B = Ti4+, Zr4+, Ta5+, W6+, etc.; x + y = 3) have been reported to be promising candidates for visible-light-driven photocatalytic water splitting. Several factors have been considered to be responsible, including (i) the combination of narrower band gap and higher water stability, (ii) flexible perovskite structure allowing the facile modulation of composition by single or multiple ion doping, (iii) the small differences in neighbouring rare earth elements making ultrafine tuning of properties possible, and (iv) the incorporation of additional functionalities arising from rare earth elements. Despite their importance, to the best of our knowledge, there is no review focusing on the progress of rare earth oxynitride photocatalysts yet. This review describes the proposed mechanism for photocatalytic water splitting, the synthetic methods of rare earth oxynitrides, their photocatalytic performances, the theoretically predicted phases, and the challenges and opportunities for future research on rare earth oxynitrides.
1. Introduction
The global energy consumption increases with the growth of population and economy. Today, 90% of global energy comes from fossil fuels, and this number is expected to reach its maximum in 30 years.1 Fossil energy is non-renewable. Combustion of fossil fuels has released a large amount of carbon dioxide into the atmosphere, leading to environmental issues such as the global climate change. In contrast, solar energy can be considered an inexhaustible resource. The earth's surface receives about 1.2 × 10⁵ TW from solar radiation, which is equivalent to 130 million 500 MW power plants,2 compared to the expected global energy consumption of 27 TW in 2050 and 43 TW in 2100.3 Such a large difference suggests that the utilization of only one ten-thousandth of the available solar energy can satisfy the global energy demand. Solar energy has thus attracted much attention because it is worthwhile, clean, and economical.4However, the shortcomings of solar energy, such as low energy density and large fluctuations with time and region, usually require solar energy to be converted into other energy forms for practical applications, including electricity and chemical energy. Although the conversion from solar energy to electricity via solar cells is at a relatively mature stage, the storage of electricity is still an issue. As chemical energy is suitable for storage, converting solar energy to chemical energy has become an alternative strategy. In particular, photocatalytic water splitting produces hydrogen, which is an ideal clean and high-energy fuel.5
The phenomenon of photocatalysis has been recognized for a long time. Herein, we have to clarify that photocatalysis does not mean that light itself has a catalytic effect, but that the presence of a catalyst can accelerate the photochemical reaction.6 In particular, photocatalytic water splitting refers to the decomposition of water to obtain H2 and O2 with a stoichiometric ratio of 2![[thin space (1/6-em)]](https://www.rsc.org/images/entities/char_2009.gif) :
:![[thin space (1/6-em)]](https://www.rsc.org/images/entities/char_2009.gif) 1 under light. Photogenerated holes oxidize water to produce oxygen (i.e., oxygen evolution reaction, OER), while photogenerated electrons reduce water to produce hydrogen (i.e., hydrogen evolution reaction HER). As we have learned, ultraviolet (UV: <400 nm) light accounts for as little as 3% of the solar energy irradiated on the earth's surface, while the visible light energy (visible light: 400–760 nm) accounts for 44%. From the perspective of solar energy utilization, the visible-light-driven photocatalytic reaction surpasses the conventional UV-light-driven photocatalytic reaction. In such cases, even low-luminance indoor lighting sources can be utilized to generate hydrogen.7
1 under light. Photogenerated holes oxidize water to produce oxygen (i.e., oxygen evolution reaction, OER), while photogenerated electrons reduce water to produce hydrogen (i.e., hydrogen evolution reaction HER). As we have learned, ultraviolet (UV: <400 nm) light accounts for as little as 3% of the solar energy irradiated on the earth's surface, while the visible light energy (visible light: 400–760 nm) accounts for 44%. From the perspective of solar energy utilization, the visible-light-driven photocatalytic reaction surpasses the conventional UV-light-driven photocatalytic reaction. In such cases, even low-luminance indoor lighting sources can be utilized to generate hydrogen.7
Although metal oxides such as TiO2 and ZnO are very successful photocatalysts for water splitting,8 they are typically inactive under visible light irradiation due to their large bandgaps. It has been demonstrated that metal nitrides have smaller bandgaps due to the higher 2p orbital energy level of N3− than that of O2−.9 However, the water stability of metal nitrides is poor, making them unsuitable for photocatalytic water splitting. Metal oxynitrides can simultaneously possess low bandgaps as metal nitrides and high stability in water as metal oxides, and thus have been developed as visible-light-driven photocatalysts for water splitting.10–13
During the recent renaissance of perovskites in a wide variety of applications such as in photovoltaic, luminescent, and photocatalytic materials, the large family of perovskite-type oxynitrides with a formula of ABOxNy (A = transition metal or rare earth ions; B = Ti4+, Zr4+, Ta5+, W6+, etc.; x + y = 3) has attracted considerable research interest. The perovskite structure is more flexible than a simple metal oxynitride structure, due to the inclination of the BO6−xNx octahedral framework in various ways and the replacement of both A and B sites by many cations. Ionic doping/substitution has thus become an effective and robust approach for the fine tuning of physical and chemical properties. In particular, rare earth oxynitrides, which consist of fifteen lanthanide elements with unique electron configurations of [Xe]4fn−15d0−16s2 (n = 1–15) and the elements Sc and Y, can possess even higher structural variability. It is because the changes in properties of neighboring rare earth elements, such as ionic radii, coordination behaviors, redox potentials, etc., are significantly smaller than those of neighboring transition metals. Moreover, the unpaired 4f electrons of rare earth elements are typically not involved in chemical bonding, introducing unique magnetic, electronic, and luminescence functionalities into the oxynitrides. For example, because of magnetic anisotropy, spin–orbit coupling and crystal field effects, the paramagnetism of RETiO2N (RE = Ce, Pr, Nd) compounds deviates from the Curie–Weiss law below certain temperatures (CeTiO2N: 150 K; NdTiO2N: 30 K).14 EuWO1+xN2–x possesses colossal magnetoresistance when x is close to 0 and also shows excellent electronic flexibility, which is a promising candidate for new memory and sensor devices.15 LaTiO2N films can display a high dielectric constant, which fluctuates greatly under the direct current (DC) electric field.16 LaTaON2 has excellent luminosity, tinting power, transparency and dispersibility, and thus can be used as non-toxic yellow-red pigments.17 Although not reported to date, the interplay of these functionalities with photocatalysis may yield new families of multifunctional materials.
In recent years, the research interest of perovskite-type rare earth oxynitrides as visible-light-driven photocatalysts for water splitting has grown. However, to the best of our knowledge, there is still no review focusing on the progress in this emerging area. We are thus motivated to present a comprehensive review covering the mechanism of photocatalytic water splitting, the synthetic methods of rare earth oxynitrides, the photocatalytic activity, the theoretical predication of phases, and the challenges and opportunities for future research. We hope that this review will encourage more researchers to enter this field.
2. Mechanism of photocatalytic water splitting
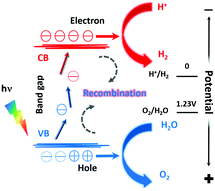
The electronic structure of photocatalysts plays an important role in their performances.18 For a solid, some of its electronic states are empty and some are full. The full energy state and the empty energy state are referred to as the valence band (VB) and the conduction band (CB), respectively. If there is an energy difference between the VB and the CB (i.e., a band gap), this material is a semiconductor or an insulator, depending on the size of the bandgap. A semiconductor may be used as a photocatalyst for water splitting, and the working principle is shown in Fig. 1.19As illustrated in Fig. 1, the minimum value of the CB must be lower than the oxidation–reduction potential (ORP) of H+/H2 (0 V vs. NHE, NHE is the normal hydrogen electrode), and the maximum value of the VB must be higher than the ORP of O2/H2O (+1.23 V vs. NHE). The VB of metal oxides is mainly composed of O 2p orbitals. Their maximum values are thus much higher than +1.23 V vs. NHE, which leads to high photocatalytic water oxidation activity. However, the bandgap of metal oxides is usually so wide that they only respond to UV light. When O2− is partially replaced with N3−, e.g., forming rare earth oxynitrides, the VB maximum (VBM) is composed of hybridized N 2p and O 2p orbitals, yielding smaller VBM and a narrower band gap. As a result, rare earth oxynitrides can absorb light with longer wavelengths and perform photocatalysis under visible light.
The three steps occurring in photocatalytic water splitting are the generation of electron–hole (e−–h+) pairs, the separation and migration of e−–h+ pairs, and the final chemical reaction with adsorbed surface species. In the ground state, all electrons are within the VB. After irradiation, the photocatalyst absorbs photons with energy higher than the bandgap energy to excite electrons from the VB into the CB, forming excited states and e−–h+ pairs. When these electrons and holes are separated and migrate to the surface of the catalyst, the redox reaction will proceed. The two protons needed to generate a H2 molecule are reduced by the excited electrons in the photocatalyst. And the electrons generated by oxygen evolution can fill the holes in the valence band. The corresponding reaction formulae are shown in eqn (1) and (2).
| HER: 2H+ + 2e− = H2 | (1) |
| OER: H2O + 2h+ = 1/2O2 + 2H+ | (2) |
3. Synthetic methods
The synthesis of oxynitrides is usually more challenging than oxides because of less stability and the requirement of a suitable nitriding agent to convert metal oxide precursors to oxynitrides (i.e., the nitridation process). The most common nitridation process is the ammonolysis reaction with the following reaction formula:| Metal-oxide + NH3 → metal-oxynitride + H2O↑ | (3) |
3.1. Synthesis of precursors
A suitable metal oxide precursor such as a ternary rare earth oxide consists of rare earth ions and transition metal ions mixed at the atomic level, resulting in shorter diffusion lengths and lower reaction temperatures.20 Furthermore, the precursors prepared by different methods possess various sizes, morphologies, degrees of metal ion ordering, etc., which can affect the nitridation process considerably. | (4) |
3.2. Nitridation
The stronger bonding within nitrogen molecules compared to oxygen molecules results in smaller free energy for the formation of oxynitrides. The rare earth oxynitrides are therefore obtained under harsher synthetic conditions than the ternary oxides. Nevertheless, various nitridation methods have been developed to convert oxides into oxynitrides.Adding a molten salt flux during the nitridation process can promote the diffusion of atoms in precursor and nitrided materials, thereby achieving structural control of the final particles.36 Maegli et al. added NaCl/KCl flux when synthesizing LaTiO2N, and found that it had better crystallinity than samples without flux-assist.37
Table 1 compares the advantages and disadvantages of various synthetic methods. Researchers should select their own synthetic routes according to their needs. To date, the most common synthetic method for oxide precursors is still the solid-state or derived methods, whereas ammonolysis is used to convert oxide precursors to rare earth oxynitrides.
| Synthetic methods | Advantages | Disadvantages | |
|---|---|---|---|
| Synthesis of precursors | Solid-state | Simple operation | Usually requires high temperature and high pressure |
| Co-precipitation | Milder conditions | Complex process | |
| Sol–gel | Better sample uniformity | Complex operation | |
| Pechini | Wide pH range | Poor control of morphology | |
| Hydrothermal | Milder reaction conditions | Difficult to synthesize on a large scale | |
| Flux | High product purity, uniform nanostructures | ||
| Nitridation | Ammonolysis | Traditional and reliable method | Dangerous, need exhaust gas treatment |
| Without using NH3 | Relatively safe | Strict requirements on precursors |
3.3. Fabrication of thin films and nanostructures
Physical deposition methods including sputter deposition and pulsed laser deposition have been used to fabricate thin films of rare earth oxynitrides. The fabrication of perovskite-type oxynitride LaNbOxNy thin films uses LaN–NbN powder as the target, because it is difficult to prepare the deposited precursor target directly. Cohen et al. considered that a major drawback in this process is that the stoichiometry is difficult to control.41 Lu et al. used La2Ti2O7 powder as the target, and deposited LaTiO2N thin films in N2 rich plasma by radio frequency magnetron sputtering technology.16 Aguiar and co-workers42 deposited (La,Sr)TiO3+x/2 on SrTiO3 and MgO targets by pulse laser deposition, and then obtained the corresponding oxynitrides (La,Sr)Ti(O,N)3 by ammonolysis. Moreover, it was found that except for x = 0.5, in all other cases, the film grew along the (100) crystal orientation of the perovskite structure.
It is noteworthy that the thin films are basically obtained by epitaxial growth on the substrate and the lattice of the prepared material often appears to be mismatched with that of the substrate. In particular, for the perovskite structure films, in which the anion sequence often varies dramatically, the lattice mismatch of the film and substrate is quite common. As a result, the synthetic technology of thin films of rare earth oxynitrides still requires extensive exploration and improvement.43
Among the various methods, the template synthesis can easily control the shape, size, and even exposed crystal planes of nanoparticles. Li et al. first obtained carbon spheres through the hydrothermal reaction of glucose.44 In the next step, they added carbon spheres into an ethanol solution of LaCl3 and tetrabutyl titanate, allowing La3+ and Ti4+ to be absorbed on the surface of the carbon sphere. The carbon sphere was then removed through a calcination process to form hollow spherical LaTiOx precursors, and was finally successfully converted to LaTiO2N hollow nanospheres under NH3 treatments. In another work,45 Wang et al. first used the KOH/NaOH flux method to obtain plate-shaped LaKNaTaO5 nanomaterials, and then directly nitridated them to evaporate K and Na species on the surface which resulted in the formation of LaTaON2. Finally, the core–shell structured plate-shaped LaKNaTaO5/LaTaON2 was successfully synthesized. The photocatalytic activities of these two materials have been improved, which will be discussed in depth in the following section.
Besides the template synthesis, oriented attachment (OA) has been widely utilized to control the crystal growth via crystallographic alignment. A big challenge in OA crystallization is the removal of the additives, which is required to enable the OA assembling process. Yan et al. reported that the flux environment is an ideal medium for OA growth without additives.46 Hundred-nanometer-size LaTaON2 single crystals were first synthesized by conventional flux synthesis, which exhibits no specific morphology. These crystals were further heated in molten LiCl under the NH3 flow to form regular LaTaON2 cuboids. It was found that this OA growth process is affected by electrostatic repulsion and van der Waals attraction. Meanwhile, the evaporation of LiCl flux induces a supersaturated liquid environment, which promotes the assembly of growth units into regular crystal particles. Although the resulting single crystals are of micrometer-size, this method may also be used to obtain well-defined nanostructures.
4. Visible-light-driven photocatalytic activity
As mentioned in former sections, perovskite-type rare earth oxynitrides containing d0-type transition metal ions are promising photocatalysts that can respond to visible light. There have been many photocatalytic studies based on rare earth oxynitrides. According to the literature, LaTiO2N has a bandgap of 2.1 eV and can absorb light with wavelengths greater than 600 nm.47 In addition, LaZrO2N,48 LnTaON2 (Ln = La,49 Ce,14 Pr50), and LaW(O,N)351 have favorable optical bandgaps and are suitable for visible-light-driven photocatalytic water splitting. In this reveiw, the photocatalytic activity of water splitting using various rare earth oxynitrides under visible light will be summarized.4.1. LaMO2N (M = Ti; Zr)
LaTiO2N is an n-type semiconductor with a bandgap of 2.1 eV and an absorption edge of about 600 nm.52 The structure diagram is shown in Fig. 2.53 According to the literature,53 LaTiO2N belongs to the orthorhombic space group of Imma (#74), whereas LaZrO2N belongs to the perovskite structure with the orthorhombic space group of Pnma (#62). In addition, LaTiO2N is considered to adopt an a−b−b−-type distortion, in which Ti ions have two different octahedral sites, and the vertices are shared between different octahedra. Its two inclination angles are very close, and both are larger than angles in the b-axis. Furthermore, La3+ is located in the center of octahedral endpoints in the c-axis. However, LaZrO2N belongs to an a+b−b−-type distortion, that is, the two inclination angles are the same, and the adjacent octahedral layers are inclined in phase on one cubic axis, but not on the other axes. In contrast, the octahedron of LaZrO2N is more twisted than that of LaTiO2N, which may be related to the difference in the relative size and electronegativity between A and B cations.53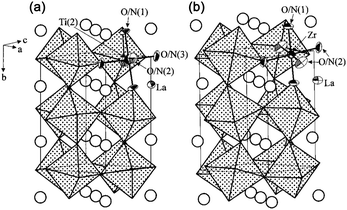 | ||
| Fig. 2 The structure diagram of LaTiO2N (a) and LaZrO2N (b). Reproduced with permission from ref. 53. Copyright 2002, American Chemical Society. | ||
Density functional theory (DFT) calculations can provide a powerful theoretical basis for both bulk and surface structures of a material. Ninova et al.54 used LaTiO2N as an example to analyse the O/N arrangements on their surface. They first calculated all possible non-equivalent anionic orders in the unit cell of 20 atoms, and determined that the most representative model is the two-dimensional Ti–N–Ti cis chain. It is found that the effective masses of electrons and holes of the compounds whose anions are arranged in cis form have stronger anisotropy. They further studied the structure of the (001) crystal plane and the arrangement of anions for LaTiO2N, and uncovered that many factors could contribute to the surface sequence, including the chemical composition, degree of polarity, and so on. The most stable surface model is the surface with La as the end and having alternating polarity compensation atomic layers. If the surface is not stable enough, it can be stabilized by electronic and structural reconstruction. The explorations on the structure and composition of the surface will provide insights into improving the photocatalytic activity.
In photocatalytic reactions, methanol is typically used as a sacrificial electron donor and Ag+ is used as an acceptor to study the reduction of H+ to H2 and the oxidation of H2O to O2, respectively. Previous studies have shown that LaTiO2N can generate H2 and O2 through water splitting under visible light irradiation, indicating that LaTiO2N has sufficient oxidation and reduction potential, which can respond to visible light.55 However, the efficiency of hydrogen and oxygen evolution is often different, making it difficult to carry out the overall water splitting. At the same time, during the process of oxidation and reduction, the degradation of the photocatalyst itself will also occur.56 The composition of LaTiO2N is relatively complex, which induces many defects such as N and O vacancies, and La dopants. These defects have the ability to generate additional electronic and optical states, thereby modifying the electronic structure or the band structure. As a result, these defects can serve as composite centers of photo-generated electrons and holes, which is not favorable to water splitting. Based on this, many attempts have been made to solve these problems, such as loading appropriate co-catalysts and partially replacing cations.
Maegli et al.37 explored the effects of LaTiO2N morphology and CoOx as co-catalysts on the photocatalytic water oxidation activity. La2Ti2O7 were synthesized as precursors by using two methods including the polymerization-complex method and solid-state method, which were called PC-LTO and SS-LTO, respectively. Among them, the shapes of PC-LTO were irregular, while the shapes of SS-LTO were regular, with good dispersibility. Furthermore, SS-LTO had a larger grain size. As shown in Fig. 3, after nitriding the two samples using the ammonolysis method, it was observed that SS-LTON had more voids and retained the morphology of the precursors. In contrast, when using NaCl/KCl as the flux to promote the nitridation process, SS-LTON-flux exhibited a skeletal morphology, and its OER rate reached a maximum value of 2600 μmol g−1 h−1. In addition, they studied that after dispersing CoOx as co-catalysts, the dispersibility on SS-LTON-flux was even better, because this skeletal morphology contained many unsaturated surface bonds and provided CoOx with more nucleation centers, thereby improving the dispersibility of the co-catalyst, which was beneficial for improving the oxygen evolution efficiency.
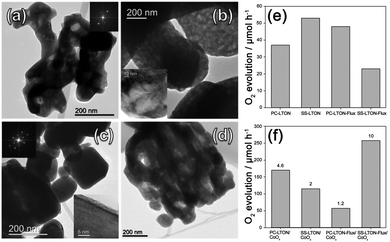 | ||
| Fig. 3 TEM images of (a) PC-LTON, (b) SS-LTON, (c) PC-LTON-Flux and (d) SS-LTON-Flux. Oxygen evolution rates (e) before and (f) after loading CoOx as co-catalysts (λ ≥ 420 nm). Reproduced with permission from ref. 37. Copyright 2013, American Chemical Society. | ||
Later, Li et al. obtained hollow spherical LaTiO2N nanostructures and loaded Pt as the co-catalyst on the sample through the hydrogen reduction method, denoted as Pt/H-LTON, to increase the HER rate.44 The experimental results implied that the quantum efficiency of this material to generate hydrogen by reducing water under visible light irradiation reaches 3.4% and the corresponding hydrogen evolution efficiency is 960 μmol g−1 h−1. As shown in Fig. 4, the particle size of this nanomaterial is small enough, and the best thickness screened by comparison tests is only 7 nm, which is similar to the free path of photo-generated carriers. In such cases, the diffusion distance of photo-generated carriers is shortened so that it can migrate to the surface and avoid being wasted in the relaxation path. For the bulk LaTiO2N (B-LTON), the surface and volume recombination of photo-generated carriers coexist. However, for Pt/H-LTON, the nanoscale morphology prevents volume recombination, and the introduction of H results in the lattice surface being in a disordered state, thereby inhibiting the surface recombination effectively. Moreover, the authors examined the stability of Pt/H-LTON after 8 days for the HER. The powder XRD results imply that the materials are very stable during the reaction (Fig. 4d).
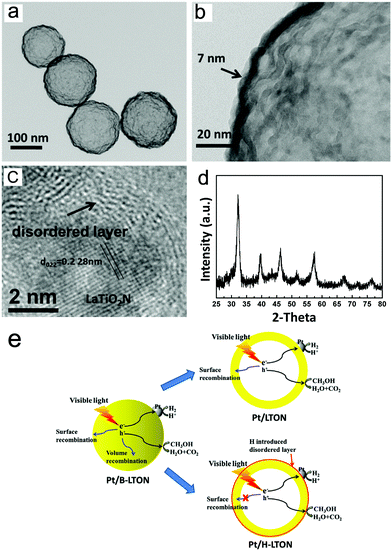 | ||
| Fig. 4 (a and b) TEM images of hollow spherical LaTiO2N. (c) HRTEM image of LaTiO2N loaded with Pt by the H2 reduction method. (d) XRD pattern of Pt/H-LTON after 8 days of H2 evolution reaction. (e) Schematic diagram of three photocatalysts. Reproduced with permission from ref. 44. Copyright 2015, Elsevier. | ||
One drawback of this method is that it can only improve the hydrogen production efficiency and does not help to improve the oxygen production efficiency. Later on, this research group further attempted to load CoOx on LaTiO2N and used Fe as dopants to improve the oxygen evolution efficiency,57 as shown in Fig. 5 and 6. When CoOx are loaded on LaTiO2N as co-catalysts, they will form heterojunctions. According to ref. 58, the free path length of the photo-generated carriers in LaTiO2N is about 250 nm. This length is significantly larger than the thickness of nanoscale LaTiO2N. Therefore, photo-generated electrons in LaTiO2N were migrated to CoOx with holes, resulting in waste of photo-generated electrons. As defects can confine carriers and also change the band structure, they added Fe dopants at the interstitial position of LaTiO2N as the defects. As illustrated in Fig. 5, the Δev (valence band energy) between CoOx and LaTiO2N was calculated to be 0.22 eV and the Δec (conduction band energy) was about 0.21 eV, indicating that the energy band arrangement of CoOx and LaTiO2N nanostructures was changed. This leads to the separation of photogenerated electrons and holes, thus improving the photocatalytic activity of water oxidation.
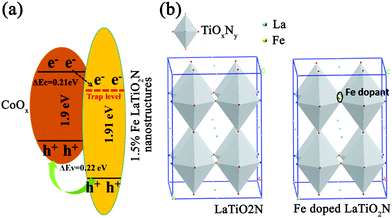 | ||
| Fig. 5 (a) Band structure of CoOx/Fe-doped LaTiO2N. (b) Crystal structures of pure LaTiO2N and Fe doped LaTiO2N. Reproduced with permission from ref. 57. Copyright 2016, Elsevier. | ||
 | ||
| Fig. 6 (a) UV-vis spectra of LaTiO2N with different Fe doping concentrations. (b) Oxygen production rate of CoOx/LaTiO2N with different Fe doping concentrations (λ ≥ 420 nm). (c) The corresponding quantum efficiency. Reproduced with permission from ref. 57. Copyright 2016, Elsevier. | ||
As shown in Fig. 6, the UV-vis spectra showed that as the concentration of Fe dopants increased, the absorption edge had significant red-shifts. When the concentration of Fe dopants reached 1.5%, the oxygen evolution rate was the highest, i.e., 1590 μmol g−1 h−1, and the corresponding apparent quantum efficiency was 55%. Therefore, by doping Fe in the CoOx/LaTiO2N nanostructure, the band arrangement between CoOx and LaTiO2N can be adjusted. Meanwhile, the carrier transport can be unblocked and the carrier separation ability can be improved. All these factors are responsible for the improvement of oxygen evolution efficiency.
Thin film materials are often more advantageous than powder materials and thus have been extensively studied. Lawley et al. used TiN as the substrate and coated it with MgO for deposition, and finally obtained LaTiOxNy (x + y = 3) thin films to study the surface modification of the solid–liquid interface during the photocatalytic water splitting.59 The structure and morphological characteristics of LaTiOxNy thin films are shown in Fig. 7. Good boundaries between the layers have been observed in the TEM image. The embedded image indicates that the LaTiOxNy and TiN are epitaxially grown on the MgO substrate. The low O/N ratios shown in Fig. 7c are common for epitaxially grown films because of the balance between the crystal quality and total nitrogen content. This research group loaded IrO2 as co-catalysts on the surface of the exposed LaTiOxNy films. The results showed that after loading IrO2, the degradation rate of the photocatalyst was significantly lower than that of the bare film, which also improved the photocatalytic activity. It is worth noting that they used ex situ neutron reflection (NR) and grazing incidence X-ray absorption spectroscopy (GIXAS) to elaborate the reaction that occurs on the surface of the photocatalyst under visible light irradiation and the change of each cation with depth. As shown in Fig. 7d and e, when the bare film is placed in the electrolyte and irradiated with light, the reflectance curve changes little before and after the photoelectrocatalytic reaction. However, after applying an external bias to the film, the reflectance curve fluctuates greatly, which may be responsible for the change in film density. By simulating a one-dimensional scattering length density profile, as shown in Fig. 7f, the TiN layer remains unchanged before and after the reaction, and the loss of N in the first 3 nm below the surface layer is relatively large.
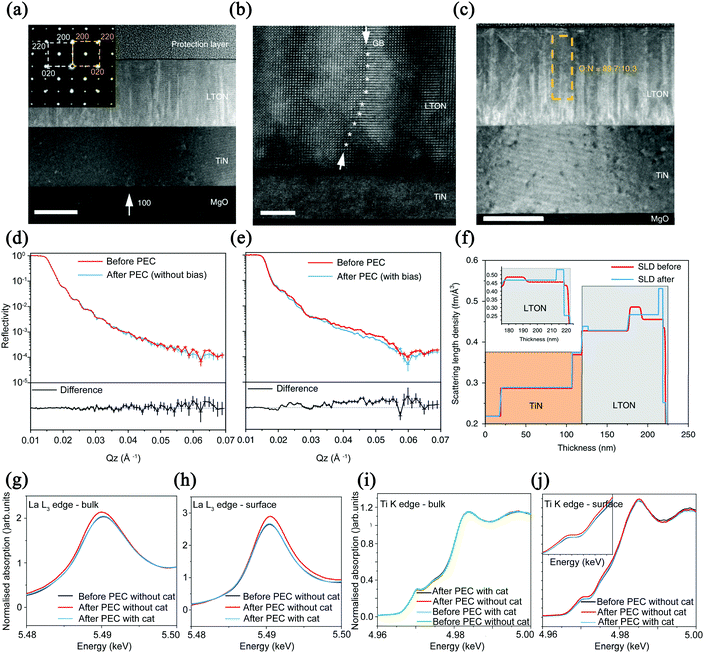 | ||
| Fig. 7 (a) TEM image of LaTiO2N cross-section with a scale bar of 100 nm (the selected area electron diffraction as an embedded picture). (b) HAADF image with a scale bar of 5 nm. (c) O/N ratio, the scale bar is 100 nm. Reflectivity diagram of LTON films exposed to electrolyte and light intensity (d) without and (e) with external bias. (f) Simulation of a one-dimensional scattering length density distribution. (g) LTON bulk and (h) surface comparing La before and after PEC. (i) LTON bulk and (j) surface comparing Ti before and after PEC. Reproduced with permission from ref. 59. Copyright 2020, Nature. | ||
As a result, the neutron reflectometry results show that the process of applying bias and water splitting directly induces changes in film density. In Fig. 7g and h, the X-ray absorption near-edge spectroscopy (XANES) results show that after photoelectrocatalysis, the intensity of La cations of the bare bulk film sample increases and the energy decreases. However, for the La ions on the surface, there is an oxidation transfer to higher energy after catalysis. It can be seen from these two figures that the biggest difference before and after catalysis is the center shift, which indicates that the A cation sites are the main active sites in the water splitting process. The possible reason is that the ionic radius of La is larger than that of Ti and induces the sinking of Ti ions into the subsurface, yielding a surface that is mainly composed of La–O. In Fig. 7i and j, the K edge of Ti does not change, which also confirms that the water splitting process has negligible effects on the valence state of Ti ions. It should be pointed out that when IrO2 is loaded as a co-catalyst, the position and strength of the L3 edge before and after the catalysis did not change, which shows that the co-catalyst can play a role in preventing the surface from being modified during the catalytic process.
In this work, through the complementary characterization of neutron reflection and GIXAS, it is revealed that during the catalytic process, the reaction on the catalyst surface and the change of each cation with the change of depth are probed. In other words, it provides effective evidence for the change of the surface structure and the magnitude of the change.
Although LaZrO2N has a bandgap (2.1 eV) suitable for visible-light-driven photocatalytic reactions, its photocatalysis research was first reported in 2018.48 The experimental results showed that when loading CoOx as co-catalysts, LaZrO2N only exhibited oxygen evolution activity and had no hydrogen evolution ability. Due to the fact that most photocatalysts cannot realize simultaneous hydrogen evolution and oxygen evolution reactions,60 the concept of a Z-scheme is proposed. Generally speaking, this system includes two types of photocatalysts, and the hydrogen evolution and oxygen evolution reactions occur on the surfaces of the two types of photocatalysts, respectively. Holes exist in the valence band of one photocatalyst, and electrons exist in the conduction band of the other photocatalyst. In the case of a short circuit in the residual charge, overall water splitting can be achieved.11 Although the current oxygen evolution rate using LaZrO2N as a photocatalyst is only about 20 μmol g−1 h−1, it may be improved by using the Z-scheme.
4.2. LnTaON2 (Ln = La, Ce, Pr)
Based on the literature, LaTaON2 belongs to the orthorhombic space group of Imma (#74), as shown in Fig. 8.49 However, the space group for CeTaON2 is Pnma (#62). The formation of distorted perovskite CeTaON2 requires a higher reaction temperature than LaTaON2. It is also easy to form CeO2 and other phases. CeO2 is often formed due to its high stability. And the heterogeneous phase may be Ce(NH2)3 because of the relatively low solubility of Ce.61 LaTaON2 shows a bandgap of about 1.8 eV, while CeTaON2 shows a similar bandgap of 1.7 eV. Both compounds can in principle respond to visible light. However, as of now, there are no reports about photocatalysis using CeTaON2. PrTaON2 also belongs to the orthorhombic space group of Pnma.50 A previous study showed that the photocatalytic activity of PrTaON2 is not as good as LaTaON2.50 The author attributed it to excessive defects related to anion vacancies and reduced Ta species generated during the nitridation process. As a result, this review only discusses the photocatalytic activity of LaTaON2.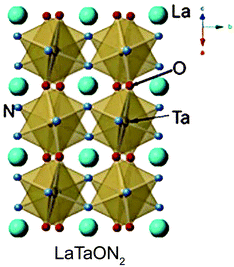 | ||
| Fig. 8 Structure diagram of LaTaON2. Reproduced with permission from ref. 49. Copyright 2015, John Wiley & Sons, Ltd. | ||
Liu et al. found that when H2PtCl6·6H2O and RuCl3·3H2O were used as precursors to load 0.15% Pt and 0.25% Ru on LaTaON2, the visible-light-driven photocatalytic HER rate of LaTaON2 was 127 μmol g−1 h−1.62 Although LaTaON2 has the ability to absorb visible light, its catalytic activity is apparently poor. Wang et al. introduced Zr to the B sites and then improved the photocatalytic activity for water splitting under visible light irradiation.63 Since Zr4+ and Ta5+ have similar radii and low electronegativity, Zr4+ is a good dopant to form LaTa1−xZrxO1+yN2−y (0 ≤ x ≤ 0.15). Experimental results showed that as the doping amount of Zr increases, the unit cell parameters of LaTaON2 become larger and larger, indicating that Zr was randomly added to the sub-lattice of Ta. Although Zr was doped therein, the ability to capture visible light did not decrease, and the bandgap remained at around 2 eV. In addition, the Zr dopant has a significant effect on morphology. With the increasing of Zr doping amount, the surface of LaTa1−xZrxO1+yN2−y (0 ≤ x ≤ 0.15) exhibits more pores. One possibility is that Zr is very refractory and thus slows down the grain growth. The BET data show that with increasing pores, the specific surface area has been increased and more active sites are therefore formed, which is more conducive to photocatalytic reactions. From the curve of the photocatalytic hydrogen evolution over time in Fig. 9, it is clear that when x = 0.1, i.e., LaTa0.9Zr0.1O1+yN2−y, it has the highest photocatalytic activity. The apparent water oxidation quantum efficiency is 0.93%, which is the highest value for LaTaON2 without co-catalysts. The subsequent photoelectrochemical results showed that after doping Zr in LaTaON2, the material showed better charge separation. At the same time, the interface charge transfer resistance was smaller, and the lifetime of electrons was longer. All these factors may be responsible for the enhanced O2 evolution activity.
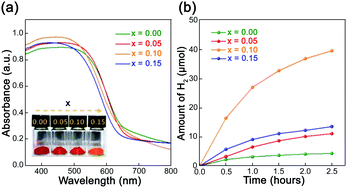 | ||
| Fig. 9 (a) UV-vis spectra of LaTa1−xZrxO1+yN2−y (0 ≤ x ≤ 0.15), the inserted picture is a photo of the sample powder. (b) Curves of photocatalytic hydrogen evolution over time (λ ≥ 420 nm). Reproduced with permission from ref. 63. Copyright 2019, the Royal Society of Chemistry. | ||
In addition to the OER, Wang and co-workers developed an approach to increase the photocatalytic rate of hydrogen evolution effectively.45 They first used LaKNaTaON5 as the precursor, which contains some volatile components, to synthesize LaTaON2 with a core–shell structure. Such nanostructures effectively improved the HER rate. LaKNaTaON5 has a layered perovskite structure and belongs to the tetragonal crystal system. The atomic distances of the compound along the [001] crystallographic direction are very close to those of LaTaON2 in the [010] crystallographic direction. The experimental results showed that during the nitridation process, the components of K and Na were volatilized, leading to the formation of LaTaON2 along the [010] direction. As a result, LaKNaTaON5 exposing the (001) crystal plane was used as a core, and a shell of LaTaON2 exposing the (010) plane was generated externally, as shown in Fig. 10. This article describes that when the nitriding temperature reaches 1223 K, a pure phase of LaTaON2 can be obtained with an absorption wavelength of 620 nm, which proves that the material can effectively absorb visible light.
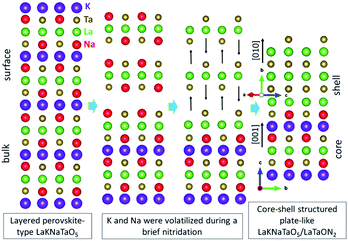 | ||
| Fig. 10 Side view of the reaction process of the core–shell structure LaKNaTaO5/LaTaON2, in which N and O atoms are not marked. Reproduced with permission from ref. 45. Copyright 2019, Wiley-VCH. | ||
In the subsequent photocatalytic experiments, Rh was added as a co-catalyst to detect the photocatalytic activity. As shown in Fig. 11a, core–shell structured LaKNaTaO5/LaTaON5 exhibited the best visible-light-driven photocatalytic performances for hydrogen evolution. Fig. 11b shows that as the cut-off wavelength increases, the hydrogen evolution rate gradually decreases, and 620 nm is the longest wavelength that this material can respond to. Based on the morphological characteristics of this nanomaterial, the oxynitrides exposing specific crystal planes with a low defect density have a positive effect on photocatalytic activity. Such observations also provide new insights into exploring more efficient photocatalytic materials for water splitting in the future.
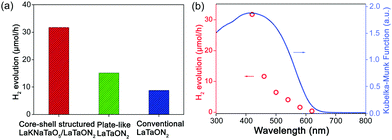 | ||
| Fig. 11 (a) Hydrogen evolution rates of LaTaON2 with different morphologies. (b) Influence of the incident cut-off wavelength of light on the rate of hydrogen evolution. Reproduced with permission from ref. 45. Copyright 2019, Wiley-VCH. | ||
Pan et al. first synthesized a photocatalyst with an absorption edge greater than 600 nm for the overall water splitting.49 They used two strategies to prevent the reverse reaction to generate water, and realized the overall water splitting: the first one was to adjust the bandgap by introducing Mg species into LaTaON2 to form a series of LaMgxTa1−xO1+3xN2−3x (x = 0–2/3) solid solutions; the second was to coat the photocatalyst surface with an amorphous hydroxide layer to control the redox reaction and inhibit the degradation of the photocatalyst, which make some holes to react with N species to generate N2. They loaded Rh/Cr mixed oxides as the co-catalyst on the surface, simply referred to as RhCrOy, and observed that the photocatalytic activity was the best when x = 1/3. According to the literature,64 RhCrOy as a co-catalyst can promote the hydrogen evolution rate while suppressing the O2 reduction reaction (ORR), i.e., to avoid the occurrence of reverse reactions of water splitting. Accordingly, the authors used common amorphous silicon dioxide and titanium dioxide as the coating layers. These materials may belong to the amorphous hydroxides, denoted as SiOXH and TiOXH. Through a series of comparative tests, it was found that coating with TiOXH can promote overall water splitting. This structure belongs to the core–shell structure. The author believes that by allowing h+ to enter the oxygen species in the amorphous layer, it can prevent h+ from accumulating in large amounts in N species on the surface of the photocatalyst, thereby inhibiting the formation of N2. However, there is no reliable evidence to verify this hypothesis. Despite many advantages of TiOXH/RhCrOy/LaMgxTa1−xO1+3xN2−3x, the apparent quantum yield of overall water splitting is only 0.03% at around 440 nm. As a result, the improvement of photocatalytic activity is still the focus of subsequent research studies.
Later, this research group conducted more detailed research on LaMg1/3Ta2/3O2N.65 By varying co-catalysts, coating materials and methods, and synthetic methods of precursors, the target of improving photocatalytic activity has been achieved. They first proved that using RhCrOx as co-catalysts resulted in the highest photocatalytic activity. They then used in situ photodeposition to deposit TiO2 in tetraisopropoxide (TTIP)/H2O2 solution to effectively suppress the ORR reaction. The synthesis of the precursor adopts the reverse homogeneous precipitation (RHP) method because the author believed that the sample synthesized by this method may have fewer defects and thus can further improve the photocatalytic activity. Owing to these improvements, the photocatalytic activity has increased by six fold.
LaMg1/3Ta2/3O2N can be used for overall water splitting by itself. And it can also be used in the Z-system. Pan et al. utilized RhCrOx/LaMg1/3Ta2/3O2N as a hydrogen evolution photocatalyst (HEP) and rutile as an oxygen evolution photocatalyst (OEP).66 The results implied that the activity was improved compared to those of the individual components. As shown in Fig. 12, fixing HEP and OEP on the Au layer and coating a-TiO2 can prevent the transfer of e− and h+ between particles and photo-oxidation of LaMg1/3Ta2/3O2N, and thus inhibit the formation of N2 to achieve the overall water splitting.
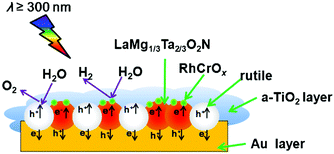 | ||
| Fig. 12 Schematic diagram of the composition of Z-scheme with LaMg1/3Ta2/3O2N and rutile. Reproduced with permission from ref. 66. Copyright 2016, Elsevier. | ||
4.3. LaW(O,N)3
For LaW(O,N)3, the most common composition is LaWO0.6N2.4. According to the literature,51 tetragonal LaWO0.6N2.4 can be formed after nitriding the triclinic La2W2O9. As an n-type semiconductor, LaWO0.6N2.4 exhibits a photocatalytic water splitting ability to generate oxygen. Although UV-vis spectral data show that it has no obvious absorption edge in the visible light region of 300–800 nm, a trend of increasing absorption can be observed. On one hand, it may be due to the hybridization of the O 2p and N 2p orbitals; on the other hand, it may be owing to the accumulation of a large amount of reduced tungsten (W5+ and W4+) and metallic tungsten in the tungsten-based metal oxynitride, which can form a large number of defects in the bandgap. The experimental results showed that the W-containing oxynitrides could be used in photocatalytic reactions under visible light to promote water splitting to produce O2. However, at the same time, N2 would also be produced, which can be attributed to photocorrosion. Due to the lack of active sites for oxygen evolution on the surface of the photocatalysts, photo-generated holes are accumulated and reacted with N3− to form N2, i.e., photocorrosion. The corresponding reaction formulae of this process are shown as follows:| 2N3− + 6h+ → N2 | (5) |
| 2O2− + 4h+ → O2 (from photocorrosion) | (6) |
| 2H2O + 4h+ → 4H+ + O2 (from water oxidation) | (7) |
Table 2 summarizes the visible-light-driven photocatalytic water splitting performances of all perovskite-type oxynitrides reported to date. It is evident that the performances of rare earth oxynitrides are promising among all perovskite-type oxynitrides.
| Material | Co-catalyst (loading amount) | Reaction solution | Irradiation condition | Wave length | Activity (μmol g−1 h−1) | Ref. | |
|---|---|---|---|---|---|---|---|
| H2 | O2 | ||||||
| CaTaO2N | Rh–Cr bimetallic oxide (+1 wt% Ti oxyhydroxide) | Distilled water | 300 W Xe | ≧300 nm | 60 | 30 | 67 |
| SrTaO2N | Pt (3 wt%) | Methanol | 300 W Xe | >420 nm | 100 | 68 | |
| BaTaO2N | Pt (3 wt%) | Methanol | 300 W Xe | >420 nm | 75 | 68 | |
| BaNbO2N | CoOx (2 wt%) | 30 mM AgNO3 | 300 W Xe | >600 nm | 250 | 69 | |
| LaTa0.9Zr0.1O1+yN2−y | CoOx (2 wt%) | 0.05 M AgNO3 | 300 W Xe | >420 nm | 360 | 63 | |
| Pt (1 wt%) | 0.05 M Na2SO3 | 240 | |||||
| LaMg1/3Ta2/3O2N | RhCrOx (0.5 wt%) | Pure water | 300 W Xe | ≧300 nm | 110 | 55 | 65 |
| LaZrO2N | CoOx (3 wt%) | 10 mM AgNO3 | 300 W Xe | >400 nm | 20 | 70 | |
| LaTiO2N | Fe (1.5%)–CoOx (7 wt%) | 0.2 M AgNO3 | 300 W Xe | >420 nm | 1590 | 57 | |
| LaTiO2N | Pt–H | 10 vol% Methanol | 300 W Xe | >420 nm | 960 | 44 | |
5. Theoretical prediction of phases
In addition to the perovskite-type rare earth oxynitrides shown in the above section, from a theoretical basis, many other rare earth oxynitrides can exist in stable forms. To predict the stability of rare earth oxynitrides, tolerance71 and octahedral72 factors are usually used. Li et al.73 used an algorithm based on ionic radius to make a prediction. The results are shown in Table 3. Although it is generally believed that N and O in oxynitrides are arranged randomly, such a statement is still under debate. Nitrogen anions have a greater negative charge and larger ionic radius than oxygen anions, and oxynitrides can form perovskite structures that cannot be formed in perovskite oxides.| Site | A-site | |||||||
|---|---|---|---|---|---|---|---|---|
| Eu2+ | Sc3+ | Y3+ | La3+ | Pr3+ | Nd3+ | Sm3+ | ||
| S: the compounds which have been synthesized; P: the predicted compounds; N: the perovskite structures which are not stable; b: the non-integral compounds (EuWO1.58N1.42, LaWO0.6N2.4, LaVO2.1N0.9, and NdWO0.8N2.2). Reproduced with permission from ref. 73. Copyright 2013, the Royal Society of Chemistry. | ||||||||
| B-site | Si4+ | N | N | N | N | N | N | |
| Ge4+ | N | N | N | N | N | N | ||
| Sn4+ | N | P | P | P | P | N | ||
| Ti4+ | N | P | S/P | P | S/P | N | ||
| Zr4+ | N | P | S/P | S/P | S/P | S/P | ||
| Hf4+ | N | P | P | P | P | N | ||
| Mn4+ | N | N | N | N | N | N | ||
| Fe4+ | N | P | P | P | P | P | ||
| Co4+ | N | N | N | N | N | N | ||
| V4+ | N | P | Sb/P | P | S/P | P | ||
| Nb4+ | N | P | P | P | P | N | ||
| Ta4+ | N | P | P | P | P | N | ||
| Mo4+ | N | P | P | P | P | N | ||
| W4+ | N | P | P | P | P | N | ||
| V5+ | N | N | N | N | N | N | N | |
| Nb5+ | S/P | N | N | S/P | S/P | N | N | |
| Ta5+ | S/P | N | N | S/P | P | N | N | |
| Mo5+ | P | N | N | P | P | P | N | |
| W5+ | Sb/P | N | N | Sb/P | P | Sb/P | N | |
| Mo6+ | N | |||||||
| W6+ | P | |||||||
Using tolerance and octahedral factors to evaluate the formation of perovskite oxynitrides can determine whether the reasons for the current few types of such compounds are due to structural instability or synthetic difficulty, which provides clear guidance for the future synthesis of new perovskite oxynitrides. For instance, for potential candidates such as YSiO2N and YGeO2N, their perovskite structure is proposed to be not stable enough, while YTiO2N may be synthesized. Strikingly, Y3+, Pr3+, and Nd3+ and Hf4+, Fe4+, and Sn4+ should form some perovskite nitrogen oxides, but these compounds have not been synthesized yet. It is clear that the calculation of the tolerance and octahedral factors using the ionic radius and the prediction of corresponding oxynitrides with perovskite structures are a really instructive method, which provides a very clear direction for the exploration of new compounds.
6. Conclusion
Nowadays, the exploration of visible-light-driven photocatalysts has gradually become a research hotspot. A pre-requisite of a visible-light-driven photocatalyst is that it must have a suitable bandgap for the absorption of visible light. Towards this end, perovskite-type rare earth oxynitrides are promising candidates. Although the number of studies is still limited, the current visible-light-driven photocatalytic water splitting performances of rare earth oxynitrides are already good compared to other perovskite-type oxynitrides. By optimizing the synthetic methods and conditions, adding co-catalysts and dopants, controlling morphology and sizes, and fabricating nanostructures and nanocomposites, effective separation and migration of photo-generated electrons and holes were achieved, and the competitive recombination of electrons and holes can also be reduced.Despite the success, the bulk and surface structures of rare earth oxynitrides, and the details of photocatalytic water splitting in these systems, are still not well understood yet. For example, it is often assumed that the N3− and O2− anions are randomly distributed in the crystal lattice. However, the ionic radii, charge, and electronic properties of the two anions are quite different. As a consequence, the ideal random distribution should not exist. The partial aggregate of two anions, especially at the surface, will alter the photocatalytic performances. Such structural information is still not available in current studies. In addition, the change or decomposition of surface structures has been proposed but not well characterized yet. The development of in situ/in operando characterization techniques such as the in situ nuclear magnetic resonance (NMR)74 technique can accelerate the study of rare earth oxynitrides. Furthermore, many rare earth oxynitride phases are predicted to be stable but are still not synthesized, which will open up great opportunities for future research.
Conflicts of interest
There are no conflicts to declare.Acknowledgements
J. X. acknowledges the financial support from the National Natural Science Foundation of China (Project 21904071 and 22071115) and the Open Funds (T151904) for the State Key Laboratory of Magnetic Resonance and Atomic and Molecular Physics.Notes and references
- C.-J. Liu, U. Burghaus, F. Besenbacher and Z. L. Wang, ACS Nano, 2010, 4, 5517–5526 CrossRef CAS.
- M. G. Walter, E. L. Warren, J. R. McKone, S. W. Boettcher, Q. Mi, E. A. Santori and N. S. Lewis, Chem. Rev., 2010, 110, 6446–6473 CrossRef CAS.
- N. S. Lewis, Basic Research Needs for Solar Energy Utilization, http://www.sc.doe.gov/bes/reports/files/SEU_rpt.pdf.
- N. S. L. A. D. G. Nocera, Proc. Natl. Acad. Sci. U. S. A., 2006, 103, 15729–15735 CrossRef.
- J. O. M. Bockris and J. Klerer, J. Electrochem. Soc., 1973, 120, 19C CrossRef.
- A. Mills and S. Le Hunte, J. Photochem. Photobiol., A, 1997, 108, 1–35 CrossRef CAS.
- R. Asahi, T. Morikawa, T. Ohwaki, K. Aoki and Y. Taga, Science, 2001, 293, 269 CrossRef CAS.
- F. E. Osterloh, Chem. Mater., 2008, 20, 35–54 CrossRef CAS.
- Y. Wu, P. Lazic, G. Hautier, K. Persson and G. Ceder, Energy Environ. Sci., 2013, 6, 157–168 RSC.
- T. Takata, C. Pan and K. Domen, ChemElectroChem, 2016, 3, 31–37 CrossRef CAS.
- T. Takata, C. Pan and K. Domen, Sci. Technol. Adv. Mater., 2015, 16, 033506 CrossRef.
- M. Ahmed and G. Xinxin, Inorg. Chem. Front., 2016, 3, 578–590 RSC.
- Y. Moriya, T. Takata and K. Domen, Coord. Chem. Rev., 2013, 257, 1957–1969 CrossRef CAS.
- S. H. Porter, Z. Huang, Z. Cheng, M. Avdeev, Z. Chen, S. Dou and P. M. Woodward, J. Solid State Chem., 2015, 226, 279–285 CrossRef CAS.
- M. Yang, J. Oró-Solé, A. Kusmartseva, A. Fuertes and J. P. Attfield, J. Am. Chem. Soc., 2010, 132, 4822–4829 CrossRef CAS.
- Y. Lu, C. Le Paven, H. V. Nguyen, R. Benzerga, L. Le Gendre, S. Rioual, F. Tessier, F. Cheviré, A. Sharaiha, C. Delaveaud and X. Castel, Cryst. Growth Des., 2013, 13, 4852–4858 CrossRef CAS.
- M. Jansen and H. P. Letschert, Nature, 2000, 404, 980–982 CrossRef CAS.
- M. Ahmed and G. Xinxin, Inorg. Chem. Front., 2016, 3, 578–590 RSC.
- L. Yang, H. Zhou, T. Fan and D. Zhang, Phys. Chem. Chem. Phys., 2014, 16, 6810–6826 RSC.
- S. H. Elder, F. J. DiSalvo, L. Topor and A. Navrotsky, Chem. Mater., 1993, 5, 1545–1553 CrossRef CAS.
- P. A. Fuierer and R. E. Newnham, J. Am. Ceram. Soc., 1991, 74, 2876–2881 CrossRef CAS.
- L. Shcherbakova, L. Mamsurova and G. Sukhanova, Russ. Chem. Rev., 2007, 48, 228 CrossRef.
- J. Takahashi and T. Ohtsuka, J. Am. Ceram. Soc., 1989, 72, 426–431 CrossRef CAS.
- B. L. Cushing, V. L. Kolesnichenko and C. J. O’Connor, Chem. Rev., 2004, 104, 3893–3946 CrossRef CAS.
- A. V. Prasadarao, U. Selvaraj, S. Komarneni and A. S. Bhalla, J. Mater. Res., 1992, 7, 2859–2863 CrossRef CAS.
- M. M. Milanova, M. Kakihana, M. Arima, M. Yashima and M. Yoshimura, J. Alloys Compd., 1996, 242, 6–10 CrossRef CAS.
- X. Chen, J. Xu, Y. Xu, F. Luo and Y. Du, Inorg. Chem. Front., 2019, 6, 2226–2238 RSC.
- T. Okubo and M. Kakihana, J. Alloys Compd., 1997, 256, 151–154 CrossRef CAS.
- R. Abe, M. Higashi, K. Sayama, Y. Abe and H. Sugihara, J. Phys. Chem. B, 2006, 110, 2219–2226 CrossRef CAS.
- M. Higashi, R. Abe, K. Sayama, H. Sugihara and Y. Abe, Chem. Lett., 2005, 34, 1122–1123 CrossRef CAS.
- S. Sato, T. Murakata, H. Yanagi, F. Miyasaka and S. Iwaya, J. Mater. Sci., 1994, 29, 5657–5663 CrossRef CAS.
- D. Chen and R. Xu, Mater. Res. Bull., 1998, 33, 409–417 CrossRef CAS.
- D. Arney, B. Porter, B. Greve and P. A. Maggard, J. Photochem. Photobiol., A, 2008, 199, 230–235 CrossRef CAS.
- M. Katsura, J. Alloys Compd., 1992, 182, 91–102 CrossRef CAS.
- S. G. Ebbinghaus, H.-P. Abicht, R. Dronskowski, T. Müller, A. Reller and A. Weidenkaff, Prog. Solid State Chem., 2009, 37, 173–205 CrossRef CAS.
- T. Takata, D. Lu and K. Domen, Cryst. Growth Des., 2011, 11, 33–38 CrossRef CAS.
- A. E. Maegli, S. Pokrant, T. Hisatomi, M. Trottmann, K. Domen and A. Weidenkaff, J. Phys. Chem. C, 2013, 118, 16344–16351 CrossRef.
- A. Gomathi, S. Reshma and C. N. R. Rao, J. Solid State Chem., 2009, 182, 72–76 CrossRef CAS.
- D. Ostermann, H. Jacobs and B. Harbrecht, Z. Anorg. Allg. Chem., 1993, 619, 1277–1282 CrossRef CAS.
- N. Arumugam, A. Hönnerscheid and M. Jansen, Z. Anorg. Allg. Chem., 2003, 629, 939–941 CrossRef CAS.
- Y. Cohen and I. Riess, J. Mater. Sci. Eng. B, 1994, 25, 197–202 CrossRef CAS.
- R. Aguiar, D. Logvinovich, A. Weidenkaff, H. Karl, C. W. Schneider, A. Reller and S. G. Ebbinghaus, Mater. Res. Bull., 2008, 43, 1376–1383 CrossRef CAS.
- M. Sakar, R. M. Prakash, K. Shinde and G. R. Balakrishna, Int. J. Hydrogen Energy, 2020, 45, 7691–7705 CrossRef CAS.
- Y. Li, X. Cheng, X. Ruan, H. Song, Z. Lou, Z. Ye and L. Zhu, Nano Energy, 2015, 12, 775–784 CrossRef CAS.
- X. Wang, T. Hisatomi, Z. Wang, J. Song, J. Qu, T. Takata and K. Domen, Angew. Chem., Int. Ed., 2019, 58, 10666–10670 CrossRef CAS.
- J. Zhou, C. Zhou, Z. Shi, Z. Xu, S. C. Yan and Z. Zou, J. Mater. Chem. A, 2018, 6, 7706–7713 RSC.
- A. Kasahara, K. Nukumizu, T. Takata, J. N. Kondo, M. Hara, H. Kobayashi and K. Domen, J. Phys. Chem. B, 2003, 107, 791–797 CrossRef CAS.
- A. P. Black, H. Suzuki, M. Higashi, C. Frontera, C. Ritter, C. De, A. Sundaresan, R. Abe and A. Fuertes, Chem. Commun., 2018, 54, 1525–1528 RSC.
- C. Pan, T. Takata, M. Nakabayashi, T. Matsumoto, N. Shibata, Y. Ikuhara and K. Domen, Angew. Chem., Int. Ed., 2015, 54, 2955–2959 CrossRef CAS.
- M. Hojamberdiev, M. F. Bekheet, J. N. Hart, J. J. M. Vequizo, A. Yamakata, K. Yubuta, A. Gurlo, M. Hasegawa, K. Domen and K. Teshima, Phys. Chem. Chem. Phys., 2017, 19, 22210–22220 RSC.
- K. Kawashima, M. Hojamberdiev, H. Wagata, E. Zahedi, K. Yubuta, K. Domen and K. Teshima, J. Catal., 2016, 344, 29–37 CrossRef CAS.
- M. Yashima, M. Saito, H. Nakano, T. Takata, K. Ogisu and K. Domen, Chem. Commun., 2010, 46, 4704–4706 RSC.
- S. J. Clarke, B. P. Guinot, C. W. Michie, M. J. C. Calmont and M. J. Rosseinsky, Chem. Mater., 2002, 14, 288–294 CrossRef CAS.
- S. Ninova and U. Aschauer, J. Mater. Chem. A, 2017, 5, 11040–11046 RSC.
- N. Nishimura, K. Maeda, T. Takata, D. Lu, J. Kubota and K. Domen, Bull. Chem. Soc. Jpn., 2013, 86, 540–546 CrossRef CAS.
- A. Kasahara, K. Nukumizu, G. Hitoki, T. Takata, J. N. Kondo, M. Hara, H. Kobayashi and K. Domen, J. Phys. Chem. A, 2002, 106, 6750–6753 CrossRef CAS.
- Y. Li, F. Li, X. Li, H. Song, Z. Lou, Z. Ye and L. Zhu, Nano Energy, 2016, 19, 437–445 CrossRef CAS.
- R. B. Singh, H. Matsuzaki, Y. Suzuki, K. Seki, T. Minegishi, T. Hisatomi, K. Domen and A. Furube, J. Am. Chem. Soc., 2014, 136, 17324–17331 CrossRef CAS.
- C. Lawley, M. Nachtegaal, J. Stahn, V. Roddatis, M. Dobeli, T. J. Schmidt, D. Pergolesi and T. Lippert, Nat. Commun., 2020, 11, 1728 CrossRef CAS.
- R. Abe, J. Photochem. Photobiol., C, 2010, 11, 179–209 CrossRef CAS.
- N. Cordes and W. Schnick, Chem. – Eur. J., 2017, 23, 11410–11415 CrossRef CAS.
- M. Liu, W. You, Z. Lei, T. Takata, K. Domen and C. Li, Chin. J. Catal., 2006, 27, 556–558 CrossRef CAS.
- Y. Wang, S. Jin, G. Pan, Z. Li, L. Chen, G. Liu and X. Xu, J. Mater. Chem. A, 2019, 7, 5702–5711 RSC.
- K. Maeda, K. Teramura, H. Masuda, T. Takata, N. Saito, Y. Inoue and K. Domen, J. Phys. Chem. B, 2006, 110, 13107–13112 CrossRef CAS.
- C. Pan, T. Takata and K. Domen, Chem. – Eur. J., 2016, 22, 1854–1862 CrossRef CAS.
- Z. Pan, T. Hisatomi, Q. Wang, M. Nakabayashi, N. Shibata, C. Pan, T. Takata and K. Domen, Appl. Catal., A, 2016, 521, 26–33 CrossRef CAS.
- J. Xu, C. Pan, T. Takata and K. Domen, Chem. Commun., 2015, 51, 7191–7194 RSC.
- D. Yamasita, T. Takata, M. Hara, J. N. Kondo and K. Domen, Solid State Ionics, 2004, 172, 591–595 CrossRef CAS.
- T. Hisatomi, C. Katayama, K. Teramura, T. Takata, Y. Moriya, M. Katayama, H. Nishiyama, T. Yamada and K. Domen, ChemSusChem, 2014, 7, 2016–2021 CrossRef CAS.
- A. P. Black, H. Suzuki, M. Higashi, C. Frontera, C. Ritter, C. De, A. Sundaresan, R. Abe and A. Fuertes, Chem. Commun., 2018, 54, 1525–1528 RSC.
- C. J. Bartel, C. Sutton, B. R. Goldsmith, R. Ouyang, C. B. Musgrave, L. M. Ghiringhelli and M. Scheffler, Sci. Adv., 2019, 5, eaav0693 CrossRef CAS.
- W. Travis, E. N. K. Glover, H. Bronstein, D. O. Scanlon and R. G. Palgrave, Chem. Sci., 2016, 7, 4548–4556 RSC.
- W. Li, E. Ionescu, R. Riedel and A. Gurlo, J. Mater. Chem. A, 2013, 1, 12239–12245 RSC.
- X. L. Wang, W. Liu, Y.-Y. Yu, Y. Song, W. Q. Fang, D. Wei, X.-Q. Gong, Y.-F. Yao and H. G. Yang, Nat. Commun., 2016, 7, 11918 CrossRef CAS.
Footnote |
| † Electronic supplementary information (ESI) available. For ESI and crystallographic data in CIF or other electronic format see DOI: 10.1039/d0ma00867b |
| This journal is © The Royal Society of Chemistry 2021 |


