 Open Access Article
Plasmonic triangular nanoprism sensors
Joe
Otsuki
 *,
Kosuke
Sugawa
 * and
Shota
Jin
College of Science and Technology, Nihon University, 1-8-14 Kanda Surugadai, Chiyoda-ku, Tokyo 101-8308, Japan. E-mail: otsuki.joe@nihon-u.ac.jp; sugawa.kosuke@nihon-u.ac.jp
First published on 8th December 2020
Abstract
When light impinges on metallic nanostructures, the free electrons oscillate in resonance with the incident light, producing intense scattering and absorption, which is called the localized surface plasmon resonance (LSPR). The electromagnetic field in the immediate vicinity within several nanometres from the surface of the nanostructure can be greatly enhanced. As the LSPR is sensitive to a variety of parameters of and around the nanostructures, the changes in one or more of the parameters can be exploited for sensing purposes. Au and Ag triangular nanoprisms have a number of advantages as LSPR-based sensor materials. This review article outlines the physics behind LSPR sensors, properties of nanoprisms, chemical and photochemical preparation of Au and Ag nanoprisms as well as nanosphere lithography, and finally, research studies on sensor applications. The sensor applications are categorized according to sensing mechanisms: (i) sensors based on refractive index changes, (ii) sensors based on etching, (iii) sensors based on aggregation, (iv) sensors utilizing luminescence enhancement effects and (v) sensors utilizing photothermal conversion. Finally, the review is concluded with outlooks and challenges.
1 LSPR—old materials in new light
Metallic nanoparticles responsible for the dazzling colours of stained glass are being reborn as state-of-the-art functional materials in new light of nanoscience and nanotechnology. When a plane wave of light impinges upon a small metal particle, the electromagnetic field is perturbed due to the difference in the electric permittivities (refractive indexes) between the metal and the surroundings. The unique feature of metals is the presence of free electrons that oscillate in harmony with the incoming oscillating electric field. When certain conditions are met, the incident oscillating electric field resonates with the oscillation of electrons. The resonance is called the localized surface plasmon resonance (LSPR).1–4 The resonance conditions are sensitive to the size and shape of the nanoparticles as well as the immediate environment. The electric field in the vicinity of the nanoparticle may be greatly enhanced, promoting radiative transition processes of nearby molecules. The absorption coefficient of metallic nanoparticles may be extremely high that temperature in the vicinity may increase efficiently. These properties unique to metal nanoparticles are utilized as principles of sensing.5,6 There are many substances either of natural origin or artificially synthesized that require detection, quantification and monitoring, either in the environment, in specific products or in biological entities including the human body. Plasmon-based sensors are promising technologies that can address many of the issues to be resolved, due to many advantages over other methods as will be described in this review.First, we overview the physics behind the LSPR in a simplified way to grab the main principles clearly without being bothered by the details. Next we briefly describe the properties of Au and Ag, which are the most often employed metallic species for sensors. The advantages of triangular nanoprisms—the theme of this review—are then described followed by fabrication methods of these nanoprisms. With these backgrounds, reported sensors are reviewed, which are classified according to the mechanism of sensing. Finally, brief conclusions are made with outlooks and challenges.
Metals have a partially filled highest-energy band. For example, the electronic configurations of Au and Ag are [Xe] 4f14 5d10 6s1 and [Kr] 4d10 5s1, respectively. The d-band is filled and the s-band (hybridized with the p band) is partially filled. Electrons in the partially filled band are the free electrons as minimum energy perturbations can cause the intraband transitions.7 The Drude model treats the free electrons in a metal, which respond to an externally applied electric field E = E0e−iωt oscillating at angular frequency ω. Newton's formula for an electron in the metal in this treatment is given by
 | (1) |
 | (2) |
 | (3) |
Not only the free electrons but bound electrons also respond to the applied electric field. This process corresponds to the interband transition of electrons from the 5d-band into the 6s-band and those in the 4d-band into the 5s-band in the cases of Au and Ag, respectively. The bound electron is treated as a mass on a string in the Lorentz model.
 | (4) |
 | (5) |
The overall polarization is given by the sum of these two contributions and so is the overall electric susceptibility. The relative permittivity which is related to the electric susceptibility according to εr = 1 + χ, in turn, is given by8
 | (6) |
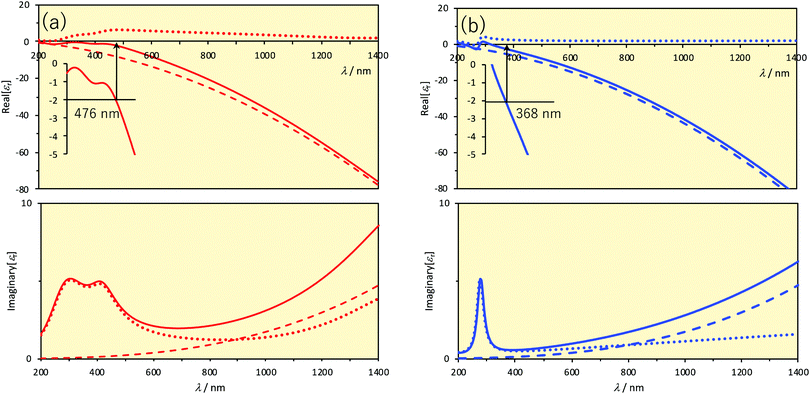 | ||
| Fig. 1 Relative permittivities versus wavelength. The upper and lower panels show the real and imaginary parts, respectively. Solid lines represent the relative permittivities. Dashed lines represent the contribution of the first (= 1) and second terms (Drude) and dotted lines represent the contribution of the terms in the sum symbol (Lorentz) of eqn (6). Inset of the upper panels displays the magnification and the Frölich condition for a small sphere in vacuum (Real[εr] = −2). Parameter values are taken from the literature.8 (a) Au. (b) Ag. | ||
As far as the metal particle is spherical and much smaller than the wavelength of light, the electric field produced by the oscillating electrons is equivalent to the electric field produced by a single dipole located at the particle centre (Rayleigh scattering). The electric field outside of the nanoparticle (Eout) is approximated as the sum of the applied field (E0) and the electric field produced by the dipole.4,9 In the case that electric field in the x direction is applied to a nanoparticle with a radius a, Eout is given by
 | (7) |
![[x with combining circumflex]](https://www.rsc.org/images/entities/b_i_char_0078_0302.gif) , ŷ and ẑ are the unit vectors along the Cartesian coordinates and εnp and εout are the relative permittivities of the nanoparticle and the outside medium, respectively. This formula shows that the electric field can be stronger than applied in the vicinity of the nanoparticle.
, ŷ and ẑ are the unit vectors along the Cartesian coordinates and εnp and εout are the relative permittivities of the nanoparticle and the outside medium, respectively. This formula shows that the electric field can be stronger than applied in the vicinity of the nanoparticle.
The electromagnetic field produced by the oscillating electrons is defined to be the scattering field. The electric field outside of the nanoparticle (Eout) is the sum of the incident electric field (E0![[x with combining circumflex]](https://www.rsc.org/images/entities/b_i_char_0078_0302.gif) ) and the scattering field (second term in eqn (7)). However, the power in the medium (Wout) is not the sum of power of the incident (Winc) and scattering (Wsca) fields because these values are not linear with respect to the field but to the field squared. The difference between the power outside the nanoparticle and the sum of incident and scattering power is defined as extinction (Wext).
) and the scattering field (second term in eqn (7)). However, the power in the medium (Wout) is not the sum of power of the incident (Winc) and scattering (Wsca) fields because these values are not linear with respect to the field but to the field squared. The difference between the power outside the nanoparticle and the sum of incident and scattering power is defined as extinction (Wext).
| Wout = Winc + Wsca − Wext | (8) |
| Wout = Winc − Wabs | (9) |
| Wext = Wsca + Wabs | (10) |
In the Rayleigh scattering regime, or taking the lowest order terms in a/λ from the exact Mie solutions, the cross-sections of scattering (σsca), extinction (σext), and absorption (σabs) are given by
 | (11) |
 | (12) |
and hence all of the electric field, scattering, extinction and absorption will be maximized under the condition
| εnp = −2εout | (13) |
The wavelengths at which the Frölich condition is satisfied in vacuum or in air (εout = 1) are indicated in Fig. 1. In the case of small spherical Au nanoparticles, the LSPR is observed at around 480 nm and in the case of Ag, it is observed at around 370 nm. We can see that the resonance wavelength will be shifted if the permittivity, or the refractive index (nout = εout1/2 for a non-absorbing medium), surrounding the nanoparticle is changed. This is one of the important mechanisms on which LSPR sensors are based. Another thing we can see is that the LSPR wavelengths are somewhat too short for practical applications for small, spherical nanoparticles of Au and Ag, particularly when biological applications are intended. The spectral regions in which biological fluids have low absorption and so little interference are called the biological windows. There are two such wavelength ranges: the first (700–950 nm) and second (1000–1350 nm) biological windows. Larger spherical particles exhibit the LSPR at more red-shifted wavelengths, but not so much as one might desire. For Ag nanospheres, the LSPR peak wavelength is shifted from 354 nm to 590 nm with an increasing size from 5 nm to 100 nm.2 For Au, the LSPR peak is shifted from 505 nm to 534 nm on going from a radius of 1.8 nm to 24 nm.11 Larger nanospheres also exhibit higher order resonances but in a shorter wavelength range. Anisotropic nanoparticles exhibit LSPR at wavelengths much more red-shifted. There will be large electric fields near high-curvature regions such as edges and tips of various geometrical shapes (lightning rod effects). Particularly attractive shape so far among a variety of anisotropic nanoparticles is the triangular nanoprisms. As the LSPR wavelength is sensitive to truncation or rounding of tips of nanoprisms, etching the nanoprisms can be another basis for sensing. Another factor that determines the LSPR wavelength is the electromagnetic coupling between nanoparticles when two or more nanoparticles are closely positioned. Thus, analyte-induced aggregation/disaggregation can be yet another mechanism for sensing.
The LSPR has a number of interesting properties:
(1) The LSPR can be directly excited by free-space incident light, which makes the system much simpler and more cost-effective than macroscopic propagating surface plasmon resonance apparatus. The conventional propagating surface plasmon cannot be excited by just shining light on the metal surface because the momentum conservation would not be satisfied.
(2) The LSPR can have very high extinction coefficients.12
(3) The LSPR is sensitive to the various parameters of and around the nanoparticles. Material (metal species), size, shape, and surface chemistry all have influences. The aggregation states of the nanoparticles also have an influence as well as the nanoenvironment.
(4) Greatly enhanced local electromagnetic field is aroused.
(5) The penetration length or decay length, which is the distance from the surface up to where the fields are enhanced, is in the order of a few nanometres.13,14 In other words, nanoparticles are sensitive to the environment only in the immediate vicinity but not to the bulk environment.15 This is in contrast to the propagating surface plasmon resonance, in which the decay length is in the subwavelength scale, i.e., a few hundreds of nanometres.16
(6) Radiative processes occurring in the vicinity of nanoparticles are accelerated. As a result, luminescence (fluorescence and phosphorescence) of luminophore molecules placed near a metal nanoparticle may be enhanced. Also, however, metal nanoparticles can facilitate the nonradiative decay of the excited state to the ground state of nearby molecules. Hence, luminescence may be quenched. These opposing effects have different dependence on the distance between the luminophore and the metal surface. Therefore, tuning of the distance is important to make use of these phenomena.
(7) The LSPR may induce electron transfer from the nanoparticles to a nearby substance, e.g., semiconductors.17,18
Other than mentioned above, metallic nanoparticles can serve as a platform for surface-enhanced Raman scattering, which enormously enhances Raman signals of molecules positioned near the surfaces of metal nanoparticles.19 The surface-enhanced infrared absorption is another phenomenon derived from the LSPR to be exploited for sensitivity enhancement for analytical purposes.20 These are powerful tools for sensing because techniques based on these phenomena can not only detect and quantify the presence of an analyte but differentiate analytes by using unique signals from particular species. The surface-enhanced vibrational spectroscopy is out of the scope of this review article.
2 Why Au and Ag nanoprisms?
Au, Ag and Cu are attractive for plasmonic materials because these three coinage metals have particularly a small imaginary component of permittivity, thus low Ohmic heating losses, in the visible to near-IR spectroscopic range.21,22 Among these, Cu has been less explored as a sensor material because Cu has the largest imaginary part of permittivity and is most readily oxidized under ambient conditions.23,24 We are not aware of copper-based plasmonic nanoprism sensors, although advances have been made in the fabrication and protection from oxidation of anisotropic Cu nanoparticles.25–28 Therefore, we focus our attention to nanoprisms made of Au and Ag.29One of the advantages of Ag is that the LSPR peak position is away from the interband transitions, as can be seen from Fig. 1. Furthermore, the LSPR peak of Ag is sharper than that of Au, represented by a higher quality factor, Q (see Section 4.1).30 In terms of the Drude model, Ag has a smaller damping parameter γ0 than Au and Cu.31 Despite these advantages, Ag nanoparticles are unstable under physiological or atmospheric conditions.32–34 Ag nanoparticles can be protected by coating the surface; or seeing from the opposite perspective, the reactivity can be exploited as a mechanism for sensing.
For the enhancement of electric and magnetic fields, the nanoparticle shape plays an important role. The electromagnetic fields are most effectively enhanced at sharp points such as tips and edges. A variety of nanoparticles with anisotropic shapes have been fabricated, which include nanoprisms, nanodisks and nanorods, to name a few. For sensing applications, any anisotropic nanostructure may be employed in principle. In practice, the nanoprism, which has two parallel triangular faces closed by three rectangular sides, is one of the most employed nanostructures for sensing applications.
The advantages of the nanoprism structure include:35
(1) Nanoprisms have sharp tips and edges for the enhancement of the electromagnetic field and associated high sensitivity.
(2) Nanoprisms have well-defined geometrical parameters, i.e., the thickness and the edge length. This contrasts, for example, to nanostars, which have multiple sharper tips and generate stronger electromagnetic fields and hence may be beneficial for sensing. However, efforts are still in progress for obtaining nanostars with homogeneous shapes and sizes.36,37
(3) The nanoprisms have well-defined crystal faces. The flat top and bottom triangles faces are (111) facets.38,39
(4) Reproducible fabrication techniques, including the methods to tune the geometrical parameters and hence the LSPR wavelength, have been established for Au and Ag nanoprisms. Besides, with the nanosphere lithography (NSL), ordered arrays of triangular prisms intrinsically form.
Let us take a quick look at the LSPR properties of nanoprisms, taking Ag nanoprisms (Ag NPrs) as an example. Since exact analytical solutions to boundary condition problems in electromagnetic scattering are only known for spherical nanoparticles (Mie solutions), numerical approaches, such as the discrete dipole approximation and the finite-difference time-domain method, are required for analysis of electromagnetic distribution and other properties of triangular nanoparticles. Fig. 2a shows the simulated extinction spectra of Ag NPrs by discrete dipole approximation, which resemble the observed spectra very closely.9 Peaks unique to the nanoprism structure, not seen for nanospheres, appear at 335, 430 (broad), 460 and 770 nm in the case of the sharp tip nanoprism. These peaks are assigned to the out-of-plane quadrupole resonance, the out-of-plane dipole resonance, the in-plane quadrupole resonance and the in-plane dipole resonance, respectively. The calculations indicate that the position of the most prominent in-plane dipole LSPR peak is very sensitive to the tip truncation. Another discrete dipole approximation calculations showed that the wavelength of the lowest energy, in-plane dipole mode LSPR of Ag NPrs, is linearly dependent on the edge length (L) and the inverse of the thickness (T) and the relationship is given by ΔλLSPR/nm = 31 × Δ(L/T) in water.35 This linear relationship was experimentally confirmed: λLSPR/nm = 33.8(L/T) + 418.8.40
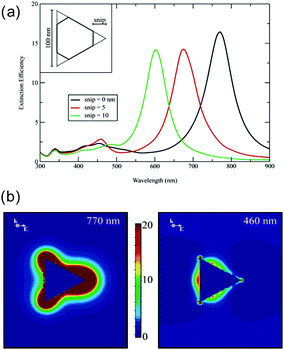 | ||
| Fig. 2 LSPR properties of Ag NPrs. (a) Extinction spectra. (b) Electric field enhancement at two different wavelengths. Reprinted with permission from K. L. Kelly et al., J. Phys. Chem. B, 2003, 107, 668–677. Copyright (2003) American Chemical Society.9 | ||
A large electric field enhancement occurs at a gap region (hot spots) between the tips of nanostructures closely disposed. Fig. 3 shows the simulation results by the discrete dipole approximation for a head-to-head dimer of Ag NPrs separated by 2 nm.41 For the x-polarization, which is perpendicular to the triangle plane, and the z-polarization, which lies in the triangle plane but perpendicular to the interparticle axis of dimer, the extinction spectra are similar to those of the monomer. However, in the case of the y-polarization along the interparticle axis, new extinction peaks appear, one at 932 nm and another at 550 nm. The long wavelength peak is assigned to the dipole resonance and the shorter wavelength peak is assigned to the quadrupole resonance. Fig. 3b shows the electric field enhancement at the respective wavelength in the y-polarization. In the gap, the calculated electric field squared (|E|2) was 53000 and 5700 times the applied field squared at respective wavelengths.
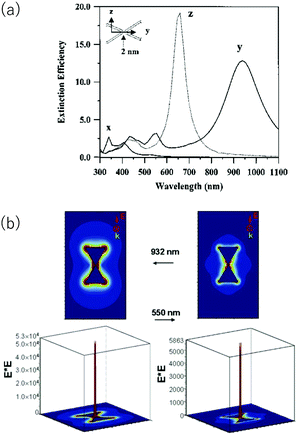 | ||
| Fig. 3 Discrete dipole approximation simulation of a head-to-head dimer of Ag NPrs. (a) Polarization dependent extinction spectra. (b) Electric field enhancement. Reprinted from Hao and Schatz, J. Chem. Phys., 2004, 120, 357–366, with the permission of AIP Publishing.41 | ||
3 Preparation of Au and Ag nanoprisms
For any applications and mechanistic studies, reproducible, high-yield production methods of uniform nanoprisms are essential. Furthermore, the tunability of geometric parameters, i.e., thickness and edge length, is highly desirable. There are two main approaches to the fabrication of nanostructures in general. One is the top-down approach and the other is the bottom-up approach. In the top-down approach, a macroscopic substrate is cut into nanoscale objects. Lithographical techniques, such as the electron-beam lithography, typify the top-down approach. The top-down approach excels in designability, precision, and reproducibility, but compromised by the high cost of the equipment and a small area of fabrication. The bottom-up approach is exemplified by preparation by wet chemistry, which can be done using benchtop equipment and glassware. It is difficult to predict the resultant nanostructures as there are many parameters in the preparation processes, such as the kind of reagents used, the amount of reagents and solvents used, reaction temperatures and time, the order of addition of reagents, etc. Owing to the studies performed by pioneering and subsequently by many researchers, however, preparation procedures of Au and Ag nanoprisms are now well established. Once the protocol is established, the bottom-up fabrication can be done with less cost and amenable for large-scale production. Finally, in the case of nanoprisms, there is a hybrid approach that has both top-down and bottom-up aspects, which is the NSL. In this section, we focus on the chemical (or photochemical) methods and the NSL.3.1 Preparation of Au nanoprisms
In the method reported by Mirkin et al., the seed particles were produced by reducing HAuCl4 by NaBH4 in the presence of trisodium citrate.38 The seed solution was added to three solutions, each with different concentrations of HAuCl4, NaOH and ascorbic acid, in a stepwise manner. This seed mediated growth method produced a mixture of spherical and triangular Au NPrs. Ha and Chung et al. prepared Au NPrs with a seed mediated growth method in the presence of KI.42 They found that the addition of a small amount of I− ions (∼20 μM) directed the growth reaction towards triangular nanoprisms.Yang, Zhang and co-workers then developed a simple purification procedure of Au NPrs from mixtures with nanospheres.43 Triangular nanoprisms tend to aggregate and precipitate in water with a high salt concentration (>0.05 M CTAB or 0.2 M CTAB + NaCl, where CTAB (cetyltrimethylammonium bromide) is a surfactant), leaving behind spherical byproducts. The reaction mixture was left undisturbed for a certain period of time (12 h) and the precipitate was collected by decanting off the supernatant solution, affording Au NPrs with a high purity of ∼97%. At high salt concentrations, the positive surface charge due to the adsorbed cetyltrimethylammonium cation is effectively neutralized, reducing the repulsion between the nanoparticles. The aggregation occurs more efficiently for nanoprisms due to the flat surfaces compared to nanospheres. The right conditions facilitate the selective precipitation of nanoprisms.
Later, Zhang et al. found that the right protocol yielded Au NPrs in a simple and quick one-pot reaction, even though the reagents used were almost the same as those reported previously.44 In the procedure, the following solutions were added sequentially to a solution of hexadecyltrimethylammonium chloride (CTAC): a solution of KI, a solution of HAuCl4, a solution of NaOH, a solution of ascorbic acid, and finally, a solution of NaOH again. The colourless solution turned red, purple, and blue, which occurred within ∼10 min. This seedless method is quick, reproducible, and is free of purification steps. The edge length can be controlled by adjusting the concentrations of ascorbic acid, KI, and NaOH. The authors proposed dual roles of I− ions in the reaction mixture. Iodide ions selectively bind to the Au(111) facets, preventing the growth in this direction, and etch less-stable-shaped impurities by I3−, which forms upon oxidation of I− by O2, resulting in the selective formation of triangular plates (Fig. 4).
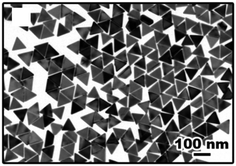 | ||
| Fig. 4 Au NPrs prepared by a one-pot reaction. Reprinted with permission from L. Chen et al., Nano Lett., 2014, 14, 7201–7206. Copyright (2014) American Chemical Society.44 | ||
The above-mentioned preparation of Au NPrs uses the surfactant, CTAB or CTAC, as a stabilizing agent. These surfactants denature biomacromolecules and are cytotoxic, and hence, are not suitable for bio and medical applications. For biocompatible Au NPrs, surfactant-free preparation was attempted.45 It seems, however, that further studies are required for the preparation of high-quality surfactant-free Au NPrs.
3.2 Photochemical preparation of Ag nanoprisms
Ag NPrs are produced either by photochemical methods or chemical (thermal) methods. In 2001, Mirkin, Schatz and co-workers reported a photoinduced method for synthesizing large quantities of Ag NPrs in high yield in the form of a colloidal suspension.39 The initial Ag nanospheres were produced by reducing AgNO3 by NaBH4 in the presence of additives, trisodium citrate and bi(p-sulfonatophenyl)phenylphosphine dihydrate dipotassium salt, in an aqueous solution. The solution of Ag nanospheres (8 nm) was irradiated by visible light for tens of hours. This procedure resulted in the formation of uniform triangular Ag NPrs with a thickness of 8 nm and an edge length of 100 nm. Soon after this initial report, the same group succeeded in tuning the edge length of the nanoprism and obtaining insight into the role of light in the transformation process of nanospheres into nanoprisms.46 They used two beams of light with different wavelengths. When only a single beam of 550 nm light was irradiated, bimodal growth occurred resulting in the formation of two types of nanoprisms with edge lengths of 70 nm and 150 nm, which was nearly twice the former. A secondary beam of wavelength of 340 nm or 450 nm suppressed the formation of the larger nanoprism, thus succeeding in the synthesis of uniform-sized Ag NPrs. These wavelengths of secondary beams of light coincide, respectively, with the out-of-plane and in-plane quadrupole modes of the smaller Ag NPrs. Authors suggested that the excitation of quadrupole modes of the smaller nanoprisms suppressed the fusion into the larger Ag NPrs. They further succeeded in tuning the edge length of nanoprisms in the range of 30–120 nm by changing the wavelength of the primary beam of light. In addition, the thickness was controlled by the Ag+ concentration.47 The same group later discovered that basic pH conditions of the growth solution can suppress the fusion of the small nanoprisms due to the negative surface charge and succeeded in using a single beam of light to produce unimodal Ag NPrs.48 We have recently established that the LSPR of Ag NPrs can be tuned within 500–600 nm by sequential irradiation of 470 nm and 525 nm light to the Ag nanospheres for predetermined periods of time.49The photochemical method can produce high quality Ag nanoprisms with controlled sizes. Furthermore, the small-molecule protective reagent, i.e., citrate, used in the photochemical method is beneficial with regard to sensitivity because the analyte can approach closer to the surface of nanoprisms compared to polymer-protected nanoparticles. On the other hand, photochemical methods take time on the order of tens of hours and a large-scale production is limited.50
3.3 Chemical preparation of Ag nanoprisms
Generally, chemical (or thermal) synthesis is much quicker than photochemical synthesis and often completed on the order of minutes. A chemical protocol that affords Ag NPrs with a unimodal size distribution was reported by the Mirkin group in 2005.51 In brief, AgNO3 was reduced by NaBH4 in the presence of trisodium citrate, poly(vinylpyrrolidone) and H2O2. The time-course of the extinction spectra suggested that initially formed Ag nanospheres transformed into nanoprisms. The concentration of NaBH4 had a significant impact on the sizes of the generated nanoprisms. As the concentration of NaBH4 was increased from 0.3 mM to 0.8 mM, the thickness decreased from 7.0 nm to 4.3 nm, while the edge length showed a modest increase from 31 nm to 39 nm. Later, Yin and co–workers revealed the role played by each of the additives in the growth processes in detail.52A two-step synthesis protocol, in which seed preparation was followed by a growth step to produce monodisperse Ag NPrs with high yield, was developed by Aherne, Kelly and co-workers.40 In this protocol, seed Ag nanoparticles were synthesized first by the reduction of AgNO3 by NaBH4 in the presence of trisodium citrate and poly(sodium styrenesulphonate). The seed solution was then combined with ascorbic acid and additional AgNO3 to induce the growth of the seeds into Ag NPrs. Efforts are being continued to improve the various aspects of Ag NPr preparation such as the available size range of nanoprisms50,53 and simplicity of the procedure.54 The reaction times of chemical methods are often much shorter than those of photochemical methods. One of the disadvantages is that chemical methods use polymer protective agents which may limit the sensitivity of nanoprisms.55
3.4 Stabilization of Ag nanoprisms
As Ag nanoparticles are prone to oxidation or etching, it must be stabilized. Coating the surface is the most frequently used method to protect the Ag nanoparticle surface. The coating layer must be thick enough for protection purposes but at the same time thin enough to utilize the LSPR because the enhanced local field only extends a few nanometres from the surface. Among various candidates, Au is the most favourable choice for coating for a couple of reasons: (i) the bulk crystal structures of Ag and Au are nearly identical, having a face-centred cubic structure (space group: Fm![[3 with combining macron]](https://www.rsc.org/images/entities/char_0033_0304.gif) m) with a lattice constant of 4.08 Å; and (ii) organic thiols bind strongly, enabling easy surface modification. However, there is a problem of galvanic replacement, in which atomic Ag is oxidized into Ag+ and dissolves in water while atomic Au is deposited from its precursor ion AuCl4−, as the redox potentials for AuCl4−/Au, which is 0.99 V vs. SHE (standard hydrogen electrode), is more positive than that of Ag+/Ag, which is 0.80 V vs. SHE.34
m) with a lattice constant of 4.08 Å; and (ii) organic thiols bind strongly, enabling easy surface modification. However, there is a problem of galvanic replacement, in which atomic Ag is oxidized into Ag+ and dissolves in water while atomic Au is deposited from its precursor ion AuCl4−, as the redox potentials for AuCl4−/Au, which is 0.99 V vs. SHE (standard hydrogen electrode), is more positive than that of Ag+/Ag, which is 0.80 V vs. SHE.34
Edge-selective Au coating was done by combining HAuCl4 and ascorbic acid with a solution of citrate-capped Ag NPrs.34 The Au deposition occurred preferentially on the edge sides of the nanoprism until the edges were completely filled. Excess addition of HAuCl4 led to galvanic replacement resulting in pinholes in the nanoprisms. Selective coating on the edges was achieved by choosing an appropriate amount of HAuCl4. The edge-protected Au NPrs were resistant to etching by the Cl− ions, even though the flat surfaces were still exposed, suggesting that the etching occurs predominantly on the edges and not on the flat (111) faces of the nanoprism. In another protocol, solutions of hydroxylamine as a reducing agent and HAuCl4 were slowly added to a solution of Ag NPrs.56 Au was preferentially deposited on the edge faces of the Ag NPrs. This method preserved the triangular shape and sharp tips. Also, fully Au-coated Ag NPrs were produced by using hydroxylamine as a weaker reductant than ascorbic acid.57 In this method, pinholes were produced but refilled with Au/Ag alloys.
For Ag NPrs immobilized on a glass slide, we have investigated the effect of coating of Ag NPrs by alkane thiol self-assembled monolayers (SAMs) on the stability as well as sensitivity.58 While the bare Ag NPrs showed ∼10% decrease in the extinction intensity in 3 hours when kept in ethanol, but SAM-protected Ag NPrs showed negligible changes in the LSPR extinction spectra even with a short hydrocarbon (C6H13SH) SAM. The sensitivity of these SAM protected Ag NPrs was only 4% less than the sensitivity of the bare Ag NPrs.
3.5 Nanosphere lithography
The NSL was introduced by Hulteen and Van Duyne in 1995 for the preparation of ordered arrays of nearly triangular metal islands.59 The method is schematically illustrated in Fig. 5. In this method, a mask is created by spin coating polystyrene nanospheres of a few hundreds of nanometres on a substrate. The substrate can be as large as a centimetre scale. The polystyrene spheres organize themselves into a close-packed hexagonal monolayer array (double layers can also be prepared by using a more concentrated colloidal solution). Then, the metal is vapour deposited over the monolayer array of nanospheres. Finally, the nanospheres are removed by dissolving them in an organic solvent with the aid of brief sonication or simply by stripping with adhesive tape. The NSL was employed to make patterned arrays not only on hard substrates but also on stretchable substrates.60 One of the advantages of NSL over chemical production of nanostructures is that no surfactant is used.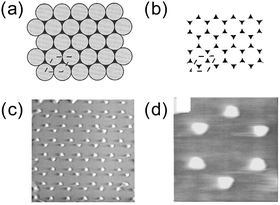 | ||
| Fig. 5 NSL. (a) Spin-coated polystyrene nanospheres (grey) and vapor deposited metal (black). (b) After the removal of the nanospheres. (c) AFM image (1.7 × 1.7 μm2). (d) AFM image (470 × 470 nm2). Reprinted with permission from J. C. Hulteen and R. P. Van Duyne, J. Vac. Sci. Technol., A, 1995, 13, 1553–1558. Copyright (1995), American Vacuum Society.59 | ||
4 Nanoprism-based sensors
In this section, we have collected reports (Table 1) in which Au and Ag nanosprisms are applied for sensors61 and arrange them according to the sensing mechanisms: (i) sensors based on refractive index changes; (ii) etching-based sensors; (iii) aggregation-based sensors; (iv) sensors which utilize luminescence enhancement; and (v) sensors based on photothermal effects. The sensors based on refractive index changes are simple to operate and suitable for real-time monitoring for kinetics analysis. However, sensitivity for molecules much smaller than the sensing volume may be low. Therefore, some additional trick is required to increase the sensitivity such as concentrating the analyte close to the surface.62 For etching-based and aggregation-based sensors, the spectral changes are so large that naked eye detection may be possible. On the other hand, etching-induced aggregation and aggregation-induced precipitation can occur, which could limit the application of these analysis methods. It is important to choose the optimum mode of mechanism depending on the purpose of sensing or a particular analyte.| Material | Fabrication | Configuration | Analyte | Ref. |
|---|---|---|---|---|
| a Abbreviations. ADDL: amyloid β-derived diffusible ligand; CEA: carcinoembryonic antigen; cTnI: cardiac troponin I; cTnT: cardiac troponin T; ELISA: enzyme-linked immunosorbent assay; HCG: human chorionic gonadotropin; LFA: lateral flow assay; NSL: nanosphere lithography; PSA: prostate-specific antigen. | ||||
| (a) Refractive index changes | ||||
| Ag | NSL | Glass | Streptavidin | 63 |
| Au | chemical | Glass | Streptavidin | 64 |
| Ag | NSL | Glass | ADDL | 65 |
| Ag | NSL | Mica | ADDL | 66 |
| Au | Chemical | Glass | cTnT | 67 |
| Au | Chemical | Glass | microRNA-10b | 68,69 |
| Ag | NSL | Glass | Ca2+ | 70 |
| Ag | NSL | Glass | Chloroform | 71 |
| Ag | NSL | Glass | Aromatic hydrocarbons | 72 |
| (b) Etching | ||||
| Ag | Chemical | Solution | Glucose | 73 |
| Ag | Chemical | Solution | Hg2+ | 74 |
| Ag | Chemical | Solution | DNA | 75 |
| Ag | Chemical | ELISA | PSA | 76 |
| Ag/Au | Chemical | Solution | H2S | 77 |
| Ag | Chemical | Solution | Dopamine | 78 |
| Ag | Chemical | Solution | Se(IV) | 79 |
| Au | Chemical | Solution | I−, L-thyroxine | 80 |
| (c) Aggregation | ||||
| Au | Chemical | Solution | cTnI | 43 |
| (d) Luminescence enhancement | ||||
| Ag | Photochemical | Solution | Temperature | 81 |
| Ag | Chemical | Quartz | Antigens, cells | 82 |
| Au/Ag | Chemical | Paper | Glucose | 83 |
| Ag | Chemical | Solution | H2S | 84 |
| (e) Photothermal effect | ||||
| Au | Chemical | Nitrocellulose/fax paper | CEA | 85 |
| Au | Chemical | LFA | HCG | 86 |
4.1 Sensors based on refractive index changes
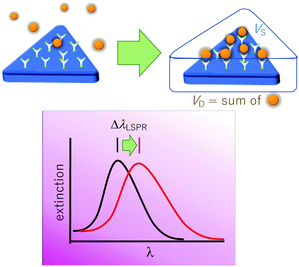
The LSPR wavelength is sensitive to various parameters as described above, and a change in any of these parameters can be utilized for sensing purposes. The most common parameter used for sensing purposes is the dielectric properties of the immediate surrounding of the nanoparticles (Fig. 6). To confer a selectivity, receptors are introduced on the surface of the nanoparticles. The selective binding of the target compound to the receptor on the surface causes local refractive index changes, leading to a shift in the LSPR wavelength.87The sensitivity (S) or the refractive index sensitivity (RIS) is defined as
 | (14) |
 | (15) |
 | (16) |
The nanoparticle only feels the refractive index changes in the surroundings only up to several nanometres from the surface. Therefore, not the bulk refractive index changes but the local refractive index changes are responsible for the LSPR shift. The bulk refractive index sensitivity of LSPR is lower than the propagating SPR. As a comparison, sensitivities from 1500 to 3500 nm RIU−1 (RIU: refractive index unit) depending on the wavelength were reported for the propagating SPR, while the reported sensitivities of Ag NPrs were up to 1096 nm RIU−1 in solution92 and 425 nm RIU−1 for surface-immobilized prisms.93 On the other hand, the local refractive index sensitivity of Ag NPr excelled the propagating SPR by a factor of 4, which was evaluated as polymer films were modified layer-by-layer on the surface.93 A method to detect both the local and bulk refractive index changes was devised using a periodic array of Au NPrs by deconvoluting signals from the individual LSPR and collective resonance mode, which has a long decay length,.15
As the sensitivity to the refractive index changes is distance dependent, distance distribution of analytes is also important to determine the sensitivity. The distance-dependent effects of the refractive index are represented by defining an effective refractive index (neff):
 | (17) |
The distance dependent response of the LSPR wavelength was nicely demonstrated at a single particle level by Alivisatos et al.62 In their work, a single Au nanoprism juxtaposed with a single Pd particle was fabricated by double electron-beam lithography. The distances between the Au nanoprism and the Pd particle were set at 10, 70 and 90 nm. Under H2 pressure, the Pd particle absorbs hydrogen, which was detected as a shift of the LSPR peak wavelength of Au nanoprisms. The closer the two nanoparticles were, the larger the magnitude of the shift was. About 10 nm shift at 16 torr H2 was observed for the 10 nm separation, while ∼3 nm shift was observed for the 70 nm separation.
Another relevant concept is the sensing volume (Fig. 6).67,94 In this view, the observed LSPR shift is proportional to the change of refractive index (Δn) due to the analyte as well as how much the sensing volume VS is occupied by the analyte (VD).
 | (18) |
In the following paragraphs, specific sensors reported so far based on the LSPR wavelength shifts (extinction/absorbance changes in some cases) responding to the refractive index changes around the nanoprisms will be outlined.
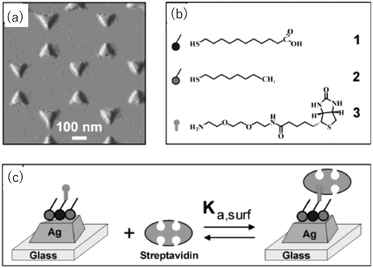
Van Duyne et al. fabricated Ag nanoprism arrays by NSL on a glass substrate, which is shown in Fig. 7.63 The surface of the Ag NPrs is coated with alkane thiol (2 in the figure) and alkane thiol carboxylic acid (1) partly for protecting Ag from degrading and partly for further functionalization. A molecule containing a biotin unit (3) was introduced by making an amide bond to the carboxyl moiety to complete the sensor for streptavidin. Streptavidin is a protein that has four binding sites for biotin. The streptavidin–biotin bond is noncovalent but extremely strong with a binding constant of ∼1013 M−1. This sensor exhibited a saturation response ΔλLSPR = 26.5 nm and the limit of detection in the low-picomolar to high-femtomolar region. Corresponding streptavidin sensors based on chemically synthesized Au NPrs but otherwise with a similar configuration were reported.64 The sensor, with a bulk sensitivity of 583 nm RIU−1 and a FOM of 4.9, detected streptavidin with the lowest detection limit of 50 pM.
Amyloid β-derived diffusible ligands (ADDLs) are small soluble oligomers of amyloid-β, a 42-amino acid peptide, which is considered to play a critical role in the development of Alzheimer's disease. The anti-ADDL antibody was detected by a sensor consisting of an array of Ag NPrs fabricated by NSL modified by ADDL.65 The detection limit was ∼10 nM, limited by nonspecific interactions to the Cr layer used as an adhesion layer for Ag NPrs on glass. This problem was later circumvented by using mica in place of glass as a substrate eliminating the need for Cr as an adhesion layer.66 The sensitivity of detecting ADDL was enhanced by employing a sandwich assay format in the form of anti-ADDL/ADDL/anti-ADDL. The first anti-ADDL was covalently attached to the nanoprisms. The substrate was incubated with a sample fluid, and subsequently, incubated with another anti-ADDL solution, resulting in enhanced LSPR shifts.
Troponins are a group of proteins (troponin C, troponin I and troponin T) that control muscular contraction. The level of cardiac troponin T (cTnT) or troponin I in the blood can help identify heart injury. Cardiac troponin T was detected by means of antigen/antibody binding by using Au NPrs functionalized with anti-cTnT on a glass chip with a limit of detection of 14 aM in plasma.67
Complementary DNA strands and DNA/RNA strands are an obvious choice for the mechanism for obtaining selectivity. microRNAs are single-stranded noncoding RNAs that regulate gene expression. miR-10b, one of the microRNAs, is known to overexpress in cancer and considered as a metastasis promoting factor.95 The surface of Au NPrs on a glass substrate was functionalized with DNA which is complementary to the target miR-10b.69,96 This sensor detected miR-10b specifically at attomolar concentrations.
Conformational changes of a protein were detected by taking advantage of distance dependent sensitivity of the LSPR sensor.70 Calmodulin, which changes its conformation upon calcium binding, is a calcium binding protein that regulates various target enzymes depending on the calcium level in the cell. Calmodulin was covalently immobilized on Ag nanoprism arrays, which were made by NSL, via an active site-directed capture ligand methodology.97 A calcium-induced conformational change resulted in a small LSPR shift of 1 nm, while the S/N ratio was as high as nearly 500. This device was also used to detect calcium, achieving a limit of detection of 23 μM.
An organic vapour sensor was fabricated using Ag nanoprism arrays prepared by NSL on a glass plate and subsequent spin-coating of poly(methylmethacrylate).71 In the presence of chloroform vapour, the polymer layer swelled and consequently the refractive index in the vicinity of nanoprisms changed. The extinction peak did not change its wavelength but intensity in this system. The lowest detection limit was 21 ppm.
A polysilsesquixane is a polymer based on networks of silicon, oxygen, and organic moieties.98 An array of Au NPrs, prepared by NSL on a glass plate and coated with aryl-bridged polysilsesquioxane films, was fabricated for the detection of aromatic hydrocarbons, such as benzene, toluene and xylene.72 Exposure of this sensor to the vapor of organic aromatic hydrocarbons resulted in a modification of its absorption spectrum. For example, 30 ppm xylene caused an absorbance variation by 1.2%, corresponding to a change in the refractive index of ∼0.001.
4.2 Sensors based on etching
Another type of sensing makes use of the shape-dependent changes in the LSPR wavelength induced by etching of nanoprisms. The tip regions of nanoprisms are most prone to etching. Also, the sharpness of tips has a large influence on the LSPR, particularly on the most prominent in-plane dipole mode extinction.39 Combining these facts, sensitive probes of analytes can be expected to be realized based on nanoprism etching. On going from nanoprisms with sharp tips to rounded nanodisks, the LSPR peak undergoes a large blue-shift and the associated colour changes can be easily recognized with the naked eye.A glucose sensor was reported, which consisted of a solution of Ag NPrs and glucose oxidase (GOx).73 A sample of a D-glucose solution was mixed with this solution. Glucose was oxidized by the action of GOx to produce H2O2, which etches the Ag NPrs into round nanodisks.
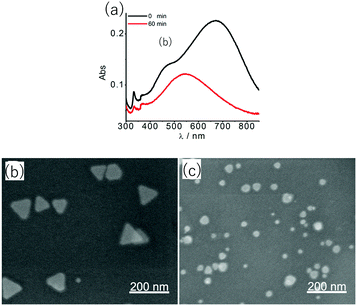 | ||
| Fig. 8 Changes in absorption spectra (a) as Ag NPrs were etched from (b) to (c) by H2O2 produced by GOx-catalysed oxidation of glucose. Reprinted with permission from Y. Xia et al., Anal. Chem., 2013, 85, 6241–6247. Copyright (2013) American Chemical Society.73 | ||
Yet another motif of operation is to measure an analyte which removes a protective layer of Ag NPrs. Hg2+ was detected by using a mixture of alkanethiol protected Ag NPrs and I− ions.74 When the alkanethiol protected Ag NPrs encounter Hg2+ ions, the alkane thiol molecules are detached from the surface of nanoprisms to coordinate to the Hg2+ ions. The surface-exposed Ag NPrs are prone to be etched by the I− ions, transforming into round disks. As a result, the LSPR peak is significantly shifted to blue. The magnitude of the wavelength shift was linearly correlated with the concentration of Hg2+ ions in the range between 10 to 500 nM. The limit of detection was 3.3 nM.
A multistep detection protocol of a specific DNA fragment was devised using etching of Ag NPrs by H2O2.75 In this protocol, GOx is collected with the help of magnetic beads only in the presence of the target DNA, of which information is amplified by the hybridization chain reaction.99 Once the glucose oxidase is collected by the beads, the beads are mixed with glucose and the supernatant is further mixed with the Ag NPrs and the absorption is measured. The limit of detection for the target DNA was as low as 6.0 fM.
The etching of Ag NPrs by H2O2 was combined with ELISA (enzyme-linked immunosorbent assay) to devise a detecting system for the prostate-specific antigen (PSA), a cancer biomarker.76 The ELISA is a widely-used immunoassay using multiwell plates. Employing GOx as the enzyme, the system was constructed such that the presence of PSA leads to the generation of H2O2. By adding solutions of Ag NPrs to the plates, colour changes were developed, enabling the quantification of the cancer biomarker. The limit of detection was 4.1 fg mL−1, which was, remarkably, lower than that of conventional ELISA with a colorimetric detection by 5 orders of magnitudes.
Ag/Au core–shell nanoprisms, in which Ag NPrs were coated by a thin layer of gold, were used to detect H2S.77 H2S etches Ag NPrs through the defects of the gold layer.
| 4Ag + 2H2S + O2 + 2H2O → 2Ag2S + 4H2O |
After the reaction, the surface of the Ag NPrs was transformed into an Ag2S layer under the Au overlayer. Some shrinkage of the core Ag NPrs was observed, while the overall triangular shape was retained. A large red-shift and a decrease in absorbance were caused by this etching process. The limit of detection of H2S by this sensor was 43 nM.
Au nanoparticles are stable in general but can be etched under certain conditions. The simultaneous presence of I− and H2O2 induce etching of Au NPrs according to the following reactions leading to colour changes, even though each one of them alone did not cause any change.80
| 2I− + 2H+ + H2O2 → I2 + 2H2O |
| I2 + I− → I3− |
| 2Au0 + I3− + I− → 2AuI2− |
4.3 Aggregation-based sensors
Aggregation-based sensors are one of the most common types of nanoparticle sensors.100,101 The principle of sensing is that analyte induces aggregation of nanoparticles, resulting in a strong colour change through plasmonic coupling between aggregated nanoparticles. Having mentioned that, most of the aggregation-based sensors use spherical nanoparticles and there are few reports of aggregation-based sensors using nanoprisms. This is probably because the colour change is so large that anisotropic nanostructures might not be necessary.Chemically synthesized Au NPrs were used for the sensor by functionalizing their surface by anti-cTnI, antibody to the cardiac troponin I.43 Before immobilizing anti-cTnI, however, the surfactant used in the preparation of Au NPrs had to be passivated by coating anionic polyelectrolyte, poly(styrenesulphonate). A dispersion of Au NPrs showed decreases in intensity with a small red-shift in the optical spectra with an increasing concentration of cardiac troponin I. The authors attributed this change as aggregation of Au NPrs driven by the antigen/antibody binding.
4.4 Sensors utilizing luminescence enhancement effects
Molecular electronic transition processes between the ground and excited states would be affected by a metal nanostructure which is placed nearby. Three mechanisms of metal–luminophore interactions that would affect the luminescence processes are commonly considered, see Fig. 9a.102 One is the quenching of excited states due to Förster-type energy transfer to the metal (km). The second is the increase in the excitation intensity by the enhanced electric field by the LSPR of the nanostructured metal (Em). The third is the increase in the radiative decay rate of the luminophore (Γm), as the LSPR provides the density of states to which the excited states decays into.103 As these effects have different distance dependences as shown in Fig. 9b, the distance between the molecules and the surface of metal nanostructures needs careful tuning to make maximum use of the enhancement effects.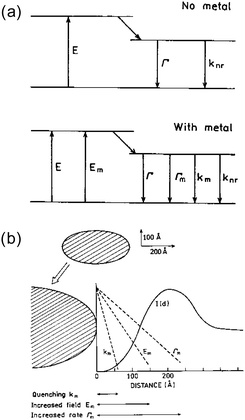 | ||
| Fig. 9 Metal induced effects on the transitions of nearby molecules. Reprinted from J. R. Lakowicz, Anal. Biochem., 2001, 298, 1–24. Copyright (2001), with permission from Elsevier.102 | ||
Thermometers that can measure the local temperature of a nanometre region are of interest for monitoring the device operations and biological processes with a nanometre-scale resolution. We made use of the different distance dependences of quenching and enhancing effects to make an LSPR-based thermometer (Fig. 10).81 We have employed Ag NPrs, which showed the LSPR around 500 nm. This band overlaps well with the fluorescence of fluorescein (FITC) peaking at 518 nm. Ag NPrs were modified with poly(N-isopropylacrylamide) (PNIPAm) conjugated with FITC. The PNIPAm is a unique polymer which undergoes a large conformational transition at a temperature called the lower critical solution temperature, below which the polymer chains are extended and above which the polymer is compact. Across this temperature, the distances between FITC molecules and the surface of Ag NPrs are expected to drastically change, and consequently, so does the fluorescence intensity, following the conformational transition of the polymer. Indeed, the fluorescence intensity at 20 °C was found to be larger more than 6 times than that at 40 °C. Most of the changes occurred between 32 °C and 36 °C, which was consistent with the transition temperature of the polymer. Dye aggregation may also have contributed to lessen the fluorescence intensity at high temperature facilitated by the contracted polymer matrix.
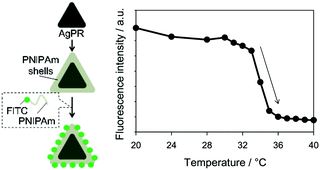 | ||
| Fig. 10 Nanothermometer based on Ag NPrs modified with a FITC/PNiPAm conjugate. Reproduced from K. Sugawa et al., Photochem. Photobiol. Sci., 2015, 14, 870–874 with permission from the European Society for Photobiology, the European Photochemistry Association, and The Royal Society of Chemistry.81 | ||
A generic configuration was proposed to detect an antigen by utilising the distance dependent fluorescence enhancement effects.82Fig. 11 summarizes the mechanism of sensing. The quartz substrate was modified with Ag NPrs, which were coated with a layer-by-layer (PEI/PAA)2 polymer film as a distance-tuning layer. An antibody was attached onto the polymer film, depending on what antigen was to be detected. After incubation with a sample solution, the substrate was treated with a fluorescent conjugated polymer, PFVCN. If the sample contained the target antigen the distance between the Ag NPrs and the fluorescent polymer, which adsorbed on the antigen, would be larger than the distance upon direct adsorption on the antibody layer. As a result, fluorescence enhancement effect would become smaller in the presence of the antigen leading to a weaker fluorescence. The selective antigen detection ability was confirmed for several antigens (prostate-specific antigen, carcinoembryonic antigen (CEA) and β-human chorionic gonadotropin). Even intact cells with membranes overdressed with a specific antigen were detected in this method.
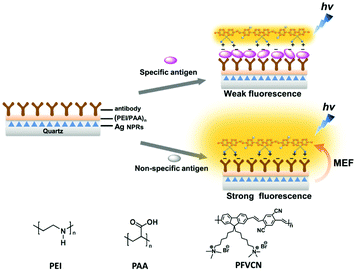 | ||
| Fig. 11 Configuration of sensors detecting an antigen capitalising on the distance-dependent fluorescence enhancement effect of Ag NPrs. MEF stands for metal-enhanced fluorescence. Reproduced from X. Wang et al., Adv. Mater., 2015, 27, 6040–6045 with permission from John Wiley and Sons.82 | ||
A glucose sensor based on enhanced luminescence was fabricated.83 The system consisted of Ag NPrs (129 nm), the surface of which was decorated with small Au nanospheres (13 nm), Ir–Zne metal organic frameworks (MOFs) and GOx. These components were deposited on paper. The luminophore in this system was the Ir–Zne MOF, which is an electrochemically prepared coordination polymer of Ir(ppy)2(H2dcbpy)PF6 (ppy is phenylpyridine and H2dcbpy is bipyridine dicarboxylic acid) and Zn2+.104 In this case, the emitting centres are the iridium complexes in the polymer, which means that the luminescence observed is phosphorescence, which corroborates the luminescence quenching by O2.105 When a solution containing glucose was added dropwise on the sensor, glucose was oxidized to consume O2, resulting in an increase of luminescence from the Ir–Zne MOF. The luminescence was enhanced by a factor of 110 by the presence of Ag NPrs and the limit of detection of glucose was 0.05 mM.
A fluorescence dye (Atto550) was attached on the surface of Ag NPrs through a cascade of bonding: Ag-S-PEG-CONH-streptavidin–biotin-Atto550 (PEG: polyethylene glycol).84 The fluorescence of Atto550 was enhanced up to 10 fold. In the presence of H2S (an equilibrium mixture of H2S, HS−, S2−), the fluorescence was reduced. The authors attributed this result to Ag2S formation on the surface of Ag NPrs. The limit of detection was 71 nM with a response time of 1 min.
4.5 Sensors utilizing photothermal conversion
The photon-to-heat conversion efficiency of Au nanoparticles is practically 1, that is, once a photon is absorbed, all of the energy is converted into heat.106 This property was used for thermal sensing of cancer marker CEA.85 The operation principles are illustrated in Fig. 12. The anti-CEA antibody is immobilized on a nitrocellulose membrane placed on a strip of thermosensitive fax paper. The sample is added dropwise onto the strip. The CEA in the sample is bound to anti-CEA and immobilized on the strip. From here on, there are two variants depending on how Au NPrs are attached onto the strip. In one protocol, Au NPrs modified with anti-CEA are subsequently added dropwise onto the strip ((a) in Fig. 12). In the second protocol, a solution of biotin-labelled anti-CEA is first added dropwise and, after washing, Au NPrs modified with streptavidin are added dropwise ((b) in Fig. 12). In both protocols, if CEA is present on the strip, Au NPrs are immobilized. After these procedures, near-IR laser is irradiated. The strip is heated up more in the presence of more Au NPrs immobilized. As a result, the thermosensitive fax paper is darkened in accordance with the heat it receives and the semiquantification of the CEA is possible by visual inspection of the paper strip. By this method, sensing of CEA concentrations in the attomolar range in serum samples was possible.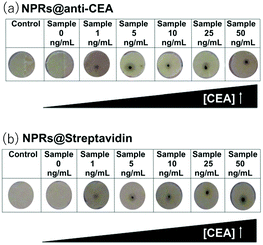 | ||
| Fig. 12 Sensing of CEA based on the photothermal effect of Au NPrs. Thermosensitive fax paper is darkened in the presence of CEA. (a) One-step procedure using anti-CEA modified Au NPrs. (b) Two-step procedure using streptavidin-modified Au NPrs. Reproduced from E. Polo et al., Chem. Commun., 2013, 49, 3676–3678 with permission from The Royal Society of Chemistry.85 | ||
This mode of operation is amenable to lateral flow assay (LFA).107 The LFA is a simple assay in which a drop of fluid sample (e.g., blood) is applied onto a paper strip. The paper strip is commonly modified with mobile chromophores modified with first receptors in one position and a line of immobilized second receptors in another position (test line). A sample solution is added dropwise on the first receptors. The solution expands over the paper strip by the capillary force and passes across the line of second receptors. If a target species is contained in the sample, it first binds to the receptor on the mobile chromophore and then is captured by the immobilised receptor, the event of which is read out from the coloured test line often with the naked eye. A prototypical LFA device was reported employing Au NPrs as the light-to-heat transducer.86 In the device, the antibody-conjugated nanoprisms are captured on the test line on the strip in the presence of a human chorionic gonadotropin (HCG) biomarker, which indicates pregnancy, resulting in a temperature increase upon laser irradiation. The temperature increase was linearly correlated with the amount of HCG, enabling quantification of HCG. The limit of detection was 12-fold lower than the traditional visual detection.
Conclusions
We have reviewed approaches towards sensing of materials from small molecules to biological macromolecules as well as temperature by plasmonic metal nanoprisms based on the LSPR phenomena. The essential physical part of the sensing mechanism of these sensors consists of just nanoparticles functionalized with a selective layer (e.g., a receptor) in dispersion or on a substrate. The sensor tip can be tiny, with a supporting fibre optics, which enables use in vivo as well as micro/nano-scale regions otherwise inaccessible. The sensor can be a slip of paper that can be brought anywhere required, which enables the point-of-care sensing. Particularly, nanoprisms among other nanoparticles are promising due to the well-defined structures with tips that generate strong LSPR and well-established fabrication techniques that make it possible to control the shape and size, and thereby to bring the LSPR resonance to a favourable position from visible to near IR wavelength ranges. Thus, plasmonic nanoprisms are promising as sensor platforms with these unique advantages.Many issues to be addressed still lie ahead for practical applications, however. Particularly, fabrication of high-quality Au NPrs requires a surfactant, which is not compatible with bioapplications. The chemical synthesis of Ag NPrs, which is faster and more favourable to mass production than photochemical synthesis, requires polymeric protective agents, which could limit the sensitivity. Sensors using Au and Ag have been mostly researched and reviewed herein but devices using cheaper earth-abundant alternative materials (e.g., Cu23,24,108) are desirable. Use of other materials requires us to find clever workarounds to intrinsic inferior properties (e.g., prone to oxidation) or new perspectives.109 To make periodic or patterned arrays of arbitrarily shaped nanostructures, which can be achieved by top-down approaches, is difficult by a cheaper bottom-up approach at present. There is no general methodology to place molecules to a specific position relative to the metal nanoprisms. The rapid developments made so far in the last few decades concerning the plasmonic sensors as summarized in this review, however, may convince the reader that the days are just around the corner that plasmonic sensors will be widely used.
Conflicts of interest
There are no conflicts to declare.Acknowledgements
This work was partially supported by the JSPS KAKENHI grants, 18K05156 (J. O.), 19H05627 (K. S.) and 20H02850 (K. S.).Notes and references
- S. A. Maier and H. A. Atwater, J. Appl. Phys., 2005, 98, 011101 CrossRef.
- E. A. Coronado, E. R. Encina and F. D. Stefani, Nanoscale, 2011, 3, 4042–4059 RSC.
- V. Klimov, Nanoplasmonics, Pan Stanford, 2014 Search PubMed.
- Y. Li, Plasmonic Optics Theory and Applications, SPIE, 2017 Search PubMed.
- J. N. Anker, W. P. Hall, O. Lyandres, N. C. Shah, J. Zhao and R. P. Van Duyne, Nat. Mater., 2008, 7, 442–453 CrossRef CAS.
- K. M. Mayer and J. H. Hafner, Chem. Rev., 2011, 111, 3828–3857 CrossRef CAS.
- J. B. Khurgin, Faraday Discuss., 2019, 214, 35–58 RSC.
- A. D. Rakić, A. B. Djurišić, J. M. Elazar and M. L. Majewski, Appl. Opt., 1998, 37, 5271–5283 CrossRef.
- K. L. Kelly, E. Coronado, L. L. Zhao and G. C. Schatz, J. Phys. Chem. B, 2003, 107, 668–677 CrossRef CAS.
- C. F. Bohren and D. R. Huffman, Absorption and Scattering of Light by Small Particles, Wiley-VCH, 1983 Search PubMed.
- S. Karimi, A. Moshaii, S. Abbasian and M. Nikkhah, Plasmonics, 2019, 14, 851–860 CrossRef CAS.
- S. Link and M. A. El-Sayed, J. Phys. Chem. B, 1999, 103, 8410–8426 CrossRef CAS.
- J. Jatschka, A. Dathe, A. Csáki, W. Fritzsche and O. Stranik, Sens Biosensing Res., 2016, 7, 62–70 CrossRef.
- A. J. Haes, S. Zou, G. C. Schatz and R. P. Van Duyne, J. Phys. Chem. B, 2004, 108, 6961–6968 CrossRef CAS.
- K. Akiyoshi, Y. Y. Tanaka, T. Ishida, T. Shimura and T. Tatsuma, ACS Appl. Nano Mater., 2018, 1, 5994–5999 CrossRef CAS.
- L. S. Jung, C. T. Campbell, T. M. Chinowsky, M. N. Mar and S. S. Yee, Langmuir, 1998, 14, 5636–5648 CrossRef CAS.
- A. Furube and S. Hashimoto, NPG Asia Mater., 2017, 9, e454 CrossRef CAS.
- X.-C. Ma, Y. Dai, L. Yu and B.-B. Huang, Light: Sci. Appl., 2016, 5, e16017 CrossRef CAS.
- S.-Y. Ding, E.-M. You, Z.-Q. Tian and M. Moskovits, Chem. Soc. Rev., 2017, 46, 4042–4076 RSC.
- F. Neubrech, C. Huck, K. Weber, A. Pucci and H. Giessen, Chem. Rev., 2017, 117, 5110–5145 CrossRef CAS.
- S. G. Rodrigo, F. J. García-Vidal and L. Martín-Moreno, Phys. Rev. B: Condens. Matter Mater. Phys., 2008, 77, 075401 CrossRef.
- P. B. Johnson and R. W. Christy, Phys. Rev. B: Condens. Matter Mater. Phys., 1972, 6, 4370–4379 CrossRef CAS.
- K. Sugawa, D. Yamaguchi, N. Tsunenari, K. Uchida, H. Tahara, H. Takeda, K. Tokuda, S. Jin, Y. Kusaka, N. Fukuda, H. Ushijima, T. Akiyama, Y. Watanuki, N. Nishimiya, J. Otsuki and S. Yamada, ACS Appl. Mater. Interfaces, 2017, 9, 750–762 CrossRef CAS.
- K. Sugawa, T. Tamura, H. Tahara, D. Yamaguchi, T. Akiyama, J. Otsuki, Y. Kusaka, N. Fukuda and H. Ushijima, ACS Nano, 2013, 7, 9997–10010 CrossRef CAS.
- I. Pastoriza-Santos, A. Sánchez-Iglesias, B. Rodríguez-González and L. M. Liz-Marzán, Small, 2009, 5, 440–443 CrossRef CAS.
- M. A. Ben Aissa, B. Tremblay, A. Andrieux-Ledier, E. Maisonhaute, N. Raouafi and A. Courty, Nanoscale, 2015, 7, 3189–3195 RSC.
- M. B. Gawande, A. Goswami, F.-X. Felpin, T. Asefa, X. Huang, R. Silva, X. Zou, R. Zboril and R. S. Varma, Chem. Rev., 2016, 116, 3722–3811 CrossRef CAS.
- G. H. Chan, J. Zhao, E. M. Hicks, G. C. Schatz and R. P. Van Duyne, Nano Lett., 2007, 7, 1947–1952 CrossRef CAS.
- J. E. Millstone, S. J. Hurst, G. S. Métraux, J. I. Cutler and C. A. Mirkin, Small, 2009, 5, 646–664 CrossRef CAS.
- F. Wang and Y. R. Shen, Phys. Rev. Lett., 2006, 97, 206806 CrossRef.
- P. R. West, S. Ishii, G. V. Naik, N. K. Emani, V. M. Shalaev and A. Boltasseva, Laser Photonics Rev., 2010, 4, 795–808 CrossRef CAS.
- P. Mulvaney, T. Linnert and A. Henglein, J. Phys. Chem., 1991, 95, 7843–7846 CrossRef CAS.
- T. Pal, T. K. Sau and N. R. Jana, Langmuir, 1997, 13, 1481–1485 CrossRef CAS.
- D. Aherne, D. E. Charles, M. E. Brennan-Fournet, J. M. Kelly and Y. K. Gun’ko, Langmuir, 2009, 25, 10165–10173 CrossRef CAS.
- K. L. Shuford, M. A. Ratner and G. C. Schatz, J. Chem. Phys., 2005, 123, 114713 CrossRef.
- S. Atta, M. Beetz and L. Fabris, Nanoscale, 2019, 11, 2946–2958 RSC.
- J. E. Ortiz-Castillo, R. C. Gallo-Villanueva, M. J. Madou and V. H. Perez-Gonzalez, Coord. Chem. Rev., 2020, 425, 213489 CrossRef CAS.
- J. E. Millstone, S. Park, K. L. Shuford, L. Qin, G. C. Schatz and C. A. Mirkin, J. Am. Chem. Soc., 2005, 127, 5312–5313 CrossRef CAS.
- R. Jin, Y. Cao, C. A. Mirkin, K. L. Kelly, G. C. Schatz and J. G. Zheng, Science, 2001, 294, 1901–1903 CrossRef CAS.
- D. Aherne, D. M. Ledwith, M. Gara and J. M. Kelly, Adv. Funct. Mater., 2008, 18, 2005–2016 CrossRef CAS.
- E. Hao and G. C. Schatz, J. Chem. Phys., 2004, 120, 357–366 CrossRef CAS.
- T. H. Ha, H.-J. Koo and B. H. Chung, J. Phys. Chem. C, 2007, 111, 1123–1130 CrossRef CAS.
- Z. Guo, X. Fan, L. Liu, Z. Bian, C. Gu, Y. Zhang, N. Gu, D. Yang and J. Zhang, J. Colloid Interface Sci., 2010, 348, 29–36 CrossRef CAS.
- L. Chen, F. Ji, Y. Xu, L. He, Y. Mi, F. Bao, B. Sun, X. Zhang and Q. Zhang, Nano Lett., 2014, 14, 7201–7206 CrossRef CAS.
- B. Pelaz, V. Grazu, A. Ibarra, C. Magen, P. del Pino and J. M. de la Fuente, Langmuir, 2012, 28, 8965–8970 CrossRef CAS.
- R. Jin, Y. C. Cao, E. Hao, G. S. Métraux, G. C. Schatz and C. A. Mirkin, Nature, 2003, 425, 487–490 CrossRef CAS.
- C. Xue, G. S. Métraux, J. E. Millstone and C. A. Mirkin, J. Am. Chem. Soc., 2008, 130, 8337–8344 CrossRef CAS.
- C. Xue and C. A. Mirkin, Angew. Chem., Int. Ed., 2007, 46, 2036–2038 CrossRef CAS.
- N. Takeshima, K. Sugawa, M. Noguchi, H. Tahara, S. Jin, K. Takase, J. Otsuki and K. Tamada, Chem. Lett., 2020, 49, 240–243 CrossRef CAS.
- C.-H. Zhang, J. Zhu, J.-J. Li and J.-W. Zhao, ACS Appl. Mater. Interfaces, 2017, 9, 17387–17398 CrossRef CAS.
- G. S. Métraux and C. A. Mirkin, Adv. Mater., 2005, 17, 412–415 CrossRef.
- Q. Zhang, N. Li, J. Goebl, Z. Lu and Y. Yin, J. Am. Chem. Soc., 2011, 133, 18931–18939 CrossRef CAS.
- J. Zeng, X. Xia, M. Rycenga, P. Henneghan, Q. Li and Y. Xia, Angew. Chem., Int. Ed., 2011, 50, 244–249 CrossRef CAS.
- X. Liu, L. Li, Y. Yang, Y. Yin and C. Gao, Nanoscale, 2014, 6, 4513–4516 RSC.
- D. Jana, C. Matti, J. He and L. Sagle, Anal. Chem., 2015, 87, 3964–3972 CrossRef CAS.
- M. M. Shahjamali, M. Salvador, M. Bosman, D. S. Ginger and C. Xue, J. Phys. Chem. C, 2014, 118, 12459–12468 CrossRef CAS.
- M. M. Shahjamali, M. Bosman, S. Cao, X. Huang, S. Saadat, E. Martinsson, D. Aili, Y. Y. Tay, B. Liedberg, S. C. J. Loo, H. Zhang, F. Boey and C. Xue, Adv. Funct. Mater., 2012, 22, 849–854 CrossRef CAS.
- K. Sugawa, D. Tanaka, T. Ichikawa and N. Takeshima, Jpn. J. Appl. Phys., 2013, 52, 04CK06 CrossRef.
- J. C. Hulteen and R. P. Van Duyne, J. Vac. Sci. Technol., A, 1995, 13, 1553–1558 CrossRef.
- J.-E. Lee, C. Park, K. Chung, J. W. Lim, F. Marques Mota, U. Jeong and D. H. Kim, Nanoscale, 2018, 10, 4105–4112 RSC.
- T. Vo-Dinh, A. M. Fales, G. D. Griffin, C. G. Khoury, Y. Liu, H. Ngo, S. J. Norton, J. K. Register, H.-N. Wang and H. Yuan, Nanoscale, 2013, 5, 10127–10140 RSC.
- N. Liu, M. L. Tang, M. Hentschel, H. Giessen and A. P. Alivisatos, Nat. Mater., 2011, 10, 631–636 CrossRef CAS.
- A. J. Haes and R. P. Van Duyne, J. Am. Chem. Soc., 2002, 124, 10596–10604 CrossRef CAS.
- G. K. Joshi, P. J. McClory, S. Dolai and R. Sardar, J. Mater. Chem., 2012, 22, 923–931 RSC.
- A. J. Haes, W. P. Hall, L. Chang, W. L. Klein and R. P. Van Duyne, Nano Lett., 2004, 4, 1029–1034 CrossRef CAS.
- A. J. Haes, L. Chang, W. L. Klein and R. P. Van Duyne, J. Am. Chem. Soc., 2005, 127, 2264–2271 CrossRef CAS.
- T. Liyanage, A. Sangha and R. Sardar, Analyst, 2017, 142, 2442–2450 RSC.
- J. M. Sunshine, C. M. Pieters and S. F. Pratt, J. Geophys. Res.: Solid Earth, 1990, 95, 6955–6966 CrossRef.
- G. K. Joshi, S. Deitz-McElyea, T. Liyanage, K. Lawrence, S. Mali, R. Sardar and M. Korc, ACS Nano, 2015, 9, 11075–11089 CrossRef CAS.
- W. P. Hall, J. Modica, J. Anker, Y. Lin, M. Mrksich and R. P. Van Duyne, Nano Lett., 2011, 11, 1098–1105 CrossRef CAS.
- W. Ma, J. Luo, W. Ling and W. Wang, Micro Nano Lett., 2013, 8, 111–114 CrossRef CAS.
- L. Brigo, N. Michieli, L. Artiglia, C. Scian, G. A. Rizzi, G. Granozzi, G. Mattei, A. Martucci and G. Brusatin, ACS Appl. Mater. Interfaces, 2014, 6, 7773–7781 CrossRef CAS.
- Y. Xia, J. Ye, K. Tan, J. Wang and G. Yang, Anal. Chem., 2013, 85, 6241–6247 CrossRef CAS.
- L. Chen, X. Fu, W. Lu and L. Chen, ACS Appl. Mater. Interfaces, 2013, 5, 284–290 CrossRef CAS.
- X. Yang, Y. Yu and Z. Gao, ACS Nano, 2014, 8, 4902–4907 CrossRef CAS.
- J. Liang, C. Yao, X. Li, Z. Wu, C. Huang, Q. Fu, C. Lan, D. Cao and Y. Tang, Biosens. Bioelectron., 2015, 69, 128–134 CrossRef CAS.
- X. Yang, Y. Ren and Z. Gao, Chem. – Eur. J., 2015, 21, 988–992 CrossRef CAS.
- X. Fang, H. Ren, H. Zhao and Z. Li, Microchim. Acta, 2017, 184, 415–421 CrossRef CAS.
- M. Amjadi, T. Hallaj and R. Salari, Sens. Actuators, B, 2018, 273, 1307–1312 CrossRef CAS.
- H. Ren, T. Li, R. Ling, J. Bi, C. Zhang, Z. Wu and W. Qin, ACS Sustainable Chem. Eng., 2019, 7, 15230–15237 CrossRef CAS.
- K. Sugawa, R. Ichikawa, N. Takeshima, Y. Tanoue and J. Otsuki, Photochem. Photobiol. Sci., 2015, 14, 870–874 RSC.
- X. Wang, S. Li, P. Zhang, F. Lv, L. Liu, L. Li and S. Wang, Adv. Mater., 2015, 27, 6040–6045 CrossRef CAS.
- P.-H. Huang, C. P. Hong, J. F. Zhu, T.-T. Chen, C.-T. Chan, Y.-C. Ko, T.-L. Lin, Z.-B. Pan, N.-K. Sun, Y.-C. Wang, J.-J. Luo, T.-C. Lin, C.-C. Kang, J.-J. Shyue and M.-L. Ho, Dalton Trans., 2017, 46, 6985–6993 RSC.
- G. Lin and M. Lewandowska, Sens. Actuators, B, 2019, 292, 241–246 CrossRef CAS.
- E. Polo, P. del Pino, B. Pelaz, V. Grazu and J. M. de la Fuente, Chem. Commun., 2013, 49, 3676–3678 RSC.
- Z. Qu, K. Wang, G. Alfranca, J. M. de la Fuente and D. Cui, Nanoscale Res. Lett., 2020, 15, 10 CrossRef CAS.
- M. M. Miller and A. A. Lazarides, J. Phys. Chem. B, 2005, 109, 21556–21565 CrossRef CAS.
- N. Michieli, B. Kalinic, C. Scian, T. Cesca and G. Mattei, Biosens. Bioelectron., 2015, 65, 346–353 CrossRef CAS.
- B. Tandon, S. Ghosh and D. J. Milliron, Chem. Mater., 2019, 31, 7752–7760 CrossRef CAS.
- L. J. Sherry, S.-H. Chang, G. C. Schatz, R. P. Van Duyne, B. J. Wiley and Y. Xia, Nano Lett., 2005, 5, 2034–2038 CrossRef CAS.
- B. Xue, D. Wang, J. Zuo, X. Kong, Y. Zhang, X. Liu, L. Tu, Y. Chang, C. Li, F. Wu, Q. Zeng, H. Zhao, H. Zhao and H. Zhang, Nanoscale, 2015, 7, 8048–8057 RSC.
- D. E. Charles, D. Aherne, M. Gara, D. M. Ledwith, Y. K. Gun’ko, J. M. Kelly, W. J. Blau and M. E. Brennan-Fournet, ACS Nano, 2010, 4, 55–64 CrossRef CAS.
- E. Martinsson, M. M. Shahjamali, K. Enander, F. Boey, C. Xue, D. Aili and B. Liedberg, J. Phys. Chem. C, 2013, 117, 23148–23154 CrossRef CAS.
- G. J. Nusz, A. C. Curry, S. M. Marinakos, A. Wax and A. Chilkoti, ACS Nano, 2009, 3, 795–806 CrossRef CAS.
- P. Sheedy and Z. Medarova, Am. J. Cancer Res., 2018, 8, 1674–1688 CAS.
- G. K. Joshi, S. Deitz-McElyea, M. Johnson, S. Mali, M. Korc and R. Sardar, Nano Lett., 2014, 14, 6955–6963 CrossRef CAS.
- C. D. Hodneland, Y.-S. Lee, D.-H. Min and M. Mrksich, Proc. Natl. Acad. Sci. U. S. A., 2002, 99, 5048–5052 CrossRef CAS.
- N. Ahmed, H. Fan, P. Dubois, X. Zhang, S. Fahad, T. Aziz and J. Wan, J. Mater. Chem. A, 2019, 7, 21577–21604 RSC.
- R. M. Dirks, N. A. Pierce and S. L. Mayo, Proc. Natl. Acad. Sci. U. S. A., 2004, 101, 15275–15278 CrossRef CAS.
- S. Szunerits and R. Boukherroub, Chem. Commun., 2012, 48, 8999–9010 RSC.
- L. Tang and J. Li, ACS Sens., 2017, 2, 857–875 CrossRef CAS.
- J. R. Lakowicz, Anal. Biochem., 2001, 298, 1–24 CrossRef CAS.
- V. Giannini, A. I. Fernández-Domínguez, S. C. Heck and S. A. Maier, Chem. Rev., 2011, 111, 3888–3912 CrossRef CAS.
- M.-L. Ho, Y.-A. Chen, T.-C. Chen, P.-J. Chang, Y.-P. Yu, K.-Y. Cheng, C.-H. Shih, G.-H. Lee and H.-S. Sheu, Dalton Trans., 2012, 41, 2592–2600 RSC.
- K.-Y. Cheng, J.-C. Wang, C.-Y. Lin, W.-R. Lin, Y.-A. Chen, F.-J. Tsai, Y.-C. Chuang, G.-Y. Lin, C.-W. Ni, Y.-T. Zeng and M.-L. Ho, Dalton Trans., 2014, 43, 6536–6547 RSC.
- M. Gouterman, J. Chem. Phys., 1959, 30, 1139–1161 CrossRef CAS.
- Z. Qin, W. C. W. Chan, D. R. Boulware, T. Akkin, E. K. Butler and J. C. Bischof, Angew. Chem., Int. Ed., 2012, 51, 4358–4361 CrossRef CAS.
- K. Sugawa, N. Tsunenari, H. Takeda, S. Fujiwara, T. Akiyama, J. Honda, S. Igari, W. Inoue, K. Tokuda, N. Takeshima, Y. Watanuki, S. Tsukahara, K. Takase, T. Umegaki, Y. Kojima, N. Nishimiya, N. Fukuda, Y. Kusaka, H. Ushijima and J. Otsuki, Langmuir, 2017, 33, 5685–5695 CrossRef CAS.
- K. Sugawa, H. Tahara, A. Yamashita, J. Otsuki, T. Sagara, T. Harumoto and S. Yanagida, ACS Nano, 2015, 9, 1895–1904 CrossRef CAS.
| This journal is © The Royal Society of Chemistry 2021 |


