DOI:
10.1039/D1LC00570G
(Paper)
Lab Chip, 2021,
21, 3784-3792
A 3D-cascade-microlens optofluidic chip for refractometry with adjustable sensitivity†
Received
26th June 2021
, Accepted 6th August 2021
First published on 19th August 2021
Abstract
Refractive index (RI) sensing as a label-free and non-invasive method has been playing an important role in industrial metrology, biochemical detection, and environmental analysis. Due to the combined advantages of microoptics and microfluidics, optofluidic RI sensors have attracted growing interest. Despite a variety of prototypes of optofluidic RI sensors, comprehensive improvement in sensitivity, detection range, fabrication procedures and cost can still bring substantial benefits to the field. In this work, we fabricated a 3D-cascade-microlens optofluidic chip (3DCMOC) for RI sensing. Two-photon stereolithography was employed to fabricate the chip mold, with which the 3DCMOC could be easily manufactured via mold replication. By virtue of integrating four detection channels configured with different numbers (1, 3, 5, and 7) of cascaded microlenses within the 3DCMOC, adjustable sensitivity for RI sensing has been demonstrated through measuring standard sucrose solutions. It was found that the seven-microlens configuration achieved an excellent sensitivity (mean: 21 ± 5 AU·RIU (refractive index unit)−1) and resolution (mean: 3.8 × 10⁻⁵ ± 0.9 × 10⁻⁵ RIU) at a cost of a narrow linear dynamic range (LDR, 1.3326–1.3548). In contrast, the single-microlens configuration led to an extended LDR (1.3326–1.5120 tested) despite the lower sensitivity (mean: 2.6 ± 0.2 AU·RIU−1) and resolution (mean: 1.5 × 10⁻⁴ ± 0.1 × 10⁻⁴ RIU). Furthermore, the use of the 3DCMOC was investigated via real-time salinity sensing and analysis of urine specific gravity.
1. Introduction
Refractive index (RI) sensing as a label-free and non-invasive method has been widely adopted in industrial metrology,1,2 biochemical analysis3 and environmental evaluation.4,5 Since RI is a fundamental optical property of substances and closely related to density, it can be used as a universal parameter for quantitative analyses. Compared with conductivity based approaches, RI sensing has little dependence on the ionic properties of samples, making it suitable for estimating the absolute salinity of seawater and the concentration of non-ionic samples.5 In recent years, optofluidic RI sensors have attracted growing interest due to the combined advantages of microoptics and microfluidics including miniaturization of the sensing system, integration of optical components, flexible modifications of optical properties via fluid manipulation, and real-time measurements of continuous-flow samples.6–11 Generally, the RI of a liquid sample can be measured by using interferometric or refractometric methods. For interferometric-based optofluidic RI sensing, functional structures e.g. a fiber Bragg grating (FBG),12,13 Mach–Zehnder interferometer,14 Fabry–Pérot resonator,15 photonic crystal fiber (PCF),16 and surface plasmon resonance (SPR) configuration17–20 were used. RI variations in the measurement cavity using the aforementioned configurations could cause sensitive changes of transmission or reflection spectra, typically represented by a wavelength shift with reported sensitivities ranging from several to thousands of nanometers per refractive index unit. Despite these excellent sensitivities, a high-resolution spectrometer has to be employed, which would significantly increase the device cost. Additionally, although intensity modulation can function for interferometric methods as well, complexity and difficulty in structure fabrication may limit their scale-up productions.21 For example, FBGs and PCFs have high requirements in micro and nanostructure precision while functionalization procedures e.g. mirror coating for Fabry–Pérot resonators and gold deposition for SPR sensors have to be precisely performed to achieve satisfactory reproducibility. In contrast, refractometric-based RI sensors have clear advantages in reducing the device cost and simplifying fabrication procedures. By virtue of image defocusing or intensity modulation, the optical detector does not have to be a spectrometer. Yoon and Yang reported a microrefractometer dependent on image defocusing,22 in which a microscope system was used as the detector despite an increase of the device size. Recently, intensity modulation has been extensively used for RI sensing as a low-cost solution. For instance, Barshilia et al. developed a sensor relying on waveguide reflection with a limit of detection (LoD) of approximately 1% (w/w) for sodium chloride (NaCl) samples. Due to the low fabrication complexity and the employment of a silicon photodiode as the detector, low cost and mass production was feasible.21 An optofluidic prism represents another refractometric structure sensitive to RI.23–25 For example, Chao et al. used a prism chip to measure the refractive index ranging from 1.33 to 1.52, although the resolution was lower than 5 × 10⁻³ RIU.25 Additionally, Weber and co-workers manufactured an RI sensor coupling both reflection and refraction principles for determining liquid concentrations and an LoD of 40 mM phosphate (approximately 5%, w/w) was reported.26 Besides, Liu et al. developed a sensor dependent on a bent waveguide, with which a resolution of 5.3 × 10⁻⁴ RIU was reached.7 Despite the low cost and simplified fabrication, there is still room for improvement of the sensing performances of these intensity-modulation-based optofluidic RI sensors.
Microlenses as fundamental optical components have boosted a large number of on-chip applications.27–32 Compared with solid microlenses possessing fixed optical properties, optofluidic microlenses show unparalleled tunability by easily changing the cavity medium with desired RI values or adjusting the flow rate of multiple working fluids.27–29,32–34 Such tunability forms the foundation of RI sensing using optofluidic microlenses. Benefitting from the small size of the microlens system and the limited optical path length, the transmitted light is insusceptible to extinctions and thus an excellent accuracy of RI measurement can be realized. Compared with a single microlens, cascaded microlenses can optimize light modulation and thus promote a solution to sensitive RI analysis. For example, Seo et al. cascaded three self-aligned air microlenses within a chip to reduce aberrations.35 The abovementioned cascaded microlenses were planar 2D ones fabricated by UV lithography. In contrast, 3D microlenses can further improve light manipulation. Although out-of-plane 3D microlenses can normally be fabricated by UV lithography and thermal reflow,30 it is challenging to cascade these microlenses within a chip. Alternatively, in-plane 3D microlenses have unique flexibility in microlens cascading and high compatibility with in-plane bare-fiber optics. In recent years, two-photon stereolithography has attracted growing attention due to its outstanding performance in printing complex 3D microstructures on micrometer and sub-micrometer scales with sufficient freedom of orientation. This technique has been speeding up the development of microoptics and optofluidics. For example, Gissibl et al. fabricated a multi-lens objective on a fiber end facet using two-photon stereolithography for imaging applications.36 Cao et al. used two-photon stereolithography to fabricate a lens–mirror system for high-throughput droplet detection.37 In our previous work,31,38 we fabricated two in-plane 3D microlenses using two-photon stereolithography to reduce the light loss for sensitive absorbance measurements. Therefore, two-photon stereolithography is an ideal technology to fabricate cascaded 3D in-plane microlenses. On the other hand, despite the promising enhancement of sensitivity through microlens cascading, it may lead to a narrower range of RI detection. For a variety of practical applications, the concentrations or RI of real samples may vary in a broad range. To this end, we endeavored to develop an RI sensor with adjustable sensitivities via integrating four detection channels configured with different numbers of cascaded microlenses within a chip.
In the current work, we first introduce the principles of intensity modulation and the simulation results of optical responses of the 3DCMOC to RI variations. Subsequently, detailed characterization results of the fabricated 3DCMOC are presented. After that, the performances of the detection channels consisting of different numbers of cascaded microlenses are compared for RI sensing in terms of sensitivity, resolution, and linear dynamic range (LDR). Finally, the 3DCMOC was further employed for real-time salinity sensing and analysis of urine specific gravity.
2. Experimental section
2.1 Chip fabrication
The 3DCMOC was manufactured via mold replication. A chip mold was designed using AutoCAD 2019 and consisted of a flow channel with a rectangular cross-section and double-sided symmetric 3D in-plane spherical microlenses. The detailed dimension of the 3D microlens is shown in Fig. S1.† The chip mold was fabricated by two-photon stereolithography (Nanoscribe, Karlsruhe, Germany) using an IPS photoresist. A hierarchical printing strategy was adopted to balance the quality of printed key optical structures and the total printing time. As shown in Fig. 1a, the key optical structures (the cyan part of the magnified inset), including the microlens and the end facet of the fiber groove, were fabricated using high-resolution printing parameters (slicing distance (SD) = 0.2 μm, hatching distance (HD) = 0.2 μm, laser dose (LD) = 40%) while common parameters (SD = 1.0 μm, HD = 0.5 μm, LD = 70%) were used for printing other parts. After polymerization, the uncured photoresist was removed by rinsing with 1-methoxy-2-propanol acetate as a developer (Sigma, St. Louis, USA) for 18 minutes and isopropyl alcohol (Sigma, St. Louis, USA) for 2 minutes in sequence. Before polydimethylsiloxane (PDMS) replication, the chip mold was thermally pretreated in an oven at 200 °C for 2 hours. More detailed information on the chip fabrication can be found elsewhere.31Fig. 1b shows the schematic of the entire sensing system, which consists of an MNWHD2 white light LED (Thorlabs, Newton, USA), FG105UCA multimode optical fibers (Thorlabs, Newton, USA), an optofluidic chip 3DCMOC and a ULS2048LTEC spectrometer (Avantes, Apeldoorn, Netherlands).
 |
| | Fig. 1 Schematic of the chip fabrication and system configuration. (a) Chip fabrication using two-photon stereolithography with a hierarchical modular printing strategy. The cyan part represents the key optical structures: the microlens and the end facet of the fiber groove, which were printed using high-resolution parameters. (b) The schematic of the sensing system. | |
2.2 Simulation methods
The ray optics module in COMSOL was used to simulate the optical responses in different situations. For the qualitative description, a single point source of light was set while for the quantitative analysis, multiple point sources of light were configured. The divergence angle of the point source was determined by the numerical aperture of the multimode fiber. The details of the simulation method can be found elsewhere.31 The optical response with a dimensionless arbitrary unit (AU) is defined as the logarithmic ratio between the test light intensity (It) and the reference light intensity (Ir), as described in eqn (1). The test and reference light intensities correspond to the detection channel filled with the test samples and ultrapure water, respectively. In the simulation, the probability of rays collected represents the detectable light intensity. In the experiments, the light intensity was recorded by the spectrometer.| |  | (1) |
2.3 Analytical methods
For characterizing the performance of the 3DCMOC for RI measurements, sucrose (Sigma, St. Louis, USA) samples diluted in ultrapure water were prepared as standard working solutions with concentrations ranging between 0.67% (w/w, RI = 1.3336) and 66.5% (w/w, RI = 1.4522). The RI values of the sucrose samples at 589 nm (corresponding to the detection wavelength using a sodium lamp) were converted from concentrations and corrected with temperature compensation according to the reference data.39 To experimentally investigate the LDR of the single-microlens configuration, an immersion oil (Sigma, St. Louis, USA) with an RI value of 1.5120 was supplemented. To further demonstrate the applications of the 3DCMOC, NaCl (Sigma, St. Louis, USA) solutions and urine samples were tested. The urine samples were collected from two volunteers within two days. Optical responses of the urine and urine specific gravity were measured using the 3DCMOC and the gravimetric method, respectively, to obtain a calibration curve. The absorbance of the urine samples at 589 nm was measured using an Infinite 200 PRO reader (Tecan, Männedorf, Switzerland). All the samples were loaded by a REGLO Digital MS-4/6 peristaltic pump (Cole-Parmer, Wertheim, Germany) at a flow rate of 8.5 μl min−1. The optical response to RI variations was calculated according to the changes of light intensity at 589 nm, which was recorded using a ULS2048LTEC spectrometer (Avantes, Apeldoorn, Netherlands). The dark intensity is negligible. It should be noted that due to intensity modulation, the spectrometer and white LED used in this study can be replaced with a miniaturized photodiode and a monochromatic LED with a nominal wavelength at approximately 589 nm, respectively, to develop low-cost detection systems. All the samples were measured at 24.0 ± 0.5 °C.
2.4 Ethical statements
The measurement of the urine samples was performed in compliance with the relevant regulations and guidelines in ETH Zurich and Switzerland. The collected urine samples were only used for refractive index measurements. The Ethics Commission of ETH Zurich approved the experiment of measuring the urine refractive index. The two volunteers gave consent to the measurement of urine refractive index when providing the samples.
3. Results and discussion
3.1 Ray trajectory illustrating the intensity modulation
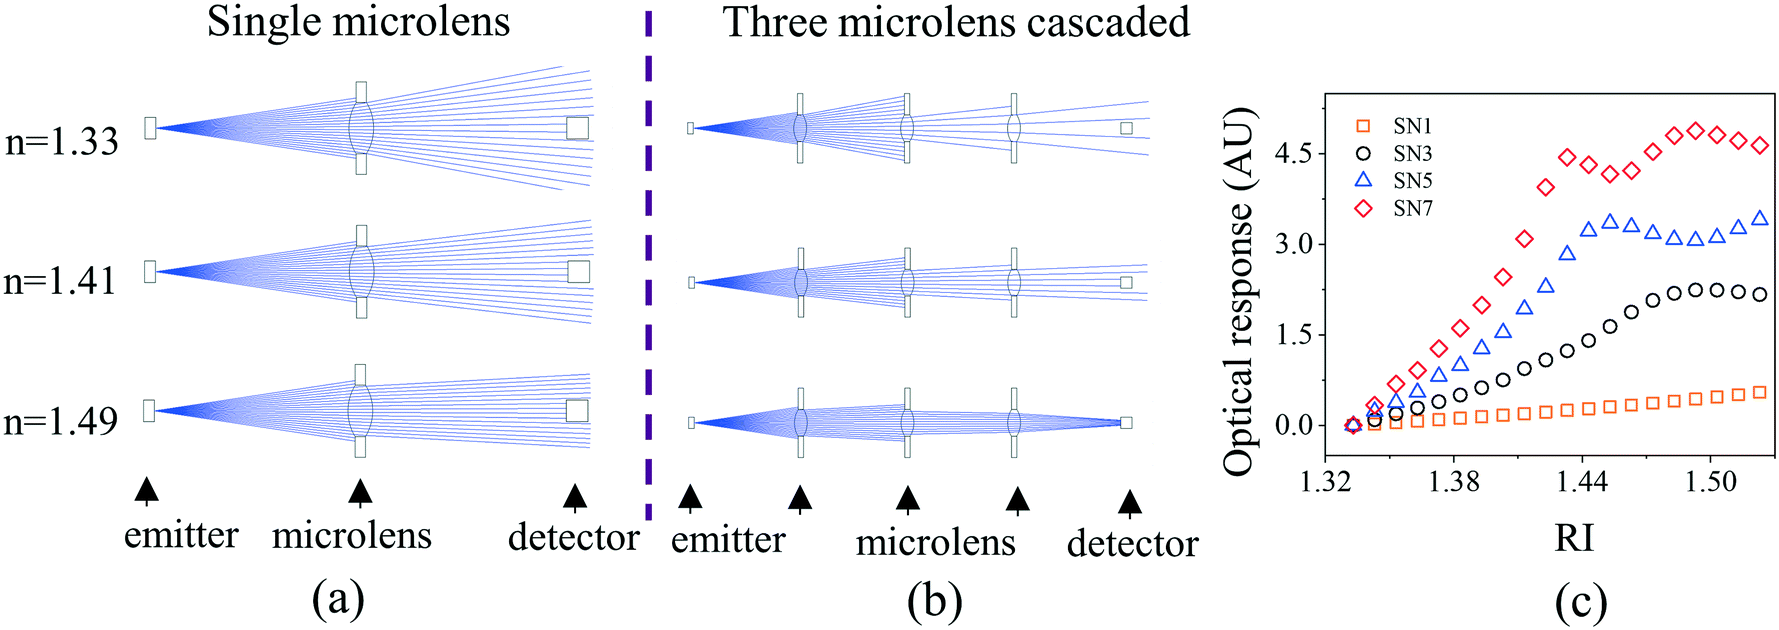
Ray trajectories presented in Fig. 2a and b qualitatively reveal the optical responses to RI variations corresponding to the single-microlens and three-microlens configurations, respectively. For both configurations, the probability of the rays received by the output fiber, representing the light intensity, increases with the RI value of the medium in the microlens cavity. Such intensity modulation lays the foundation for RI sensing. Since the intensity change with the RI variations for the three-microlens configuration is much more significant than that for the single-microlens configuration, it theoretically suggests the positive correlation between the number of cascaded microlenses and the sensitivity of optical response. Therefore, we systematically simulated the optical responses to four configurations (single microlens, three microlenses cascaded, five microlenses cascaded, seven microlenses cascaded). As presented in Fig. 2c, the sensitivity, represented by the curve slope, increases evidently with the number of cascaded microlenses. Specifically, the seven-microlens configuration achieves the highest sensitivity despite a narrow LDR. In contrast, a broad LDR is reached in the single-microlens situation at a cost of severely reduced sensitivity. For the three-microlens, five-microlens, and seven-microlens situations, the response curves become non-monotonous where the RI value is higher than 1.493, 1.453 and 1.433, respectively. In the aforementioned simulation, the microlens thickness was set as 35 μm, according to additional optimization results based on the five-microlens configuration, as presented in Fig. S2.†
 |
| | Fig. 2 Changes of the ray trajectories representing the optical responses to RI variations and the number of the cascaded microlens. (a) Single microlens. (b) Three microlenses cascaded. (c) Theoretical influences of the number of cascaded microlenses on the optical responses. SN1, SN3, SN5, and SN7 in (c) mean the number of the cascaded microlenses in the simulation. | |
3.2 Optofluidic chip with cascaded 3D microlenses
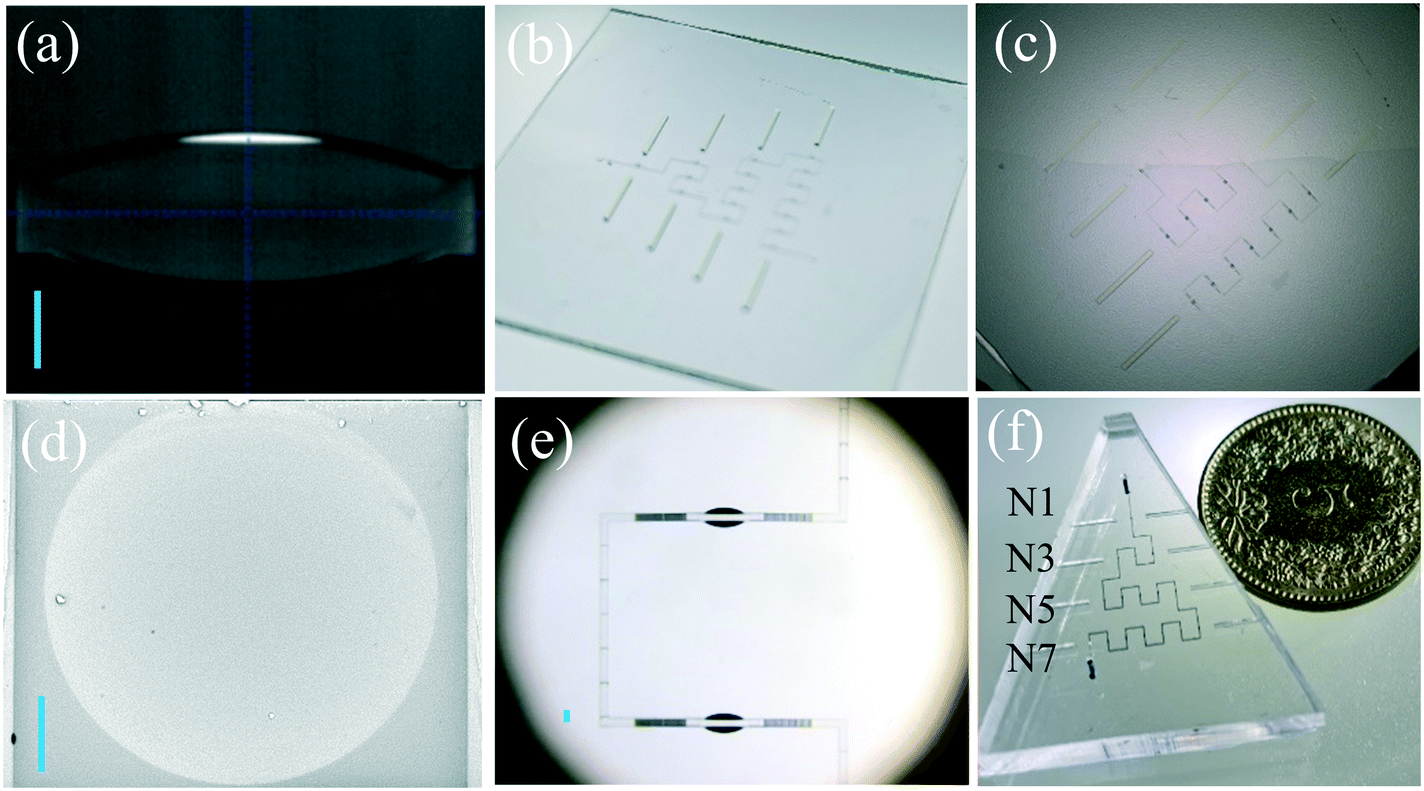
The printing process of the microlens mold is shown in Fig. 3a and Video S1.† The white line represents one streak left by the moving laser during the printing process. Fig. 3b shows the entire chip mold after removing the uncured photoresist. Fig. 3c reveals the process of peeling off the PDMS layer with replicated microstructures from its mold. Due to mold replication, a simple, low-cost and scale-up fabrication process is allowed. Because of high-resolution printing parameters, the excellent quality of the microlens surface with an average roughness of 49 ± 12 nm was confirmed through the SEM image (Fig. 3d) and AFM image (Fig. S3†). Fig. 3e shows the two microlens cavities cascaded in an optofluidic microchannel. When changing the RI value of the medium in the microlens cavity, the divergence or convergence of light transmitted consequently altered and thus caused a change of light intensity recorded by the output fiber. An overview of the chip is shown in Fig. 3f, which is filled with dye solution to clearly show the microchannel profile. Four detection channels configured with different numbers of cascaded microlenses (1, 3, 5, and 7) were integrated within the chip to realize the adjustable sensitivities for RI sensing. A five-cent Swiss franc was placed beside the chip to indicate the general chip size.
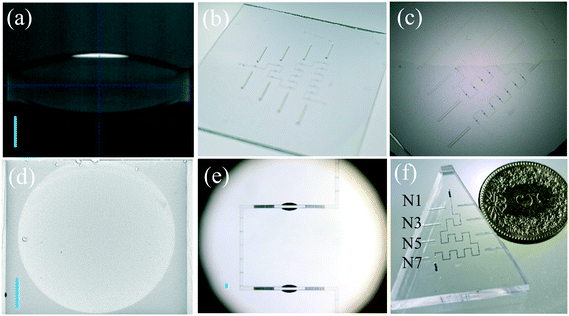 |
| | Fig. 3 3DCMOC fabrication. (a) A view of the microlens mold during its printing process. (b) The entire chip mold after removing the uncured photoresist. (c) Peeling off the PDMS chip from its mold. (d) The SEM image of the microlens with its optical axis aligned with the direction of observation. (e) Two microlens cavities cascaded in a flow channel. (f) The overview of the 3DCMOC (filled with dye solution). N1, N3, N5, and N7 represent the configurations with a certain number of the cascaded microlenses. Scale bars in images (a), (d) and (e): 50 μm. | |
3.3 Adjustable sensitivity
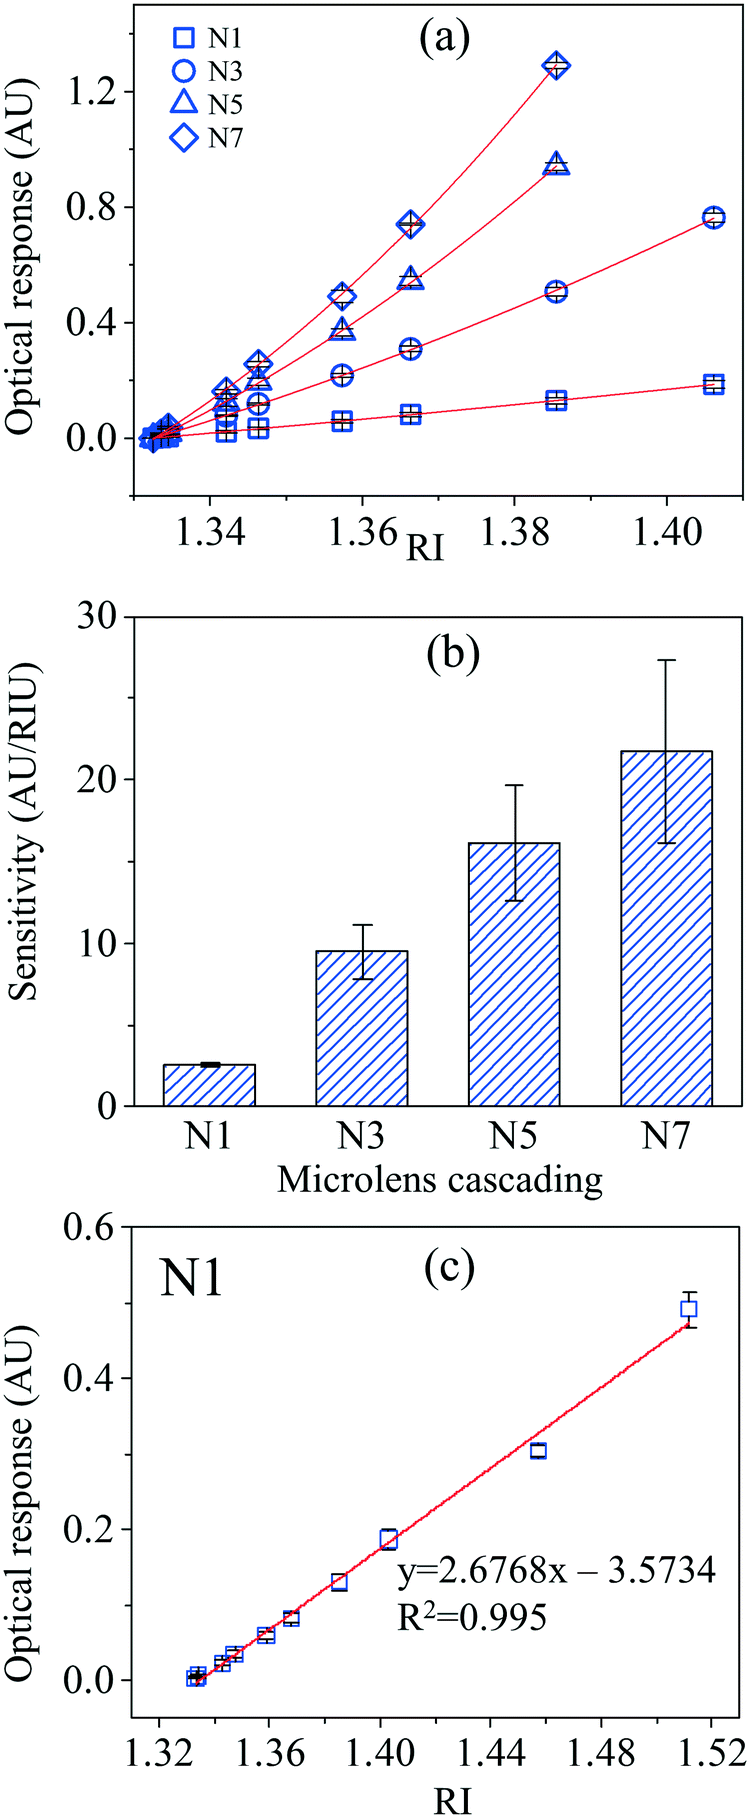
Adjustable sensitivity shows great importance to combine high sensitivity and a wide linear detection range for versatile applications. Fig. 4a shows the experimental optical responses of the 3DCMOC to RI variations in four different configurations. The error bar in Fig. 4a represents the standard deviation of the measurement results among the three chips. Such good reproducibility makes the scale-up production of chips via mold replication promising. With the increase of the number of the cascaded microlenses, the sensitivity was enhanced significantly, as shown in Fig. 4b, showing the consistent trend with the simulation result. Specifically, the seven-microlens configuration reached a mean sensitivity of 21 ± 5 AU·RIU−1 and a mean resolution of 3.8 × 10⁻⁵ ± 0.9 × 10⁻⁵ RIU, which are approximately 8 times and 4 times higher compared with those of the singe-microlens configuration (2.6 ± 0.2 AU·RIU−1and 1.5 × 10⁻⁴ ± 0.1 × 10⁻⁴ RIU). Although theoretically the sensitivity can be further improved with more microlenses cascaded, the optical signal will attenuate to a very low level at the reference state. Consequently, a poor signal-to-noise ratio may deteriorate the resolution. In the current work, the mean sensitivity is defined as the average derivative of the second-order polynomial curve fitting with all measured data points while the mean resolution is derived from the standard deviation of the baseline divided by the mean sensitivity. Noticeably, the sensitivity and resolution of the 3DCMOC for RI sensing are significantly improved compared with other intensity-modulation methods, as summarized in Table 1. Besides sensitivity and resolution, the LDR is another essential parameter indicating sensing performance. In the current work, the LDR is defined as the range from the reference RI value of ultrapure water, within which the coefficient of sensitivity variation is smaller than ±20%. Despite an excellent sensitivity and resolution achieved for the seven-microlens configuration, its LDR is as narrow as 1.3326–1.3548. Alternatively, when decreasing the number of the cascaded microlenses, the LDR becomes broader despite a decrease of sensitivity. Specifically, the single-microlens configuration can enable a broad LDR as shown in Fig. 4c, since strong linearity is maintained within the RI range between 1.3326 and 1.5120. Theoretically, the LDR can be further extended to 1.7239 according to the regression analysis. We also compared the experimental and simulation results and a good consistency was observed for both the single-microlens and the three-microlens configurations while for the five-microlens and the seven-microlens configurations, a mean deviation of 14–32% is observed as shown in Fig. S4.†
 |
| | Fig. 4 Adjustable sensitivity of the RI measurement. (a) The optical response to RI with different numbers of the cascaded microlenses. (b) The relationship between the number of the cascaded microlenses and the mean sensitivity. (c) The broad LDR for the single-microlens configuration despite the low sensitivity. The error bar represents the standard deviation of the result measured among the three chips (n = 6). | |
Table 1 Sensitivity and resolution of the optofluidic refractometers
| Refractometer |
Sensitivity |
Resolution |
LDR |
|
The value has been expressed as the logarithmization of the change of light intensity (power) for a direct comparison with the results in this work.
The resolution was directly derived from the power meter resolution in ref. 34 instead of the actual noise in the baseline operation and sensitivity.
For the single-microlens configuration, the LDR represents the tested range despite a theoretical extension.
|
| Liquid waveguide40 |
12.01a AU·RIU−1 |
7.00 × 10⁻⁶b RIU |
1.342–1.411 |
| Planar waveguide7,21 |
0.13–0.16a AU·RIU−1 |
(5.31–5.65) × 10−4 RIU |
1.333–1.373 |
| 3DCMOC (N1) |
2.6 ± 0.2 AU·RIU−1 |
1.5 × 10⁻⁴ ± 0.1 × 10⁻⁴ RIU |
1.3326–1.5120c |
| 3DCMOC (N3) |
9 ± 1 AU·RIU−1 |
5.3 × 10⁻⁵ ± 0.8 × 10⁻⁵ RIU |
1.3326–1.3822 |
| 3DCMOC (N5) |
16 ± 3 AU·RIU−1 |
5.8 × 10⁻⁵ ± 0.1 × 10⁻⁵ RIU |
1.3326–1.3595 |
| 3DCMOC (N7) |
21 ± 5 AU·RIU−1 |
3.8 × 10⁻⁵ ± 0.9 × 10⁻⁵ RIU |
1.3326–1.3548 |
3.4 Applications
3.4.1 Salinity.
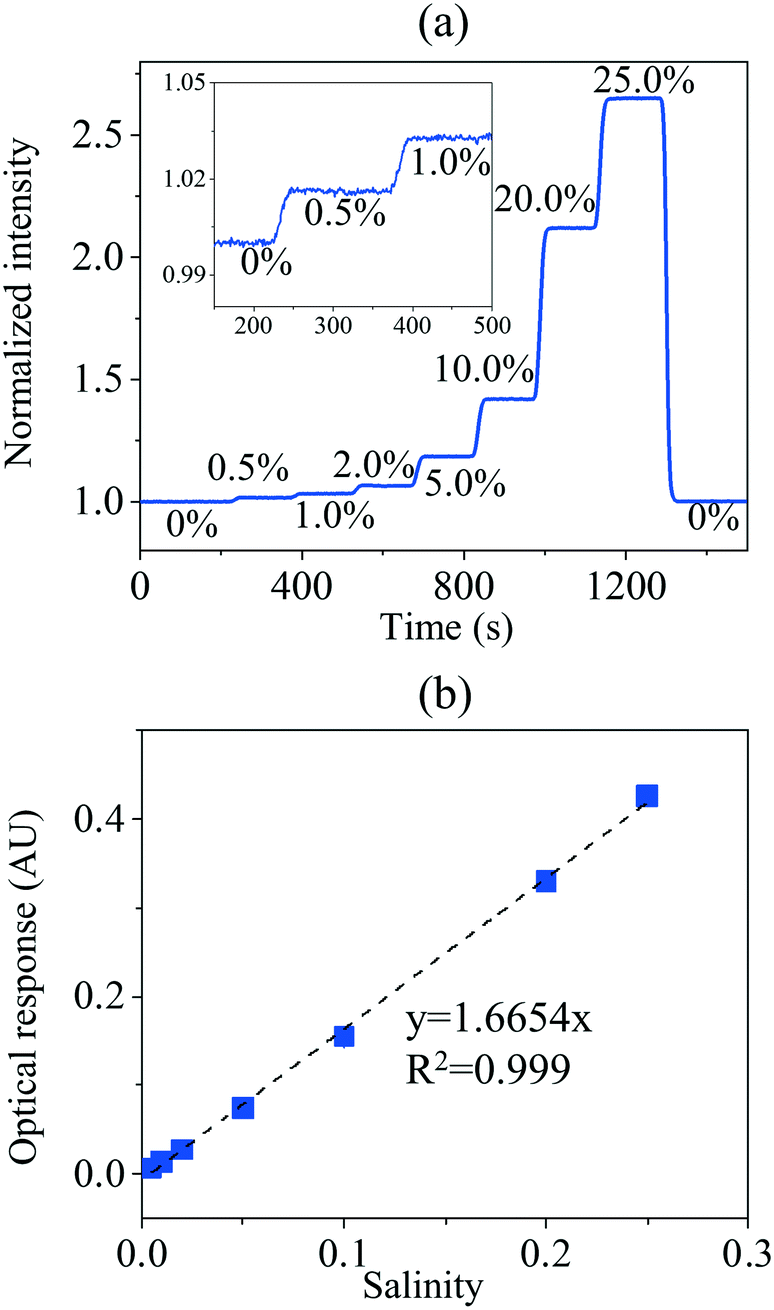
We have demonstrated the performance of the 3DCMOC for real-time salinity sensing specifically using the three-microlens configuration for a compromise between the sensitivity and LDR. Fig. 5a depicts the real-time signal responses to salinity changes. Initially, ultrapure water was pumped into the detection channel as a reference sample. Subsequently, seven samples with salinities between 0.5% and 25% were loaded successively. As a result, a step-wise increase of the optical response was observed. After loading the sample with 25% salinity, ultrapure water was pumped into the detection channel again. The response curve went back to the original baseline with a minor shift (0.14%), through which the operation stability of our detection system was confirmed. The inset in Fig. 5a shows the magnified plot at the low salinities (0%, 0.5% and 1.0%). We made a regression analysis between the optical response and salinity and a significant linear relationship was established with the R-squared value higher than 0.999, as indicated in Fig. 5b. According to the RI calibration curve established via the sucrose test, the RI values of the NaCl solutions were derived. We further made a regression between the RI values and salinity (0.5–25%) and found a linear relationship which matches well with those reported,41 as shown in Fig. S5a,† demonstrating the reliability of the 3DMOC for RI sensing. The LoD was calculated as 0.04% salinity according to three times of the standard deviation of baseline level and the regression equation, representing a significant improvement compared to the reported value 1% (w/w) using waveguide-based intensity modulation.21
 |
| | Fig. 5 Real-time salinity sensing. (a) Changes of light intensity with salinity variations. (b) The regression analysis between the salinity and optical responses. The error bar represents the standard deviation of the data among the three chips (n = 6). NaCl solution is transparent and has negligible absorption within the visible range, so the interference from absorption was not considered. | |
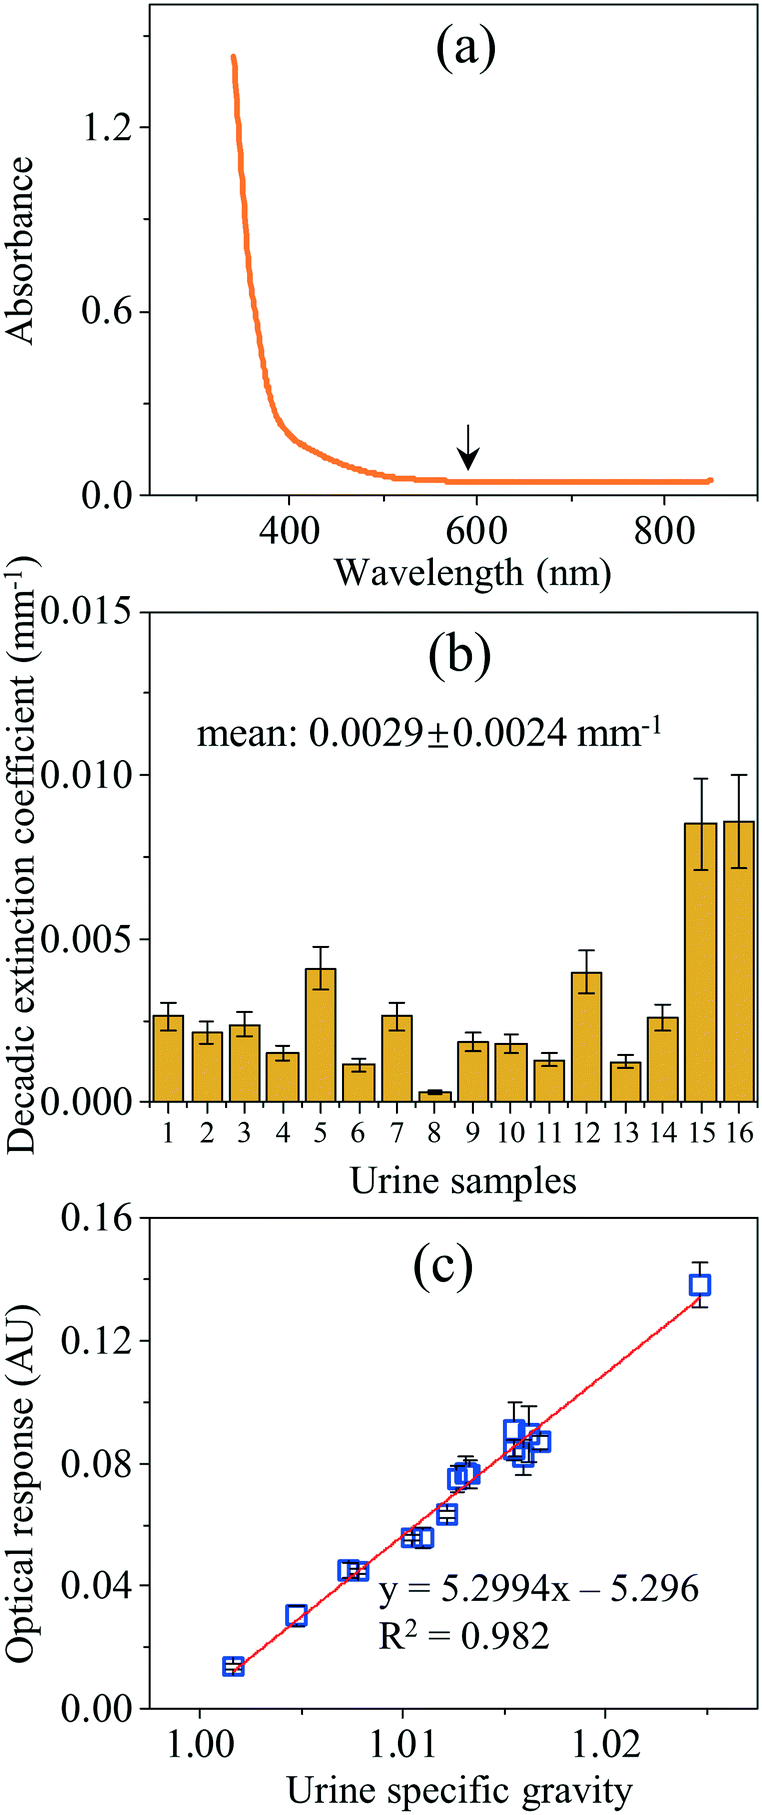
3.4.2 Urine specific gravity.
Urine specific gravity is a central parameter indicating the hydration balance in the body and urinary health. Urine specific gravity (defined as the mass-to-volume ratio) normally fluctuates within the range of 1.00–1.06, so the seven-microlens configuration is suitable for providing both enhanced sensitivity and excellent detection linearity in this limited range. Although the urine samples usually appear light yellow or yellow in our measurement, dominant absorption was observed within the UV and blue regions, as shown in Fig. 6a. Due to a low decadic extinction coefficient at 589 nm (0.0029 ± 0.0024 mm−1 found in this study, as shown in Fig. 6b) and a limited optical path length of less than 0.84 mm (for the seven-microlens configuration), light absorption has a negligible interference (0.57% ± 0.47%) on the measurement of the urine specific gravity. We made a regression analysis and a significant linear relationship was established with the R-squared value higher than 0.98, as shown in Fig. 6c, demonstrating the promising capabilities of the 3DCMOC for the measurements of the urine specific gravity. Furthermore, we converted the optical responses to RI values according to the calibration curve established via the sucrose test and made a regression analysis, as shown in Fig. S5b.† The linear relationship between the RI values and urine specific gravities is comparable to the results reported by the Japanese Society of Clinical Pathology.42
 |
| | Fig. 6 Optical responses to the variations of the urine specific gravity. (a) The typical absorption curve of the urine samples. (b) The variation of the mass extinction coefficient of the urine samples. The error bar represents the standard deviation of the results in triplicate. (c) Regression analysis between the optical responses and urine specific gravities. The error bar represents the standard deviation originating from the measurements on the three chips (n = 3). | |
4. Conclusions
Through the use of two-photon stereolithography, a 3D-cascade-microlens optofluidic chip (3DCMOC) has been successfully fabricated for RI sensing. From the aspect of fabrication, mold replication provides a simple method with excellent reproducibility and thus enables low-cost and scale-up productions. From the aspect of sensing performance, due to the integration of four detection channels configured with different numbers of microlenses, sensitivity can be adjusted according to specific scenarios. The sensitivity increases with the number of cascaded microlenses while the linear detection range (LDR) becomes narrower. The seven-microlens configuration achieves a mean sensitivity as high as 21 ± 5 AU·RIU−1 with a mean resolution of 3.8 × 10⁻⁵ ± 0.9 × 10⁻⁵ RIU despite a narrow LDR of 1.3326–1.3548. In contrast, the single-microlens configuration is much less sensitive to RI variations but possesses a relatively broad LDR (1.3326–1.5120). Furthermore, the 3DMOC proved to be reliable in both salinity measurement and urine specific gravity analysis, which makes it a promising device for industrial metrology, seawater monitoring and health management.
Author contributions
J. T. conceived of the idea, implemented all the experiments and wrote the manuscript. G. Q. assisted in the establishment of the optical system and made comments on the manuscript. X. Z. provided assistances in the establishment of the simulation method. J. W. provided comments and supervised this work.
Conflicts of interest
The authors declare no conflicts of interest.
Acknowledgements
We thank Di Qu and Sarka Drdova for their help in AFM characterization.
References
- A. Seki, K. Narita and K. Watanabe, Refractive Index Measurement in Sucrose Solution and Beverage Using Surface Plasmon Resonance Sensor Based on Hetero-core Structured Fiber Optic, Procedia Chem., 2016, 20, 115–117 CrossRef CAS.
- M. Muchtaridi, I. Musfiroh, N. N. Hambali and W. Indrayati, Determination of alcohol contents of fermentated black tape ketan based on different fermentation time using specific gravity, refractive index and GC-MS methods, J. Microbiol., Biotechnol. Food Sci., 2020, 2020, 933–946 Search PubMed.
- X. Fan and I. M. White, Optofluidic microsystems for chemical and biological analysis, Nat. Photonics, 2011, 5(10), 591 CrossRef CAS PubMed.
- Y. Qian, Y. Zhao, Q.-l. Wu and Y. Yang, Review of salinity measurement technology based on optical fiber sensor, Sens. Actuators, B, 2018, 260, 86–105 CrossRef CAS.
- J. Chen, W. Guo, M. Xia, W. Li and K. Yang, In situ measurement of seawater salinity with an optical refractometer based on total internal reflection method, Opt. Express, 2018, 26(20), 25510–25523 CrossRef CAS PubMed.
- C. Prokop, N. Irmler, B. Laegel, S. Wolff, A. Mitchell and C. Karnutsch, Optofluidic refractive index sensor based on air-suspended SU-8 grating couplers, Sens. Actuators, A, 2017, 263, 439–444 CrossRef CAS.
- I. C. Liu, P.-C. Chen, L.-K. Chau and G.-E. Chang, Optofluidic refractive-index sensors employing bent waveguide structures for low-cost, rapid chemical and biomedical sensing, Opt. Express, 2018, 26(1), 273–283 CrossRef CAS PubMed.
- N. Zhang, G. Humbert, Z. Wu, K. Li, P. P. Shum, N. M. Y. Zhang, Y. Cui, J.-L. Auguste, X. Q. Dinh and L. Wei, In-line optofluidic refractive index sensing in a side-channel photonic crystal fiber, Opt. Express, 2016, 24(24), 27674–27682 CrossRef CAS.
- H. Lee, M. Schmidt, P. Uebel, H. Tyagi, N. Joly, M. Scharrer and P. S. J. Russell, Optofluidic refractive-index sensor in step-index fiber with parallel hollow micro-channel, Opt. Express, 2011, 19(9), 8200–8207 CrossRef CAS PubMed.
- D. Psaltis, S. R. Quake and C. Yang, Developing optofluidic technology through the fusion of microfluidics and optics, Nature, 2006, 442(7101), 381–386 CrossRef CAS.
- J. Zhu, X. Zhu, Y. Zuo, X. Hu, Y. Shi, L. Liang and Y. Yang, Optofluidics: the interaction between light and flowing liquids in integrated devices, Opto-Electron. Adv., 2019, 2(11), 190007 CAS.
- P. Domachuk, I. C. M. Littler, M. Cronin-Golomb and B. J. Eggleton, Compact resonant integrated microfluidic refractometer, Appl. Phys. Lett., 2006, 88(9), 093513 CrossRef.
- W. Liang, Y. Huang, Y. Xu, R. K. Lee and A. Yariv, Highly sensitive fiber Bragg grating refractive index sensors, Appl. Phys. Lett., 2005, 86(15), 151122 CrossRef.
- D. Zhang, H. Wei and S. Krishnaswamy, 3D Printing Optofluidic Mach-Zehnder Interferometer on a Fiber Tip for Refractive Index Sensing, IEEE Photonics Technol. Lett., 2019, 31(21), 1725–1728 CAS.
- L. K. Chin, A. Q. Liu, C. S. Lim, C. L. Lin, T. C. Ayi and P. H. Yap, An optofluidic volume refractometer using Fabry–Pérot resonator with tunable liquid microlenses, Biomicrofluidics, 2010, 4(2), 024107 CrossRef PubMed.
- C. Wu, M.-L. V. Tse, Z. Liu, B.-O. Guan, A. P. Zhang, C. Lu and H.-Y. Tam, In-line microfluidic integration of photonic crystal fibres as a highly sensitive refractometer, Analyst, 2014, 139(21), 5422–5429 RSC.
- K. M. Mayer and J. H. Hafner, Localized Surface Plasmon Resonance
Sensors, Chem. Rev., 2011, 111(6), 3828–3857 CrossRef CAS PubMed.
- Y. Al-Qazwini, A. S. M. Noor, Z. Al-Qazwini, M. H. Yaacob, S. W. Harun and M. A. Mahdi, Refractive index sensor based on SPR in symmetrically etched plastic optical fibers, Sens. Actuators, A, 2016, 246, 163–169 CrossRef CAS.
- R. Funari, K.-Y. Chu and A. Q. Shen, Detection of antibodies against SARS-CoV-2 spike protein by gold nanospikes in an opto-microfluidic chip, Biosens. Bioelectron., 2020, 169, 112578 CrossRef CAS.
- S. Shi, L. Wang, R. Su, B. Liu, R. Huang, W. Qi and Z. He, A polydopamine-modified optical fiber SPR biosensor using electroless-plated gold films for immunoassays, Biosens. Bioelectron., 2015, 74, 454–460 CrossRef CAS PubMed.
- D. Barshilia, L.-K. Chau and G.-E. Chang, Low-cost planar waveguide-based optofluidic sensor for real-time refractive index sensing, Opt. Express, 2020, 28(19), 27337–27345 CrossRef CAS PubMed.
- S. Y. Yoon and S. Yang, Microfluidic refractometer with micro-image defocusing, Lab Chip, 2011, 11(5), 851–855 RSC.
- C. Song, N.-T. Nguyen, A. K. Asundi and S.-H. Tan, Tunable micro-optofluidic prism based on liquid-core liquid-cladding configuration, Opt. Lett., 2010, 35(3), 327–329 CrossRef PubMed.
- S. Xiong, A. Q. Liu, L. K. Chin and Y. Yang, An optofluidic prism tuned by two laminar flows, Lab Chip, 2011, 11(11), 1864–1869 RSC.
- K.-S. Chao, T.-Y. Lin and R.-J. Yang, Two optofluidic devices for the refractive index measurement of small volume of fluids, Microfluid. Nanofluid., 2012, 12(5), 697–704 CrossRef CAS.
- E. Weber and M. J. Vellekoop, Optofluidic micro-sensors for the determination of liquid concentrations, Lab Chip, 2012, 12(19), 3754–3759 RSC.
- Y. Hu, S. Rao, S. Wu, P. Wei, W. Qiu, D. Wu, B. Xu, J. Ni, L. Yang, J. Li, J. Chu and K. Sugioka, All-Glass 3D Optofluidic Microchip with Built-in Tunable Microlens Fabricated by Femtosecond Laser-Assisted Etching, Adv. Opt. Mater., 2018, 6(9), 1701299 CrossRef.
- N.-T. Nguyen, Micro-optofluidic Lenses: A review, Biomicrofluidics, 2010, 4(3), 031501 CrossRef PubMed.
- Y. C. Seow, S. P. Lim and H. P. Lee, Optofluidic variable-focus lenses for light manipulation, Lab Chip, 2012, 12(19), 3810–3815 RSC.
- G. Holzner, Y. Du, X. Cao, J. Choo, A. J. deMello and S. Stavrakis, An optofluidic system with integrated microlens arrays for parallel imaging flow cytometry, Lab Chip, 2018, 18(23), 3631–3637 RSC.
- J. Tang, G. Qiu, X. Cao, Y. Yue, X. Zhang, J. Schmitt and J. Wang, Self-aligned 3D microlenses in a chip fabricated with two-photon stereolithography for highly sensitive absorbance measurement, Lab Chip, 2020, 20(13), 2334–2342 RSC.
- C. Song, N.-T. Nguyen, S.-H. Tan and A. K. Asundi, Modelling and optimization of micro optofluidic lenses, Lab Chip, 2009, 9(9), 1178–1184 RSC.
- S. K. Y. Tang, C. A. Stan and G. M. Whitesides, Dynamically reconfigurable liquid-core liquid-cladding lens in a microfluidic channel, Lab Chip, 2008, 8(3), 395–401 RSC.
- X. Tu, Y. Luo, T. Huang, J. Gan and C. Song, Optofluidic refractive index sensor based on asymmetric diffraction, Opt. Express, 2019, 27(13), 17809–17818 CrossRef CAS PubMed.
- J. Seo and L. P. Lee, Disposable integrated microfluidics with self-aligned planar microlenses, Sens. Actuators, B, 2004, 99(2–3), 615–622 CrossRef CAS.
- T. Gissibl, S. Thiele, A. Herkommer and H. Giessen, Two-photon direct laser writing of ultracompact multi-lens objectives, Nat. Photonics, 2016, 10(8), 554–560 CrossRef CAS.
- X. Cao, Y. Du, A. Küffner, J. Van Wyk, P. Arosio, J. Wang, P. Fischer, S. Stavrakis and A. deMello, A Counter Propagating Lens-Mirror System for Ultrahigh Throughput Single Droplet Detection, Small, 2020, 16(20), 1907534 CrossRef CAS PubMed.
- J. Tang, X. Cao, G. Qiu, A. deMello and J. Wang, Optical-Switch-Enabled Microfluidics for Sensitive Multichannel Colorimetric Analysis, Anal. Chem., 2021, 93(17), 6784–6791 CrossRef CAS PubMed.
-
C. F. Snyder and A. T. Hattenburg, Refractive indices and densities of aqueous solutions of invert sugar, 1963 Search PubMed.
- M. Oraie and H. Latifi, Real-time refractive-index sensing by using liquid core/liquid cladding optofluidic waveguide, Opt. Laser Technol., 2019, 111, 303–306 CrossRef CAS.
- C.-Y. Tan and Y.-X. Huang, Dependence of refractive index on concentration and temperature in electrolyte solution, polar solution, nonpolar solution, and protein solution, J. Chem. Eng. Data, 2015, 60(10), 2827–2833 CrossRef CAS.
- Y. F. Kitagawa, T. Takahashi and H. Hayashi, Relationship between the refractive index and specific gravity of the rat urine, Exp. Anim., 1981, 30(3), 307–311 CrossRef CAS PubMed.
Footnote |
| † Electronic supplementary information (ESI) available. See DOI: 10.1039/d1lc00570g |
|
| This journal is © The Royal Society of Chemistry 2021 |
Click here to see how this site uses Cookies. View our privacy policy here. 
 Open Access Article
 This Open Access Article is licensed under a Creative Commons Attribution-Non Commercial 3.0 Unported Licence
 *ab
*ab