
A high-throughput multiplexed microfluidic device for COVID-19 serology assays†
Roberto
Rodriguez-Moncayo‡
 a,
Diana F.
Cedillo-Alcantar‡
a,
Pablo E.
Guevara-Pantoja
a,
Oriana G.
Chavez-Pineda
a,
Jose A.
Hernandez-Ortiz
a,
Josue U.
Amador-Hernandez
a,
Gustavo
Rojas-Velasco
b,
Fausto
Sanchez-Muñoz
c,
Daniel
Manzur-Sandoval
b,
Luis D.
Patino-Lopez
d,
Daniel A.
May-Arrioja
e,
Rosalinda
Posadas-Sanchez
g,
Gilberto
Vargas-Alarcon
f and
Jose L.
Garcia-Cordero
*a
a,
Diana F.
Cedillo-Alcantar‡
a,
Pablo E.
Guevara-Pantoja
a,
Oriana G.
Chavez-Pineda
a,
Jose A.
Hernandez-Ortiz
a,
Josue U.
Amador-Hernandez
a,
Gustavo
Rojas-Velasco
b,
Fausto
Sanchez-Muñoz
c,
Daniel
Manzur-Sandoval
b,
Luis D.
Patino-Lopez
d,
Daniel A.
May-Arrioja
e,
Rosalinda
Posadas-Sanchez
g,
Gilberto
Vargas-Alarcon
f and
Jose L.
Garcia-Cordero
*a
aLaboratory of Microtechnologies for Biomedicine, Centro de Investigación y de Estudios Avanzados del Instituto Politécnico Nacional (Cinvestav), Monterrey, NL, Mexico. E-mail: jlgarciac@cinvestav.mx
bIntensive Care Unit, Instituto Nacional de Cardiología “Ignacio Chávez”, Ciudad de México, Mexico
cDepartment of Immunology, Instituto Nacional de Cardiología “Ignacio Chávez”, Ciudad de México, Mexico
dDepartment of Renewable Energy, Centro de Investigación Científica de Yucatán (CICY), Mérida, Yucatán, Mexico
eFiber and Integrated Optics Laboratory, Centro de Investigaciones en Óptica (CIO), Aguascalientes, Mexico
fDepartment of Endocrinology, Instituto Nacional de Cardiología “Ignacio Chávez”, Ciudad de México, Mexico
gResearch Direction, Instituto Nacional de Cardiología “Ignacio Chávez”, Ciudad de México, Mexico
First published on 19th November 2020
Abstract
The applications of serology tests to the virus SARS-CoV-2 are diverse, ranging from diagnosing COVID-19, understanding the humoral response to this disease, and estimating its prevalence in a population, to modeling the course of the pandemic. COVID-19 serology assays will significantly benefit from sensitive and reliable technologies that can process dozens of samples in parallel, thus reducing costs and time; however, they will also benefit from biosensors that can assess antibody reactivities to multiple SARS-CoV-2 antigens. Here, we report a high-throughput microfluidic device that can assess antibody reactivities against four SARS-CoV-2 antigens from up to 50 serum samples in parallel. This semi-automatic platform measures IgG and IgM levels against four SARS-CoV-2 proteins: the spike protein (S), the S1 subunit (S1), the receptor-binding domain (RBD), and the nucleocapsid (N). After assay optimization, we evaluated sera from infected individuals with COVID-19 and a cohort of archival samples from 2018. The assay achieved a sensitivity of 95% and a specificity of 91%. Nonetheless, both parameters increased to 100% when evaluating sera from individuals in the third week after symptom onset. To further assess our platform's utility, we monitored the antibody titers from 5 COVID-19 patients over a time course of several weeks. Our platform can aid in global efforts to control and understand COVID-19.
Introduction
In late 2019, a novel coronavirus named “severe acute respiratory syndrome-coronavirus 2” (SARS-CoV-2), which produces the “coronavirus disease 2019” (COVID-19), reportedly emerged in China and quickly spread around the globe. In March 2020, the World Health Organization (WHO) declared COVID-19 a pandemic. As of September 2020, over 27 million people have been infected, and over 800![[thin space (1/6-em)]](https://www.rsc.org/images/entities/char_2009.gif) 000 deaths have been reported. As a result, numerous countries worldwide have adopted significant lockdowns and mobility restrictions to decrease the infection rate, wreaking havoc on the global economy.1 Two types of tests are being used to diagnose COVID-19: nucleic-acid amplification tests (NAAT) and antibody tests. The primary diagnostic test for acute SARS-CoV-2 infection relies on detecting viral RNA by reverse transcription-polymerase chain reaction (RT-PCR). Although NAAT is highly sensitive, it suffers from high false negative rates (up to 50%).2 At this point, it is not clear if this is due to the sampling technique (nose or throat swabs) or timing of the sampling (differences in viral shedding).3,4 Nonetheless, NAAT remains the most robust confirmatory test for acute SARS-COV-2.
000 deaths have been reported. As a result, numerous countries worldwide have adopted significant lockdowns and mobility restrictions to decrease the infection rate, wreaking havoc on the global economy.1 Two types of tests are being used to diagnose COVID-19: nucleic-acid amplification tests (NAAT) and antibody tests. The primary diagnostic test for acute SARS-CoV-2 infection relies on detecting viral RNA by reverse transcription-polymerase chain reaction (RT-PCR). Although NAAT is highly sensitive, it suffers from high false negative rates (up to 50%).2 At this point, it is not clear if this is due to the sampling technique (nose or throat swabs) or timing of the sampling (differences in viral shedding).3,4 Nonetheless, NAAT remains the most robust confirmatory test for acute SARS-COV-2.
On the other hand, serology assays which seek for the presence of immunoglobulins (Igs)—mainly in serum or plasma—produced in response to the SARS-CoV-2 infection, are most accurate 2–3 weeks after symptom onset. This is because the immune response matures, although Igs can be detected as early as 1 day after the first symptoms.2 It is not clear how long the immune response for SARS-CoV-2 lasts, but IgG levels against the virus SARS-CoV have been detectable in recovered individuals two years after being infected.5 Antibody tests are useful for diagnostic purposes and to understand and assess the humoral response after infection or vaccination, investigate the prevalence of virus immunity in a population, and identify donors for treatment with convalescent plasma.6 Compared to NAAT, serological diagnoses can be low-cost, rapid, and easy-to-use. They can distinguish between early and late infections with enough sensitivity by measuring the IgM and IgG isotypes, respectively.7 Serological assays could help identify asymptomatic individuals or those who had mild symptoms and cannot afford a NAAT test. Furthermore, serosurveys will be helpful in determining the prevalence of the infection in a population, monitor the spread rate, and identify at-risk populations,8 information that can be used by governments to adopt public health policies.
Serological assays for SARS-CoV-2 developed to date include the enzyme-linked immunosorbent assay (ELISA),9–13 lateral flow assays (LFAs),13–16 the luciferase immunoprecipitation system (LIPS),17–19 chemiluminescence immunoassays (CLIAs),20–22 and single-molecule arrays (SIMOAs).7 Except for the SIMOA assay, the rest of the assays can only assess binding against only one antigen, limiting their utility in diagnosis and monitoring of the evolution of the humoral response upon infection or vaccination. Here, we present a microfluidic platform for the semi-automatic detection of IgG and IgM raised against four different SARS-CoV-2 antigens from up to 50 different serum samples, with minimal assay reagent consumption. This development opens the door to low-cost massive screenings.
Results
Microfluidic device
The microfluidic device was designed to detect antibody levels against four proteins of the virus SARS-CoV-2—spike (S), the S1 subunit (S1), the receptor binding domain (RBD), and nucleocapsid (N)—from 50 serum samples of only 6 μL. The device is made with classic multilayer soft-lithography techniques that facilitate automation and fluid control and is further powered by the mechanically induced trapping of molecular interactions (MITOMI) technique,23Fig. 1a. In our case, MITOMI serves as a fluorescence biosensor24–27 where indirect immunoassays for each of the four viral antigens are performed. MITOMI is enabled using a button valve located on each microchamber. The device contains an array of 200 microchambers (4 rows and 50 columns) with a volume of 5.5 nL each. The design of the device is shown in Fig. S1.† After loading all the reagents through 8 inlets, the device is operated remotely from a computer using only 16 control lines; notably, scaling up the sample throughput will require the same amount of control lines.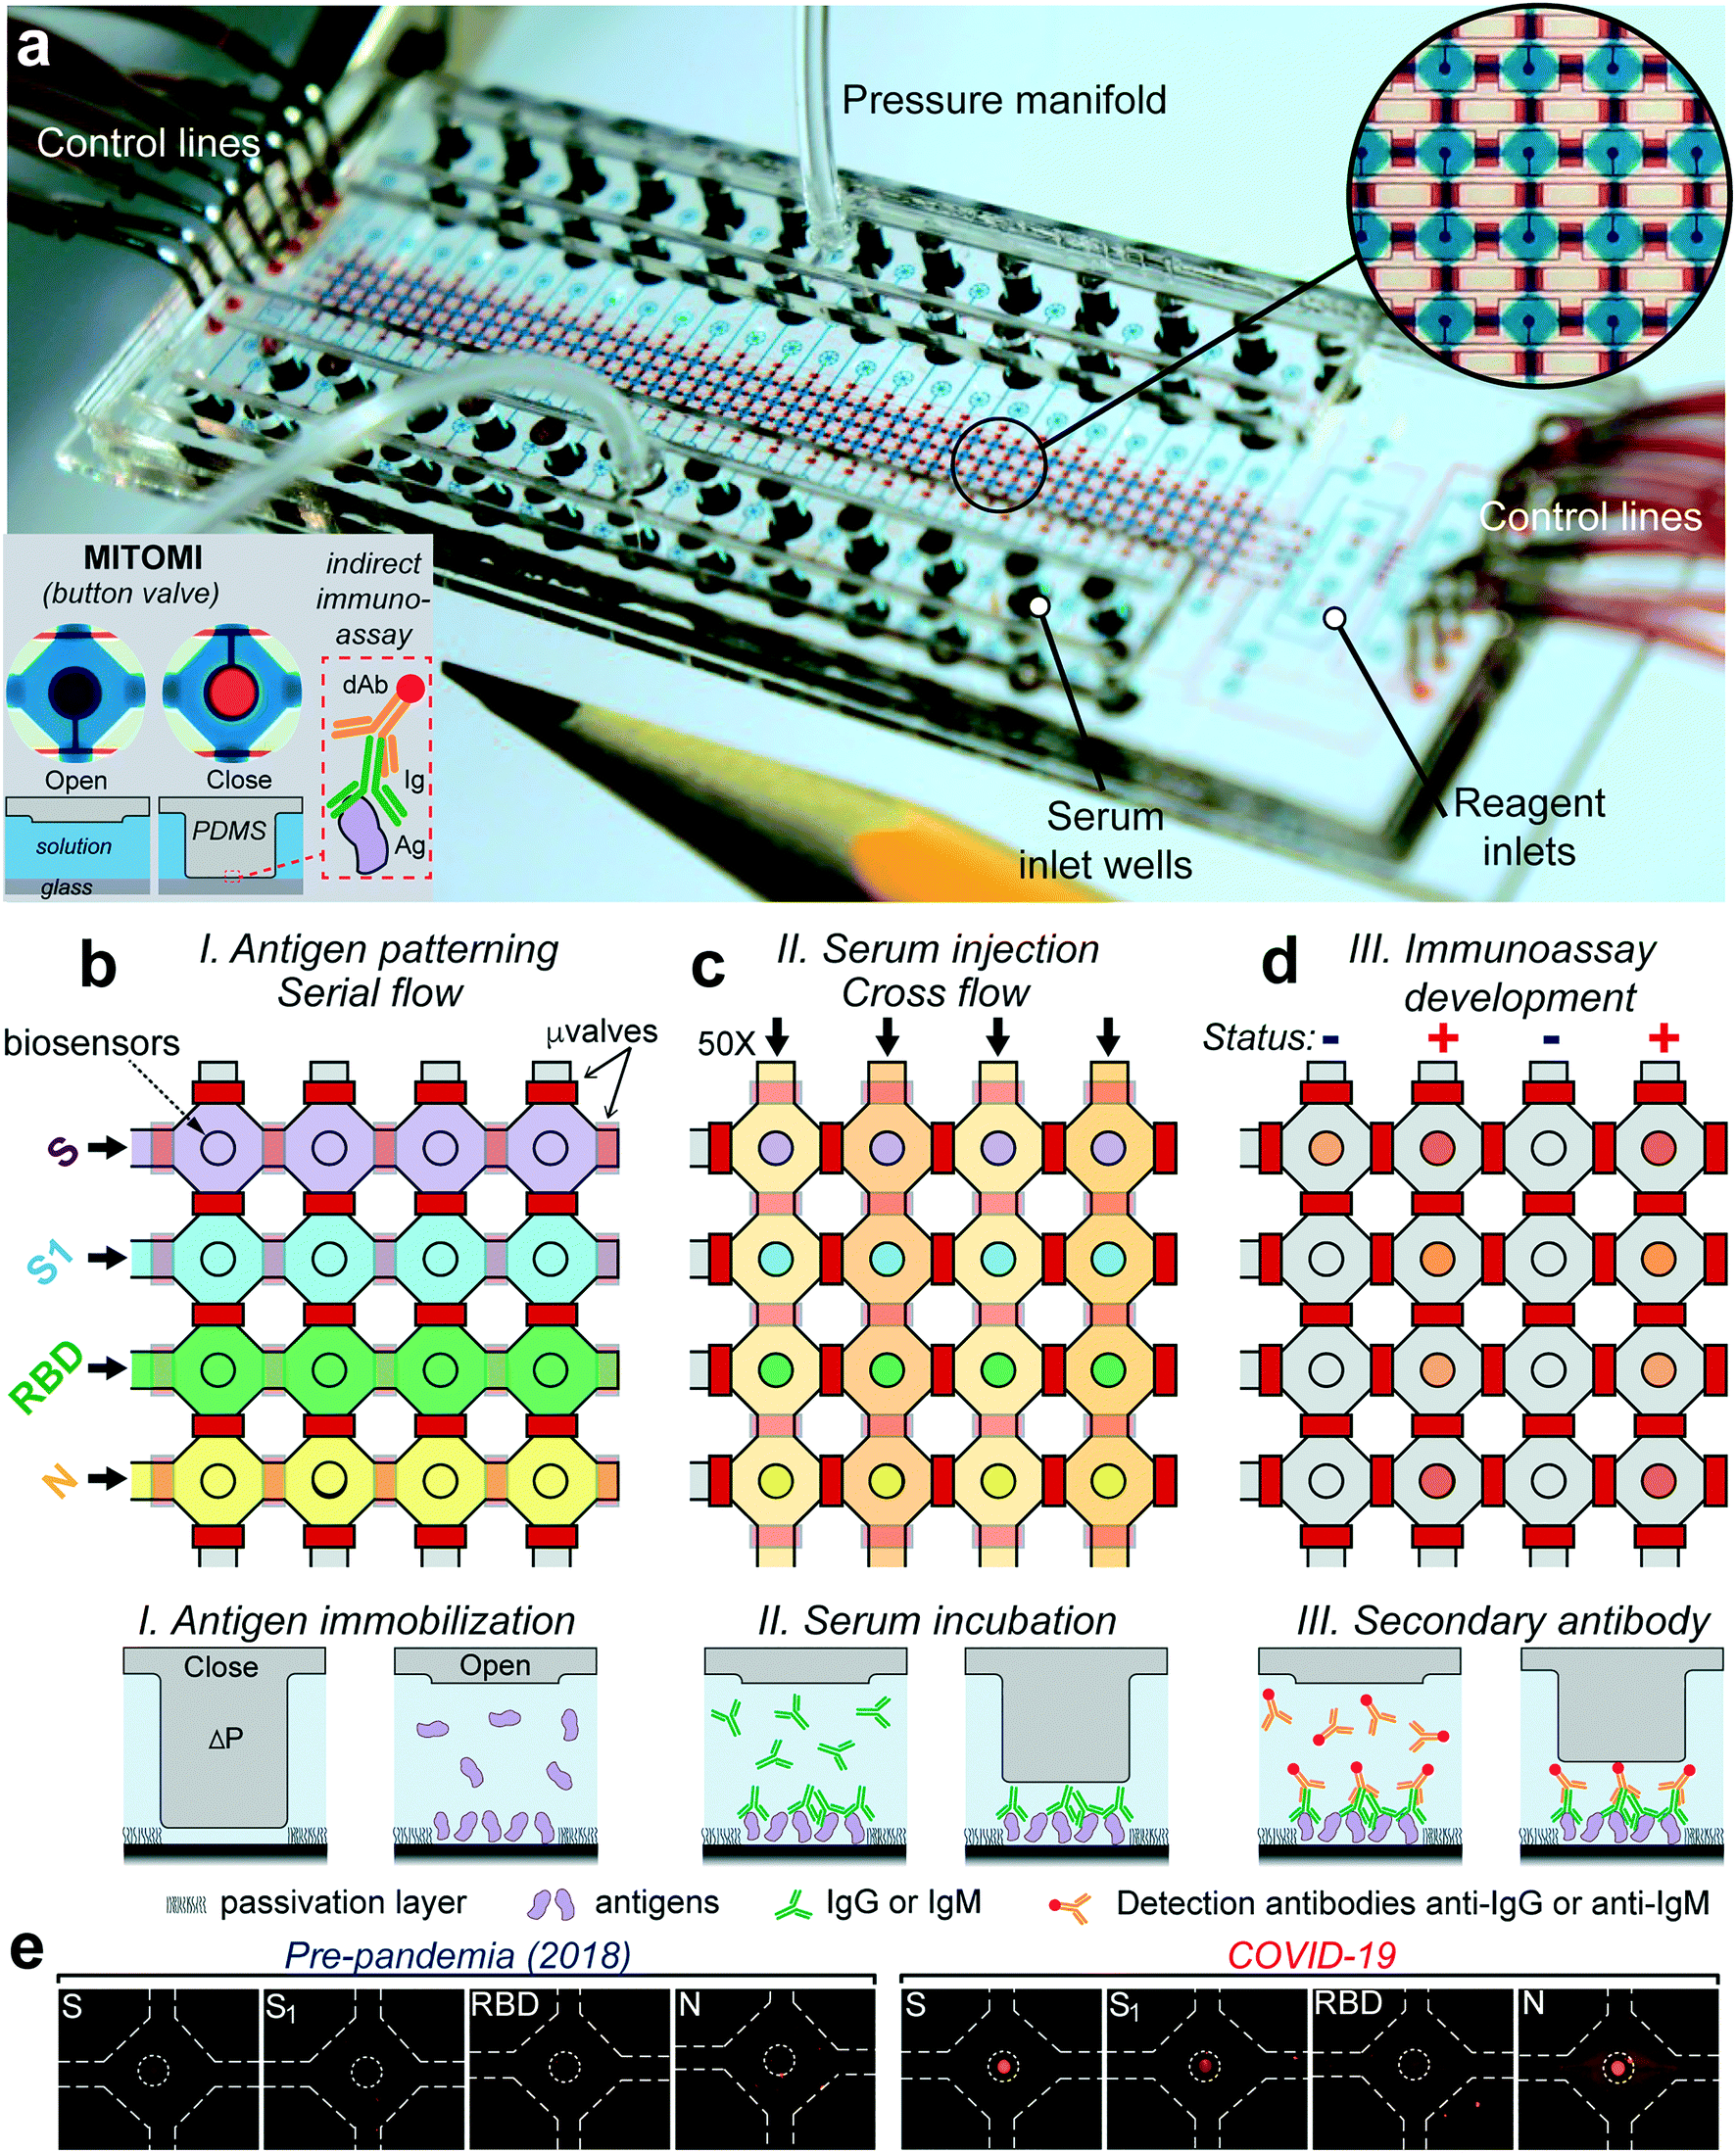 | ||
| Fig. 1 Microfluidic device for COVID-19 antibody detection. (a) Photograph of the device indicating its different components. The tip of a pencil is shown for reference. Closeup shows an array of microchambers (blue) surrounded by valves (red) and a MITOMI button valve (red circle) in the center. Bottom inset shows top-view photographs and a cross-sectional view of the actuation of the MITOMI button. An indirect immunoassay is performed on the surface of a glass substrate; dAb = detection antibody, Ig = serum antibodies, and Ag = antigen. (b) Gross microfluidic assay schematic flow showing antigen immobilization of the four antigens, followed by (c) injection of the 50 samples and (d) immunoassay quantitation by the introduction of fluorescently labeled secondary antibodies. Solid or transparent red rectangles denote closing or opening of the microvalves, respectively. Bottom schematics show how MITOMI is used to perform an indirect immunoassay. S = spike; S1 = subunit S1; RBD = region binding domain; N = nucleocapsid. (e) Typical fluorescence micrographs of an array of biosensors for samples collected before the pandemic (left) and a COVID-19 confirmed case (right). | ||
The device's operation starts by patterning the four viral proteins in parallel underneath each MITOMI button valve through their respective rows, Fig. 1b. This is followed by a passivation protocol of the microchannel surfaces. To increase the stability of the immobilized viral antigens through covalent immobilization,28 we employed glass slides coated with (3-aminopropyl)triethoxysilane (APTES) activated with glutaraldehyde (GA). Next, the 50 serum samples are pipetted into each well, sealed with a pressure manifold to flow all the samples through all the chambers for 30 min, Fig. 1c and Video S1.† After a washing step, anti-IgG or anti-IgM fluorescently labeled antibodies are introduced to all the microchambers and incubated for 30 min, followed by a final washing step. Next, the biosensors are imaged with an inverted fluorescence microscope. The fluorescence signal intensity from each biosensor is proportional to the amount of IgG or IgM bound to the antigens. Significantly, all the assay's steps are automated and controlled from a computer to ensure repeatability and minimal user intervention.
Optimizing assay performance
A significant hindrance to immunoassays is noise background caused by unspecific absorption of serum proteins.29 We investigated several passivation protocols to reduce fluorescence background. We found that a combination of neutravidin followed by 3% ethanolamine gave the highest signal to background (STB) ratio (Fig. S2†). Because a high concentration of serum proteins also increases noise background, we also studied the effects of serum dilution on the antibody detection levels (Fig. S3†). A lower dilution (1:10) increased the STB ratio without significantly increasing background noise.
In the absence of a gold standard for COVID-19 serology assays14 to compare our results, we sought to validate our device's robustness and reproducibility by performing an intra- and inter-assay correlation analysis. We compared the fluorescence raw values between assays carried out in two different devices on different days (inter-assay) and obtained a Pearson correlation coefficient (R) of 0.933 (Fig. 2a). Samples ran in duplicate in the same device (intra-assay) resulted in an R of 0.954 (Fig. 2b). To estimate our biosensors' limit of detection (LOD), we prepared serial dilutions of a monoclonal, chimeric antibody obtained by immunizing mice with the protein RBD. We measured its reactivity against the antigens RBD, S, and S1 (Fig. 2c), finding a LOD of 1.6 ng mL−1 for RBD. Overall, these experiments confirm the reproducibility of our device to perform COVID-19 serology assays.
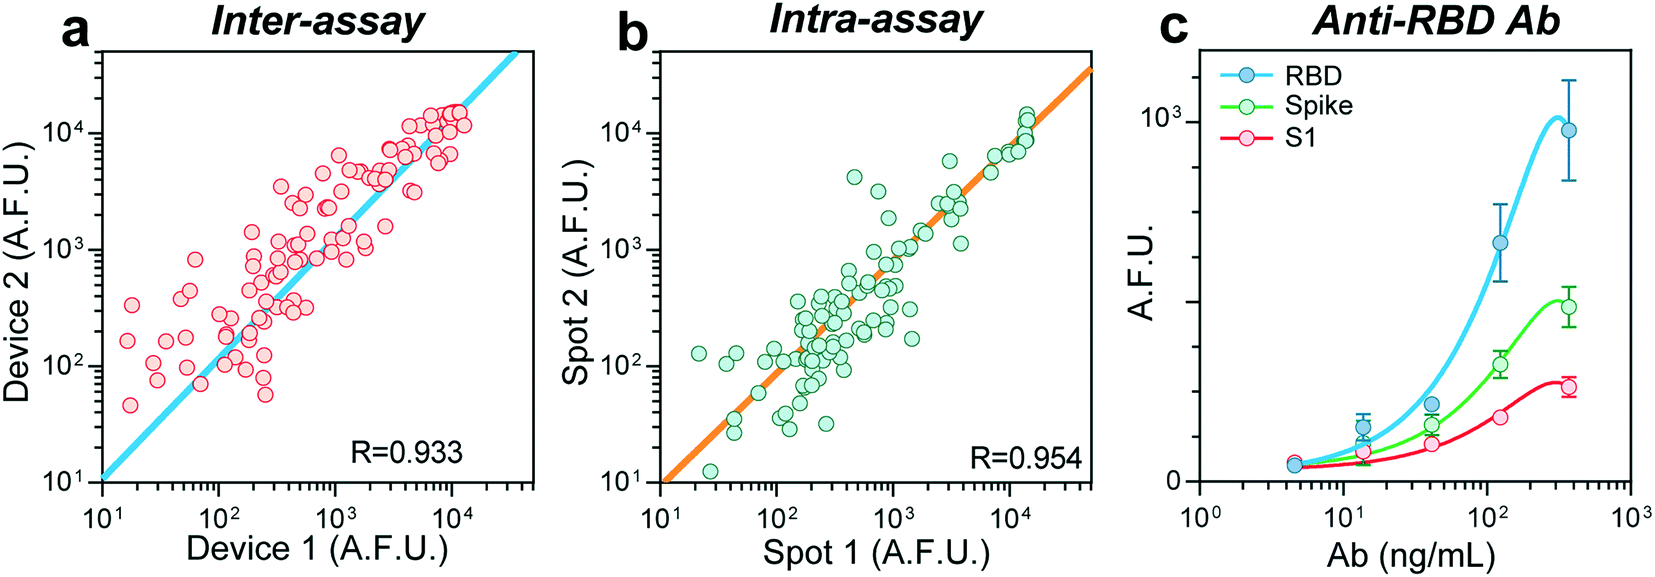 | ||
| Fig. 2 Device performance and reproducibility. (a) Inter-assay correlation between assays performed in two different devices over different days, n = 132. (b) Correlation between two samples measured in the same device. Bottom right corner shows the correlation coefficients, n =103. (c) Fluorescence intensity values for a dilution curve of a chimeric monoclonal antibody for the RBD protein. Values were measured for RBD, spike, and the S1 subunit, n = 3. Error bars show one standard deviation. A.F.U. = arbitrary fluorescence units. | ||
Detection of anti-SARS-CoV-2 antibodies in serum samples from patients and healthy individuals using our device
We used our device to test the immunoglobulin levels of 100 different serum samples. Sixty-six samples were from individuals tested positive for SARS-CoV-2 through PCR with reverse transcription (PCR-RT). The nasopharyngeal swab tests were performed between April and May of 2020 at a COVID-19 designated hospital in Mexico City. The age of the COVID-19 patients ranged from 19 to 80 years old, 40% were diabetic, and of the total samples received, 68% were from men. A summary of the clinical data of all the individuals is shown in Table S1.† The samples were collected between 4 and 54 days after symptom onset. The control cohort consisted of 34 serum samples collected from healthy individuals in 2018 (two years before the beginning of the pandemic).Fig. 3 shows the IgG and IgM measured levels against the four viral antigens for all the samples. The order for all the samples is maintained across all bar graphs. The COVID-19 samples were further classified into two groups, an early-stage cohort (<14 days of symptom onset) and a late-stage (≥14 days) cohort, as the median time for seroconversion for both IgG and IgM has been reported to be 13–14 days after the first symptoms, at least for the N and S proteins.19,30 Except for the IgG antibodies against the S1 subunit, we detected significantly higher IgG and IgM antibody responses to all the proteins in patients with COVID-19 compared to the negative controls (see P values in the scatter dot plots). The fluorescence levels measured for IgM are about half or less than the values measured for the IgG antibodies, indicating its lower serum concentration than IgG. Consistent with other reports, the reactivity against S was more robust than that for RBD.9 Some control samples (n = 4) from 2018 presented high cross-reactivity against the S protein and, to a lower extent, to the S1 subunit, with no detectable signals for the RBD and N antigens. Encouragingly, the rest of the late-stage cohort individuals showed some reactivity to at least one of the antigens. We wondered whether there was a correlation between reactivities to pairs of antigens for all the COVID-19 samples (Fig. S4 and S5†). We found a strong correlation between the viral antigens S and N for IgG (R = 0.876) (see Fig. 3e), which confirms earlier reports that IgG antibodies against these antigens are detectable at about the same time.31 Also, there was a slight correlation between S and S1 (R = 0.614) and RBD and N (R = 0.632) for IgM, while the rest of the combinations had a low correlation (R < 0.5).
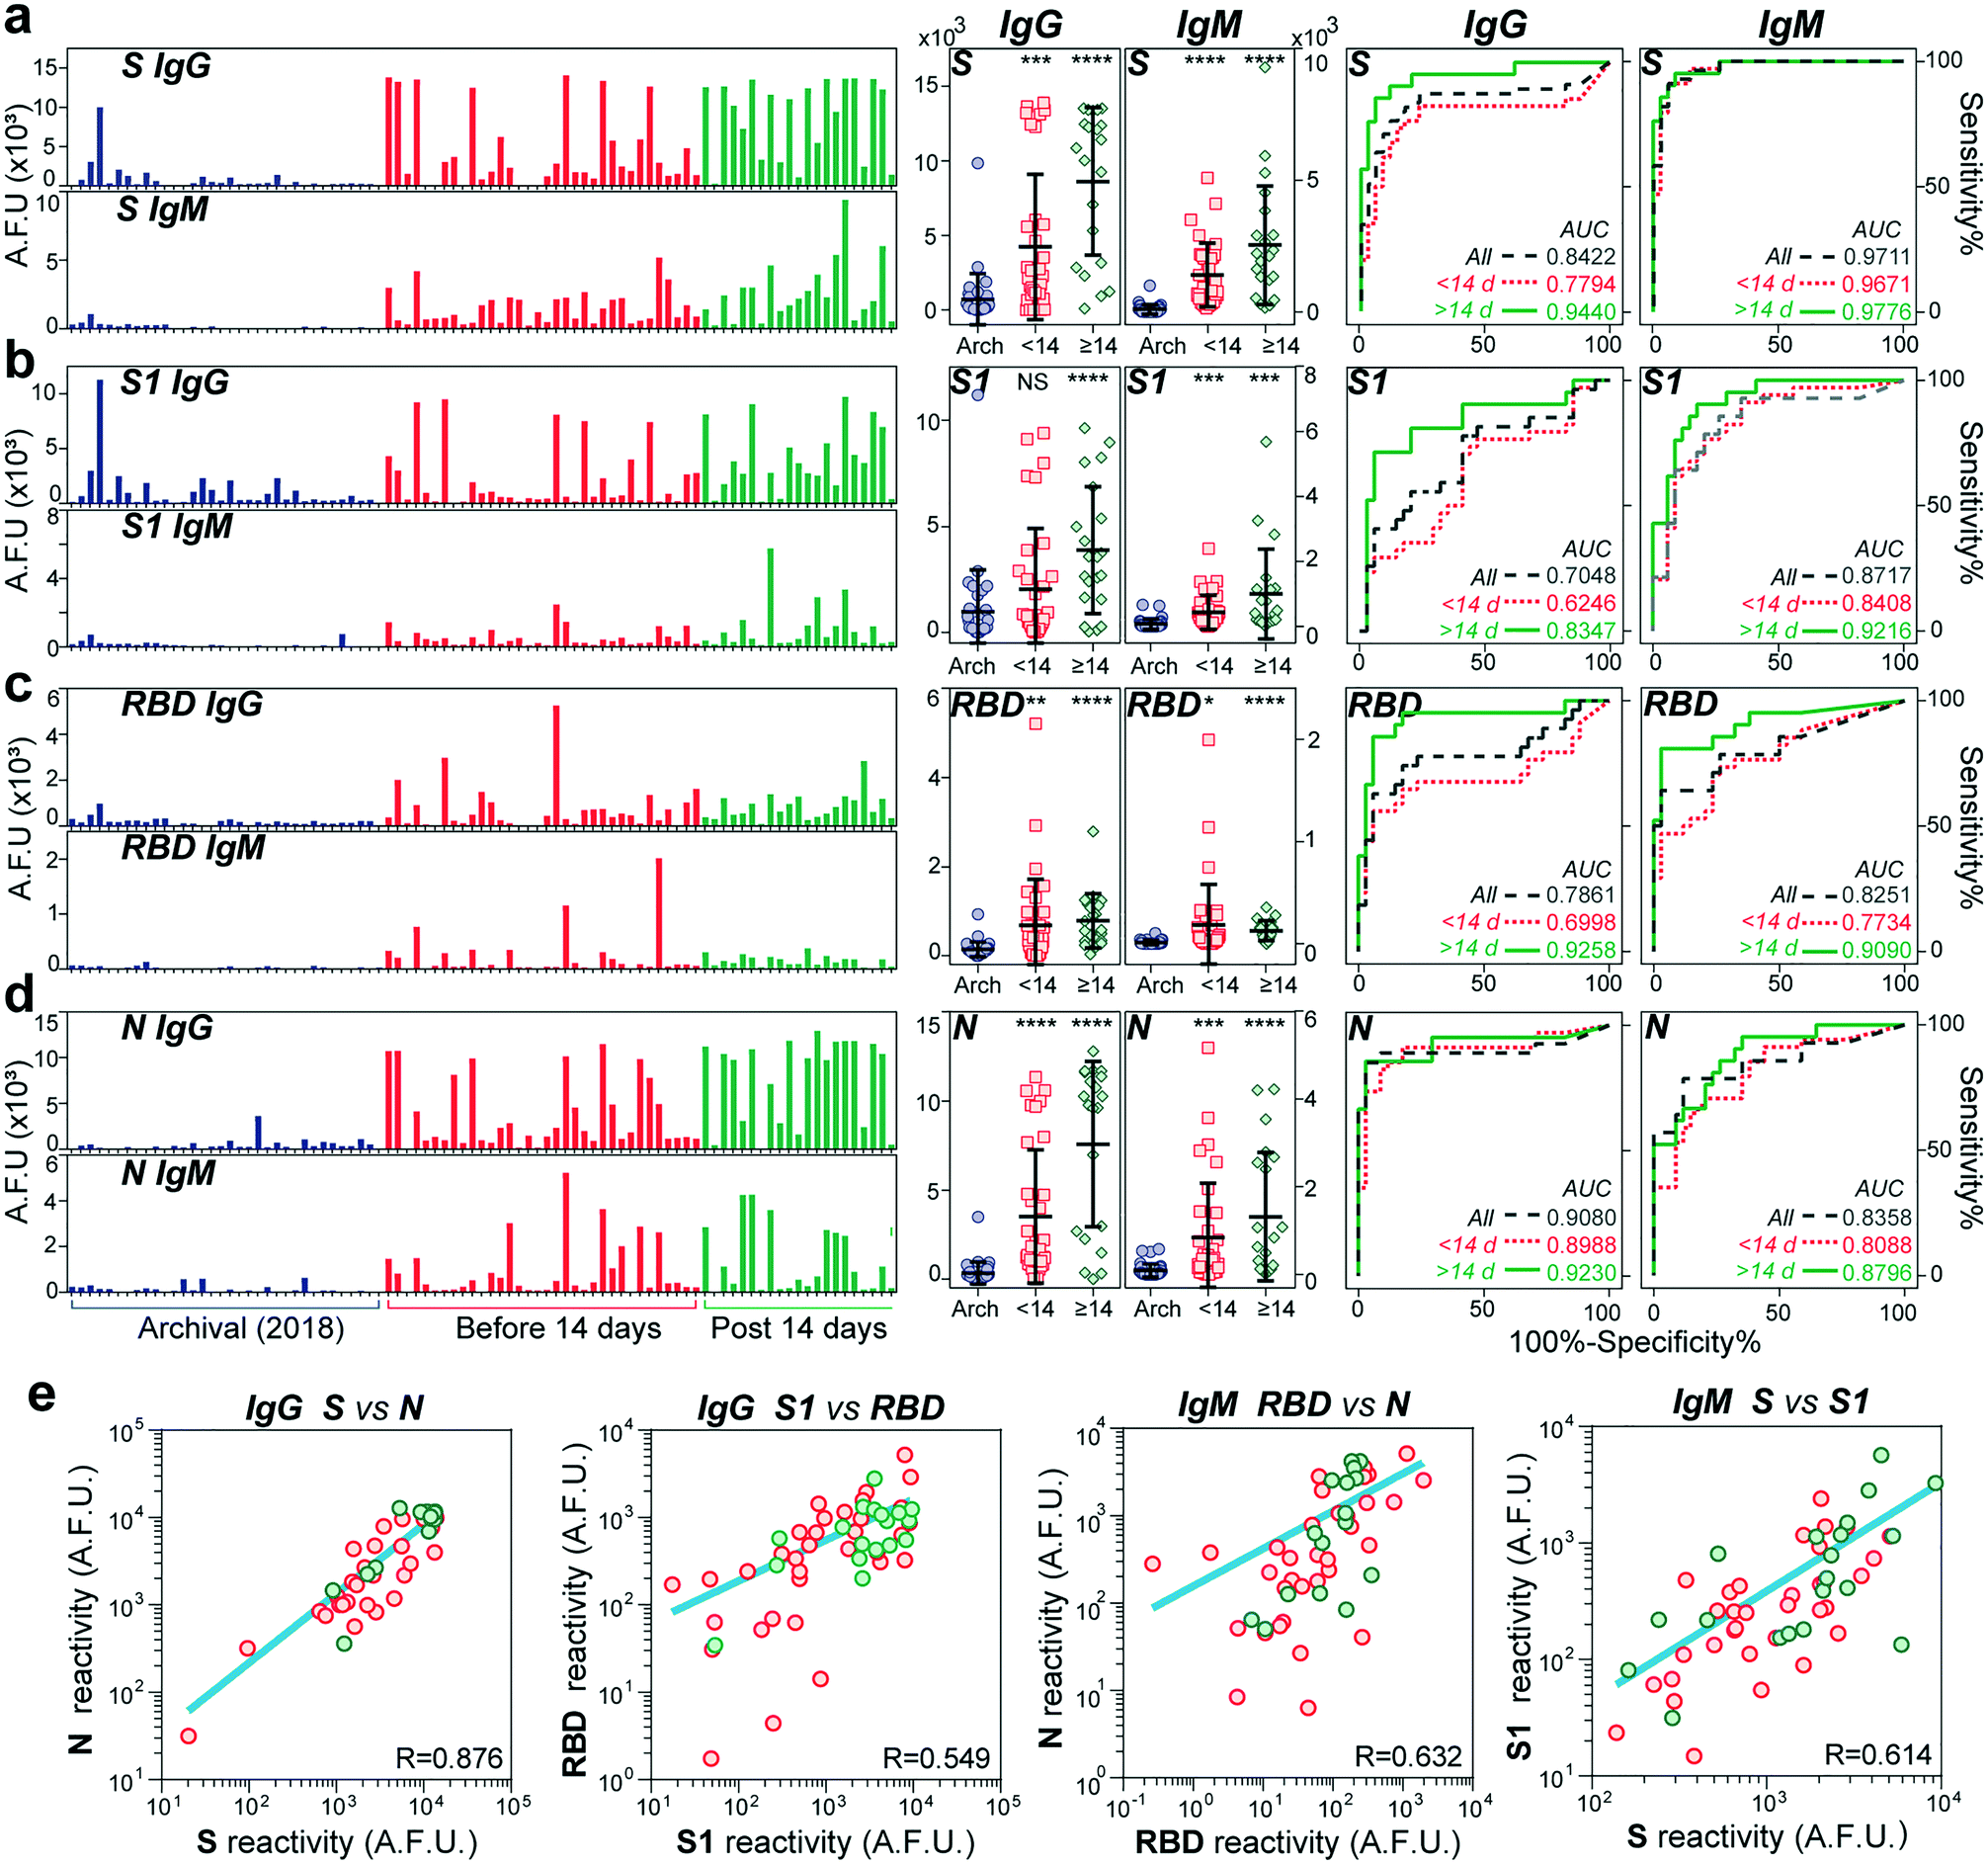 | ||
| Fig. 3 Detection of IgG and IgM antibody response to SARS-CoV-2 antigens. Antibodies against the four SARS-CoV-2 proteins S (a), S1 (b), RBD (c) and N (d) were measured in samples collected in 2018 (n = 34) and from patients with COVID-19 (n = 66). Bar graphs show IgG and IgM levels measured for each sample. Blue bars represent archival samples, while the COVID-19 positive samples were divided into two groups according to the time since symptom onset, before (red) and after (green) 14 days. Scatter dot plots of the same data shown in the bar graphs; error bars represent mean ± 1 s.d. Asterisks indicate statistical significance between archival sample versus patients with COVID-19 grouped by samples obtained before and after 14 days from symptom onset; NS = P > 0.05, *P ≤ 0.05, **P ≤ 0.01, ***P ≤ 0.001, and ****P ≤ 0.0001 (n = 100). Two-sided P values were determined using the t-test. Receiver operating characteristic (ROC) curves for all four antigens against IgG (left) and IgM (right). Areas under the curve (AUCs) are presented for each antigen for all COVID-19 positive samples (gray) or grouped before (red) or after (green) 14 days from symptom onset. (e) Correlations of antibody reactivities against pair of antigens. | ||
To determine our device's utility as a diagnostic test, we created receiver operating characteristic (ROC) curves for IgG and IgM against all antigens. ROC aids in determining the appropriate cut-off value to obtain the optimal sensitivity and specificity of an assay.32 In general, the area under the curve (AUC) for all the ROC curves was higher after two weeks from symptom onset (AUC > 0.9), except for IgG against S1 and IgM against N. The highest performance was obtained for IgG and IgM against S with an AUC of 0.977 and 0.944, respectively. Based on the ROCs for the late-stage cohort, we estimated the best sensitivities and specificities provided by each antibody's reactivity isotype against each viral antigen. As shown in Table S3,† the univariate tests provide, in general, good predictive power, with the sensitivity ranging from 71 and 95% for IgG and 81 and 85% for IgM. In comparison, the specificity ranged from 82 to 97% for IgG and 73 to 97% for IgM. The two best overall scores were provided by IgM reactivity against the whole spike antigen (95% sensitivity and 91% specificity) as well as IgG reactivity against the RBD (95% sensitivity and 82.3% specificity).
Multivariate analysis of antibody reactivity enhances diagnostic test performance
Next, we evaluated whether the combination of the reactivities of antibodies against all antigens would increase the predictive power of our microfluidic serological assay compared to a single set of antigen and antibody isotype. We performed principal component analysis (PCA) over different sets of parameters (Fig. 4a and S6†). PCA is a widely employed linear dimensionality reduction and feature extraction method33 and a powerful tool for biomarker discovery in proteomic analysis.34 In general, the pre-pandemic cohort clustered together on the PC plane, while the early-stage (<14 days evolution) cohort dispersed over the plane and separated from these samples. The late-stage (≥14 days evolution) cohort displayed a more compact cluster with increased separation concerning the archival cohort. Although different principal components correlate with antibody reactivities to different antigens (Table S2†), PC1 explains over 80% of the observed data variance. For this reason, we chose this parameter to assess the predictive power of each parameter set. Although the ROC considering all the antigens is higher than 0.9 and increases to 0.97 when considering IgM reactivity against all different antigens (Fig. S6†), it is not significantly better than the predictive power observed by measuring IgG and IgM reactivity against the S protein by itself, at least for the time frame in which the samples were collected. From the ROCs based on the PC1 scores, we then determined each parameter set's best sensitivities and specificities. As shown in Table S3,† there was an overall increase in the sensitivity and specificity of the multivariate analysis compared to those of the univariate analysis, with sensitivity values ranging from 90.4% to 95%. In contrast, the specificities ranged from 88% to 94%.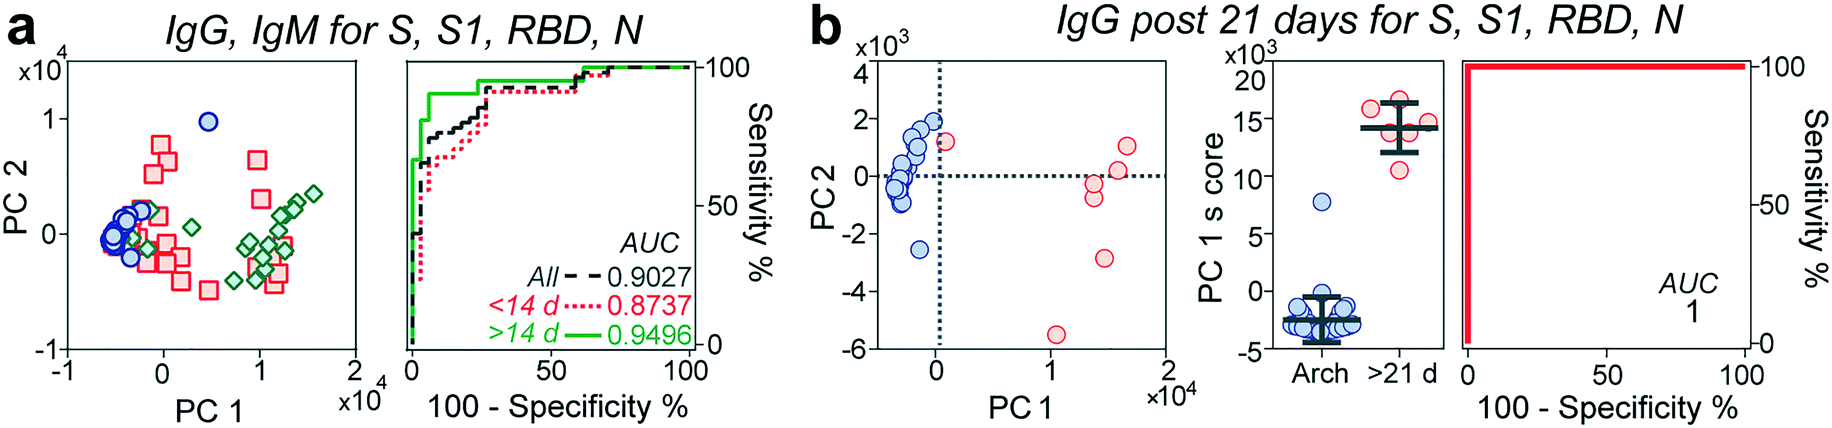 | ||
| Fig. 4 Principal component analysis (PCA). (a) PCA of immunoglobulins IgG and IgM for viral antigens S, S1, RBD, and N, accompanied by their ROC curves. (b) PCA of IgG after 21 days from symptom onset for all the viral antigens. Middle scatter plot shows the PC1 score between both samples. Right: ROC curve for this analysis. | ||
Some reports have indicated a 100% seroconversion of IgG of individuals after 20 days from symptom onset.14,30 We thus queried whether samples from this time onwards will increase the performance of our assay. Indeed, by performing the ROC analysis of the PC1 score of samples collected between 21–30 days after symptom onset, our platform achieved a sensitivity and a specificity of 100%, Fig. 4b.
Lastly, we assessed the positive and negative predictive values (PPV and NPV) of each diagnostic variable and their different combinations for the late-stage cohort (Table S3†). Since there is no current consensus on the prevalence of COVID-19 in Mexico, we estimated PPVs and NPVs for low (5%) to high (20%) prevalence values. In general, NPVs from univariate and most multivariate analysis were high at low prevalence, ranging from 98.3–99.6%, and maintain acceptable values (ranging 93–99% with a mean of 97%) at higher prevalence values. However, due to this cohort's reduced sensitivities, the PPVs are low (45%) at low prevalence but increase to acceptable values (79%) at high prevalence.
Longitudinal study of the antibody response
To investigate our device's utility in evaluating the antibody response's kinetics, we evaluated IgG and IgM levels for all 4 viral proteins for samples collected from 5 COVID-19 hospitalized individuals at different time points during a period ranging from 1 to 7 weeks (Fig. 5). In general, the S antigen, followed by the N, elicited the most robust IgG responses. S1 and RBD showed lower IgG and IgM levels and more variability. In the case of patients D and E, whose samples were collected for a more extended period, we noticed that, on average, the levels of IgM for all the proteins started to wane off after 20 days, while the levels of IgG remained high from 10 days onwards, except for patient D which showed a slight decrease in all proteins after 30 days, with some variability for the antigens N and RBD. Note that, in most cases, IgM levels are lower than those for IgG, consistent with other reports.30 Overall, these results demonstrate that our device's sensitivity is high enough to detect the antibody response of COVID-19 patients for at least seven weeks after the initial symptoms.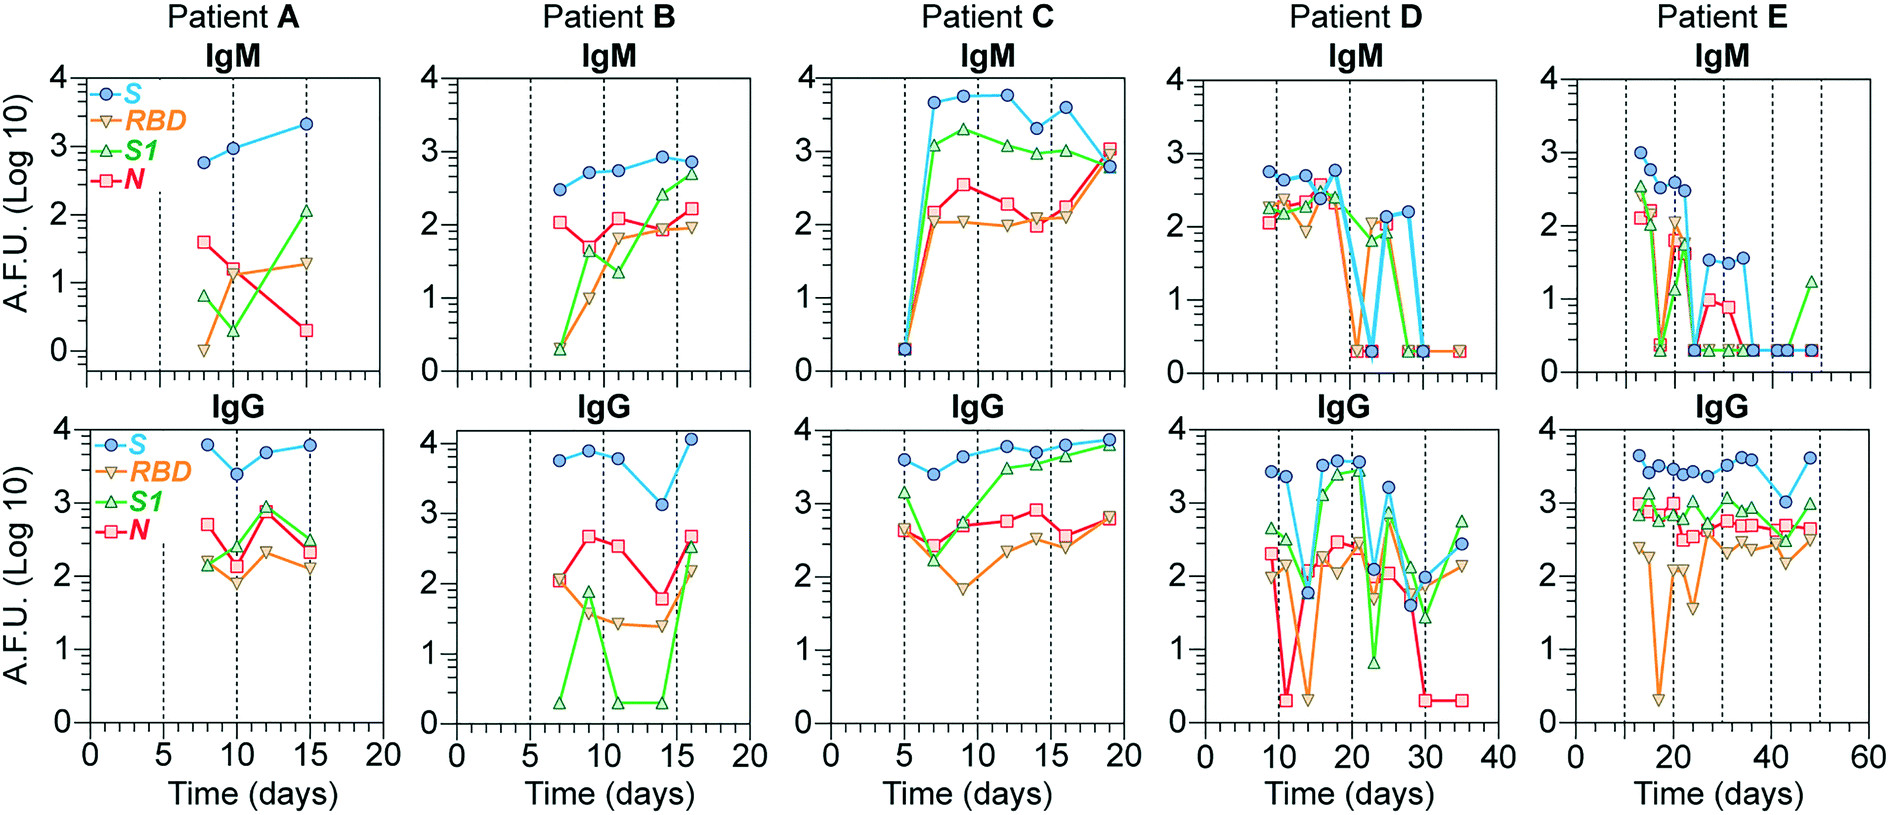 | ||
| Fig. 5 Detection of IgG and IgM antibodies in a longitudinal assay. Serum samples were collected at different days from five COVID-19 patients who required hospitalization. The zero day mark indicates symptom onset. Top and bottom rows show IgM and IgG plots, respectively, for all patients. A.F.U. = arbitrary fluorescence units. | ||
Discussion
We have developed and tested a microfluidic device to detect the presence of antibodies against four SARS-CoV-2 antigens from only 6 μL serum samples. We selected these antigens because they are the principal immunogens and have shown to be promising in detecting specific antibodies for SARS-CoV-2.35 The SARS-CoV-2 spike glycoprotein is highly immunogenic, making it an ideal target for neutralizing antibodies,36,37 and is the current focus of most vaccine candidates.36,38,39 The S1, a subunit of the S protein, contains the RBD, which is critical for viral entry and has proven to be a highly specific antigen of SARS-CoV-2 given its low amino acid sequence identity (∼20%) to other human coronaviruses (HCoVs).9,40 The N antigen is also a potent immunogen and is sometimes more specific than other antigens.18 More recently, the RBD40 and the N41 protein have shown greater sensitivities in the serological diagnosis of COVID-19 compared to the S protein. It is becoming evident that assessing the antibody landscape to a high number of SARS-CoV-2 antigens will increase the sensitivity and specificity of an antibody test and help understand the pathogenicity and antibody response of COVID-19.18 Although we only tested these four antigens, our microfluidic device can be easily redesigned to include other SARS-CoV-2 structural or non-structural proteins (e.g. ORF8 and ORF3b) that have also shown to elicit strong specific antibody responses.18Knowing antibody concentration levels for an individual will help monitor the appearance and decay of the different antibody isotypes (IgG, IgM, IgA), information that can be useful to understand the immune response evolution upon vaccination or infection. COVID-19 antibody tests reported to date have different performance characteristics. Most of them provide quality data in the form of antibody presence or absence, with only a few providing quantitative estimates of antibody concentration.10,21 Indeed, our MITOMI-based biosensors can also provide antibody concentration data. To estimate our biosensors' sensitivity, we performed calibration curves employing known concentrations of a monoclonal anti-RBD chimeric antibody with a human IgG1 constant domain. As expected, this chimeric antibody reacted to RBD and the S and S1 viral proteins. We estimated the limit of detection (LOD) of our biosensor for IgG against the RBD antigen to be 1.6 ng mL−1, comparable to that of ELISA—the gold standard for protein quantitation—explicitly developed against the RBD antigen of SARS-CoV-2.10 Interestingly, the SIMOA assay for SARS-CoV-2 reaches LODs in the order of tens of pg mL−1.7
Interestingly, a few of our negative control samples from 2018 cross-reacted against S and S1, which heavily impacted our assay's sensitivity and specificity. This result is not surprising, as the antigen S is a highly conserved protein to other endemic HCoVs (28–33% amino acid identity to OC43, 229E, NL63 or HKU1)35,40 and may have a high number of epitopes compared to RBD.9 Furthermore, over 90% of individuals aged over 50 years old have antibodies to these endemic HCoVs.42 Notably, these control samples did not show cross-reactivity to RBD, consistent with other reports,43 and neither did they to the antigen N, which was expected to induce more cross-reactivity because it shares a higher homology to other HCoVs.6 Nevertheless, cross-reactivities against the S and RBD of SARS-CoV-2 have also been reported in control samples.2,4,14,43,44 Cross-reactive antibodies might yield false-positive results; however, identifying cross-reactivity is not necessarily discouraging, as it could provide insights on whether specific individuals possess some preexisting immunity against SARS-CoV-2.45 To prevent this cross-reactivity, samples could be further evaluated against a panel of spike proteins from other HCoVs.40 Also, testing a higher number of control samples from different years will help assess whether these samples are isolated or more widespread than expected. The storage and processing of the sera or contamination with other blood products should not be discarded as plausible explanations for this cross-reactivity.
We employed ROC analysis to quantify the accuracy of our assay. ROC also allows a selection of optimal thresholds of sensitivity and specificity depending on the test's intended use. In general, the AUC of the obtained ROC curves—which indicates how well a test performs—had values above 0.9, suggesting highly accurate tests. In the case of the late-stage cohort, except for two antigens, the rest of the assays performed above 0.9, reaching 0.9496 for the multivariate analysis. As expected, the time frame on which each sample is collected after symptom onset impacts our assay accuracy. Not surprisingly, as the immune response is evolving, our device's specificity and sensitivity are lower before the 2 week mark but improves after two weeks for all the antigens. Our results indicate that increasing the number of variables measured leads to enhanced diagnostic test performance, with an AUC higher than 0.9, increasing up to 0.97 if IgM reactivities against different antigen combinations in the late stage are considered. This performance is not significantly better than the predictive power observed by measuring IgM reactivity against S—at least for the time frame in which the samples were collected. However, we expect that these prediction values would decrease as IgM titers wane off after only three weeks from symptom onset.30 On the other hand, the multivariate analysis that includes IgG reactivity (AUC = 0.9496) should conserve its ability to identify seroconverted individuals as IgG is a longer-lasting antibody correctly.
The sensitivity (90–95%) and specificity (88–94%) of our assay for the late-stage cohort, considering multivariate analysis, are comparable to those of other commercial SARS-CoV-2 serology assays.14 It also satisfies the minimum sensitivity (80%) and specificity (90%) required by the FDA for serological tests operated under the Emergency Use Authorization (EUA). Our assay's accuracy increased to 100% when analyzing samples acquired between 20 and 30 days after symptom onset, consistent with other reports.14,46 In general, our device's sensitivity and specificity are higher than most lateral flow assays and are on par with those of ELISA-based tests.47 A limitation of our study is that it included mostly men with severe cases of COVID-19, and thus will require a thorough validation with a higher number of samples from women and individuals with a broader range of ages, including those with different disease severity (mild, moderate, asymptomatic).
As antibody tests are performed on a limited number of samples with known antibody status, the result is a statistic value that interpretation must be contextualized according to the prevalence of the virus in a population and whether it is used for individual use population-level studies.48,49 Indeed, positive predictive values (PPVs) and negative predictive values (NPVs) are more meaningful in a clinical decision than specificity and sensitivity. For a given sensitivity and specificity at high prevalence rates, the PPV increases, and NPV decreases, and vice versa, at low prevalence rates. As false positive serological assays may lead to a false sense of confidence, which can cause relaxation of protective measures, such as social distancing, a diagnostic test must have a high PPV even at low seroprevalence. Current estimates of prevalence in the population range from 1% to 4%.2 In our case, considering the cross-reactivities against all antigens, our platform achieves a PPV of 45% at a prevalence of 5% (this means that less than half of individuals who test positive will have developed antibodies against SARS-CoV-2) but increases to 79% at a prevalence of 20%. However, within a population, different groups can have different infection rates. Given our platform's accuracy, we speculate that our assay can achieve a high PPV in screening health care personnel who have a higher probability of having developing antibodies against SARS-CoV-2.
Longitudinal studies of infected patients will be essential to assess the evolution of the immune response and the duration of immunity, monitor the effects of vaccines in the humoral response, and evaluate the disease state, and possibly be used as a confirmatory diagnosis of COVID-19. Overall, we were able to detect antibody levels above background against all antigens in most samples collected after one week of developing symptoms, implying that antibodies circulate in blood at concentrations high enough to be detected by our device. Interestingly, the S protein produced the most robust antibody responses, which may be partially explained because it has a high number of epitopes. High reactivities to the N antigen were also detected. We expect that frequent sampling of patients will increase our assay's sensitivity and specificity to 100%.
Our microfluidic device has several advantages over lateral flow assays or more conventional assays (i.e. ELISA) such as low sample/reagent consumption, multiple analyte detection, and high-throughput. Importantly, our platform's multiplexing capabilities allow the multiparametric assessment of immunoglobulins reactive against viral antigens, which should increase both sensitivity and specificity compared to current assays. However, our device also suffers from some drawbacks. Although the four antigens' immobilization protocol consists of only five steps, it is relatively slow (2.5 h). Furthermore, the antigens' random orientation on the surface could lead to epitope masking, reducing assay sensitivity. A site-specific covalent immobilization technique (e.g., streptavidin/biotin chemistry or metal chelates) can be used to improve antigen immobilization. Massive manufacturing of multilayer soft-lithography devices is not straightforward as it requires the alignment of two PDMS layers and access to a clean-room facility. Finally, our antibody test takes 2.6 h, which, together with the 20 min for device setup and including the time for protein immobilization, puts the total assay running time at 5.5 h for 50 assays or 6.6 min per assay.
Antibody testing for SARS-CoV-2 is expected to impact several areas, including diagnostics, epidemiology, vaccine development, disease understanding, and public health policies. However, as screening scales up, the high demand for NAAT and antibody tests worldwide leads to a shortage of reagents, supplies, and instruments around the globe. The most affected are low- and middle-income countries that lack the infrastructure or laboratory facilities to perform their tests.8 Unfortunately, most countries cannot afford them and do not have the infrastructure to produce them locally, complicating massive testing efforts. Thus, it has become critical to develop technologies that are affordable and amenable to automation, and that reduce reagent consumption. Our device is fabricated with well-known standard soft-lithography techniques that can facilitate its replication by laboratories worldwide. The high throughput capabilities and low reagent consumption of our device make it an attractive platform to perform affordable large-scale diagnostic testing and assess the antibody response of a population to SARS-CoV-2. Our device can process 50 serum samples in parallel in its current design but can be easily scaled up to process a larger number of samples without significantly altering the design. Another key advantage of our device is its multiplexing capabilities and its higher sensitivity and specificity compared to other serological assays, which, for the most part, assess reactivity against only one viral antigen.
Materials and methods
Fabrication of the microfluidic devices
The microfluidic device made of a flow layer and a control layer was fabricated using multilayer soft lithography. The molds for each layer were patterned on 4′′ silicon wafers. The control layer mold was spin-coated with negative photoresist (SU8-2015, MicroChem, USA) at 1300 rpm for 40 s for a height of ∼25 μm. The flow layer mold was spin-coated with positive photoresist (AZ9260, Clariant GmbH, Germany) at 1000 rpm to a height of ∼12 μm after which it was baked at 200 °C on a hot plate for 1 h to round the structures. Both silicon wafers were exposed to chlorotrimethylsilane (386529, Sigma-Aldrich Co., USA) for 1 h.Devices were fabricated by pouring polydimethylsiloxane (PDMS, Sylgard 184, Corning, USA) at a curing agent ratio of 5:1 (w/w) on the control mold and degassed in a vacuum chamber. For the flow layer, PDMS (20:1 w/w ratio) was spin-coated at 1300 rpm for 40 s. Control and flow layers were baked at 80 °C for 30 min, respectively. Replicas from the control layer mold were cut, peeled, aligned on the flow layer, and baked for 1 h at 80 °C. Device inlets and outlets were punched using a precision manual punching machine (Syneo, USA).
Glass slide functionalization
Slides were cleaned with isopropanol (IPA, V000139, Sigma-Aldrich, USA) in an ultrasonic bath, rinsed with ultrapure water (UPW, MilliQ Synthesis, Millipore, USA), and blow-dried with a nitrogen (N2) gun. Glass slides were treated with oxygen (O2) plasma for 90 s (Zepto, Diener, Germany), and immersed in a 2% (v/v) solution of (3-aminopropyl)trimethoxysilane (APTES, 440140, Sigma-Aldrich Co., USA) in toluene (9460-03, JT Baker, USA). Slides were rinsed with fresh toluene, dried, and baked at 90 °C for 30 min. Lastly, the slides were sonicated in toluene for 15 min, rinsed with new IPA, and dried. The functionalized slides were kept in a vacuum desiccator before the next step.Modified glass slides were immersed in a 4.6% (v/v) glutaraldehyde (GA, 65882, Sigma-Aldrich) solution in carbonate/bicarbonate buffer (pH 9.2, S5761, Sigma-Aldrich Co and 3604-01 JT Baker) for 40 min, rinsed with UPW, and blow-dried with N2. Meanwhile, the PDMS devices were treated with O2 plasma for 90 s. Next, APTES was vaporized on the surface of the PDMS in a vacuum desiccator for 30 min. The APTES-modified PDMS devices were aligned to the GA-activated glass slides and baked for 10 min at 110 °C. The fully assembled devices were employed in serology assays immediately after this step.
On-chip protein immobilization
Control lines, except for the button lines, were primed with UPW and pressurized to 25 psi, and repeated activation/deactivation of valves was performed to prevent irreversible bonding between the valve and the GA-activated glass. All valves were controlled through 3-way solenoid manifolds (MH1, Festo, Germany), controlled with an Arduino microcontroller interfaced to a LabVIEW program (2020 Student Edition, National Instruments, USA). Next, flow channels were filled with a wash buffer consisting of DPBS with 0.05% (v/v) Tween-20 (DPBST, 14200075, Gibco and P9416, Sigma-Aldrich). Button control lines were then primed with UPW and pressurized to 25 psi. A blocking solution consisting of DyLight650-conjugated NeutrAvidin (NA650, 84607, Thermo Fisher Scientific Inc. USA) at 100 μg mL−1 diluted in carbonate/bicarbonate buffer was injected for 30 min at a 1.66 μL min−1 flow rate, followed by a 30 min wash step. The SARS-CoV-2 antigens corresponding to spike (S), S1 subunit (S1), receptor-binding domain (RBD), and nucleocapsid (NC) (40589-V08B1, 40591-V08B1, 40592-V08B, 40588-V08B, Sino Biological Inc., China) were diluted in carbonate/bicarbonate buffer at 20 μg mL−1 and injected in parallel through dedicated inlets with non-actuated buttons for 30 min at 1.66 μL min−1. Following a 30 min wash step with DPBST, ethanolamine (11016, Sigma-Aldrich Co., USA) at a 3% concentration (v/v) in carbonate/bicarbonate buffer was flowed for 30 min to block unreacted GA groups. A final wash step with DPBST was performed for 30 min.On-chip immunoassays
For calibration curves, different concentrations of monoclonal IgG antibodies raised against the RBD (40150-D003, Sino Biological Inc., China) were diluted in ELISA buffer at concentrations ranging from 0–1000 ng mL−1 and injected for 30 min to determine the LOD. For serology assays, human serum samples were diluted in ELISA buffer (00-4202-56, Thermo Fisher Scientific Inc.) at dilution factors of 1:10, 1:20, 1:25, and 1:50 (v/v). 6 μL of each sample were pipetted into the sample reservoirs employing gel-loading tips. Two micromachined PMMA sheets, incorporating pressure inlets and channels, were bonded to the device over the sample reservoirs with double-sided pressure-sensitive adhesive sheets to seal, pressurize and drive the sample fluid flow. The sample reservoirs were then pressurized to 2 psi to purge air remaining in the samples' inlet channels. Once the air was purged, the reservoirs' pressure was lowered to 0.1 psi. The side valves were actuated to prevent cross-contamination, while the top and bottom valves were non-actuated to inject the samples for 30 min. Buttons were actuated to protect the biosensing surfaces from upstream contamination, while the top and bottom valves were activated, and side walls were deactivated to allow serum flow (0.1 μl min−1). The microchambers were washed with DPBST for 30 min. Chambers were isolated via activation of side valves, and buttons were non-actuated for 3 min to allow diffusion of the remaining solution under the buttons. Buttons were then activated, and a second wash step of 15 min was performed. Immunoassays were developed by injecting phycoerythrin (PE)-conjugated anti-human IgG or anti-human IgM (109-115-098, Jackson ImmunoResearch, USA and IH15104, Life technologies, USA) antibodies diluted at 1:100 and 1:50, respectively, in ELISA buffer for 30 min with non-actuated buttons. The device was then imaged with an inverted epifluorescence microscope (Axio Observer A1, Carl Zeiss Microscopy GmbH, Germany) equipped with a 14 bit monochromatic camera (Axiocam 506 Mono, Carl Zeiss Microscopy GmbH, Germany) through a 10× objective, employing appropriate excitation/emission filters (FilterSet 43, Carl Zeiss Microscopy GmbH, Germany).
Image analysis
The acquired images were exported to an uncompressed TIFF format and analyzed with a custom MATLAB (R2019a, MathWorks, USA) script. The script calculated the mean intensity fluorescence value of the biosensing surfaces (MITOMI buttons) and subtracted the background (defined by the mean fluorescence intensity of an area around the MITOMI button).Data analysis
The experimental data were plotted and analyzed in Prism 6 (GraphPad Software, USA). Further statistical analysis, such as principal component analysis (PCA), was performed in MATLAB.Blood serum collection
To test the device, we use serum samples obtained from 66 COVID-19 patients tested positive for SARS-CoV-2 through PCR with reverse transcription (PCR-RT) tests of nasopharyngeal swabs. Competent and trained personnel handled and processed the patient samples following the institutional security protocols. Personnel taking the samples used personal protective equipment that included disposable gloves, a lab coat, and a surgical mask. This study was reviewed and approved by The Committee on Bioethics for Research in Human Beings (COBISH) of the Center for Research and Advanced Studies of the IPN (Cinvestav) (No. 062/2020). All participants provided written informed consent before the study. Samples were collected in a clinical laboratory that adheres to the guidelines established by Official Mexican Standards: NOM-007-SSA3-2011, NOM-087-SEMARNAT-SSA1-2002, NOM-010-SSA2-2010, NOM-006-SSA2-2013, and NMX-EC-15189 IMNC-2015. These samples were collected in the intensive care unit (COVID area) of the Instituto Nacional de Cardiología “Ignacio Chávez” in Mexico City. The blood samples were later transported to a clinical laboratory, where they were processed. Four mL of blood from the vein was obtained for each patient in silica (clot activator) gel tubes. The serum was obtained by centrifuging the samples at 600g for 15 min at 4 °C in a class II biological safety cabinet. Serum samples were stored in aliquots at −80 °C until used. Serum samples of the healthy control subjects from the GEA project were stored at −80 °C in 2018. The control cohort consisted of 34 serum samples of healthy individuals collected in 2018, belonging to the institutional project “Genetics of the Atherosclerosis Disease (GEA)”.Author contributions
J. L. G. C., R. R. M., and D. F. C. A. conceived the approach; R. R. M., D. F. C. A., P. E. G. P., J. A. H. O., J. U. A. H., and O. G. C. P. performed the experiments; G. R. V., F. S. M., D. M. S., R. P. S., and G. V. A. collected the sera samples with G. V. A. coordinating this team; J. L. G. C. and G. V. A. defined the clinical strategy; J. L. G. C., R. R. M., and D. F. C. A. analyzed the data; L. D. P. L, and D. A. M. A. provided analytical tools; J. L. G. C., R. R. M., and D. F. C. A. wrote the paper with contributions from the rest of the authors. J. L. G. C supervised the research. All authors edited and approved the final version of the manuscript.Conflicts of interest
J. L. G. C, R. R. M., D. F. C. A., and P. E. P. G have filed intellectual property on the technology described in this manuscript. O. G. C. P., J. A. H. O., J. U. A. H., G. R. V., F. S. M., D. M. S., L. D. P. L, D. A. M. A, R. P. S, and G. V. A. declare no competing interests.Acknowledgements
This work was funded by Mexico's National Science and Technology Council (CONACyT Grants No.311875, ERC-297690, and CB-286368) and by Cinvestav (Grant No. SEP-Cinvestav 104). We express our sincere gratitude to Dr. Martha Espinosa for initial support and encouragement on embarking on this project. We also thank Dr. Leopoldo Santos, Dr. Leticia Cedillo, Dr. Beatriz Xonocostle, Dr. Liliana Quintanar, Dr. José Tapia, Dr. Moisés Santillan, and Dr. Arturo Hernández for helpful discussions.References
- M. Nicola, et al., The socio-economic implications of the coronavirus pandemic (COVID-19): A review, Int. J. Surg., 2020, 78, 185 CrossRef PubMed.
- M. K. Özçürümez, et al., SARS-CoV-2 antibody testing—questions to be asked, J. Allergy Clin. Immunol., 2020, 146, 35–43 CrossRef PubMed.
- L. M. Kucirka, S. A. Lauer, O. Laeyendecker, D. Boon and J. Lessler, Variation in false-negative rate of reverse transcriptase polymerase chain reaction–based SARS-CoV-2 tests by time since exposure, Ann. Intern. Med., 2020, 173(4), 262–267 CrossRef PubMed.
- P. Mlcochova, et al., Combined Point-of-Care Nucleic Acid and Antibody Testing for SARS-CoV-2 following Emergence of D614G Spike Variant, Cell Rep. Med., 2020, 100099 CrossRef PubMed.
- Q. Lin, L. Zhu, Z. Ni, H. Meng and L. You, Duration of serum neutralizing antibodies for SARS-CoV-2: Lessons from SARS-CoV infection, J. Microbiol., Immunol. Infect., 2020, 2–3 Search PubMed.
- F. Krammer and V. Simon, Serology assays to manage COVID-19, Science, 2020, 368, 1060–1061 CrossRef CAS PubMed.
- M. Norman, et al., Ultrasensitive high-resolution profiling of early seroconversion in patients with COVID-19, Nat. Biomed. Eng., 2020, 1–20 Search PubMed.
- R. W. Peeling, C. J. Wedderburn, P. J. Garcia, D. Boeras, N. Fongwen, J. Nkengasong, A. Sall, A. Tanuri and D. L. Heymann, Serology testing in the COVID-19 pandemic response, Lancet Infect. Dis., 2020, 20(9), e245–e249 CrossRef CAS PubMed.
- F. Amanat, D. Stadlbauer, S. Strohmeier, T. H. O. Nguyen, V. Chromikova, M. McMahon, K. Jiang, G. A. Arunkumar, D. Jurczyszak, J. Polanco, M. Bermudez-Gonzalez, G. Kleiner, T. Aydillo, L. Miorin, D. S. Fierer, L. A. Lugo, E. M. Kojic, J. Stoever, S. T. H. Liu, C. Cunningham-Rundles, P. L. Felgner, T. Moran, A. García-Sastre, D. Caplivski, A. C. Cheng, K. Kedzierska, O. Vapalahti, J. M. Hepojoki, V. Simon and F. Krammer, A serological assay to detect SARS-CoV-2 seroconversion in humans, Nat. Med., 2020, 26(7), 1033–1036 CrossRef CAS PubMed.
- V. Roy, et al., SARS-CoV-2-specific ELISA development, J. Immunol. Methods, 2020, 484–485, 112832 CrossRef CAS PubMed.
- A. Krüttgen, et al., Comparison of four new commercial serologic assays for determination of SARS-CoV-2 IgG, J. Clin. Virol., 2020, 128, 104394 CrossRef PubMed.
- M. Traugott, et al., Performance of Severe Acute Respiratory Syndrome Coronavirus 2 Antibody Assays in Different Stages of Infection: Comparison of Commercial Enzyme-Linked Immunosorbent Assays and Rapid Tests, J. Infect. Dis., 2020, 222, 362–366 CrossRef CAS PubMed.
- L. Weidner, et al., Quantification of SARS-CoV-2 antibodies with eight commercially available immunoassays, J. Clin. Virol., 2020, 129, 104540 CrossRef CAS PubMed.
- J. D. Whitman, J. Hiatt, C. T. Mowery, B. R. Shy, R. Yu, T. N. Yamamoto, U. Rathore, G. M. Goldgof, C. Whitty, J. M. Woo, A. E. Gallman, T. E. Miller, A. G. Levine, D. N. Nguyen, S. P. Bapat, J. Balcerek, S. A. Bylsma, A. M. Lyons, S. Li, A. W. Wong, E. M. Gillis-Buck, Z. B. Steinhart, Y. Lee, R. Apathy, M. J. Lipke, J. A. Smith, T. Zheng, I. C. Boothby, E. Isaza, J. Chan, D. D. Acenas 2nd, J. Lee, T. A. Macrae, T. S. Kyaw, D. Wu, D. L. Ng, W. Gu, V. A. York, H. A. Eskandarian, P. C. Callaway, L. Warrier, M. E. Moreno, J. Levan, L. Torres, L. A. Farrington, R. P. Loudermilk, K. Koshal, K. C. Zorn, W. F. Garcia-Beltran, D. Yang, M. G. Astudillo, B. E. Bernstein, J. A. Gelfand, E. T. Ryan, R. C. Charles, A. J. Iafrate, J. K. Lennerz, S. Miller, C. Y. Chiu, S. L. Stramer, M. R. Wilson, A. Manglik, C. J. Ye, N. J. Krogan, M. S. Anderson, J. G. Cyster, J. D. Ernst, A. H. B. Wu, K. L. Lynch, C. Bern, P. D. Hsu and A. Marson, et al., Evaluation of SARS-CoV-2 serology assays reveals a range of test performance, Nat. Biotechnol., 2020, 38(10), 1174–1183 CrossRef CAS PubMed.
- Z. Chen, et al., Rapid and Sensitive Detection of anti-SARS-CoV-2 IgG, Using Lanthanide-Doped Nanoparticles-Based Lateral Flow Immunoassay, Anal. Chem., 2020, 92, 7226–7231 CrossRef CAS PubMed.
- B. D. Grant, et al., SARS-CoV-2 Coronavirus Nucleocapsid Antigen-Detecting Half-Strip Lateral Flow Assay Toward the Development of Point of Care Tests Using Commercially Available Reagents, Anal. Chem., 2020, 92, 11305–11309 CrossRef CAS PubMed.
- L. Haljasmägi, et al., LIPS method for the detection of SARS-CoV-2 antibodies to spike and nucleocapsid proteins, Eur. J. Immunol., 2020, 50, 1234–1236 CrossRef PubMed.
- A. Hachim, N. Kavian, C. A. Cohen, A. W. H. Chin, D. K. W. Chu, C. K. P. Mok, O. T. Y. Tsang, Y. C. Yeung, R. A. P. M. Perera, L. L. M. Poon, J. S. M. Peiris and S. A. Valkenburg, et al., ORF8 and ORF3b antibodies are accurate serological markers of early and late SARS-CoV-2 infection, Nat. Immunol., 2020, 21(10), 1293–1301 CrossRef CAS.
- P. D. Burbelo, et al., Sensitivity in Detection of Antibodies to Nucleocapsid and Spike Proteins of Severe Acute Respiratory Syndrome Coronavirus 2 in Patients With Coronavirus Disease 2019, J. Infect. Dis., 2020, 222, 206–213 CrossRef CAS.
- D. Lin, et al., Evaluations of the serological test in the diagnosis of 2019 novel coronavirus (SARS-CoV-2) infections during the COVID-19 outbreak, Eur. J. Clin. Microbiol. Infect. Dis., 2020, 1–7 CAS.
- S.-Y. Chen, et al., Multicenter evaluation of two chemiluminescence and three lateral flow immunoassays for the diagnosis of COVID-19 and assessment of antibody dynamic responses to SARS-CoV-2 in Taiwan, Emerging Microbes Infect., 2020, 9, 2157–2168 CrossRef CAS.
- A. Padoan, C. Cosma, L. Sciacovelli, D. Faggian and M. Plebani, Analytical performances of a chemiluminescence immunoassay for SARS-CoV-2 IgM/IgG and antibody kinetics, Clin. Chem. Lab. Med., 2020, 58(7), 1081–1088 CrossRef CAS PubMed.
- S. J. Maerkl and S. R. Quake, A Systems Approach to Measuring the Binding Energy Landscapes of Transcription Factors, Science, 2007, 315, 233–237 CrossRef CAS PubMed.
- J. L. Garcia-Cordero and S. J. Maerkl, A 1024-sample serum analyzer chip for cancer diagnostics, Lab Chip, 2014, 14, 2642–2650 RSC.
- C. Zheng, et al., High-throughput immunoassay through in-channel microfluidic patterning, Lab Chip, 2012, 12, 2487–2490 RSC.
- J. L. Garcia-Cordero, C. Nembrini, A. Stano, J. A. Hubbell and S. J. Maerkl, A high-throughput nanoimmunoassay chip applied to large-scale vaccine adjuvant screening, Integr. Biol., 2013, 5, 650–658 CrossRef CAS PubMed.
- R. Rodriguez-Moncayo, R. J. Jimenez-Valdes, A. M. Gonzalez-Suarez and J. L. Garcia-Cordero, Integrated Microfluidic Device for Functional Secretory Immunophenotyping of Immune Cells, ACS Sens., 2020, 5, 353–361 CrossRef CAS PubMed.
- L. S. Wong, F. Khan and J. Micklefield, Selective covalent protein immobilization: strategies and applications, Chem. Rev., 2009, 109, 4025–4053 CrossRef CAS.
- T. Waritani, J. Chang, B. McKinney and K. Terato, An ELISA protocol to improve the accuracy and reliability of serological antibody assays, MethodsX, 2017, 4, 153–165 CrossRef.
- Q. Long, et al., Antibody responses to SARS-CoV-2 in patients with COVID-19, Nat. Med., 2020, 26, 845–848 CrossRef CAS PubMed.
- K. K. W. To, et al., Temporal profiles of viral load in posterior oropharyngeal saliva samples and serum antibody responses during infection by SARS-CoV-2: an observational cohort study, Lancet Infect. Dis., 2020, 20, 565–574 CrossRef CAS PubMed.
- A. K. Akobeng, Understanding diagnostic tests 3: receiver operating characteristic curves, Acta Paediatr., 2007, 96, 644–647 CrossRef PubMed.
- S. Wold, K. Esbensen and P. Geladi, Principal component analysis, Chemom. Intell. Lab. Syst., 1987, 2, 37–52 CrossRef CAS.
- E. Robotti, M. Manfredi and E. Marengo, Biomarkers discovery through multivariate statistical methods: a review of recently developed methods and applications in proteomics, J. Proteomics Bioinf., 2014, 3, 3 Search PubMed.
- N. M. A. A. Okba, et al., Severe Acute Respiratory Syndrome Coronavirus 2-Specific Antibody Responses in Coronavirus Disease Patients, Emerging Infect. Dis., 2020, 26, 1478–1488 CrossRef CAS PubMed.
- A. C. Walls, Y. J. Park, M. A. Tortorici, A. Wall, A. T. McGuire and D. Veesler, Structure, Function, and Antigenicity of the SARS-CoV-2 Spike Glycoprotein, Cell, 2020, 181(2), 281–292 CrossRef CAS PubMed.
- L. Liu, et al., Potent neutralizing antibodies against multiple epitopes on SARS-CoV-2 spike, Nature, 2020, 584, 450–456 CrossRef CAS PubMed.
- W.-H. Chen, U. Strych, P. J. Hotez and M. E. Bottazzi, The SARS-CoV-2 vaccine pipeline: an overview, Curr. Trop. Med. Rep., 2020, 1–4 Search PubMed.
- A. Grifoni, et al., Targets of T Cell Responses to SARS-CoV-2 Coronavirus in Humans with COVID-19 Disease and Unexposed Individuals, Cell, 2020, 181, 1489–1501.e15 CrossRef CAS PubMed.
- L. Premkumar, B. Segovia-Chumbez, R. Jadi, D. R. Martinez, R. Raut, A. Markmann, C. Cornaby, L. Bartelt, S. Weiss, Y. Park, C. E. Edwards, E. Weimer, E. M. Scherer, N. Rouphael, S. Edupuganti, D. Weiskopf, L. V. Tse, Y. J. Hou, D. Margolis, A. Sette, M. H. Collins, J. Schmitz, R. S. Baric and A. M. de Silva, The receptor binding domain of the viral spike protein is an immunodominant and highly specific target of antibodies in SARS-CoV-2 patients, Sci. Immunol., 2020, 5(48), eabc8413 CrossRef CAS PubMed.
- P. D. Burbelo, et al., Sensitivity in detection of antibodies to nucleocapsid and spike proteins of severe acute respiratory syndrome coronavirus 2 in patients with coronavirus disease 2019, J. Infect. Dis., 2020, 222, 206–213 CrossRef CAS.
- E. S. Theel, et al., The Role of Antibody Testing for SARS-CoV-2: Is There One?, J. Clin. Microbiol., 2020, 1–15 Search PubMed.
- J. A. Juno, H. X. Tan, W. S. Lee, A. Reynaldi, H. G. Kelly, K. Wragg, R. Esterbauer, H. E. Kent, C. J. Batten, F. L. Mordant, N. A. Gherardin, P. Pymm, M. H. Dietrich, N. E. Scott, W. H. Tham, D. I. Godfrey, K. Subbarao, M. P. Davenport, S. J. Kent and A. K. Wheatley, Humoral and circulating follicular helper T cell responses in recovered patients with COVID-19, Nat. Med., 2020, 26, 1428–1434 CrossRef CAS.
- C. Klumpp-thomas, H. Kalish, M. Drew, S. Hunsberger, K. Snead, M. P. Fay, J. Mehalko, A. Shunmugavel, V. Wall, P. Frank, J. P. Denson, M. Hong, G. Gulten, S. Messing, J. Hicks, S. Michael, W. Gillette, M. D. Hall, M. Memoli, D. Esposito and K. Sadtler, Standardization of enzyme-linked immunosorbent assays for serosurveys of the SARS-CoV-2 pandemic using clinical and at-home blood sampling, medRxiv [Preprint], 2020, DOI:10.1101/2020.05.21.20109280.
- A. Grifoni, D. Weiskopf, S. I. Ramirez, J. Mateus, J. M. Dan, C. R. Moderbacher, S. A. Rawlings, A. Sutherland, L. Premkumar, R. S. Jadi, D. Marrama, A. M. de Silva, A. Frazier, A. F. Carlin, J. A. Greenbaum, B. Peters, F. Krammer, D. M. Smith, S. Crotty and A. Sette, Targets of T Cell Responses to SARS-CoV-2 Coronavirus in Humans with COVID-19 Disease and Unexposed Individuals, Cell, 2020, 181(7), 1489–1501 CrossRef CAS PubMed.
- R. Weissleder, H. Lee, J. Ko and M. J. Pittet, COVID-19 diagnostics in context, Sci. Transl. Med., 2020, 12, 1–5 Search PubMed.
- M. Lisboa Bastos, G. Tavaziva, S. K. Abidi, J. R. Campbell, L. P. Haraoui, J. C. Johnston, Z. Lan, S. Law, E. MacLean, A. Trajman, D. Menzies, A. Benedetti and F. Ahmad Khan, Diagnostic accuracy of serological tests for covid-19: systematic review and meta-analysis, BMJ, 2020, 370, m2516 CrossRef.
- N. C. Brownstein and Y. A. Chen, Are antibodies tests accurate? Understanding predictive values and uncertainty of serology tests for the novel coronavirus, medRxiv, 2020, DOI:10.1101/2020.06.04.20122358.
- J. E. Bryant, et al., Serology for SARS-CoV-2: Apprehensions, opportunities, and the path forward, Sci. Immunol., 2020, 5, 1–5 CrossRef.
Footnotes |
| † Electronic supplementary information (ESI) available. See DOI: 10.1039/d0lc01068e |
| ‡ These authors contributed equally. |
| This journal is © The Royal Society of Chemistry 2021 |