 Open Access Article
Creative Commons Attribution 3.0 Unported Licence
Automated fluorescence quantification of extracellular vesicles collected from blood plasma using dielectrophoresis†
Kyle T.
Gustafson
 ab,
Katherine T.
Huynh
 ab,
Daniel
Heineck
ab,
Jesus
Bueno
ab,
Augusta
Modestino
ab,
Sejung
Kim
ab,
Daniel
Heineck
ab,
Jesus
Bueno
ab,
Augusta
Modestino
ab,
Sejung
Kim
 ab,
Austin
Gower
a,
Randall
Armstrong
a,
Carolyn E.
Schutt
ab and
Stuart D.
Ibsen
 *ab
*ab
aCancer Early Detection Advanced Research Center, Knight Cancer Institute, Oregon Health & Science University, USA. E-mail: ibsen@ohsu.edu
bDepartment of Biomedical Engineering, School of Medicine, Oregon Health & Science University, USA
First published on 24th March 2021
Abstract
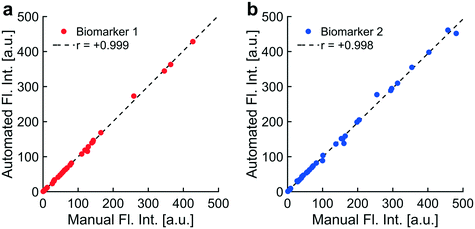
Tumor-secreted exosomes and other extracellular vesicles (EVs) in circulation contain valuable biomarkers for early cancer detection and screening. We have previously demonstrated collection of cancer-derived nanoparticles (NPs) directly from whole blood and plasma with a chip-based technique that uses a microelectrode array to generate dielectrophoretic (DEP) forces. This technique enables direct recovery of NPs from whole blood and plasma. The biomarker payloads associated with collected particles can be detected and quantified with immunostaining. Accurately separating the fluorescence intensity of stained biomarkers from background (BG) levels becomes a challenge when analyzing the blood from early-stage cancer patients in which biomarker concentrations are low. To address this challenge, we developed two complementary techniques to standardize the quantification of fluorescently immunolabeled biomarkers collected and concentrated at predictable locations within microfluidic chips. The first technique was an automated algorithm for the quantitative analysis of fluorescence intensity at collection regions within the chip compared to levels at adjacent regions. The algorithm used predictable locations of particle collection within the chip geometry to differentiate regions of collection and BG. We successfully automated the identification and removal of optical artifacts from quantitative calculations. We demonstrated that the automated system performs nearly the same as a human user following a standard protocol for manual artifact removal with Pearson's r-values of 0.999 and 0.998 for two different biomarkers (n = 36 patients). We defined a usable dynamic range of fluorescence intensities corresponding to 1 to 2000 arbitrary units (a.u.). Fluorescence intensities within the dynamic range increased linearly with respect to exposure time and particle concentration. The second technique was the implementation of an internal standard to adjust levels of biomarker fluorescence based on the relative collection efficiency of the chip. Use of the internal standard reduced variability in measured biomarker levels due to differences in chip-to-chip collection efficiency, especially at low biomarker concentrations. The internal standard did not affect linear trends between fluorescence intensity and exposure time. Adjustments using the internal standard improved linear trends between fluorescence intensity and particle concentration. The optical quantification techniques described in this paper can be easily adapted for other lab-on-a-chip platforms that have predefined regions of biomarker or particle collection and that rely on fluorescence detection.
1. Introduction
Tumors release various types of cancer-related biomarkers into circulation starting from early stages and continuing throughout their development.1–4 Liquid biopsy techniques are designed to detect these biomarkers (e.g. including DNA, RNA, and proteins) in blood samples. Compared to invasive and localized tissue biopsies, liquid biopsies are advantageous as a cancer-screening tool. Blood collection is minimally invasive and offers the potential to detect biomarkers released across the entire tumor lesion, which can more accurately depict tumor heterogeneity.Many cancer-specific biomarkers are associated with lipid-based nanoparticles (NPs) called extracellular vesicles (EVs), which are secreted by tumor cells5 in elevated quantities. Exosomes are one type of EV that are difficult to recover from blood due to their small size (50 to 150 nm diameter)6–8 and low buoyant density. Recovery of exosomes is a fundamental challenge for quantifying their associated biomarkers. Traditional “gold-standard” methods to recover exosomes for biomarker analysis include ultracentrifugation and filtration-based separations, which are time-consuming and labor-intensive.9–13 New lab-on-a-chip systems for NP separation efficiently recover EVs from blood plasma.14–16
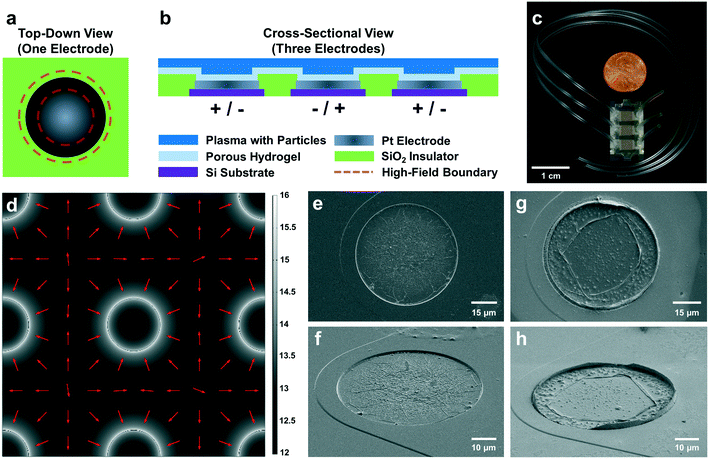
Dielectrophoresis (DEP) is the motion of an object due to dielectrophoretic forces. When an object suspended in fluid is subjected to a non-uniform electric field, contrasting dielectric properties of the object and its surrounding media induce DEP forces on the object. In particular, DEP17 applied to the microfluidic environment can preferentially concentrate tumor-derived NPs to known locations within the chip14–16 as shown in Fig. 1. Blood-derived plasma samples are loaded into the microfluidic chamber on top of a planar microarray of circular electrodes. When an AC voltage is applied across electrodes, this particular microarray geometry creates a strong electric field gradient that exerts DEP forces on EVs and other endogenous NPs in the fluid sample. These NPs are collected at maxima in the electric field gradient known as “high-field” regions (Fig. 1a), which are located at the circumferences of each electrode in the planar microarray as predicted by theoretical simulations (Fig. 1d) and confirmed by scanning electron microscopy (Fig. 1g and h). NPs are held in place by positive DEP (pDEP) forces during washing, which removes the bulk plasma. Subsequent immunostaining and fluorescence imaging of the collected NPs enables detection and quantification of their associated biomarkers. The collection of endogenous NPs at the electrode circumferences increases their local concentration, and thereby the fluorescent signal, enhancing the signal-to-noise ratio (SNR).
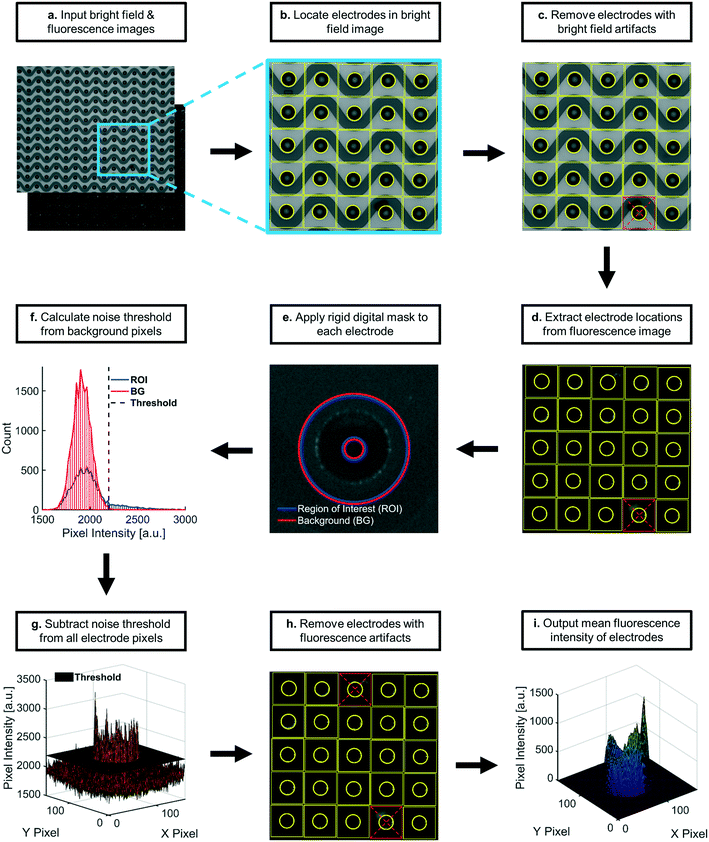
Applying this DEP technique to early cancer detection presents a unique set of challenges stemming from characteristically low concentrations of biomarkers present in circulation at early stages of disease.18–20 In order to address the challenge of inherently low SNRs, it is critical to measure the level of BG noise and to separate BG levels from the detected signal of immunofluorescently stained biomarkers. Here we demonstrate a custom optical imaging algorithm, written with MATLAB® software, to automate quantification for this type of immunofluorescent staining. The algorithm for fluorescence quantification described in this paper zeroes pixel intensities at each region of collection (“region-of-interest”, or “ROI”) to the noise level (e.g. average pixel intensity plus three standard deviations) of the local BG. Localized noise-subtraction treated collection at each ROI in a field-of-view as a unique sampling of biomarkers from the plasma. Localized comparisons were important because BG fluorescence can vary throughout a single field-of-view, across multiple fields-of-view on a single chip, and across multiple fields-of-view for different chips.
To address the challenge of inherently low levels of target biomarkers, it was also necessary to reduce user bias in quantitation. Biomarkers were collected at predictable ROIs, allowing for localized noise subtraction as previously mentioned. The ability to predict the locations of biomarker collection based on the geometry of the planar electrode microarray in the DEP chip also allowed us to automate quantitative calculations, including the removal of optical artifacts. Complete automation of quantitative calculations successfully minimized user bias in fluorescence analysis and reduced analysis time. Automated artifact removal performed as well as a single user following a controlled protocol for manual artifact removal.
We also developed an internal standard, consisting of a known concentration of fluorescent NPs, to correct for the variability in collection efficiency across DEP chips and to further address the challenge of low SNRs. Fluorescent NPs and target biomarkers were collected simultaneously and quantified using the custom algorithm. The internal standard ensured that observed differences in fluorescence intensity between two or more biological samples reflected physiological differences in endogenous biomarker levels rather than a discrepancy in collection efficiencies across DEP chips.
Many lab-on-a-chip designs focus on the separation and concentration of target particles into predictable locations. Other designs include implementations of DEP where exosomes,14,15 stem cells,21,22 blood cells,23,24 cancer cells,25–27 bacteria,28,29 viruses,30,31 and synthetic NPs16,32,33 are all collected in predictable locations. Other collection modes include electrophoretic,34 magnetophoretic,35,36 and acoustophoretic37–39 forces to concentrate targets from surrounding media to known regions on the chip. Several devices utilize immunoaffinity capture of EVs either by functionalized NPs40 or at patterned locations on the chip.41 Still others use increased affinity for substrates coated in nanotubes to collect aberrant circulating tumor cells.42 The automated algorithmic approach described here can be easily adapted for use with other chip geometries by changing the shape of the digital mask to encompass the ROI. Masking makes the algorithm a widely applicable tool to reduce user bias, labor, and time in analyzing large numbers of samples. Masking also reduces BG noise for more accurate quantification of low abundance targets.
2. Materials & methods
2.1 Particle collection using DEP for development of optical quantification algorithm
Conditioned media (1.5 L) was thawed and concentrated to approximately 20 mL using an Amicon stirred-cell concentration (10 kDa filter size). Concentrated media was centrifuged (30 minutes; 10![[thin space (1/6-em)]](https://www.rsc.org/images/entities/char_2009.gif) 000g; 4 °C) and protein aggregates were removed. EVs were then concentrated to approximately 5 mL by centrifugal filtration using an Amicon Ultra-15 (10 kDa) spin filter. EV populations were size-separated by fast protein liquid chromatography (FPLC). FPLC fractions corresponding to the size range of exosomes (50–150 nm) were collected and suspended into approximately 1 mL of 0.5× PBS. The concentration and size distribution of collected EVs were measured using a qNano gold instrument by IZON (Christchurch, New Zealand). Size distribution and concentration data were plotted in Fig. S1.† Harvested EVs were aliquoted and stored at −80 °C.
000g; 4 °C) and protein aggregates were removed. EVs were then concentrated to approximately 5 mL by centrifugal filtration using an Amicon Ultra-15 (10 kDa) spin filter. EV populations were size-separated by fast protein liquid chromatography (FPLC). FPLC fractions corresponding to the size range of exosomes (50–150 nm) were collected and suspended into approximately 1 mL of 0.5× PBS. The concentration and size distribution of collected EVs were measured using a qNano gold instrument by IZON (Christchurch, New Zealand). Size distribution and concentration data were plotted in Fig. S1.† Harvested EVs were aliquoted and stored at −80 °C.
The second experiment was designed to investigate the influence of the internal standard (i.e. a fixed concentration of fluorescent polystyrene NPs) on varying concentrations of immunolabeled EVs each run as technical triplicates (“Exp 2” in Fig. 2, 3c–f, and 5). HeLa-derived EVs were incubated with mouse monoclonal anti-CD9-Alexa Fluor 488 antibody for one hour at room temperature (1![[thin space (1/6-em)]](https://www.rsc.org/images/entities/char_2009.gif) :
:![[thin space (1/6-em)]](https://www.rsc.org/images/entities/char_2009.gif) 50 dilution from stock). Immunolabeled EVs were diluted serially into healthy human plasma (2 × 10¹⁰, 4 × 10¹⁰, 8 × 10¹⁰ EVs mL−1). Fluorescent polystyrene NPs were added to a final concentration of approximately 5 × 10⁹ particles per mL in each plasma dilution of EVs. Technical triplicates of each dilution were loaded into three physically isolated microfluidic chambers on DEP chips. Fluorescent NPs and EVs were simultaneously collected via DEP with subsequent immunostaining, fluorescence image acquisition, and image quantification. Fluorescence intensities from the second experiment were also used to determine the dynamic range of the system.
50 dilution from stock). Immunolabeled EVs were diluted serially into healthy human plasma (2 × 10¹⁰, 4 × 10¹⁰, 8 × 10¹⁰ EVs mL−1). Fluorescent polystyrene NPs were added to a final concentration of approximately 5 × 10⁹ particles per mL in each plasma dilution of EVs. Technical triplicates of each dilution were loaded into three physically isolated microfluidic chambers on DEP chips. Fluorescent NPs and EVs were simultaneously collected via DEP with subsequent immunostaining, fluorescence image acquisition, and image quantification. Fluorescence intensities from the second experiment were also used to determine the dynamic range of the system.
![[thin space (1/6-em)]](https://www.rsc.org/images/entities/char_2009.gif) :
:![[thin space (1/6-em)]](https://www.rsc.org/images/entities/char_2009.gif) 50 dilution from stock of mouse monoclonal anti-CD63-Alexa Fluor 647 primary antibody added into blocking buffer (“Exp 2”). Samples were washed with 0.5× PBS. Samples spiked with only fluorescent polystyrene NPs were not incubated with antibodies (“Exp 1”). For SEM imaging, the 0.5× PBS in the microfluidic chamber of the chip was exchanged for 1× TE buffer prior to freezing the DEP chip using dry ice and an aluminum block stored at −80 °C.
50 dilution from stock of mouse monoclonal anti-CD63-Alexa Fluor 647 primary antibody added into blocking buffer (“Exp 2”). Samples were washed with 0.5× PBS. Samples spiked with only fluorescent polystyrene NPs were not incubated with antibodies (“Exp 1”). For SEM imaging, the 0.5× PBS in the microfluidic chamber of the chip was exchanged for 1× TE buffer prior to freezing the DEP chip using dry ice and an aluminum block stored at −80 °C.
![[thin space (1/6-em)]](https://www.rsc.org/images/entities/char_2009.gif) :
:![[thin space (1/6-em)]](https://www.rsc.org/images/entities/char_2009.gif) 200 dilution from stock) into blocking buffer for one hour at room temperature prior to washing with 0.5× PBS. Material was incubated with a fluorescently-labeled secondary antibody solution (1
200 dilution from stock) into blocking buffer for one hour at room temperature prior to washing with 0.5× PBS. Material was incubated with a fluorescently-labeled secondary antibody solution (1![[thin space (1/6-em)]](https://www.rsc.org/images/entities/char_2009.gif) :
:![[thin space (1/6-em)]](https://www.rsc.org/images/entities/char_2009.gif) 500 dilution from stock into blocking buffer) for one hour at room temperature prior to washing with 0.5× PBS.
500 dilution from stock into blocking buffer) for one hour at room temperature prior to washing with 0.5× PBS.
2.2 Design of algorithm for optical quantification
2.3 Statistical analyses
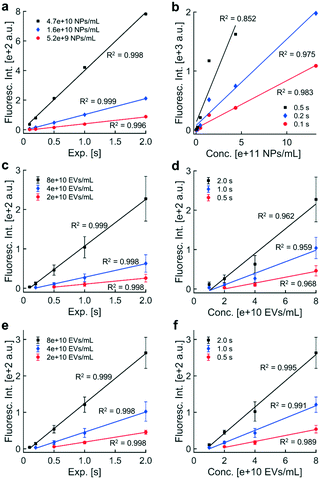
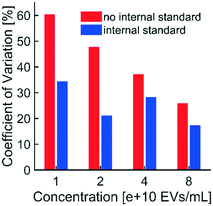
“Fluorescence intensity” refers to the sample mean of the average fluorescent pixel intensity from noise-subtracted areas at each usable electrode in a field-of-view. The “sample” refers to as many as 208 usable electrodes in the field-of-view of the input image. The quantified sample was a subset of the total population of electrodes in the microfluidic chamber of the chip. The population mean was estimated from the sample of usable electrodes to within 95% confidence (included in automated reports; confidence intervals not plotted). To obtain technical triplicates, three aliquots from one biological sample were obtained. Each aliquot was introduced to a single microfluidic chamber prior to collection of particles via DEP, immunofluorescence labeling, washing, and imaging. Variability in fluorescence intensity across technical triplicates represented differences between individual populations of electrodes. Error bars in plotted data represented one standard deviation above and below the average fluorescence intensity of technical triplicates (i.e. three quantitative values from three input images, each representing one of three technical replicates).Pearson correlations between variables on vertical and horizontal axes were calculated for subplots in Fig. 2 and 6. Linear fits in Fig. 3 were calculated using plotted fluorescence intensities, all of which were within the usable dynamic range (1–2000 a.u.). Fluorescence intensities in Fig. 3c and d were adjusted for collection efficiency using the internal standard and plotted in Fig. 3e and f. To adjust for collection efficiency, the fluorescence intensity of the internal standard for one sample (“reference”) was arbitrarily selected. Correction factors were calculated by dividing the reference intensity by the measured intensities of the internal standard in each sample (e.g. such that the correction factor for the reference sample was one). The fluorescence intensity of the target biomarker in each sample was then multiplied by the correction factor. Unique sets of correction factors were calculated for each exposure time. Coefficients of variation (CVs) were calculated for technical triplicates in unadjusted and adjusted fluorescence intensities (Fig. 5).
2.4 Automation of software for optical quantification
Previous script versions relied on user input to identify artifacts for removal, which introduced several sources of analytical error. Optical artifacts included debris or bubbles on top of or inside the microfluidic chamber that had abnormally high levels of fluorescence through one or more optical filters. Multiple users could have different interpretations as to whether a given set of pixels qualified as an artifact. These discrepancies were present even amongst users following the same protocol for identifying artifacts. Another source of error could arise within a single user whose interpretation of the protocol for artifact identification changed subconsciously over time. These user biases added a potential source of error in measurements of fluorescence intensity. Manual artifact removal also required substantial amounts of time from users, reducing throughput.To address these issues, we developed an algorithm that automated the removal of optical artifacts from images. To evaluate the performance of the automated system, we acquired a set of fluorescence images of two labeled biomarkers isolated from the plasma of thirty-six patients (72 images total). This set of images was analyzed using both the manual and automated approaches, the results of which were compared in Fig. 6. The manual approach outlined a protocol for identifying and removing optical artifacts while minimizing user bias. The protocol required that a single user needed to perform the analysis in less than three days in order to minimize drift in the user's interpretation of the protocol. The automated approach was designed to mimic the user protocol by programmatically encoding artifact removal into the software.
2.5 Metrics of data quality
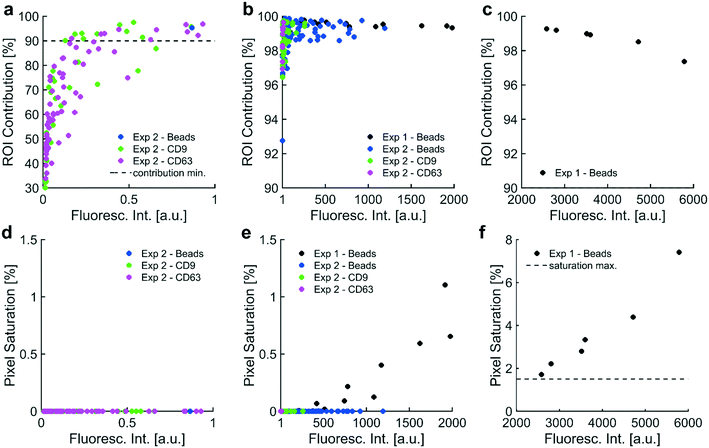
In order to develop a robust, automated method for quantification of collected EV biomarkers, it was necessary to establish metrics for data quality within the optical analysis software. Analysis of these data quality metrics enabled us to define a dynamic range of fluorescence intensity values that exhibited consistent, quantitative trends with both exposure time and particle concentration. The first quality metric was the percentage of the fluorescence intensity that originated from the ROI. This metric was used to ensure that the fluorescence intensity in the ROI was substantially higher than the surrounding BG. We overlaid all the identified electrode areas (yellow boxes in Fig. 7) and averaged respective pixels to generate a representative image of the average electrode. We categorized ROI and BG pixels in the averaged electrode image with the same digital mask we used to calculate noise levels at individual electrodes (Fig. 7e and S2xvi†). We integrated pixel intensities within the ROI as well as intensities within the BG, noting that the sum of the two integrals equaled the fluorescence intensity value. Both fluorescent polystyrene NPs and immunolabeled EVs were collected using DEP, quantified, and presented in Fig. 2. Fluorescence intensities above 1 a.u. consistently exhibited contributions from the ROI of at least 90% (Fig. 2a–c). Therefore, we set the cutoff for the contribution from the ROI to the overall fluorescence intensity to be greater than 90%.The second metric for data quality was the percentage of saturated pixels contributing to the fluorescence intensity. Due to inherent limitations of the camera, a saturated pixel indicated that the upper limit of incident photons had been recorded. Photons subsequently incident upon the photodetector were not measured, leading to an underestimation of fluorescence. For this reason, reliable data required negligible numbers of saturated pixels. From the data shown in Fig. 2f, fluorescence intensities above 2000 a.u. showed a strong positive correlation with pixel saturation. Intensities in this set of values exhibited saturation rates above 1.5%. Therefore, the second condition for high-quality data was that the pixel saturation rate must be less than 1.5%.
3. Results & discussion
3.1 Automation of software for optical quantification
3.2 Characterization of software for optical quantification
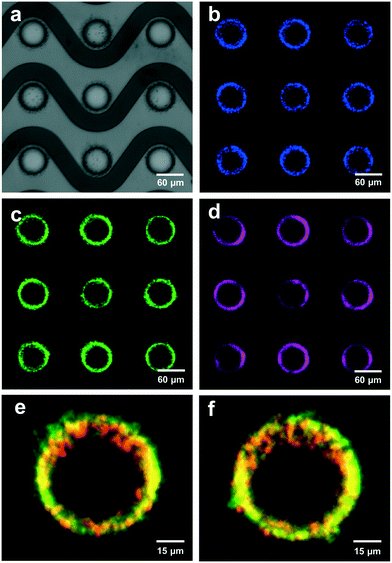
Fluorescence from collected particles in the ROI showed a discernible ring-shaped pattern where simulations suggested the accumulation of biomarkers that were responsive to pDEP. We wanted to elucidate the lower limit of fluorescence intensity values that correlated with high contributions from the ROI (i.e. above 90%) to yield ring-shaped fluorescence patterns. When there was no difference in the distribution of pixel intensities in the ROI (high-field DEP) and the distribution of pixel intensities in the BG (low-field DEP), there was no discernible pattern of fluorescence after noise-subtraction. Assuming a Gaussian noise distribution of pixel intensities spanning the ROI and BG, the contribution from the ROI to the fluorescence intensity should have been approximately 31% because the BG contained approximately 2.2 times as many pixels as the ROI (1/(2.2 + 1) = 0.31). ROI contributions of 31% therefore indicated pure noise, and fluorescence intensities with contributions from the ROI greater than 31% contained some signal. We empirically decided that contributions from the ROI needed to be at least 90% for patterns of fluorescence to be discernible. The contribution from the ROI could not equal 100% because the process for thresholding noise eliminated approximately 99.7% of pixels in the BG (assuming a normal distribution of pixel intensities). Therefore, approximately 0.3% of pixels in the BG would always contribute to fluorescence intensity values, meaning that there would always be a nonzero BG contribution and a non-unity contribution from the ROI. Therefore, fluorescence intensity values indicative of NP collection should have had contributions from the ROI in the set of percentages [90, 100]. Furthermore, fluorescence intensity values would be greater than zero because there would always be a nonzero level of BG noise, regardless of exposure time during image acquisition and the amount of fluorescent particles isolated via DEP.
Pearson coefficients were calculated to assess correlations between contribution from the ROI and fluorescence intensity over three sets of intensity values. Fluorescence intensity values in the set [0, 1 a.u.] correlated strongly with contribution from the ROI (r = +0.717; Fig. 2a). Contribution from the ROI tended toward approximately 30% as fluorescence intensities approached zero. Both observations agreed with expectations: contribution from the ROI increased as fluorescence intensity increased, ranging from pure noise (approximately 30%) for intensities approaching zero to fluorescence patterns (at or above 90%) for intensities approaching 1 a.u. Fluorescence intensities in the set [1 a.u., 2000 a.u.] correlated weakly with contribution from the ROI (r = +0.261; Fig. 2b). Fluorescence intensities in this set were also exclusively above the cutoff for detectable fluorescence (contribution from ROI greater than or equal to 90%), meaning that all intensities in the set [1 a.u., 2000 a.u.] exhibited patterns of ring-shaped fluorescence. Fluorescence intensities in the set [2000 a.u., 6000 a.u.] demonstrated a strong negative correlation with contribution from the ROI; however, all intensities in the set [2000 a.u., 6000 a.u.] exhibited discernible patterns of ring-shaped fluorescence through contributions from the ROI above 90% (r = −0.960; Fig. 2c). The unanticipated negative correlation was likely caused by increasing amounts of photon noise leaking into the BG region from increasingly strong signal at the ROI (Fig. 7e).
Pearson coefficients were calculated to ascertain correlations between the amount of pixel saturation and fluorescence intensity over three sets of intensity values. We determined that the population of saturated pixels needed to be at or below 1.5% for the fluorescence intensity value to be quantitative. All images were acquired with a 14-bit camera and exported as 16-bit TIFs. The multiplicative conversion from 14-bit format to 16-bit did not change the resolution of the image as the relative spacing between adjacent intensity values remained the same.
Fluorescence intensities in the set [0, 1 a.u.] did not correlate with pixel saturation because no saturation was detected (Fig. 2d). Fluorescence intensity over the set [1 a.u., 2000 a.u.] positively correlated with pixel saturation, as expected (r = +0.746; Fig. 2e). Fluorescence intensities in this set were exclusively below 1.5% pixel saturation. Fluorescence intensities in the set [2000 a.u., 6000 a.u.] demonstrated a strong positive correlation with rates of pixel saturation (r = +0.976; Fig. 2f). Pixel saturation rates for fluorescence intensities in this set exceeded 1.5%, confirming that substantial pixel saturation was prevalent in fluorescence intensities above 2000 a.u.
The observed relationship between fluorescence intensity and exposure time was consistent with how exposure time scales distributions of pixel intensities. Both the ROI and BG should scale by the same factor, c, for a c-fold increase in exposure time. The mean and standard deviation of the distribution of BG pixels should also increase by a factor of c. The noise threshold should increase by a factor of c as well (noise threshold = BG mean + 3 × BG std). The factor c should propagate through the remainder of the calculation to scale the final fluorescence intensity value, assuming the intensity value is within the dynamic range. Low contributions from the ROI and high pixel saturation outside the usable dynamic range suggested that limitations of the camera caused the ROI and BG pixel distributions to overlap or saturate (Fig. S3†), adversely affecting linearity with exposure time.
Similar trends were observed in fluorescence intensity and exposure time for EVs, which were labeled with anti-CD9-AF488 prior to isolation via DEP (Fig. 3c). Individual data represent the average of the sample means of fluorescence intensity of usable, noise-subtracted electrodes (one image per replicate; error bars show one standard deviation above and below the mean fluorescence intensity). We wanted to confirm that signal from the internal standard in the DAPI fluorescence channel would not affect intensity values from labeled EVs in the adjacent EGFP channel. Control experiments confirmed that fluorescence from the internal standard was undetectable in the EGFP channel. Fluorescence levels from immunolabeled EVs through the DAPI channel were less than 1.5% of levels through the EGFP channel (data not shown). Together, these data indicate minimal spectral bleed through in adjacent DAPI and EGFP filter sets for the fluorescent labels used in these experiments.
Linear regressions were performed on fluorescence intensities within the dynamic range for separate contours of EV concentration. Best-fit lines were plotted through data within the dynamic range. All contours exhibited a high degree of linearity, suggesting that the presence of the internal standard had no effect on the relationship between fluorescence intensity and exposure time; however, the size of error bars in technical triplicate data suggested that non-physiological differences in collection efficiency across individual microfluidic chambers might adversely affect linearity. Intensities were adjusted later using the internal standard to account for collection efficiency, reducing variability in biomarker levels.
Fluorescence intensities above 2000 a.u. were not reliably quantitative due to pixel saturation. To obtain quantitative fluorescence values in situations with high pixel saturation, the acquisition exposure time could be reduced by a factor of c to shift the pixel distribution to lower values within limits of the photodetector in the camera. If quantification of the new image yielded a fluorescence intensity within the dynamic range and minimal pixel saturation, multiplying the fluorescence intensity by a factor c would yield a better estimate of the true fluorescence level than the original image acquired at a higher exposure. Therefore, linearity with exposure time can be exploited to expand the upper limit of the dynamic range.
3.3 Characterization of the internal standard
A critical component of standardized fluorescence quantification is minimizing chip-to-chip variability in collection efficiency. Our technique for minimizing variability across technical replicates was to use an internal standard consisting of a known concentration of fluorescent polystyrene NPs, which we spiked into biological samples. DEP forces collected the polystyrene NPs and the biological target particles simultaneously. The polystyrene NPs were selected to fluoresce at different wavelengths than the reporters used to label biological targets.Adjusting fluorescence levels of labeled biomarkers to levels of the internal standard accounted for non-physiological differences in intensity. A chip with a low collection efficiency would isolate fewer polystyrene NPs and fewer biomarkers compared to a chip with high collection efficiency. Without the internal standard, we cannot be sure if a difference in biomarker fluorescence is due to a physiological difference in biomarker concentration, a difference in collection efficiencies across chips, or a combined effect. The internal standard enables us to adjust biomarker levels to minimize the impact of collection efficiency.
Taken together with data shown in Fig. 3f, the internal standard effectively reduced the variability in technical replicates while improving the linear relationship between EV concentration and fluorescence intensity. Furthermore, the presence of the internal standard did not affect the linear relationship between fluorescence intensity and exposure time (Fig. 3e). Therefore, the internal standard was shown to be beneficial for quantifying biomarkers collected with DEP chip technology.
Conclusion
We designed an algorithm to quantify the fluorescence intensity of labeled NPs collected in predictable locations within a microfluidic device. We demonstrated the utility of this algorithm by using an electrode microarray chip to collect EVs and polystyrene NPs from blood plasma via DEP forces. Quantification was achieved by comparing pixel intensity values in regions of high-field DEP, where the particles preferentially accumulated, to values at adjacent regions of low-field DEP, which served as BG. We automated the entire process including removal of optical artifacts, the determination of fluorescence intensity, and the creation of reports. Automation helped standardize analysis by minimizing user bias and improving throughput. We then identified a usable dynamic range in fluorescence intensity values. We established the lower limit of the usable dynamic range by correlating fluorescence intensity with the predicted location of the source of fluorescence. Correlations between fluorescence intensity and the percentage of saturated pixels defined the upper limit of the usable dynamic range. As anticipated, we observed linear relationships between fluorescence intensity and exposure time at multiple concentrations of particles within the dynamic range. We also demonstrated that fluorescence intensity increased linearly with particle concentration at multiple exposure times within the dynamic range. By tailoring the digital mask to encompass regions of collection, the algorithm described in this paper can be translated to other fluorescence-based platforms for liquid biopsy.We also developed an internal standard to correct for chip-to-chip variability in collection efficiency. Spiking a known concentration of fluorescent polystyrene NPs into biological samples enabled us to partially correct for variability in fluorescence intensity across technical replicates. Adjusting for collection efficiency did not change linear trends between fluorescence intensity and exposure time; however, use of the internal standard improved the linearity of fit for fluorescence intensity and biomarker concentration. Use of the internal standard reduced the measured variability in technical replicates by correcting for differences in collection efficiency across DEP chips. The internal standard will be important for comparing biomarker levels between clinical patient samples of unknown disease states. Controlling for non-physiological variability in biomarker levels is especially critical for the detection of early stage cancer, which often exhibits low circulating concentrations of prognostic biomarkers.
Author contributions
K. T. Gustafson designed the algorithm, harvested EVs from cell culture media, performed experiments, acquired images, analyzed data, assembled figures, and wrote the manuscript. K. Huynh harvested EVs from cell culture media, performed experiments, acquired images and electron micrographs, and analyzed data. D. Heineck provided feedback during algorithm design and optimization, and obtained data from simulations. J. Bueno and A. Modestino performed experiments, acquired images, and provided feedback during algorithm design and optimization. S. Kim acquired electron micrographs. A. Gower and R. Armstrong purified, concentrated, and characterized EVs from cell culture media. C. E. Schutt performed colocalization analyses of EVs and fluorescent NPs collected simultaneously using DEP. S. Ibsen oversaw all work, helping to create the algorithm, design experiments, analyze data, assemble figures, and write the manuscript.Conflicts of interest
D. Heineck is an employee of Biological Dynamics.Acknowledgements
This project was supported by funding (CEDAR Project Full4960219) from the Cancer Early Detection Advanced Research Center at Oregon Health & Science University's Knight Cancer Institute. Human plasma specimens were provided by the Brenden-Colson Center for Pancreatic Care, the Oregon Pancreas Tissue Registry, and the OHSU Knight Cancer Institute CEDAR Center Repository. Electron microscopy was performed at the Multiscale Microscopy Core, a member of the OHSU University Shared Resource Cores. K. T. Gustafson would like to thank the Achievement Rewards for College Scientists (ARCS) Foundation Oregon for their financial support.References
- N. Festjens, T. V. Berghe and P. Vandenabeele, Biochim Biophys Acta Bioenerg, 2006, 1757, 1371–1387 CrossRef CAS PubMed.
- M. An, I. Lohse, Z. Tan, J. Zhu, J. Wu, H. Kurapati, M. A. Morgan, T. S. Lawrence, K. C. Cuneo and D. M. Lubman, J. Proteome Res., 2017, 16, 1763–1772 CrossRef CAS PubMed.
- M. Ilies, P. K. Sappa, C. A. Iuga, F. Loghin, M. G. Salazar, F. U. Weiss, G. Beyer, M. M. Lerch, U. Völker and J. Mayerle, Clin. Chim. Acta, 2018, 477, 127–134 CrossRef CAS PubMed.
- T. Yoneyama, S. Ohtsuki, K. Honda, M. Kobayashi, M. Iwasaki, Y. Uchida, T. Okusaka, S. Nakamori, M. Shimahara and T. Ueno, PLoS One, 2016, 11(8), e0161009 CrossRef PubMed.
- H. Schwarzenbach, D. S. Hoon and K. Pantel, Nat. Rev. Cancer, 2011, 11, 426–437 CrossRef CAS PubMed.
- D. Duijvesz, T. Luider, C. H. Bangma and G. Jenster, Eur. Urol., 2011, 59, 823–831 CrossRef CAS PubMed.
- D. D. Taylor and S. Shah, Methods, 2015, 87, 3–10 CrossRef CAS PubMed.
- A. V. Vlassov, S. Magdaleno, R. Setterquist and R. Conrad, Biochim Biophys Acta Gen Subj, 2012, 1820, 940–948 CrossRef CAS PubMed.
- L. Muller, C.-S. Hong, D. B. Stolz, S. C. Watkins and T. L. Whiteside, J. Immunol. Methods, 2014, 411, 55–65 CrossRef CAS PubMed.
- H. Kalra, C. G. Adda, M. Liem, C. S. Ang, A. Mechler, R. J. Simpson, M. D. Hulett and S. Mathivanan, Proteomics, 2013, 13, 3354–3364 CrossRef CAS PubMed.
- R. J. Lobb, M. Becker, S. Wen Wen, C. S. Wong, A. P. Wiegmans, A. Leimgruber and A. Möller, J. Extracell. Vesicles, 2015, 4, 27031 CrossRef PubMed.
- D. D. Taylor, W. Zacharias and C. Gercel-Taylor, in Serum/plasma proteomics, Springer, 2011, pp. 235–246 Search PubMed.
- A. E. Frampton, M. M. Prado, E. López-Jiménez, A. B. Fajardo-Puerta, Z. A. Jawad, P. Lawton, E. Giovannetti, N. A. Habib, L. Castellano and J. Stebbing, Oncotarget, 2018, 9, 19006 CrossRef PubMed.
- S. D. Ibsen, J. Wright, J. M. Lewis, S. Kim, S.-Y. Ko, J. Ong, S. Manouchehri, A. Vyas, J. Akers and C. C. Chen, ACS Nano, 2017, 11, 6641–6651 CrossRef CAS PubMed.
- J. M. Lewis, A. D. Vyas, Y. Qiu, K. S. Messer, R. White and M. J. Heller, ACS Nano, 2018, 12, 3311–3320 CrossRef CAS PubMed.
- S. Ibsen, A. Sonnenberg, C. Schutt, R. Mukthavaram, Y. Yeh, I. Ortac, S. Manouchehri, S. Kesari, S. Esener and M. J. Heller, Small, 2015, 11, 5088–5096 CrossRef CAS PubMed.
- A. Castellanos, A. Ramos, A. Gonzalez, N. G. Green and H. Morgan, J. Phys. D: Appl. Phys., 2003, 36, 2584 CrossRef CAS.
- Z. W. Kendrick, M. A. Firpo, R. C. Repko, C. L. Scaife, D. G. Adler, K. M. Boucher and S. J. Mulvihill, HPB, 2014, 16, 670–676 CrossRef PubMed.
- S. S. Hori and S. S. Gambhir, Sci. Transl. Med., 2011, 3, 109ra116 Search PubMed.
- S. S. Hori, A. M. Lutz, R. Paulmurugan and S. S. Gambhir, Cancer Res., 2017, 77, 2570–2584 CrossRef CAS PubMed.
- A. R. Yale, J. L. Nourse, K. R. Lee, S. N. Ahmed, J. Arulmoli, A. Y. Jiang, L. P. McDonnell, G. A. Botten, A. P. Lee and E. S. Monuki, Stem Cell Rep., 2018, 11, 869–882 CrossRef CAS PubMed.
- N. Alinezhadbalalami, T. A. Douglas, N. Balani, S. S. Verbridge and R. V. Davalos, Electrophoresis, 2019, 40, 2592–2600 CAS.
- M. Elitas, Y. Yildizhan, M. Islam, R. Martinez-Duarte and D. Ozkazanc, Electrophoresis, 2019, 40, 315–321 CrossRef CAS PubMed.
- A. Sonnenberg, J. Y. Marciniak, R. Krishnan and M. J. Heller, Electrophoresis, 2012, 33, 2482–2490 CrossRef CAS PubMed.
- E. A. Henslee, M. B. Sano, A. D. Rojas, E. M. Schmelz and R. V. Davalos, Electrophoresis, 2011, 32, 2523–2529 CrossRef CAS PubMed.
- T. A. Douglas, J. Cemazar, N. Balani, D. C. Sweeney, E. M. Schmelz and R. V. Davalos, Electrophoresis, 2017, 38, 1507–1514 CrossRef CAS PubMed.
- Y. Qin, L. Wu, T. Schneider, G. S. Yen, J. Wang, S. Xu, M. Li, A. L. Paguirigan, J. L. Smith and J. P. Radich, Angew. Chem., Int. Ed., 2018, 57, 11378–11383 CrossRef CAS PubMed.
- C. V. Crowther, S. H. Hilton, L. Kemp and M. A. Hayes, Anal. Chim. Acta, 2019, 1068, 41–51 CrossRef CAS PubMed.
- I. H. Su, W. C. Ko, C. H. Shih, F. H. Yeh, Y. N. Sun, J. C. Chen, P. L. Chen and H. C. Chang, Anal. Chem., 2017, 89, 4635–4641 CrossRef CAS PubMed.
- J. Ding, R. M. Lawrence, P. V. Jones, B. G. Hogue and M. A. Hayes, Analyst, 2016, 141, 1997–2008 RSC.
- E. Iswardy, T.-C. Tsai, I.-F. Cheng, T.-C. Ho, G. C. Perng and H.-C. Chang, Biosens. Bioelectron., 2017, 95, 174–180 CrossRef CAS PubMed.
- D. V. Polniak, E. Goodrich, N. Hill and B. H. Lapizco-Encinas, J. Chromatogr. A, 2018, 1545, 84–92 CrossRef CAS PubMed.
- V. H. Perez-Gonzalez, R. C. Gallo-Villanueva, B. Cardenas-Benitez, S. O. Martinez-Chapa and B. H. Lapizco-Encinas, Anal. Chem., 2018, 90, 4310–4315 CrossRef CAS PubMed.
- A. Floris, S. Staal, S. Lenk, E. Staijen, D. Kohlheyer, J. Eijkel and A. van den Berg, Lab Chip, 2010, 10, 1799–1806 RSC.
- C. Hale and J. Darabi, Biomicrofluidics, 2014, 8, 044118 CrossRef CAS PubMed.
- B. D. Plouffe, M. Mahalanabis, L. H. Lewis, C. M. Klapperich and S. K. Murthy, Anal. Chem., 2012, 84, 1336–1344 CrossRef CAS PubMed.
- K. Olofsson, B. Hammarstrom and M. Wiklund, Lab Chip, 2020, 20, 1981–1990 RSC.
- A. Urbansky, F. Olm, S. Scheding, T. Laurell and A. Lenshof, Lab Chip, 2019, 19, 1406–1416 RSC.
- Z. Ramshani, C. Zhang, K. Richards, L. Chen, G. Xu, B. L. Stiles, R. Hill, S. Senapati, D. B. Go and H. C. Chang, Commun. Biol., 2019, 2, 189 CrossRef PubMed.
- M. He, J. Crow, M. Roth, Y. Zeng and A. K. Godwin, Lab Chip, 2014, 14, 3773–3780 RSC.
- S. S. Kanwar, C. J. Dunlay, D. M. Simeone and S. Nagrath, Lab Chip, 2014, 14, 1891–1900 RSC.
- M. S. Loeian, S. Mehdi Aghaei, F. Farhadi, V. Rai, H. W. Yang, M. D. Johnson, F. Aqil, M. Mandadi, S. N. Rai and B. Panchapakesan, Lab Chip, 2019, 19, 1899–1915 RSC.
- The MathWorks™, Inc. MATLAB®. Version 9.3.0.713579 (2017b), Natick, MA, 2017.
- The MathWorks™, Inc. Image Processing Toolbox (Version 10.1), Natick, MA, 2017, https://www.mathworks.com/help/images.
- The MathWorks™, Inc. MATLAB® Answers, Natick, MA, https://www.mathworks.com/matlabcentral/answers/index.
- C. A. Schneider, W. S. Rasband and K. W. Eliceiri, Nat. Methods, 2012, 9(7), 671–675 CrossRef CAS PubMed.
- J. Schindelin, I. Arganda-Carreras, E. Frise, V. Kaynig, M. Longair, T. Pietzsch, S. Preibisch, C. Rueden, S. Saalfeld, B. Schmid, J.-Y. Tinevez, D. J. White, V. Hartenstein, K. Eliceiri, P. Tomancak and A. Cardona, Nat. Methods, 2012, 9(7), 676–682 CrossRef CAS PubMed.
Footnote |
| † Electronic supplementary information (ESI) available: A technical flow diagram describes the design sequence of the algorithm to quantify fluorescence images. Histograms of pixel intensities in the ROI and BG of three representative electrodes show collection below, within, and above the detection limits set by the usable dynamic range. Size distribution data show the selection of a subpopulation of HeLa-derived EVs that coincides with the accepted size range of exosomes. Fluorescence images were exported using described parameters into a specific file structure for automated analysis. The algorithm for automated fluorescence quantification is included in its entirety as MATLAB® code. See DOI: 10.1039/d0lc00940g |
| This journal is © The Royal Society of Chemistry 2021 |

