Effect of laser polarization on molecular emission from femtosecond LIBS
Yutong
Chen
,
Yitong
Liu
,
Qiuyun
Wang
,
Suyu
Li
,
Yuanfei
Jiang
,
Anmin
Chen
 * and
Mingxing
Jin
*
Institute of Atomic and Molecular Physics, Jilin University, Changchun 130012, China. E-mail: amchen@jlu.edu.cn; mxjin@jlu.edu.cn
First published on 19th November 2021
Abstract
This study investigated the effect of laser polarization on the molecular bands of femtosecond laser-induced breakdown spectroscopy (LIBS). Results from AlO molecules indicated that the intensities of molecular emission bands under circular polarization in femtosecond LIBS were higher than those under linear polarization. The trend became more evident as laser energy increased. The vibration temperatures at different waveplate angles were also calculated to understand further the effect of laser polarization on the molecular emission signal. Finally, similar research on CN molecules for PMMA targets was carried out. The results showed that the emission intensity of the CN molecule was almost consistent with that of the AlO molecule. The study provided a method to improve the molecular emission signal in femtosecond LIBS with circular laser polarization.
1. Introduction
Laser-induced breakdown spectroscopy (LIBS) is a kind of atomic emission spectroscopy widely used in the qualitative and quantitative measurements of materials. The principle of LIBS is that a high-energy laser beam is converged on a material surface to make the material surface temperature rise rapidly. The electrons in the material are ionized after absorbing the laser energy. At the same time, the surface material is vaporized under the action of a high-temperature field, and a plasma composed of electrons, ions, and unionized atoms is formed on the sample surface. Soon afterward, the plasma expands and diffuses outward. In the process of plasma expansion, the plasma temperature drops sharply, making the particles at high energy levels transition to low energy levels. At the same time, characteristic emission lines of material elements are emitted. Qualitative and quantitative material analysis can be carried out by detecting the wavelength, intensity, and other information.1–5 LIBS has the advantages of simple operation, simultaneous multi-element analysis, no complex sample pretreatment, high spatial resolution, micro loss analysis, remote real-time analysis, and so on.6 Therefore, it is widely used in environmental monitoring, marine monitoring, food safety, biomedical applications, heavy metal pollution, archaeology, and other fields. At present, the primary purpose of LIBS research is to improve the intensity of spectral signals.7,8 For this reason, many researchers have adopted some experimental schemes to deal with this aim, such as double-pulse LIBS,9–11 spark discharge-assisted LIBS,12–14 pre-heated LIBS,15–17 magnetically confined LIBS,18–20 and spatially confined LIBS.21–23The appearance of a chirped-pulse amplifier has promoted the development of a femtosecond laser pulse, which has been widely used in LIBS.24–26 Compared with nanosecond or longer pulses, femtosecond laser pulses have a short pulse duration, lower intensity, and low background emission.27–29 Similar to traditional LIBS, it is also important to enhance the emission of femtosecond LIBS. Adjusting femtosecond laser polarization is an effective method for improving the emission of femtosecond LIBS. The operation is simple and requires only a 1/4 waveplate. Some researchers have discussed the effect of laser polarization on the optical emission signal and achieved good results. Lemos et al. found that the plasma generated by a circularly polarized femtosecond pulse expanded faster, and higher plasma temperature enhanced spectral line intensity.30 Shi et al. reported the effect of polarization on the spectral line intensity of optical emission. They compared spectral emission intensities from linearly, elliptically, and circularly polarized laser pulses. Their results showed that the circularly polarized laser presented the best performance.31 By comparing optical emission under circular polarization (CP) and linear polarization (LP), Yang et al. suggested that the different evolution of the two regions (electric region and magnetic region) caused different acceleration and deceleration mechanisms.32
The microscopic explanation for the different spectral intensities under different polarizations is that the kinetic energy obtained by electrons is different. Panov et al. found that circular polarization in femtosecond filaments makes the filaments more uniform, larger in diameter, and higher in intensity.33 Mitryukovskiy et al. simulated the electronic energy under LP and CP, explaining the physical mechanism of laser polarization effects.34 Bashmakov et al. simulated the development of circular polarization and linear polarization quantum electrodynamics cascades in a standing wave. They explained the microscopic reason for the difference between the two laser polarizations.35 Corkum et al. discussed the electron spectra of plasma under CP and LP,36 finding that the energy with CP was larger, which makes the plasma expand faster. Zhao et al. explored polarization-resolved LIBS,37 finding that the polarization of the plasma emission could suppress the continuum with only slight attenuation of the discrete atomic and ionic spectra. Although studies have discussed the effect of femtosecond laser polarization on the optical emission of LIBS,32,38 most of them focus on the influence of polarization state on atomic emission, while few focus on molecular emission.
The femtosecond laser has excellent advantages in generating LIBS molecular emission compared with long pulse LIBS. Many researchers have used a femtosecond laser to study molecular emission in LIBS. Rao et al. investigated molecular bands and atomic lines from femtosecond LIBS and nanosecond LIBS in air and argon,39 finding that the molecular emissions were stronger in femtosecond LIBS; in contrast, atomic lines were dominant in nanosecond LIBS. Serrano et al. studied the differences in emission spectra from several laser-excited organic molecules under femtosecond and nanosecond regimes,40 finding that femtosecond LIBS better determined the relationship between optical emission from the molecule and chemical composition compared with nanosecond LIBS. Chirinos et al. demonstrated the molecular emission from carbon powder enriched with 99% 13C by femtosecond filament excitation isotopic spectroscopy at a distance of 36 m;41 their results showed that remote isotope detection and quantification could be accomplished. Junjuri et al. reported identifying waste plastics by a femtosecond LIBS technique,42 finding that the combination of femtosecond LIBS and multivariate techniques was an excellent spectral method for identifying plastics. Hartig et al. reported the formation and evolution of a uranium monoxide molecule from a uranium metal sample induced by a femtosecond laser under various ambient air pressures,43 finding that the lifetime of uranium monoxide bands exceeded that of neutral lines. These studies present excellent prospects for molecular detection in femtosecond LIBS. It is also crucial for improving the molecular emission signal from femtosecond LIBS. Due to the improvement in atomic lines by changing femtosecond laser polarization mentioned above, the effect of laser polarization state on molecular bands in femtosecond LIBS will be discussed.
In this study, the effect of laser polarization on the emission of molecular spectra from femtosecond LIBS was investigated under different laser polarizations. By comparing the molecular spectra from femtosecond LIBS with varying polarizations of the laser, the effect of the polarization on the molecular emission bands was discussed. Also, spectral signal-to-background ratio and molecular vibration temperature at different waveplate angles were calculated.
2. Experimental setup
Fig. 1 displays a schematic diagram of the experimental setup for measuring the molecular emission bands from femtosecond LIBS. The experimental design consists of two parts: one is the laser irradiation part, and the other is the data acquisition part. An ultrafast Ti:sapphire amplifier system (Coherence, Libra) with 50 fs and 800 nm was used in the laser irradiation part. The laser system operating in single-shot mode was fired by sending a command (‘man:trig’) to the serial port (RS232) of the synchronization and delay generator. The laser beam from the femtosecond system passed through a half waveplate, a Glan laser polarizer, and a 1/4 waveplate in turn, and was then focused onto the sample using a focusing lens. The sample was fixed on a three-dimensional electric translation stage (Thorlabs, PT3/M-Z8) to ensure that each laser pulse was coupled with the sample in a new, non-ablated surface. The data acquisition part used a lens to focus collected plasma emission into an optical fiber, which was coupled to a spectrometer (Princeton Instruments, SP500I) equipped with an ICCD camera (Princeton Instruments, PIMAX4). The gate delay and width of the ICCD were 1.0 μs and 20.0 μs, respectively. The resolution of the spectrometer was approximately 0.04 nm obtained by a low-pressure mercury lamp. The acquired data was transmitted to a computer. The acquired signals represented a spatiotemporal average of the induced plasma. Each spectrum was an average of 20 shots. The experiment was carried out in air. During the experiment, different laser polarizations were obtained by changing the angle of the 1/4 waveplate. When the rotation angle was 45° + n × 90°, the laser was CP; when the angle was n × 90°, the laser was LP.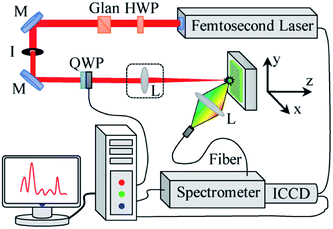 | ||
| Fig. 1 Experimental setup of femtosecond LIBS (M: mirror; I: iris; Glan: Glan laser polarizer; HWP: half waveplate; QWP: 1/4 waveplate; L: lens). | ||
3. Results and discussion
Fig. 2(a) compares AlO (Δν = 0) molecular bands under LP and CP. It can be seen from the figure that the spectral intensities of AlO molecules at (0–0), (1–1), and (2–2) under CP are stronger than those under LP. Fig. 2(b) compares the variation in the peak intensities at AlO (0–0) with the laser energy under circular and linear polarization. The molecular emission under CP is always higher than that under LP, and the trend becomes more significant with an increase in laser energy. At a pulse energy of 0.4 mJ, the difference in spectral intensities under circular and linear polarizations is small. When the laser energy is 1.3 mJ, the molecular emission intensity under CP is about twice that under LP. In the process of femtosecond pulse ablation, the physical mechanisms include multiphoton ionization and inverse bremsstrahlung, and the absorption process of inverse bremsstrahlung is dominant.44 The inverse bremsstrahlung process involves collisions between electrons and ions to produce energy exchange, which is the main method of laser excitation of a plasma. In other words, it is the process of acceleration of electron absorption energy. The kinetic energy of electrons after passing through the intense laser field under CP is larger than that under LP.35 The electrons, therefore, transfer more energy to the lattice, resulting in stronger emission spectral lines under circular polarization.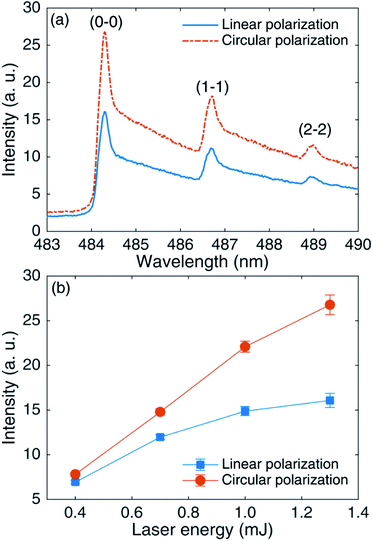 | ||
| Fig. 2 (a) Comparison of AlO (Δν = 0) molecular bands under linear and circular polarizations at 1.3 mJ laser energy. (b) AlO (0–0) peak intensities under LP and CP as a function of laser energy. | ||
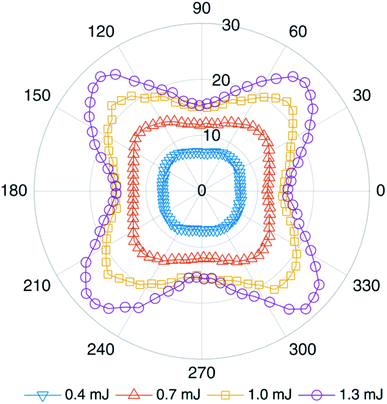
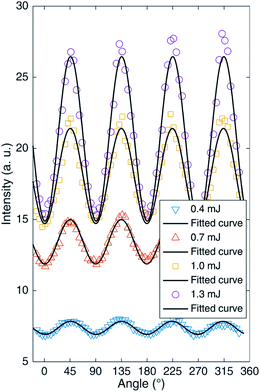
It is well known that circular polarization and linear polarization are obtained by rotating a 1/4 waveplate, so the changes in the spectral peak intensities of an AlO (0–0) molecule by turning the 1/4 waveplate from 0° to 360° are plotted in Fig. 3 under different laser energies. When the 1/4 waveplate is rotated to an angle of 45° + n × 90° (n is an integer), it is a circularly polarized laser, where the molecular band emission reaches a maximum value. When the 1/4 waveplate is rotated to an angle of n × 90° (n is an integer), it is a linearly polarized laser, where the molecular band emission reaches a minimum value. The phenomena are more evident at higher pulse energy. To compare the phenomenon intuitively, the variation of peak intensity at AlO (0–0) with the rotation angle of the 1/4 waveplate is plotted in Fig. 4. It is found that the change in emission intensity can be well fitted by the sine function with the change in angle. The highest band emission is under circular polarization, and the lowest is under linear polarization.
In the quasi-classical above-threshold ionization of sub-relativistic laser intensity, the drift velocity of a tunnel ionization electron is related to the phase of the pulse electric field for ionization time.30 The electron drift kinetic energy at phase ωti is K = q2E02![[thin space (1/6-em)]](https://www.rsc.org/images/entities/char_2009.gif) sin2ωti/(2mω2).45 The net longitudinal momentum of the free electron after passing through the pulse is as follows:
sin2ωti/(2mω2).45 The net longitudinal momentum of the free electron after passing through the pulse is as follows:
The signal-to-background ratio (SBR) is an important indicator of detection sensitivity in LIBS.47 To study the influence of femtosecond pulse polarization on the optical signal more deeply, the evolution of the SBR with the rotated angle of the 1/4 waveplate is plotted in Fig. 5. The results show that the SBR under CP is higher than that under LP, and the results are more obvious for high laser energy, which is consistent with the change in the emission intensity with the rotation angle of the 1/4 waveplate. Due to the above-threshold ionization mechanism, the spectral emission produced by a femtosecond laser with CP is stronger than that with LP, so the SBR of the AlO band emission under CP is also higher.
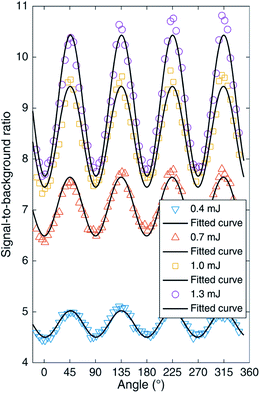 | ||
| Fig. 5 AlO (0–0) signal-to-background ratios as functions of the rotated angle of the 1/4 waveplate. | ||
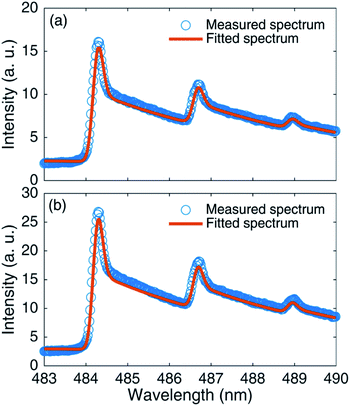
To further study the mechanism of the influence of the femtosecond polarized laser on the spectral signal, AlO vibration temperatures under different polarizations were fitted by existing theory.48Fig. 6 shows the comparison of measured and fitted AlO (Δν = 0) molecular bands for linear and circular polarizations. It can be seen from the figure that the fitted spectra are consistent with the experimental spectra. Fig. 7(a) shows the vibration temperature of AlO as a function of the rotated angle of the 1/4 waveplate for 1.3 mJ laser energy. Also, the change in the vibration temperature with the rotated angle of the 1/4 waveplate is fitted by the sine function. It can be found that since the angle is 45° + n × 90°, that is, under circular polarization, the vibration temperature reaches its lowest value. At the angle of n × 90°, that is, under linear polarization, the vibration temperature reaches its highest value. Fig. 7(b) shows the peak intensity of AlO (0–0) as a function of the rotated angle of the 1/4 waveplate for 1.3 mJ. It can be seen from Fig. 7(a) and (b) that there is an opposite relationship between the emission intensity and the vibration temperature. Dietz et al. simulated a temperature-dependent molecular concentration,49 finding that with an increase in the temperature, the concentration of the CaO molecule decreased; in contrast, the concentrations of Ca and O atoms increased.
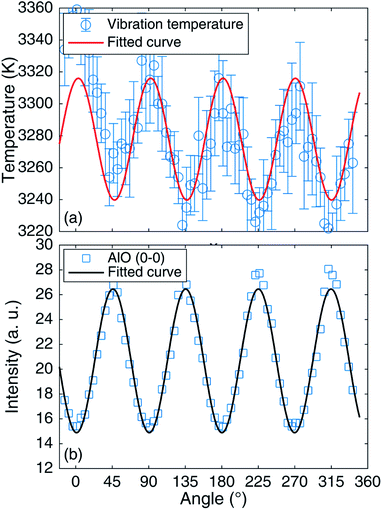 | ||
| Fig. 7 Evolution of vibration temperature (a) and AlO (0–0) (b) with the rotation angle of the 1/4 waveplate for 1.3 mJ. | ||
Hermann et al. simulated the number densities of plasma species;50 they showed that the number density of AlO decreased with an increase in temperature. Hou et al. used laser-produced molecular emission to discuss the formation of AlO molecules from 18O-labeled Al2O3 particles in femtosecond LIBS.51 The generation pathway of the AlO molecule in a femtosecond laser-excited plasma and the generation mechanism of AlO suggested that the AlO molecule is easily dissociated at a higher temperature. With increasing temperature, the AlO molecule will become Al and O atoms by AlO → Al + O shortly after its generation. Also, Bai et al. reported the experimental determination of the temperature range of AlO molecular emission in LIBS of Al, indicating that the density of AlO is lower in the higher temperature region.52 In other words, high temperature will lead to AlO molecular dissociation, which is not conducive to forming the AlO molecular spectrum. The molecular emission intensity is higher at the lower vibration temperature.53 Therefore, Fig. 7 shows that the spectral emission of the AlO molecule in a circularly polarized laser beam with lower vibration temperature is stronger than that in a linearly polarized laser beam with higher vibration temperature.
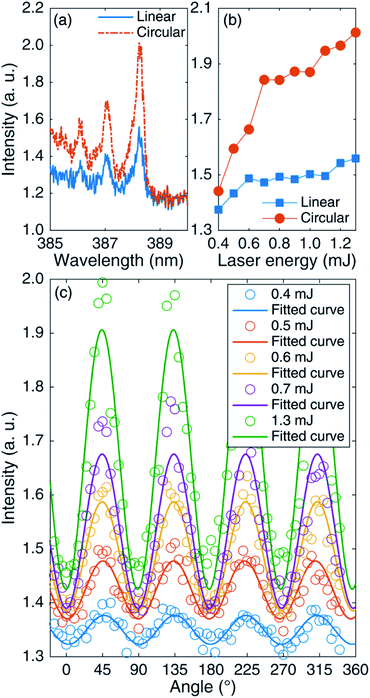
Considering that the AlO molecule may be affected by temperature during ablation, this experimental conclusion is not universal. The same experiment was also carried out on other materials to verify the universality of the above findings. The differences in CN molecular spectra from femtosecond LIBS of PMMA for circular and linear polarizations were compared. Fig. 8(a) compares CN (Δν = 0) emission bands under linear and circular polarization for 1.3 mJ laser energy. It can be seen that the CN emission under CP is stronger compared with that under LP. Fig. 8(b) shows the CN (0–0) peak intensities as functions of laser energy under LP and CP. It can be seen that with the increase in laser energy, the emission intensity under CP is higher than that under LP. Fig. 8(c) shows the CN (0–0) peak intensities as functions of the rotated angle of the 1/4 waveplate. It is not difficult to find that the emission intensities of the CN bands from PMMA are almost the same as those of the AlO emission bands under different laser polarizations. It is concluded that circular polarization is more suitable for improving the spectral signal in femtosecond LIBS.
4. Conclusions
This paper studied the emission intensities of molecular bands from femtosecond LIBS under different laser polarizations. It was found that the emission of AlO bands under CP was stronger than that under LP. Due to the above-threshold ionization mechanism, a circularly polarized femtosecond laser accelerated free electrons continuously, making the kinetic energy of free electrons higher compared with the case under LP. As a result, the AlO molecule exhibited a stronger spectral emission. Also, the vibration temperatures of AlO under different laser polarizations were compared. The vibration temperature under CP was more favorable than that under LP. In addition, the emission intensities of CN molecules from femtosecond LIBS of PMMA under different laser polarizations were compared. The changes in the emission of the CN band were the same as those of the AlO band under different laser polarizations. The above results indicated that circular polarization is more suitable for improving the spectral signal of femtosecond LIBS.Author contributions
Yutong Chen: conceptualization, data curation, investigation, writing – original draft; Yitong Liu: investigation; Qiuyun Wang: investigation; Suyu Li: investigation; Yuanfei Jiang: investigation, data curation; Anmin Chen: conceptualization, data curation, investigation, funding acquisition, writing – review & editing; Mingxing Jin: conceptualization, writing – review & editing, funding acquisition.Conflicts of interest
There are no conflicts to declare.Acknowledgements
We acknowledge the support by the Scientific and Technological Research Project of the Education Department of Jilin Province, China (No. JJKH20200937KJ) and the National Natural Science Foundation of China (No. 11674128, 11674124, and 11974138).References
- S. Carter, A. Fisher, R. Garcia, B. Gibson, J. Marshall and I. Whiteside, J. Anal. At. Spectrom., 2016, 31, 2114–2164 RSC.
- J. Moros and J. Laserna, Appl. Spectrosc., 2019, 73, 963–1011 CrossRef CAS.
- Z. Hou, S. Jeong, Y. Deguchi and Z. Wang, Plasma Sci. Technol., 2020, 22, 070101 CrossRef.
- J. L. Gottfried, F. C. De Lucia Jr, C. A. Munson and A. W. Miziolek, Anal. Bioanal. Chem., 2009, 395, 283–300 CrossRef CAS PubMed.
- Z. Wang, F. Dong and W. Zhou, Plasma Sci. Technol., 2015, 17, 617–620 CrossRef CAS.
- J. D. Winefordner, I. B. Gornushkin, T. Correll, E. Gibb, B. W. Smith and N. Omenetto, J. Anal. At. Spectrom., 2004, 19, 1061–1083 RSC.
- M. Dell'Aglio, R. Alrifai and A. De Giacomo, Spectrochim. Acta, Part B, 2018, 148, 105–112 CrossRef.
- Y. Li, D. Tian, Y. Ding, G. Yang, K. Liu, C. Wang and X. Han, Appl. Spectrosc. Rev., 2018, 53, 1–35 CrossRef.
- E. Tognoni and G. Cristoforetti, J. Anal. At. Spectrom., 2014, 29, 1318–1338 RSC.
- B. Rashid, R. Ahmed, R. Ali and M. A. Baig, Phys. Plasmas, 2011, 18, 073301 CrossRef.
- Y. Wang, A. Chen, D. Zhang, Q. Wang, S. Li, Y. Jiang and M. Jin, Phys. Plasmas, 2020, 27, 023507 CrossRef CAS.
- W. Zhou, X. Su, H. Qian, K. Li, X. Li, Y. Yu and Z. Ren, J. Anal. At. Spectrom., 2013, 28, 702–710 RSC.
- Y. Wang, Y. Jiang, X. He, Y. Chen and R. Li, Spectrochim. Acta, Part B, 2018, 150, 9–17 CrossRef CAS.
- Q. Wang, A. Chen, X. Zeng, Y. Chen, S. Li, Y. Jiang, X. Gao and M. Jin, J. Anal. At. Spectrom., 2021, 36, 1112–1117 RSC.
- S. H. Tavassoli and A. Gragossian, Opt. Laser Technol., 2009, 41, 481–485 CrossRef CAS.
- V. N. Lednev, M. Y. Grishin, P. A. Sdvizhenskii, R. D. Asyutin, R. S. Tretyakov, A. Y. Stavertiy and S. M. Pershin, J. Anal. At. Spectrom., 2019, 34, 607–615 RSC.
- W. Xu, A. Chen, Q. Wang, D. Zhang, S. Li, Y. Jiang, X. Gao and M. Jin, J. Anal. At. Spectrom., 2019, 34, 2288–2294 RSC.
- A. Hussain, M. Tanveer, G. Farid, M. B. Hussain, M. Azam and W. Khan, Optik, 2018, 172, 1012–1018 CrossRef CAS.
- K. S. Singh and A. K. Sharma, Phys. Plasmas, 2016, 23, 122104 CrossRef.
- P. Liu, R. Hai, D. Wu, Q. Xiao, L. Sun and H. Ding, Plasma Sci. Technol., 2015, 17, 687 CrossRef CAS.
- L. Guo, Z. Hao, M. Shen, W. Xiong, X. He, Z. Xie, M. Gao, X. Li, X. Zeng and Y. Lu, Opt. Express, 2013, 21, 18188–18195 CrossRef CAS PubMed.
- A. M. Popov, F. Colao and R. Fantoni, J. Anal. At. Spectrom., 2010, 25, 837–848 RSC.
- X. Wang, A. Chen, Y. Wang, D. Zhang, L. Sui, D. Ke, S. Li, Y. Jiang and M. Jin, Phys. Plasmas, 2017, 24, 103305 CrossRef.
- T. A. Labutin, V. N. Lednev, A. A. Ilyin and A. M. Popov, J. Anal. At. Spectrom., 2016, 31, 90–118 RSC.
- E. L. Gurevich and R. Hergenröder, Appl. Spectrosc., 2007, 61, 233A CrossRef CAS PubMed.
- D. Zhang, A. Chen, Q. Wang, H. Zhang, S. Li and M. Jin, Opt. Express, 2021, 29, 9897–9906 CrossRef CAS PubMed.
- J. R. Freeman, S. S. Harilal, P. K. Diwakar, B. Verhoff and A. Hassanein, Spectrochim. Acta, Part B, 2013, 87, 43–50 CrossRef CAS.
- S. S. Harilal, N. Farid, J. R. Freeman, P. K. Diwakar, N. L. LaHaye and A. Hassanein, Appl. Phys. A: Mater. Sci. Process., 2014, 117, 319–326 CrossRef CAS.
- M. Liu, A. Chen, Y. Chen, X. Zeng, Q. Wang, D. Zhang, D. Yang and M. Jin, Plasma Sci. Technol., 2021, 23, 075501 CrossRef CAS.
- N. Lemos, T. Grismayer, L. Cardoso, J. Geada, G. Figueira and J. M. Dias, Phys. Plasmas, 2013, 20, 103109 CrossRef.
- Y. Shi, A. Chen, Y. Jiang, S. Li and M. Jin, Opt. Commun., 2016, 367, 174–180 CrossRef CAS.
- L. Yang, M. Liu, Y.-T. Liu, Q.-X. Li, S.-Y. Li, Y.-F. Jiang, A.-M. Chen and M.-X. Jin, Chin. Phys. B, 2020, 29, 65203–065203 CrossRef CAS.
- N. A. Panov, O. G. Kosyreva, A. B. Savel'ev-Trofimov, D. S. Uryupina, I. A. Perezhogin and V. A. Makarov, Quantum Electron., 2011, 41, 160–162 CrossRef CAS.
- S. Mitryukovskiy, Y. Liu, P. Ding, A. Houard, A. Couairon and A. Mysyrowicz, Phys. Rev. Lett., 2015, 114, 063003 CrossRef CAS PubMed.
- V. F. Bashmakov, E. N. Nerush, I. Y. Kostyukov, A. M. Fedotov and N. B. Narozhny, Phys. Plasmas, 2014, 21, 013105 CrossRef.
- P. B. Corkum, N. H. Burnett and F. Brunel, Phys. Rev. Lett., 1989, 62, 1259–1262 CrossRef CAS PubMed.
- Y. Zhao, S. Singha, Y. Liu and R. J. Gordon, Opt. Lett., 2009, 34, 494–496 CrossRef PubMed.
- Q. Wang, A. Chen, W. Xu, S. Li, Y. Jiang and M. Jin, J. Anal. At. Spectrom., 2019, 34, 1242–1246 RSC.
- E. N. Rao, P. Mathi, S. A. Kalam, S. Sreedhar, A. K. Singh, B. N. Jagatap and S. V. Rao, J. Anal. At. Spectrom., 2016, 31, 737–750 RSC.
- J. Serrano, J. Moros and J. Javier Laserna, Phys. Chem. Chem. Phys., 2016, 18, 2398–2408 RSC.
- J. Chirinos, A. Spiliotis, X. Mao, G. C. Y. Chan, R. E. Russo and V. Zorba, Spectrochim. Acta, Part B, 2021, 179, 106117 CrossRef CAS.
- R. Junjuri and M. K. Gundawar, J. Anal. At. Spectrom., 2019, 34, 1683–1692 RSC.
- K. C. Hartig, S. S. Harilal, M. C. Phillips, B. E. Brumfield and I. Jovanovic, Opt. Express, 2017, 25, 11477–11490 CrossRef CAS PubMed.
- Z. Cao, L. Jiang, S. Wang, M. Wang, L. Liu, F. Yang and Y. Lu, Spectrochim. Acta, Part B, 2018, 141, 63–69 CrossRef CAS.
- C. T. L. Smeenk, L. Arissian, B. Zhou, A. Mysyrowicz, D. M. Villeneuve, A. Staudte and P. B. Corkum, Phys. Rev. Lett., 2011, 106, 193002 CrossRef CAS PubMed.
- B. Zhou, A. Houard, Y. Liu, B. Prade, A. Mysyrowicz, A. Couairon, P. Mora, C. Smeenk, L. Arissian and P. Corkum, Phys. Rev. Lett., 2011, 106, 255002 CrossRef CAS PubMed.
- E. Tognoni and G. Cristoforetti, Opt. Laser Technol., 2016, 79, 164–172 CrossRef CAS.
- C. G. Parigger, A. C. Woods, D. M. Surmick, G. Gautam, M. J. Witte and J. O. Hornkohl, Spectrochim. Acta, Part B, 2015, 107, 132–138 CrossRef CAS.
- T. Dietz, P. Kohns and G. Ankerhold, Spectrochim. Acta, Part B, 2018, 148, 51–59 CrossRef CAS.
- J. Hermann, A. Lorusso, A. Perrone, F. Strafella, C. Dutouquet and B. Torralba, Phys. Rev. E: Stat., Nonlinear, Soft Matter Phys., 2015, 92, 053103 CrossRef PubMed.
- H. Hou, X. Mao, V. Zorba and R. E. Russo, Anal. Chem., 2017, 89, 7750–7757 CrossRef CAS PubMed.
- X. Bai, V. Motto-Ros, W. Lei, L. Zheng and J. Yu, Spectrochim. Acta, Part B, 2014, 99, 193–200 CrossRef CAS.
- Q. Wang, A. Chen, W. Xu, D. Zhang, Y. Wang, S. Li, Y. Jiang and M. Jin, Opt. Laser Technol., 2020, 122, 105862 CrossRef CAS.
| This journal is © The Royal Society of Chemistry 2022 |

