 Open Access Article
Creative Commons Attribution 3.0 Unported Licence
Advantages of a fast-scanning quadrupole for LA-ICP-MS analysis of fluid inclusions†
Oscar
Laurent‡
 *a,
Marcel
Guillong
a,
Christoph A.
Heinrich
a,
Kenneth
Neubauer
b and
Chady
Stephan
b
aDepartment of Earth Sciences, Institute of Geochemistry and Petrology, ETH Zürich, Zürich, Switzerland. E-mail: oscar.laurent@get.omp.eu
bPerkinElmer Inc., Shelton, Connecticut, USA
First published on 16th August 2021
Abstract
For the past 20 years, LA-ICP-MS has been the method of choice to quantify element concentrations in fluid inclusions hosted in geological samples. However, the ablation of fluid inclusions typically produces short, transient signals that are difficult to representatively sample with sequential analysis inherent to single collector ICP-MS instruments, especially considering small inclusions (<20 µm) and/or low-concentration elements (<10 µg g−1). This issue can be overcome by significantly reducing quadrupole settling times, allowing faster cycling through a given element list at constant duty cycle and therefore, better temporal resolution of the signal. In this note, we present results from already well-characterized fluid inclusion assemblages performed with a “fast-scanning” quadrupole ICP-MS, i.e. characterized by extremely short settling times (default 0.2 ms and down to 0.065 ms). This capability, which does not impede basic instrument performance, improves the results of LA-ICP-MS fluid inclusion analyses in three ways. First, it extends the possibility to accurately and reproducibly quantify element concentrations to fluid inclusions down to <10 µm in size, with absolute detection limits in the same range as using a conventional quadrupole. Second, it releases the need to compromise between full chemical characterization of the fluids and accurate determination of some key elements of interest, as short settling times offer the possibility to rapidly scan through extensive element lists (e.g. 52 elements cycled in 52 ms at 80% duty cycle in the tests presented here). Third, it improves accuracy and precision for analytes hosted in small daughter crystals in assemblages of complex, polyphase fluid inclusions.
Introduction
The ability to accurately measure elemental concentrations in fluid inclusions hosted in geological samples provides critical information about hydrothermal processes, most importantly those leading to the formation of economically important ore deposits.1–4 Laser ablation coupled to inductively coupled plasma mass spectrometry (LA-ICP-MS) has been the technique of choice for analysing fluid inclusions for the past 30 years.5–9 The high spatial resolution of the technique allows the precise targeting of the inclusion with the laser within its textural position, compared to other techniques which involve bulk sample leaching, resulting in the possible mixing of different fluid inclusion generations.1,7–9 The high sample throughput of LA-ICP-MS analyses allows rapid acquisition of data from an assemblage of co-genetic inclusions to characterize the average composition of the corresponding paleo-fluid.7–10 Tests on natural and synthetic inclusions show that such compositions are accurately determined, typically with standard deviations of 20 to 30% relative.7,9Despite being the preferred technique for the analysis of inclusions, a limitation of LA-ICP-MS is that single collector ICP-MS instruments are sequential analysers, meaning that one analyte (i.e. m/z) is measured at a time, typically with a quadrupole. Even though these measurements are rapid (on the order of milliseconds), information is missed for short transient signals, which typically result from the ablation of fluid inclusions due to their small size (commonly <50 µm) and volume.11 The resulting signals may not accurately represent the composition of the inclusion. Sequential analysis indeed increases the probability of missing the signals resulting from smaller inclusions and/or elements present at low concentrations in the fluid12 (typically <10 µg g−1). Moreover, although fluids are trapped as a single phase in their host crystal, they usually split upon cooling into a heterogeneous, multi-phase mixture.13 The resulting signals must therefore representatively sample all components of the inclusions to obtain the composition of the original paleo-fluid,7,8 which is not always straightforward. Notably, the economically important metals (Cu, Mo, Au, Ag etc.) tend to concentrate in very small crystals, prone to be overlooked during sequential analysis.14 These issues likely result in poor reproducibility of populations of co-genetic fluid inclusions1,10 and therefore, represent an important limitation to the chemical characterization of the corresponding geological fluid.10,14
These problems can be avoided by the simultaneous acquisition of intensities for several analytes of interest, using either multi-collector (MC-) or time-of-flight (TOF-) ICP-MS.8,15 However, neither of these have been used for routine fluid inclusion analyses. The analytical mass range to analyse is much more restricted with MC-ICP-MS than with quadrupole instruments, while TOF-ICP-MS has not been tested so far regarding the accuracy of multi-element analyses of fluid inclusions. In the latter case, the already challenging data processing, notably baseline estimation and subtraction,16 is complicated by rapidly changing signal intensities as typically produced by the ablation of fluid inclusions.
Many of these limitations can be overcome by using an ICP-MS which includes not only the ability of the electronics to quickly move between masses, but also an extremely short settling time of the electronics once the new mass is reached. One ICP-MS instrument satisfying these criteria is the PerkinElmer NexION 2000, as shown with respect to imaging by LA-ICP-MS.17 Based on tests from fluid inclusions chemically well-characterized in previous studies,18,19 this work will explore and discuss how the use of such a fast-scanning quadrupole MS improves the reliability of LA-ICP-MS analysis of fluid inclusions. In particular, we will show that this (1) reduces the lower size limit for the exhaustive chemical characterization of fluid inclusions, thereby extending the range of possible applications for the technique; and (2) improves the accuracy and precision of the results for complex, polyphase inclusions.
Experimental
Sample preparation
We studied two sets of already well-documented fluid inclusion assemblages in two distinct ore-forming environments:(1) Low-salinity aqueous fluid inclusions from low-temperature, gold-bearing quartz veins from Tiefengletscher, Swiss Alps.18
(2) High-salinity, multiphase brine inclusions from quartz-wolframite veins associated with the Mole Granite magmatic-hydrothermal tin–tungsten–fluorine deposit (Australia).1,19,20
We targeted fluid inclusions hosted in quartz crystals, representing the main gangue mineral in both cases. The crystals were prepared as double-polished ca. 300 µm-thick sections and cut in small chips (<0.5 cm across). We studied leftover chips from samples that were already studied for fluid inclusion micro-thermometry and LA-ICP-MS analyses, allowing a direct comparison of the results. These former analyses were performed using the same laser instrumental setup as reported here, attached to a conventional (“slow-scanning”) quadrupole ICP-MS. The newly obtained results are available as ESI.†
Instrumental parameters and conditions
All analyses were carried out with the ETH-prototype of the GeoLas excimer laser ablation system, equipped with a ComPex Pro 102F (Coherent Inc., Santa Clara, California, USA) ArF laser source (operating at 193 nm), coupled to a PerkinElmer NexION 2000 quadrupole ICP-MS. The laser and ICP-MS parameters used for the tests on fluid inclusions are listed in Table 1.| Laser make, model and type | Coherent ComPex Pro 102F |
| Laser wavelength | 193 nm (excimer ArF) |
| Laser pulse duration | 25 ns |
| Laser energy density | ca. 20 J cm−2 |
| Laser repetition rate | 10 to 15 Hz |
| Laser spot diameter | ca. 5 to 120 µm, set as to fully ablate the targeted inclusion |
| Ablation cell | Custom-made cylindric, glass, ca. 6 cm3 volume |
| He carrier gas flow | 1.1 L min−1 |
| Gas blank acquisition time | ca. 30 s |
| ICP-MS model and type | PerkinElmer NexION 2000 quadrupole MS |
| Ar plasma gas flow | 15 L min−1 |
| Ar auxiliary gas flow | 1.05 L min−1 |
| Ar makeup gas flow | 0.98 L min−1 |
| Injector | 2 mm i.d., quartz |
| Torch depth/z-position | −0.4 mm |
| RF power | 1550 W |
| Cones | Sampler & skimmer: Ni; hyper skimmer: Al |
| m/z monitored (amu) | 7, 9, 11, 23, 25, 27, 29, 31, 34, 35, 39, 43, 49, 55, 57, 63, 66, 75, 77, 79, 85, 88, 95, 107, 111, 118, 121, 125, 133, 137, 139, 140, 141, 146, 147, 153, 157, 159, 163, 165, 166, 169, 173, 175, 182, 197, 202, 205, 208, 209, 232, 238 |
| Dwell time (ti) | 0.8 ms |
| Quad. settling time (τ) | 0.2 ms |
| Total sweep time (Tn) | 52 ms |
A 193 nm excimer laser was used because this wavelength more effectively couples into different matrices than longer wavelengths (especially into quartz which is partly transparent to UV radiation), thereby minimizing fractionation and improving reproducibility.7,8,21 A full glass, small volume ablation chamber (<6 cm3) constructed in-house was chosen for its fast washout (99% of the maximum signal intensity washed out in ca. 1 second), meaning that although the duration of the aerosol produced from the inclusion ablation event is shorter, the concentration of the aerosol particles, hence the ICP-MS signal-to-noise ratio, are higher, increasing the probability to detect elements at low concentrations.8,10,15 Ablation cells characterized by longer washouts may be used, but this would counteract the benefit of using a “fast-scanning” quadrupole ICP-MS (see Results and discussion). The system was cleaned and optimized by standard procedures for the analysis of fluid inclusions22 to avoid any contamination.
The ablation spot diameter was set as to fully ablate the targeted inclusion, and enlarged progressively using an opening iris aperture to minimize quartz breakout.23 Transport from the ablation chamber to the ICP-MS was facilitated with the use of helium (He) carrier gas for optimal uptake of aerosol particles produced upon ablation.24,25 Argon (Ar) make-up gas was mixed downstream of the ablation chamber using a T-connector, and a short (<0.5 m) transport tubing ensuring fast aerosol transport was connected directly to the base of the ICP-MS injector. A long element list was used (52 analytes; see Table 1) to test the potential of the fast scanning capability to provide an extensive chemical characterization of the tested fluid inclusions.
All quantitative results were obtained from classical external calibration applied to LA-ICP-MS analyses,26 employing NIST SRM610 glass (NIST, Bethesda, Maryland, USA) as reference material for most analytes (using reference values from Jochum et al., 2011)27 and the Sca-17 scapolite reference material28 for Cl, S and Br. The average Na concentrations of fluid inclusion assemblages targeted here, calculated from the equivalent NaCl concentration (NaCleq.) determined by micro-thermometry in previous studies,18,19 were used as internal standards for relative sensitivity correction. Data were processed using the Matlab-based SILLS program29 with limits of detection calculated after Pettke et al. (2012).10 The full dataset is reported as ESI (Table S1†).
Results and discussion
Specificities of a fast scanning quadrupole and benefits to analyse transient signals
The sampling time of quadrupole ICP-MS is a combination of dwell times ti (the time spent by the quadrupole measuring analyte i), the settling time τ (the time for electronics to settle after the quadrupole moves from one mass to another) and the number of analytes n (ref. 26). The total sweep time Tn required to scan the whole mass range in a given method setup is hence defined as: | (1) |
Another consideration is the duty cycle F which describes the fraction of the sweep time spent by the instrument to actually detect ions, therefore defined as:
 | (2) |
While ti and n can be defined by the user, the quadrupole settling time τ is limited by the electronics of the ICP-MS. Typical settling times for commercial quadrupoles are in the range of 1 to 10 ms. However, the instrument used here has a default quadrupole settling time of 0.2 ms and is therefore able to scan 5 to 50 times faster through a given analyte list at a given duty cycle. The value of 0.2 ms corresponds to the working range for the mass jump from Li to U, but it can be theoretically modified to lower values. In practice, the lowermost possible value for τ is 0.065 ms, roughly corresponding to the time required for the quadrupole to be cleared of ions from the previous m/z recording. Using shorter settling times hence increases the probability of inaccurate results as the measured intensity for a given analyte may be influenced by that of the previous one in the element list.
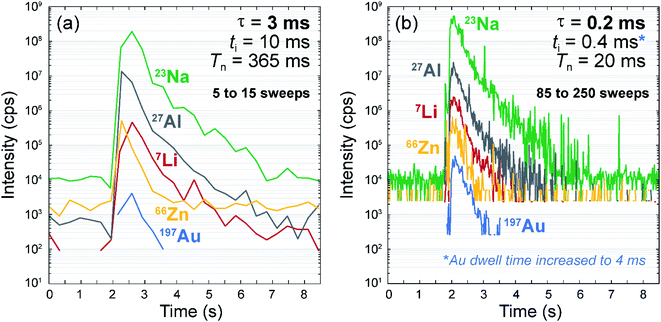
Fast scanning quadrupoles are particularly beneficial when analysing transient signals, to avoid spectral skew and ensure that the acquired intensity ratios are representative of the sample. At slower quadrupole scan speeds, fewer data points are acquired, meaning that some data is missed, and in turn, the acquired data is less representative of the sample.11,14,15,17 A generic practical example is shown in Fig. 1 for two LA-ICP-MS signals both obtained from single laser shot analyses on NIST SRM610 glass, using exactly the same laser ablation, aerosol transport and ICP-MS setup parameters, with the exception of ti and τ (longer vs. shorter respectively; see details in the figure caption). For a given duration of the transient signal (ca. 5 seconds), less than 15 data points (sweeps) are acquired with ti = 10 ms (Fig. 1a). However, about 17 times more data points are acquired with ti = 0.4 ms (Fig. 1b), resulting in a much more representative recording of the short transient signal. For all elements, signal count rates are comparable for both timing setups (Fig. 1), indicating no effect of the reduced times on the ion filtering and counting capacities. This includes abundance sensitivity as peak shapes are the same regardless of ti and τ and providing that the quadrupole is cleared of ions from the previous m/z recording (see above).
Importantly, the maximum signal intensities are lower for some elements in the case of longer dwell/settling times (Fig. 1). This is a consequence of spectral skew, as the probability to miss the peak is higher when the temporal resolution of the transient signal is lower.11,15 Conversely, although noisier, the analyte signals are more representative with the short dwell/settling times (Fig. 1). Element ratios are therefore more accurately determined throughout the signal time window – notably during the first second that represents >95% of the total signal counts (Fig. 1), which is crucial for accurate quantification.7,10,11
In the case of fluid inclusions, this problem is particularly acute as multi-element documentation of the fluid composition requires high signal-to-noise ratios to lower limits of detection and, therefore, as short transient signals as possible15 (typically achieved by using small-volume ablation cells,8 see Experimental section). It has been estimated that a minimum of 15 to 30 sweeps (i.e. readings) per transient signal are required to acquire representative data from an individual fluid inclusion, within the inherent reproducibility of the LA-ICP-MS technique.8,11 In the fluid inclusion tests applied here, we have measured 52 analytes with uniform ti of 0.8 ms and the default value of τ = 0.2 ms, corresponding to Tn = 52 ms (eqn (1)) and F = 80% (eqn (2)). This allows 15 to 30 sweeps to be scanned in only 0.78 to 1.56 s. For the same element setup, a quadrupole ICP-MS instrument with a settling time of 3 ms would require ti = 12 ms to keep the same duty cycle, which would result in 15 times longer sweep times (Tn = 780 ms). This difference is very significant considering that typical signals resulting from the ablation of fluid inclusions are in the order of a few, to a few tens of seconds.10 A more quantitative assessment of the improvement permitted by short settling times are provided in the following two test applications.
Analysis of <20 µm aqueous inclusions in gold-bearing quartz veins
The fluid inclusions in the metamorphic quartz vein sample KMP-1 from Tiefengletscher in the Swiss Alps range in size from <5 µm up to 150 µm. Previous chemical investigation of these inclusions by LA-ICP-MS18 focused mainly on inclusions larger than 20 µm, because of the longer settling time of the quadrupole instrument used. Additionally, the relatively low fluid salinity (ca. 9 wt% NaCleq.)18 and resulting moderate intensity of the signal prevented a representative recording of smaller inclusions. The fast settling time used here allows smaller fluid inclusions to be measured, providing a test of the capability of a fast scanning quadrupole to accurately sample the fluid chemistry in cases where only small inclusions are available. Fig. 2a shows a transmitted light microphotograph of fluid inclusions from a representative quartz sample from Tiefengletscher, indicating the size range of the inclusions that were measured previously and in the current study.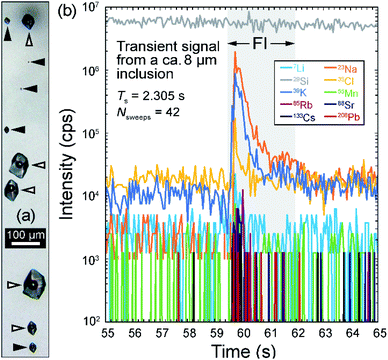 | ||
| Fig. 2 (a) Microphotograph showing representative aqueous, liquid (L) + vapor (V) inclusions in quartz sample KMP-1; empty arrows show the typical size of inclusions previously analyzed by LA-ICP-MS (≥20 µm);18 filled arrows show the typical size of inclusions targeted here (≤30 µm, down to 4 µm). (b) Transient time-resolved LA-ICP-MS signals from a fluid inclusion ca. 8 µm in diameter in sample KMP-1, showing intensities for 10 out of 52 measured elements; Ts corresponds to the total transient signal duration. | ||
Fig. 2b shows the time-resolved transient signal obtained from an 8 µm inclusion. The total duration of the inclusion signal was about 2.3 seconds, yet this signal is recorded with a maximum of 42 sweeps for major elements (Na, K, Cl) and about 10 even for the least concentrated elements (e.g. Rb, Sr, Cs, Pb). By comparison, using the element setup applied during earlier analyses,18 the same inclusions would have been recorded with <10 sweeps, despite a much shorter analyte list (i.e. 14 elements vs. 52 here).
With the short settling time, inclusions down to 9 µm in size yielded data for 13 different elements, and some as small as 4 µm yielded detectable signals for 6 elements (Fig. 3). The average concentrations are identical to those obtained earlier based on larger inclusions and the relative standard deviations (RSDs) are comparable or even smaller (10–40%; Fig. 3). Low-concentration elements (<10 µg g−1) such as W and Tl, which were not quantified using longer settling and dwell times, were detected here with reasonable RSD (ca. 40%) (Fig. 3). Elemental concentrations show no clear trend against inclusion size (Fig. 3) that would be indicative of a systematic bias due to the non-representative recording of very short signals resulting from the ablation of small inclusions.
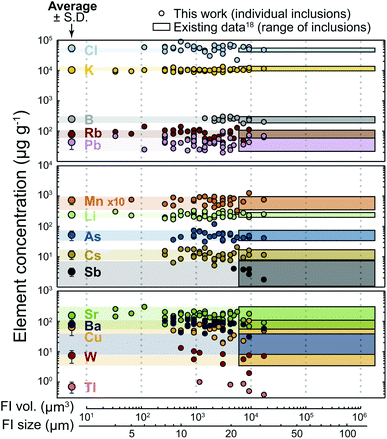 | ||
| Fig. 3 Concentrations obtained for 15 elements in fluid inclusions from sample KMP-1, as a function of fluid inclusion (FI) volume (vol.) and size. The dots correspond to analyses obtained here, and the coloured boxes depict the size and compositional range of inclusions analysed in a previous study using a conventional quadrupole.18 Larger dots with error bars correspond to the average ± standard deviation of analyses obtained in this study. | ||
Besides accuracy and reproducibility, the limit of detection (LOD) is another important figure of merit. At given background and sample signal durations and intensities, as well as analyte sensitivity, the LOD is roughly inversely proportional to the dwell time,10 such that using shorter dwell times may at first glance entail higher LODs. However, if the temporal resolution of the analysis is increased proportionally, the probability of analyte detection over a certain sample signal duration, hence the LOD, remains the same (see eqn (6) in ref. 10 and related discussion). In the case of a fast-scanning quadrupole, the short settling times allow to reduce in concert the dwell and sweep times (see section “Specificities of a fast scanning quadrupole and benefits to analyse transient signals”). Therefore, the fast-scanning operation should have theoretically no impact on the LODs.
The case of Au in sample KMP-1 provides a useful illustration, as Au concentration in the corresponding fluid inclusions is very low (0.011 ± 0.004 µg g−1; ref. 18). The LODs for Au obtained here range from 0.1 to 29 ppm (median = 2.4 ppm; Fig. 4), which is on average higher than in the previous study using a conventional quadrupole (ca. 0.001–2 ppm; ref. 18). However, this only reflects the fact that we specifically targeted smaller inclusions (<30 µm) than in the previous study, as is clear from the negative correlation between Au LOD and inclusion size (Fig. 4). In fact, when normalised to the finite mass of fluid represented by each inclusion, the LODs for Au are in the same range (1–15 fg) as obtained previously on sample KMP-1 (ref. 18) and lower than those from inclusions of the same type measured with a slower scanning ICP-Q-MS12 (Fig. 4). Note in addition that in contrast to our setup, these previous studies applied a specific strategy to lower the LOD for Au, notably the use of a long dwell time for Au (80 ms) and a short element menu.12,18 Therefore, the LODs obtained here can be considered better than using a conventional quadrupole, and are even approaching those obtained employing a high-sensitivity, sector-field ICP-MS12 (Fig. 4).
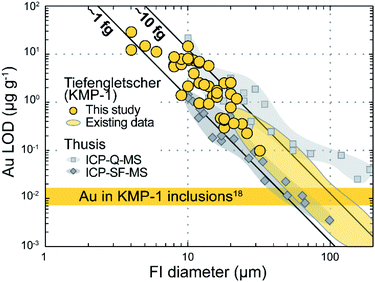 | ||
| Fig. 4 Limits of detection (LOD) for Au as a function of approximate fluid inclusion (FI) diameter in sample KMP-1, compared to existing data on the same fluid inclusion assemblage18 and from inclusions of similar type in the same context (aqueous fluids with ca. 4 wt% NaCl in quartz from an Alpine fissure vein near Thusis, Switzerland) measured with two different ICP-MS systems.12 The solid black lines indicate absolute Au LODs of ca. 1 and 10 fg. | ||
These results show the short settling time capability used here allows the determination of fluid inclusion compositions from fluid volumes 1 to 3 orders of magnitude smaller than with other quadrupole instruments, with comparable or even better accuracy, reproducibility (Fig. 3) and LODs (Fig. 4).
Analysis of complex, polyphase brine inclusions
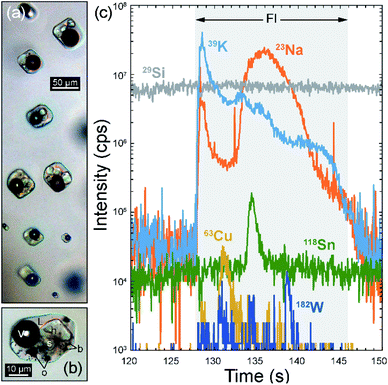
Sample Loww9 is from a quartz-wolframite vein of the Mole Granite (Australia) and contains brine inclusions (ca. 48 wt% NaCleq.)19 ranging in size from 10 to 200 µm (Fig. 5a). These are polyphase inclusions, systematically containing similar proportions of an aqueous solution, a vapor bubble and several solids. These are both large (5–50 µm) salt crystals (Na-, K- and Fe-chloride) and smaller birefringent and/or opaque minerals of uncertain nature19 and generally very small size (<5 and down to ca. 0.1 µm) (Fig. 5b). Such complex phase association and the range of crystal sizes challenge the accurate determination of the fluid chemistry, insofar it relies on a controlled, layer-by-layer ablation of the inclusion and representative recording of all its internal components.7,8,10,21Fig. 5c shows an example of time-resolved, transient signal from a 60 µm brine inclusion from the Mole Granite. The signal duration is ca. 20 seconds. The signal patterns for the different elements shows controlled ablation of all internal components: the initial peak followed by steady decrease in Na and K records the release of the aqueous fluid, while the bell-shaped Na signal reflects the ablation of the halite crystal. Importantly, some elements including the economic metals (Sn, W but also Cu) show intensities below the LOD for most of the ablation duration, with the notable exception of one or several very sharp peaks of short duration (<2 seconds; Fig. 5c). These correspond to the sampling of the small daughter crystals (likely cassiterite, wolframite/scheelite and chalcopyrite) and are a common feature of such polyphase inclusion ablation.10 With longer dwell and settling times, such sharp peaks would be much less accurately recorded or simply missed. Some of them are indeed <0.5 s long, approaching the sweep time used in earlier LA-ICP-MS analyses of these inclusions (ca. 0.4 s).1,19 Accordingly, Fig. 6a shows that the RSDs of the corresponding elements in the analysed inclusion population are improved when using the fast scanning quadrupole capability (Cu = 28%; Sn = 18%; Sb = 14%; W = 16%) compared to earlier analyses (Cu = 70%; Sn = 33%; Sb = 25%; W = 22%; ref. 19).
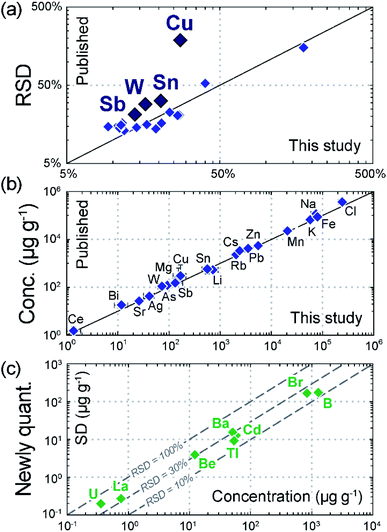 | ||
| Fig. 6 Quantitative results from the analysis of brine inclusions in sample Loww9. (a) Comparison of the relative standard deviation (RSD) of element concentrations in fluid inclusions analysed in this study compared with published data;19 note the improvement for Cu, Sn, Sb and W due to more representative recording of very short signals resulting from the ablation of tiny, metal-rich daughter phases. (b) Comparison of average element concentrations (conc.) obtained in the fluid inclusions analysed in this study compared with published data.19 (c) Plot of standard deviation (SD) vs. average concentration for 8 elements newly quantified (quant.) in this study, which were not included in the element list in previous work owing to scanning time constraints. | ||
The concentrations obtained for all elements show good agreement with those obtained from previous measurements within uncertainties (Fig. 6b). Moreover, Fig. 6c shows that the longer element list permitted by the fast-scanning capability resulted in the quantification of 8 additional elements across the mass spectrum (Be, B, Br, Cd, Ba, La, Tl, U) compared to earlier analyses. This notably included two elements at sub-ppm levels that are not routinely measured in fluid inclusions (La = 0.72 ± 0.21 µg g−1; U = 0.32 ± 0.14 µg g−1). This result highlights that short settling times enable a more complete chemical characterization of the paleo-fluids.
Summary and conclusions
This work has demonstrated that short quadrupole settling times are beneficial for the analysis of short transient signals, such as those resulting from the LA-ICP-MS analysis of fluid inclusions. This faster analysis time improves the trace element quantification of fluid inclusions in three complementary ways.(1) This allows the analysis of smaller inclusions than usually targeted (<30 µm and down to 4 µm as tested here), without sacrificing data quality (accuracy, reproducibility and LODs are comparable with or better than using a slower-scanning quadrupole). This widens the spectrum of possible application of fluid inclusion analyses by LA-ICP-MS as such small inclusions are more the rule than the exception in natural samples.
(2) Regardless of inclusion size, faster cycling permits the use of more elements (e.g. 52 elements cycled in 52 ms at a duty cycle of 80% for the tests presented here) than before (maximum 15–20 elements at comparable duty cycles). This capability releases the usual need for a compromise between complete characterization of the fluid and accurate determination of some key elements of interest.10
(3) A reduced settling time also helps to representatively record analyte signals resulting from small crystals enclosed in a complex, polyphase fluid inclusion, thereby allowing to determinate more precisely and accurately their average concentration in a population of co-genetic inclusions.
Taken together, a fast-scanning quadrupole ICP-MS instrument allows for more accurate and representative data to be acquired when performing LA-ICP-MS analyses of fluid inclusions. Examples of recent applications using this technique can be found in the literature.30–32 Importantly, the same benefits would be relevant to other applications demanding short, transient signals, such as high-resolution LA-ICP-MS element mapping using the next generation of low dispersion ablation cells.33
Author contributions
Oscar Laurent: methodology, investigation, data curation, formal analysis, validation, visualisation, writing – original draft, writing – review & editing; Marcel Guillong: conceptualization, methodology, software, validation, writing – review & editing; Christoph A. Heinrich: conceptualization, funding acquisition, project administration, writing – review & editing; Kenneth Neubauer: resources, writing – original draft, writing – review & editing; Chady Stephan: resources, writing – review & editing.Conflicts of interest
There are no conflicts to declare.Acknowledgements
We thank P. Weigel from PerkinElmer Switzerland for discussions and assistance and two anonymous reviewers for their relevant and constructive comments.References
- A. Audétat, D. Günther and C. A. Heinrich, Science, 1998, 279, 2091–2094 CrossRef PubMed.
- T. Ulrich, D. Günther and C. A. Heinrich, Nature, 1999, 399, 676–679 CrossRef CAS.
- S. F. Simmons and K. L. Brown, Science, 2006, 314, 288–291 CrossRef CAS PubMed.
- J. J. Wilkinson, B. Stoffell, C. C. Wilkinson, T. E. Jeffries and M. S. Appold, Science, 2009, 323, 764–767 CrossRef CAS.
- A. H. Rankin, M. H. Ramsey, B. Coles, F. Vanlangevelde and C. R. Thomas, Geochim. Cosmochim. Acta, 1992, 56, 67–79 CrossRef CAS.
- T. J. Shepherd and S. R. Chenery, Geochim. Cosmochim. Acta, 1995, 59, 3997–4007 CrossRef CAS.
- D. Günther, A. Audétat, R. Frischknecht and C. A. Heinrich, J. Anal. At. Spectrom., 1998, 13, 263–270 RSC.
- C. A. Henrich, T. Pettke, W. E. Halter, M. Aigner-Torres, A. Audétat, D. Günther, B. Hattendorf, D. Bleiner, M. Guillong and I. Horn, Geochim. Cosmochim. Acta, 2003, 67(18), 3473–3497 CrossRef.
- M. M. Allan, B. W. D. Yardley, L. J. Forbes, K. I. Shmulovich, B. A. Banks and T. J. Shepherd, Am. Mineral., 2005, 90(1–2), 1767–1775 CrossRef CAS.
- T. Pettke, F. Oberli, A. Audétat, M. Guillong, A. C. Simon, J. J. Hanley and L. M. Klemm, Ore Geol. Rev., 2012, 44, 10–38 CrossRef.
- T. Pettke, C. A. Heinrich, A. C. Ciocan and D. Günther, J. Anal. At. Spectrom., 2000, 15, 1149–1155 RSC.
- M. Wälle and C. A. Heinrich, J. Anal. At. Spectrom., 2014, 29, 1052–1057 RSC.
- E. Roedder, Rev. Mineral., 1984, 12, 644 Search PubMed.
- T. Pettke, Short Course Ser.–Mineral. Assoc. Can., 2008, 40, 189–218 CAS.
- M. Tanner and D. Günther, Anal. Chim. Acta, 2009, 633(1), 19–28 CrossRef CAS PubMed.
- M. Burger, G. Schwarz, A. Gundlach-Graham, D. Käser, B. Hattendorf and D. Günther, J. Anal. At. Spectrom., 2017, 32, 1946–1959 RSC.
- Advantages of Short Settling Times for Quadrupole Based ICP-MS Laser Ablation Imaging, Technical Note, PerkinElmer, 2020 Search PubMed.
- K. Rauchenstein-Martinek, T. Wagner, M. Wälle and C. A. Heinrich, Chem. Geol., 2014, 385, 70–83 CrossRef CAS.
- A. Audétat, D. Günther and C. A. Heinrich, Econ. Geol., 2000, 95(8), 1563–1581 CrossRef.
- A. Audétat, D. Günther and C. A. Heinrich, Geochim. Cosmochim. Acta, 2000, 64(19), 3373–3393 CrossRef.
- D. Günther and C. A. Heinrich, J. Anal. At. Spectrom., 1999, 14, 1369–1374 RSC.
- K. Schlöglova, M. Wälle and C. A. Heinrich, J. Anal. At. Spectrom., 2017, 32, 1052–1063 RSC.
- M. Guillong and C. A. Heinrich, 19th Biennial Conference “European Current Research on Fluid Inclusions, ECROFI-XIX”, Bern, 2007, p. 82 Search PubMed.
- D. Günther and C. A. Heinrich, J. Anal. At. Spectrom., 1999, 14, 1363–1368 RSC.
- S. M. Eggins, L. P. J. Kinsley and J. M. G. Shelley, Appl. Surf. Sci., 1998, 129, 278–286 CrossRef.
- H. P. Longerich, S. E. Jackson and D. Günther, J. Anal. At. Spectrom., 1996, 11, 899–904 RSC.
- K. P. Jochum, et al. , Geostand. Geoanal. Res., 2011, 35(4), 397–429 CrossRef CAS.
- J. H. Seo, M. Guillong, M. Aerts, Z. Zajacz and C. A. Heinrich, Chem. Geol., 2011, 284, 35–44 CAS.
- M. Guillong, D. L. Meier, M. M. Allan, C. A. Heinrich and B. W. D. Yardley, Short Course Ser.–Mineral. Assoc. Can., 2008, 40, 328–333 CAS.
- M. Korges, P. Weis, V. Lüders and O. Laurent, Miner. Deposita, 2020, 55, 937–952 CrossRef CAS.
- H. Legros, P. Lecumberri-Sanchez, V. Elongo, O. Laurent, H. Falck, E. Adlakha and C. Chelle-Michou, Ore Geol. Rev., 2020, 127, 103866 CrossRef.
- B. Walter, J. L. Jensen, P. Coutinho, O. Laurent, G. Markl and M. Steele-McInnis, J. Geochem. Explor., 2020, 212, 10651 CrossRef.
- A. Gundlach-Graham and D. Günther, Anal. Bioanal. Chem., 2016, 408, 2687–2695 CrossRef CAS PubMed.
Footnotes |
| † Electronic supplementary information (ESI) available: Full dataset of fluid inclusion analyses. See DOI: 10.1039/d1ja00193k |
| ‡ Present address: CNRS, Géosciences Environnement Toulouse, Observatoire Midi-Pyrénées, Toulouse, France. |
| This journal is © The Royal Society of Chemistry 2021 |

