 Open Access Article
Creative Commons Attribution 3.0 Unported Licence
Greener production of dimethyl carbonate by the Power-to-Fuel concept: a comparative techno-economic analysis†
Hong
Huang
 *a,
Remzi Can
Samsun
a,
Ralf
Peters
 a and
Detlef
Stolten
bcd
aElectrochemical Process Engineering (IEK-14), Forschungszentrum Jülich GmbH, 52425, Jülich, Germany. E-mail: h.huang@fz-juelich.de; Tel: +49 2461 61-85193; Fax: +49 2461 61-6695
bTechno-Economic Systems Analysis (IEK-3), Forschungszentrum Jülich GmbH, 52425, Jülich, Germany
cJARA-ENERGY, 52056 Aachen, Germany
dChair for Fuel Cells, RWTH Aachen University, 52072, Aachen, Germany
First published on 25th January 2021
Abstract
Power-to-Fuel is an emerging concept that uses surplus electricity-powered H2 and CO2 to produce future fuels. Previously studied fuel candidates include methanol, Fischer–Tropsch, and ethers. Apart from these candidates, dimethyl carbonate (DMC) is increasingly recognized as a viable fuel. Various new production pathways are being actively developed encouraged by its wider range of applications. In this study, we first performed a preliminary screening of available pathways with respect to their levels of technical maturity and their compliance with green chemistry principles. The selected pathways are oxidative carbonylation of methanol, direct urea methanolysis as well as indirect urea methanolysis via ethylene carbonate and propylene carbonate routes. We designed the processes and simulated the material and energy balances in the context of the Power-to-Fuel concept. Subsequently, a techno-economic analysis was performed to assess their viability. From the analysis, we found that the process steps of methanol and urea syntheses are the major capital investment contributors, rather than the DMC synthesis step itself. The direct urea methanolysis exhibits the highest energy efficiency of 48.5% and the lowest cost of manufacturing (COM) of 2.19 € per lDE. The oxidative carbonylation of methanol is featured with the lowest capital expenditure (CAPEX) and utility consumption. Both the indirect urea methanolysis pathways have better conversions than the direct urea methanolysis, but their advantages can only be seen provided that the utility consumption is minimised. Under current market conditions, only the direct urea methanolysis pathway is slightly profitable by the net present value (NPV) and minimum selling price (MSP). The hydrogen price is found to be the dominant economic driver of all pathways, with the oxidative carbonylation of methanol in particular.
1. Introduction
The 2015 Paris Climate Agreement reaffirmed the target of limiting temperature increases caused by anthropogenic CO2 emissions to below 2 °C.1 In line with the Agreement's framework, Germany, as an industrial nation, also set its own target for reducing greenhouse gases (GHGs) in all sectors by 95% by 2050 compared to the baseline year of 1990.2 According to the statistics, around 80% of German CO2 emissions are caused by the use of fossil fuels in the power generation, heating and transportation sectors.3 In 2018, emissions in the transportation sector amounted to 162 million tons, the third-largest source (18.7%) of the country's CO2 emissions.4 To reduce these emissions, Germany is pioneering the use of renewable energy in its energy system. In 2018, the supply of Germany's renewable energy output contributed 16.6% of its national final energy consumption and this is projected to rise to 30% and above by 2030.4Due to the intermittent nature of renewable energy, however, its high penetration of renewable energy leads to times when the power supply exceeds the demand, resulting in so-called surplus power. One emerging storage option is the conversion of such surplus power into hydrogen by water electrolysis, which can then be used as a feedstock, along with CO2, to produce different products for future use, known as the Power-to-X concept. If these products are liquid fuels, then it is referred to as the Power-to-Fuel concept. Here, the CO2 input comes from various sources such as power plants, the cement industry, or even from the ambient air.5 In this way, the Power-to-Fuel concept simultaneously achieves the targets of GHG reduction and the supplying of transport fuels (also known as electrofuels). In accordance with the Power-to-Fuel concept having been established, different processes are being actively developed that have led to various electrofuels such as methanol and higher alcohols,6–8 Fischer–Tropsch,9,10 and ethers.11–13 The technical and economic feasibility has been proven by the scientific community and industrial practices, one example being the methanol plant deployed by the Carbon Recycling International (CRI) in Iceland.14
In addition to the above-mentioned electrofuels, esters are attracting ever more attention as a new category thereof. Among the available esters, dimethyl carbonate is a representative. In fact, it is not a new substance and has long been recognized as a versatile chemical. Its applications span a wide range, from solvents, to methylation reagents, to lithium-ion battery electrolytes.15 In contrast, its prospective new role as a fuel has not long been known. In addition to its high oxygen content (53.3%) and octane number (116),16 DMC is also welcomed as a green substance because of its low toxicity and biodegradability. These advantages make it distinct compared to methyl tert-butyl ether (MTBE). Relevant combustion emission experiments have also confirmed that DMC can effectively reduce particle matter (PM), total hydrocarbons (THC) and soot emissions.17,18
As its potential new role of applications has been seen, the development of production pathways has also begun. Over the past few decades, different DMC production processes have been developed. Before 1980, DMC was produced by means of phosgenation of methanol, but this process was gradually abandoned because it entailed the use of highly toxic substances.19 In 1980s, the Italian company ENIChem developed a process of oxidative carbonylation of methanol and industrialized it.20 In this process, the synthesis reaction is catalyzed by CuCl with feedstocks of methanol and carbon monoxide with the addition of oxygen. It is usually admitted that the oxidative carbonylation of methanol follows a two-step oxydo-reduction mechanism, through a Cu(OCH3)Cl intermediate. The first step involves the oxidation of CuCl by O2 into Cu(OCH3)Cl. In the second step, Cu(OCH3)Cl is reduced by CO, thus allowing CuCl to be regenerated.21 The overall reaction is shown in eqn (1):
 | (1) |
The reaction takes place in the slurry phase, which makes the catalyst and product separation processes difficult and energy intensive. Additionally, HCl formed by side reactions is highly corrosive to equipment. Another potential safety problem relating to this process is the risk of explosion due to the presence of oxygen. To solve the problem of separation, the Dow Chemical Company patented the process of vapor-phase oxidative carbonylation of methanol, but the safety issue of potential explosion still exists. Although the vapor-phase carbonylation is a very promising process, to date, the stability and lifetime of catalysts have not met the requirements of industrialization.22 Later, the Japanese company UBE Industries invented and implemented a two-step carbonylation process on an industrial scale.19 The first step is the methyl nitrite (MN) synthesis and the second the conversion of MN into DMC (eqn (2) and (3)), whereas the intermediate MN circulates between the two steps.19 The first step can happen without catalysts in the liquid phase, but the water formed has to be removed in order to create an anhydrous environment for the DMC synthesis. The second step can be catalyzed by PdCl2 or CuCl2–PdCl2 bimetallic catalysts.22 The separation of catalysts is avoided, but the potential for explosion of NO/O2 is induced; moreover, the use of the highly toxic reagent NOx makes this process fairly unpopular.
| 2NO + 0.5O2 + 2CH3OH → 2 CH3NO3 (MN) + H2O | (2) |
 | (3) |
In the early 1990s, the Texaco Corporation developed and industrialized the transesterification process,22 which uses methanol and ethylene carbonate (EC) to produce DMC, with equimolar ethylene glycol (EG) as the side product, as shown in eqn (4). In this process, EG is also a very useful chemical that may improve its economic performance. In this respect, this process can be regarded as atom-economic. The educt EC can be easily produced by ethylene oxide (EO) and CO2. Apart from EC, propylene carbonate (PC) can also be used for the transesterification reaction (eqn (5)), in a process that is very similar to the transesterification process via the EC route. There are different types of catalysts for the transesterification reactions of EC and PC (also referred to as carbonate interchange reactions). For the EC transesterification reaction, ionic liquid catalysts appeal to be good choices because of their high activity.23,24 For the PC transesterification reaction, the common industrial catalyst is CH3ONa.25 As EO and propylene oxide (PO) are downstream products of ethylene and propylene, their production costs are affected directly by ethylene and propylene prices.
 | (4) |
 | (5) |
In recent years, urea-based DMC processes have been gaining momentum on the basis of the following advantages: (1) as no toxic substances are involved in this process, it is favored as a pathway toward its greener production and (2) it has moderate reaction conditions and no safety problems. These merits give this pathway a strong competitive advantage against early developed processes. In early years, urea and methanol were used directly as feedstocks to synthesize DMC, namely, direct urea methanolysis process. Sun et al.26–28 performed extensive work into the reaction mechanisms involved in the direct synthesis reaction. They prepared and tested different kinds of solid base catalysts including CaO, MgO and ZrO2 catalysts. The activity of solid catalysts followed this order: CaO > MgO > ZrO2. They also prepared and tested ZnO catalysts and the DMC yield was around 30%. They found that urea methanolysis is a two-step reaction, the first of which is the generation of methyl carbamate (MC) from urea and methanol, which is fast with high yields. The MC continues reacting with methanol to form DMC, and this is the rate-limiting step. The main drawback of this process is that highly excessive methanol is necessary to guarantee a satisfactory yield.
 | (6) |
 | (7) |
Inspired by the transesterification processes via EC and PC, it is possible to split the direct urea methanolysis reaction into two steps. The key step is realizing the reaction of urea and EG/PG to EC/PC, as shown in eqn (8)–(11). Previous studies reported the achievement of very high (97–100%) conversions.29 Here EC/PC can be synthesized through cycloaddition reactions over metal oxides. Among the studied catalysts, ZnO and ZnO-Cr2O3 were found to have high activity.30,31 The second step involves mature transesterification reactions. By converting EG/PG back to EC/PC, the reaction loop is closed and side products are eliminated. This process is called indirect urea methanolysis and in fact combines the advantages of direct urea and transesterification processes. China is advancing this process, stimulated by the increasing market demand. In 2014, the Chinese Academy of Science (CAS) built a 1000 t per a pilot plant based on the indirect urea methanolysis process via the PC route.32
Indirect urea methanolysis via EC:
 | (8) |
 | (9) |
Indirect urea methanolysis via PC:
 | (10) |
 | (11) |
Other possible processes for R&D include a direct synthesis from CO2 and methanol by means of catalysis and electrochemical reduction. Although this is the shortest process, it requires high pressure and excessive methanol use, the conversion is very low and the developments remain in their infancy.
A variety of techno-economic analyses have been published. Souza et al.33 compared two process alternatives of transesterification processes via the EC route from technical, economic and environmental aspects. It was found that energy consumption can be lowered by heat integration. The net present value (NPV) and payback period calculations show that this process was economically viable. Qiu et al.34 designed a novel process for the PC transesterification route by employing reactive distillation and also calculated the total annual cost. Holtbruegge et al.35–39 performed a series of experimental and simulation works for industrial-scale DMC production via the PC transesterification route and proposed various process intensification schemes considering reactive distillation, pressure-swing distillation, membrane technology and their combinations. These schemes were also economically optimised. Martín et al.40 analysed the economic performance and CO2 emissions for the direct urea methanolysis process using the starting materials of ammonia and methanol. The breakdown of the capital cost for each production step was discussed in detail. Huang et al.41 published the first work for designing indirect urea methanolysis via PC and calculated the total annual cost. More recently, Kiss et al.42 have designed a similar process and performed a dynamic analysis by means of process control and techno-economic analysis. Both publications designed their processes using methanol and urea as the starting materials, but a techno-economic analysis for indirect urea methanolysis via EC has not yet been reported in the literature. Some studies have also been conducted for comparison purposes. Kongpanna et al.43 for instance, conducted a preliminary screening among four processes by means of a thermodynamic analysis. They selected the urea and EC routes for their high yields. Further analysis compared the carbon atomic efficiency and specific energy consumption, and the transesterification via the EC route was also recommended as an atomic and energy efficient process for DMC production.
Based on the above discussion, it is found that an inconsistency in previous techno-economic analyses arises from different starting materials, assumptions, and boundary conditions. Their performance cannot be readily compared. As various DMC processes are under different development stages, their technical maturities are different for each process, which is a consideration still missing from the previous studies. To this end, we performed here a holistic screening of DMC production processes focused on the greener production. The process screening acted as a preliminary step for subsequent process design and techno-economic analysis and comparison. We employed the green chemistry principles and technology readiness levels (TRLs) to carry out this screening. The selected DMC production processes were designed using CO2 and H2 as the starting materials within the Power-to-Fuel concept. Our process designs aim to provide a practice of combining green chemistry principles with a focus on sound technical maturities. With this aim, we analysed the possibility of producing a green product through green processes that are also technically realistic, energy efficient and economically viable. This study is an extension of the Power-to-Fuel family to esters in addition to alcohols, hydrocarbons and ethers. To the best of our knowledge, this is the first study that incorporates the holistic screening and analysis of DMC production processes into the Power-to-Fuel concept.
2. Process screening
In this part, we assess the available pathways from different perspectives. In contrast to the other screening studies, we first adopt the technology readiness level to estimate the technical maturity for the candidate processes. This method was first developed by the United States Department of Defense and ranges from levels 1 to 9.44 The European Commission adopted this framework for renewable energy technologies.45 Herein, for DMC processes, the level 1 indicates that only the reaction mechanism has been clarified. Level 9 means the process is ready for commercialisation. If a process has been practiced in industries, then it is defined as being state-of-the-art (SoA). In accordance with the consensus on sustainable production, another screening criterion is the consideration of the twelve “green chemistry principles” proposed by Anastas.46For the sake of simplicity, we first classify the processes into three categories: the oxidative carbonylation of methanol, urea-based synthesis and direct synthesis from CO2. Overall, the guiding principle is “design safer chemicals” that starts with renewable carbon and hydrogen sources and ends with a green chemical of DMC. As the transesterification processes via EC or PC can be part of the indirect urea methanolysis, we do not consider them as independent processes. Another reason of not selecting the transesterification processes is that they do not obey the principle of “atom economy”, as equimolar side products of EG or PG are produced. The TRLs and their compliance with principles of green chemistry for each process are listed in Table 1. At present, only the liquid oxidative carbonylation and the two-step carbonylation processes have been industrialized, and so their TRLs are SoA, but the two-step process utilises the toxic reagent NOx, which is a violation of the principle of “safer solvents and auxiliaries”. As such, this process is not selected. All urea-based processes are well-developed and are in good accordance with the green chemistry principles, with intensive research activities having brought their TRLs to around 7–8, with indirect urea methanolysis via PC being the highest, as demonstrated by the CAS.32 Direct synthesis from CO2 and methanol has very low TRL of 3, and so they are excluded from this work. It should be noted that Table 1 is a preliminary screening that only excludes the processes that violate the “green chemistry principles”. In later analysis, we will employ quantified indicators from energy and economic perspectives to evaluate if a process candidate can meet more principles such as “design for energy efficiency”.
| Category | Process | TRL | Comply with green chemistry principles? | Selection? |
|---|---|---|---|---|
| Oxidative carbonylation of methanol | Liquid phase | SoA | Yes | Yes |
| Gas phase | 5 | Yes | Yes | |
| Two-step via MN | SoA | No | No | |
| Urea-based | Direct urea methanolysis | 7 | Yes | Yes |
| Indirect urea methanolysis via EC | 7 | Yes | Yes | |
| Indirect urea methanolysis via PC | 8 | Yes | Yes | |
| Direct synthesis | Direct CO2 and methanol | 3 | Yes | No |
3. Process modelling
This part describes the process flowsheets, simulation models and techniques. As there are some common sections shared by different processes like methanol synthesis (MS) and urea synthesis, for the sake of brevity, these are described once. It should also be noted that CO2 coming from industrial sources usually contains a certain amount of impurities including H2S and COS. These impurities can be removed by solvent absorption such as monoethanolamine (MEA) or methyl diethanolamine (MDEA) because H2S and COS have stronger acidity than that of CO2. This process has been studied extensively in the literature.47,48 A typical process comprises two steps: the first step is H2S and COS removal and the second step is CO2 capture. The starting point of our process design is after CO2 is captured and cleaned by upstream plants.3.1 Oxidative carbonylation of methanol
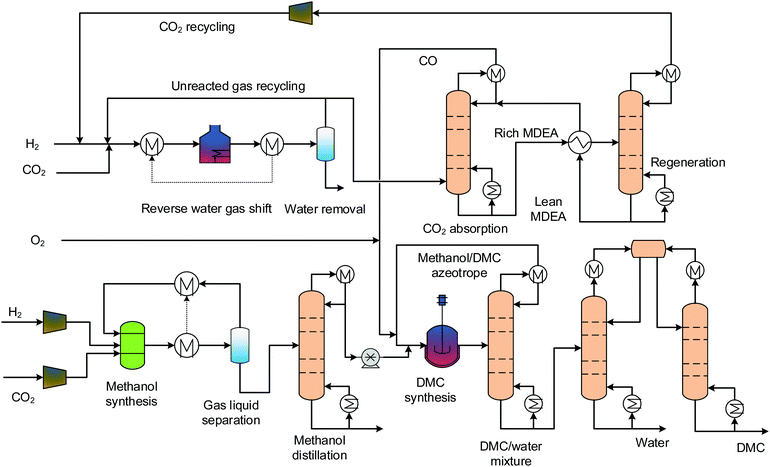
The only difference between the gas and the liquid phase oxidative carbonylation of methanol process is the reaction phases. We do not distinguish between these in the following analysis, and so their flowsheet designs are merged. Fig. 2 shows the process flowsheet. This process comprises four sections: MS, reverse water gas shift (RWGS), DMC synthesis and separation. The MS and RWGS sections provide methanol and CO for DMC synthesis. MS is the front end segment of all of the processes. In this section, H2 and CO2 are fed into a reactor after being compressed to 80 bars. For MS, conventional catalysts are generally Cu-based, because not only are Cu-based catalysts suitable for syngas-based MS,49 but they also show good activity and selectivity for CO2-based MS.50 Here, we adopted a Cu/ZnO/Al2O3 catalyst for the reaction:CO hydrogenation:
| CO + 2H2 → CH3OH | (12) |
CO2 hydrogenation:
| CO2 + 3H2 → CH3OH + H2O | (13) |
Reverse water gas shift:
| CO2 + H2 → CO + H2O | (14) |
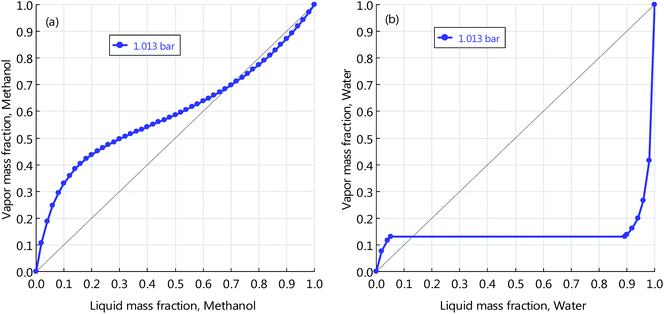
The reactor is operated adiabatically, with the temperature increasing along the reactor axis. A portion of the heat released by the reaction is for heating the reactor inlet stream by a gas-gas heat exchanger and the remaining portion is recovered for low-pressure (LP) steam (125 °C, 2.3 bars) generation. The stream leaving the reactor is first flashed and the vapour phase goes back to mix with the fresh educts. The liquid phase is pumped to the distillation section, where high-purity methanol is obtained for downstream use. The RWGS transforms CO2 and H2 into CO and H2O. The catalyst used here is Ni-Al2O3, as it was proven stable at high temperatures (>1000 °C) for long term.51 This reaction has thermodynamic limitations, to achieve high conversion and suppress CO/CO2 methanation reactions, the operating temperature is as high as 900 °C. The high temperature heat demand is supplied by electrical heating.52 Although the pressure does not change the reaction equilibrium, elevated pressure is preferred in order to achieve fast kinetics and therefore to increase the space time yield (STY). Here, the pressure is fixed to 30 bars. The unconverted CO2 is scrubbed by the MDEA solution and is sent back for full conversion. Methanol and carbon monoxide, alongside oxygen, are fed into the DMC synthesis reactor, where the carbonylation reaction takes place. The mixture emanating from the reactor contains DMC, water and unconverted methanol. The ternary mixture forms two azeotropes: DMC-methanol homogeneous azeotrope and heterogeneous azeotrope. Their y–x phase diagrams are displayed in Fig. 1. From the figure we can read the azeotropic composition of each binary mixture. For DMC and methanol, the composition is 70 wt% methanol and 30 wt% DMC. For DMC and water, the composition is 13 wt% water and 87 wt% DMC. The separation process of the ternary mixture is complex. Here, we designed a separation process using three columns, which is shown in the lower right part of Fig. 2. The mixture from the reactor outlet is first pre-separated by a column, and the purpose of this step is to remove and recover methanol from the mixture on top of the column. The bottom stream only contains DMC and water. The binary mixture can be separated through a typical process using two columns and a decanter. The pure water is discharged at the bottom of the left column and high-purity DMC is obtained at the bottom of the right column.
The process simulation software Aspen Plus® is used for the process simulation. The property method for MS and RWGS is SRK and is recommended for hydrocarbon processing applications. The UNIQ-RK is adopted for DMC synthesis and separation considering the non-ideal behaviours of the components.53 The MS and RWGS reactions are close to chemical equilibrium, and therefore, the RGibbs reactor model is chosen. The reactor model for the DMC synthesis is RStoic, and its single pass conversion is 70%.43 All of the separations are modelled using the rigorous distillation model RadFrac. The properties of the pure substances and mixtures are extracted from databases.
3.2 Direct urea methanolysis
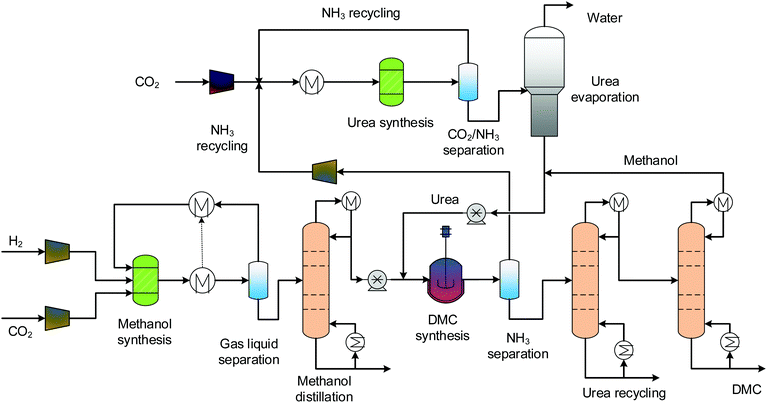
The process flowsheet for direct urea methanolysis is shown in Fig. 3. This process also consists of four sections: MS, urea synthesis, DMC synthesis and separation. Industrial urea production includes synthesis, evaporation and granulation sections, and here, the granulation process is not necessary. Urea synthesis is generally conducted at pressures higher than 100 bars, using a multi-stage compressor to bring the pressure to 138 bars.54 The evaporation process is abstracted as a distillation column. To avoid urea decomposition, the distillation takes place at a reduced pressure of 0.2 bar.54 The predictive property method SR-POLAR is suitable for such reacting systems that feature strong intermolecular forces.54 Urea is then sent to the DMC synthesis reactor, together with methanol. The pressure of the reactor is 12 bars and the temperature is 160 °C.27 The ammonia exiting the DMC synthesis section is circulated between the two sections for reuse. As no water is formed for the urea methanolysis, the separation is relatively easier, one distillation column is enough for separating products, the distillate is cycled and the bottom stream is high-purity DMC.3.3 Indirect urea methanolysis via EC and PC
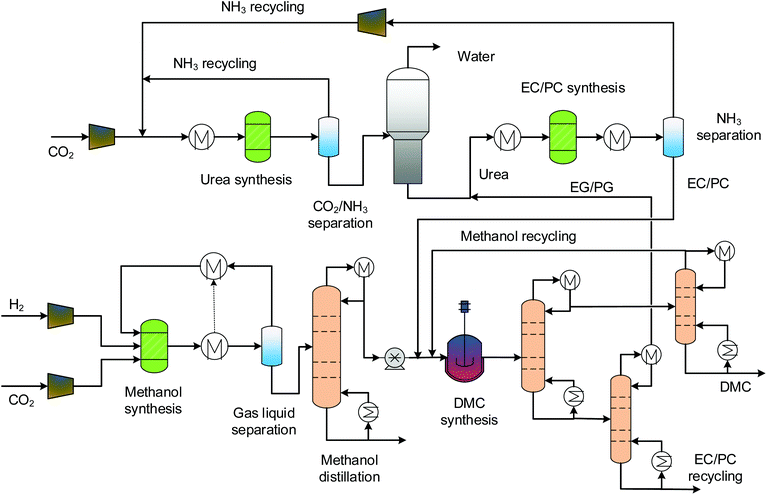
The process designs of indirect urea methanolysis via ethylene carbonate (EC) and propylene carbonate (PC) are quite similar, and so they are described together, as shown in Fig. 4. Characteristic of the indirect methanolysis are two synthesis loops: a urea synthesis loop and an EC/PC synthesis loop. For both processes, urea does not directly react with methanol but with ethylene glycol (EG) and propylene glycol (PG), which are side products of the transesterification reactions. The EC/PC produced is then used for DMC synthesis. The production of EC/PC is modelled by the RStoic model with 100% and 97.8% conversions, respectively.29 The separation of products has three columns. The first serves as a clear cut of EG/EC (PG/PC) and DMC/methanol into binary mixtures. The other two are for fine separations of the above binary mixtures in order to obtain pure components. As the boiling points of EC/PC are high, a high-pressure (HP) steam (250 °C, 39.7 bars) is required.4. Methods and assumptions
This part introduces the indicators used for the evaluation of system performance from the perspectives of energy, cost and profitability. The assumptions underpinning the calculations are drawn from our previous works and other relevant studies, and they have as such been validated.4.1 Power-to-Fuel efficiency
Power-to-Fuel efficiency is a metric to evaluate the energy utilization level of the entire process according to the input-output balance. To define the Power-to-Fuel efficiency, the process boundaries should be clear in order to be able to audit each term of energy expenditure and income. Notwithstanding that our process designs do not include water electrolysis and CO2 capture, we still consider these aspects of energy consumption for the energy efficiency calculation, as expressed in eqn (15).10 The energy income term is the energy content in the DMC using the lower heating value (LHV), while the energy expenditure terms include water electrolysis, CO2 capture and process utilities. We assume that PEM, a relatively mature water electrolysis technology, is adopted, and that its efficiency is set to 70%,55 with the specific energy consumption for CO2 capture being assumed to be 1.2 MJ per kg-CO2.56Table 2 summarizes the other assumptions and operating conditions. | (15) |
| Parameter | Value | Ref. |
|---|---|---|
| CO2 feed conditions | 25 °C, 30 bar | 61 |
| H2 feed conditions | 25 °C, 30 bar | 55 |
| Efficiency of PEM electrolysis | 70% | 55 |
| Energy consumption of CO2 sequestration | 1.2 MJ per kg-CO2 | 56 |
| Methanol synthesis pressure | 80 bar | |
| Urea synthesis pressure | 138 bar | 54 |
| RWGS synthesis pressure and temperature | 30 bar, 900 °C | |
| DMC synthesis pressure, temperature, and conversion | ||
| Oxidative carbonylation of methanol | 20 bar, 150 °C, 70% | 43 |
| Direct urea methanolysis | 12 bar, 160 °C, 65% | 27 |
| Indirect urea methanolysis via EC | 10 bar, 160 °C, 79.2% | 43 |
| Indirect urea methanolysis via PC | 10 bar, 140 °C, 66.6% | 35 and 38 |
| H2 price | 4.6 € per kg | 62 |
| CO2 price | 70 € per t | 63 |
| O2 price | 80 € per t | 64 |
| DMC price | 1000 € per t | 65 |
| Cooling water price | 0.1 € per t | 52 |
| High-pressure steam (250 °C) | 0.0187 € per MJ | 52 |
| Medium-pressure steam (175 °C) | 0.0158 € per MJ | 52 |
| Low-pressure steam (125 °C) | 0.0146 € per MJ | 52 |
| Lifespan of the plants | 20 years | 66 |
| Plant construction periods | 2 years | 60 |
| Interest rate | 8% | 67 |
4.2 Cost of manufacturing
We perform the cost of manufacturing (COM) analysis via a breakdown approach. In general, COM has two parts: capital expenditure (CAPEX) and operational expenditure (OPEX). CAPEX is the summation of fixed capital investment (FCI) and working capital (WC), as shown in eqn (16).57 The FCI is primarily used for equipment purchasing and installation, the first term being the contingency and fee costs and the second the auxiliary facilities costs (eqn (17)), the calculations for which were explained by Turton et al.58 We do not go into details on this here. The WC is 15% of the CAPEX. FCI is dependent on the component sizes and operating conditions, which are acquired by way of process simulation. As the CAPEX is not linearly related to the production scale, the DMC production capacity is fixed to 300 MW. | (16) |
 | (17) |
The OPEX is used for various purposes such as feedstocks, administration fees and staff salary. Some of the fees are interrelated with a specific coefficient, for instance, taxes and insurance are 0.032 times the FCI. The depreciation fee is calculated by the FCI and interest rate. More details on the calculation methods have been reported elsewhere.57 By summing up each part, the COM expression is obtained:57
 | (18) |
For standardisation, we further calculate the diesel equivalent of COM, and the mass flowrate of DMC is converted into a diesel volumetric flowrate with an equivalent energy content, with an LHV of diesel of 35.9 MJ per lDE.52
4.3 NPV and MSP
Although the COM is determined, the marketplace competiveness of the DMC processes remains unknown. To address this, we carry out a profitability analysis using the net present value (NPV) and minimum selling price (MSP) as indicators.59 The purpose of this is to find out the breakeven points of these indicators. The NPV reflects the time value of money, whereas the MSP is the DMC selling price that leads to zero NPV. For both NPV and MSP calculations, the interest rate and project lifespan are two critical parameters, as formulated in eqn (19) and (20). The interest rate is 8% and the project lifespan is 22 years, within which the first two years devoted to plant construction.60 | (19) |
 | (20) |
5. Results and discussion
Based on the process simulations, the material and energy balances are achieved. The results are discussed in detail in this part.5.1 Base case
| Oxidative carbonylation | Direct urea methanolysis | Indirect urea methanolysis via EC | Indirect urea methanolysis via PC | |
|---|---|---|---|---|
| H2 consumption (kg h−1) | 11![[thin space (1/6-em)]](https://www.rsc.org/images/entities/char_2009.gif) 893.7 893.7 |
10![[thin space (1/6-em)]](https://www.rsc.org/images/entities/char_2009.gif) 281 281 |
10![[thin space (1/6-em)]](https://www.rsc.org/images/entities/char_2009.gif) 281 281 |
10![[thin space (1/6-em)]](https://www.rsc.org/images/entities/char_2009.gif) 281 281 |
| CO2 consumption (kg h−1) | 110![[thin space (1/6-em)]](https://www.rsc.org/images/entities/char_2009.gif) 025 025 |
110![[thin space (1/6-em)]](https://www.rsc.org/images/entities/char_2009.gif) 245 245 |
110![[thin space (1/6-em)]](https://www.rsc.org/images/entities/char_2009.gif) 245 245 |
110![[thin space (1/6-em)]](https://www.rsc.org/images/entities/char_2009.gif) 245 245 |
| DMC output (kg h−1) | 71![[thin space (1/6-em)]](https://www.rsc.org/images/entities/char_2009.gif) 188.3 188.3 |
71![[thin space (1/6-em)]](https://www.rsc.org/images/entities/char_2009.gif) 457.7 457.7 |
71![[thin space (1/6-em)]](https://www.rsc.org/images/entities/char_2009.gif) 227.5 227.5 |
69![[thin space (1/6-em)]](https://www.rsc.org/images/entities/char_2009.gif) 598.3 598.3 |
| DMC output (kg per lDE) | 2.28 | 2.28 | 2.28 | 2.28 |
| H2 consumption (kg per lDE) | 0.38 | 0.33 | 0.33 | 0.34 |
| CO2 consumption (kg per lDE) | 3.52 | 3.50 | 3.52 | 3.60 |
| Energy efficiency | 46.5% | 48.5% | 46.5% | 45.0% |
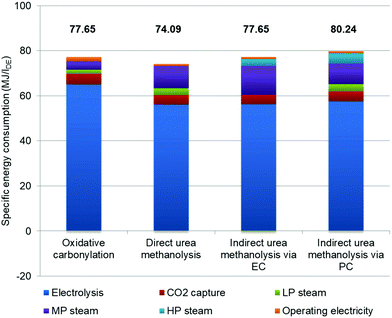
In order to analyse each contributing factor, we further quantify specific energy consumption (Fig. 5). To better follow the analysis, Table S2 in the ESI† provides the energy consumption values for each section. It is obvious that water electrolysis has the largest share of total energy consumption for all processes, and of the oxidative carbonylation process in particular (84.4%). All processes share the same design of MS, as does the energy consumption, where a small amount of LP steam is needed for methanol distillation. However, it is possible to achieve self-balance of steam consumption if the heat released by the MS reaction is optimally recovered. Although the regeneration of the MDEA solution adds some energy cost on top of the RWGS, in the total energy consumption its weight is not large. The DMC synthesis and separation, as well as urea synthesis and evaporation are the sections where steam consumption differs. For the oxidative carbonylation of methanol, the carbonylation reaction releases much heat for LP steam generation, which is the primary LP steam source for methanol–water and DMC-methanol distillations. The urea synthesis and separation for the three urea-based processes are the same. The urea synthesis generates LP steam but needs MP steam for evaporation. The generated LP steam can then be used for other sections where needed. The reaction of direct urea methanolysis is endothermic, and MP steam is used for heating the reactor. Although the oxidative carbonylation process has no urea synthesis and evaporation, it still cannot compensate the energy consumption caused by more H2 usage compared to the direct urea process. The two MP steam sinks within both indirect urea methanolysis processes are urea evaporation and endothermic transesterification reactions. Note that there is a small amount (−0.08 MJ per lDE) of LP surplus steam in indirect urea methanolysis via the EC process, and this is from the heat recovery of urea and DMC syntheses. Apart from the LP steam for DMC separation, some amount of HP steam is required for EG/PG separation, as their boiling points are high. The mechanical energy consumed by pumps and compressors is negligible.
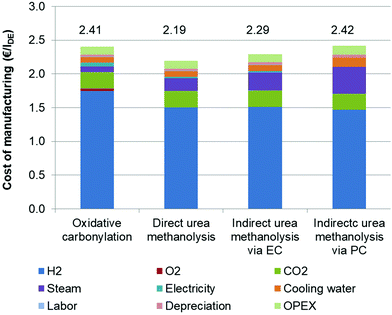
The breakdowns of COM for base cases are shown in Fig. 7. Similar to the energy consumption, the COM primarily depends on the H2 costs. The direct urea methanolysis has the lowest COM, of 2.19 € per lDE, which corresponds to its high level of energy efficiency. Although CO2 is one of the main feedstocks, its influence on the COM is much smaller than that of H2, as it is very cheaply available. For the oxidative carbonylation and direct urea methanolysis processes, CO2 capture is the second COM contributor, but the former process outperforms the latter at the point of steam consumption. Unlike these two processes, the second biggest COM contributor for both indirect urea methanolysis processes is steam, particularly via the PC route, which is brought about by the more complex distillation sequences and large reflux ratios. The OPEX for all processes is close, contributing around 5% to the COM. If we contrast the results of the energy consumption and COM, we can find that the COM of the EC route is lower than that of the carbonylation process, despite them having the same energy efficiency. The COM of the route is also comparable with that of carbonylation, indicating its competence for future development. The cost of process cooling also has some impacts, and it can be further compressed if air cooling is employed where possible. Other impacts such as operating electricity affecting the COM are much smaller.
5.2 Discussion
In order to identify the major drivers, we investigate the impact of various technological and economic variables on the process economics. Accordingly, we put forward some suggestions for further cost reductions.First, the sensitivity is evaluated by means of a univariate analysis. For instance, while analysing the effects of the hydrogen price, other variable values are kept at the base case level. The considered parameters include feedstocks, utilities and capital costs. Here, we group all steam forms together and assume that their prices are increased or decreased simultaneously. The results are presented via tornado diagrams in Fig. 8. As discussed in the base case, H2 is found to be the most influential factor. The H2 price is changed from −50% to +50% (2.3 to 6.9 € per kg), whereas the remaining values changed from −25% to +25%. At the high H2 price of 6.9 € per kg, the COM reaches 3.40 € per lDE, whereas at the low H2 price, the COM is as low as 1.60 € per lDE. The reduction in the hydrogen price relies on the advancement of water electrolysis efficiency and on lower investment in electrolysers in the future. However, the COM is much less sensitive to the CO2 price. The impacts of FCI, cooling water and electricity are all small. It is interesting to note that the impacts of steam can be stronger than that of CO2 for the EC and PC routes, suggesting that these processes have optimization potential. The results for the other processes show similar trends.
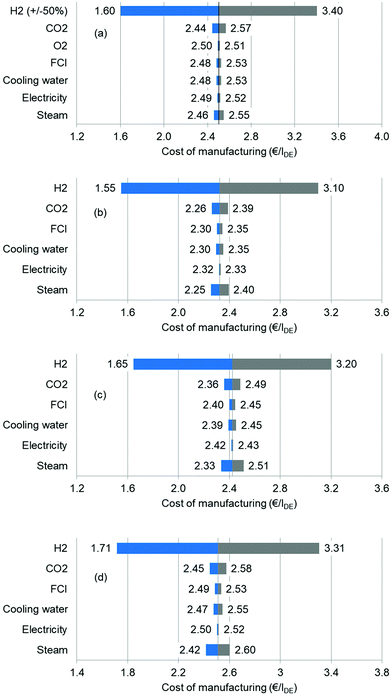 | ||
| Fig. 8 Sensitivity analysis of each process: (a) oxidative carbonylation of methanol; (b) direct urea methanolysis; (c) indirect urea methanolysis via EC; (d) indirect urea methanolysis via PC. | ||
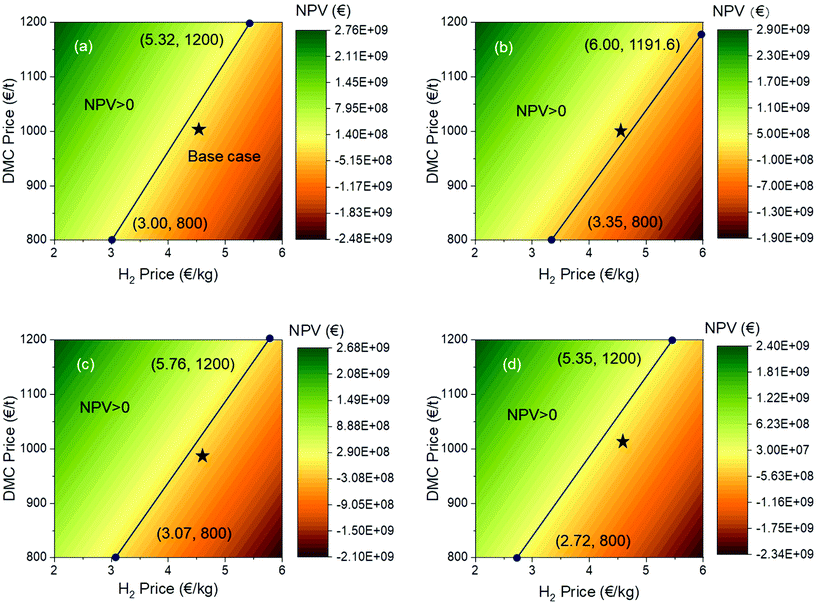
Different from the sensitivity by univariate analysis, the NPV are depicted with a number of pairs (24 pairs) of DMC and H2 prices to discover their interplay on the NPV (Fig. 9). In the analysis, the H2 price is varied from 2.0 to 6.0 € per kg and the DMC price ranges between 800 and 1200 € per t. In each colour map, there is a solid line with two end points. These lines are the boundaries distinguishing the negative and positive NPV regions, with the upper left region being positive and the lower right one being negative. The coordinates are marked for each end point. Looking at all results together, we can see that, except for the direct urea methanolysis, the other three processes cannot achieve a positive NPV at an H2 price of 6.0 € per kg. The same conclusion also applies to the base cases, which are marked as a black star in each figure. We can compare these processes pairwise, that is, the oxidative carbonylation of methanol and the direct urea methanolysis in pair and the indirect urea methanolysis via EC and PC in pair. The lower end points for the oxidative carbonylation and direct urea methanolysis have the same DMC price of 800 € per t, but at a higher end point, the H2 price for the direct urea methanolysis (6.00 € per kg) is higher than that for the oxidative carbonylation (5.32 € per kg), which means that this process is able to stand a higher H2 price and can therefore resist larger market uncertainties. Similarly, if we take a look at the upper end points for both indirect urea methanolysis processes, they have the same DMC price of 1200 € per t. The PC route has a lower H2 price and is therefore less resilient to market uncertainties.
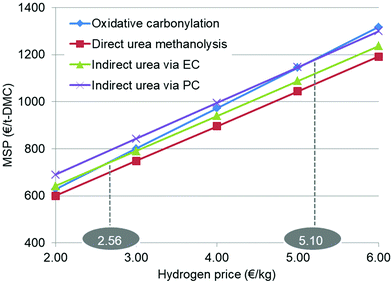
By way of comparison, the results of placing all of the changes in MSP with respect to the H2 price together are shown in Fig. 10. The purpose of this is to identify their changing rate relationships. The oxidative carbonylation process has the largest slope, as it is the most sensitive to the H2 price, but the three urea-based processes have nearly the same slopes. At a higher H2 price, the MSP of oxidative carbonylation is the highest. When the H2 price is below 5.10 € per kg, it is better than the PC route and if it is as low as 2.56 € per kg, it is superior to the EC route.
6. Conclusions
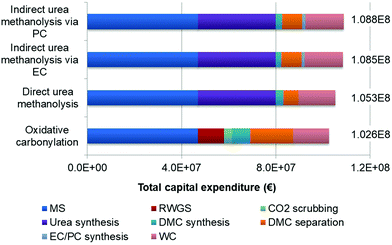
In this study, we screened the suitable DMC pathways with composite criteria of green chemistry principles and technology readiness level (TRL ≥ 5). For the selected processes of the oxidative carbonylation of methanol, direct urea methanolysis, and indirect urea methanolysis via ethylene carbonate and propylene carbonate, we designed and simulated the material and energy balances observing the same assumptions and boundary conditions. Following a techno-economic analysis and comparison, the following findings were obtained:(1) methanol and urea synthesis are major capital investment contributors, whereas DMC synthesis itself is not;
(2) the direct urea methanolysis has the highest energy efficiency of 48.5% and the lowest cost of manufacturing of 2.19 € per lDE;
(3) the distinctive features of the oxidative carbonylation of methanol give it the lowest capital investment costs and the lowest utility consumption; the process is favourable when the H2 price is below 2.56 € per kg;
(4) both indirect urea methanolysis processes feature better conversions than those of the direct process, but can only be competitive when utility consumption is minimised;
(5) under current market conditions, only the direct urea process is slightly profitable in terms of net present value and minimum selling price;
(6) the H2 price is found to be the dominant economic driver by sensitivity analysis, with the oxidative carbonylation of methanol in particular.
Overall, the oxidative carbonylation of methanol, as the state-of-the-art process, still has some advantages amongst the processes compared. The direct urea methanolysis has the highest energy efficiency and the lowest cost of manufacturing, but fundamentally, this process faces the thermodynamic barrier of positive Gibbs free energy change, regardless of the entropy increases. Both indirect urea methanolysis processes represent the future direction of development, with the process complexity and high capital expenditure being the current bottlenecks. Not only do the further cost reductions rely on the advancement of water electrolysis technology, but the process intensification and heat integration will also help realize the prospects of these processes.
Nomenclature
| C p | Personnel costs |
| C R | Raw material costs |
| C B | Operating costs |
| C t | Net cash flow |
| i | Interest rate |
| t | Plant lifespan |
Abbreviations:
| CAPEX | Capital expenditure |
| CAS | Chinese academy of science |
| COM | Cost of manufacturing |
| DMC | Dimethyl carbonate |
| EC | Ethylene carbonate |
| EG | Ethylene glycol |
| EO | Ethylene oxide |
| FCI | Fixed capital investment |
| GHGs | Greenhouse gases |
| HP | High pressure |
| LP | Low pressure |
| MC | Methyl carbamate |
| MDEA | Methyl diethanolamine |
| MEA | Monoethanolamine |
| MN | Methyl nitrite |
| MP | Medium pressure |
| MS | Methanol synthesis |
| MSP | Minimum selling price |
| MTBE | Methyl tert-butyl ether |
| NPV | Net present value |
| OPEX | Operational expenditure |
| PC | Propylene carbonate |
| PEM | Proton exchange membrane |
| PG | Propylene glycol |
| PM | Particle matter |
| PO | Propylene oxide |
| RWGS | Reverse water gas shift |
| STY | Space time yield |
| THC | Total hydrocarbons |
| TRL | Technology readiness level |
| WC | Working capital |
Subscripts:
| DE | Diesel equivalent |
| PtF | Power-to-Fuel |
Greek letters:
| η | Energy efficiency |
Conflicts of interest
There are no conflicts to declare.Acknowledgements
The authors would like to thank the Guangzhou Elite Project (JY201801) for its scholarship supporting the PhD project of Hong Huang.References
- International Energy Agency, WEO-2015 Special Report: Energy and Climate Change, Paris, France, 2015 Search PubMed.
- German Environment Agency, Germany in 2050 – a greenhouse gas-neutral country, 2014 Search PubMed.
- S. Schemme, R. C. Samsun, R. Peters and D. Stolten, Fuel, 2017, 205, 198–221 CrossRef CAS.
- Federal Ministry for the Environment, Nature Conservation and Nuclear Safety, Climate Action in Figures - Facts, Trends and Incentives for German Climate Policy, 2019 Search PubMed.
- A. Goeppert, M. Czaun, G. K. S. Prakash and G. A. Olah, Energy Environ. Sci., 2012, 5, 7833 RSC.
- D. Bellotti, M. Rivarolo, L. Magistri and A. F. Massardo, J. CO2 Util., 2017, 21, 132–138 CrossRef CAS.
- C. Hank, S. Gelpke, A. Schnabl, R. J. White, J. Full, N. Wiebe, T. Smolinka, A. Schaadt, H.-M. Henning and C. Hebling, Sustain. Energy Fuels, 2018, 2, 1244–1261 RSC.
- S. Schemme, J. L. Breuer, R. C. Samsun, R. Peters and D. Stolten, J. CO2 Util., 2018, 27, 223–237 CrossRef CAS.
- D. H. König, N. Baucks, R.-U. Dietrich and A. Wörner, Energy, 2015, 91, 833–841 CrossRef.
- D. H. König, M. Freiberg, R.-U. Dietrich and A. Wörner, Fuel, 2015, 159, 289–297 CrossRef.
- S. Michailos, S. McCord, V. Sick, G. Stokes and P. Styring, Energy Convers. Manage., 2019, 184, 262–276 CrossRef CAS.
- S. Deutz, D. Bongartz, B. Heuser, A. Kätelhön, L. S. Langenhorst, A. Omari, M. Walters, J. Klankermayer, W. Leitner, A. Mitsos, S. Pischinger and A. Bardow, Energy Environ. Sci., 2018, 11, 331–343 RSC.
- M. Held, Y. Tönges, D. Pélerin, M. Härtl, G. Wachtmeister and J. Burger, Energy Environ. Sci., 2019, 12, 1019–1034 RSC.
- Carbon Recycling International, https://www.carbonrecycling.is/products, (accessed May.2020).
- S.-H. Pyo, J. H. Park, T.-S. Chang and R. Hatti-Kaul, Curr. Opin. Green Sustain. Chem., 2017, 5, 61–66 CrossRef.
- A. M. Pacheco and L. C. Marshall, Energy Fuels, 1997, 11, 2–29 CrossRef.
- D. T. Durbin, G. Karavalakis, C. K. Johnson, R. D. Cocker, J. Yang, Y. Jiang and S. Kumar, Evaluating the Viability of Dimethyl Carbonate as an Alternative Fuel for the Transportation Sector, 2017 Search PubMed.
- J. Yang, Y. Jiang, G. Karavalakis, K. C. Johnson, S. Kumar, D. R. Cocker and T. D. Durbin, Fuel, 2016, 184, 681–688 CrossRef CAS.
- H.-Z. Tan, Z.-Q. Wang, Z.-N. Xu, J. Sun, Y.-P. Xu, Q.-S. Chen, Y. Chen and G.-C. Guo, Catal. Today, 2018, 316, 2–12 CrossRef CAS.
- D. Delledonne, F. Rivetti and U. Romano, Appl. Catal., A, 2001, 221, 241–251 CrossRef CAS.
- U. Romano, R. Tesel, M. M. Mauri and P. Rebora, Ind. Eng. Chem. Res., 1980, 19, 396–403 CrossRef CAS.
- N. Keller, G. Rebmann and V. Keller, J. Mol. Catal. A: Chem., 2010, 317, 1–18 CrossRef CAS.
- D.-W. Kim, C.-W. Kim, J.-C. Koh and D.-W. Park, J. Ind. Eng. Chem., 2010, 16, 474–478 CrossRef CAS.
- Z.-Z. Yang, L.-N. He, X.-Y. Dou and S. Chanfreau, Tetrahedron Lett., 2010, 51, 2931–2934 CrossRef CAS.
- W. Deng, L. Shi, J. Yao and Z. Zhang, Carbon Resour. Convers., 2019, 2, 198–212 CrossRef CAS.
- M. Wang, H. Wang, N. Zhao, W. Wei and Y. Sun, Catal. Commun., 2006, 7, 6–10 CrossRef CAS.
- M. Wang, H. Wang, N. Zhao, W. Wei and Y. Sun, Ind. Eng. Chem. Res., 2007, 46, 2683–2687 CrossRef CAS.
- M. Wang, N. Zhao, W. Wei and Y. Sun, Ind. Eng. Chem. Res., 2005, 44, 7596–7599 CrossRef CAS.
- B. M. Bhanage, S.-i. Fujita, Y. Ikushima and M. Arai, Green Chem., 2003, 5, 429 RSC.
- Q. Li, W. Zhang, N. Zhao, W. Wei and Y. Sun, Catal. Today, 2006, 115, 111–116 CrossRef CAS.
- D. Wu, Y. Guo, S. Geng and Y. Xia, Ind. Eng. Chem. Res., 2013, 52, 1216–1223 CrossRef CAS.
- Chinese Academy of Science, http://www.cas.cn/ky/kyjz/201411/t20141120_4256174.shtml, (accessed July.2020).
- L. F. S. Souza, P. R. R. Ferreira, J. L. de Medeiros, R. M. B. Alves and O. Q. F. Araújo, ACS Sustainable Chem. Eng., 2013, 2, 62–69 CrossRef.
- Z. Huang, J. Li, L. Wang, H. Jiang and T. Qiu, Ind. Eng. Chem. Res., 2014, 53, 3321–3328 CrossRef CAS.
- J. Holtbruegge, S. Heile, P. Lutze and A. Górak, Chem. Eng. J., 2013, 234, 448–463 CrossRef CAS.
- J. Holtbruegge, H. Kuhlmann and P. Lutze, Chem. Eng. Res. Des., 2015, 93, 411–431 CrossRef CAS.
- J. Holtbruegge, M. Leimbrink, P. Lutze and A. Górak, Chem. Eng. Sci., 2013, 104, 347–360 CrossRef CAS.
- J. Holtbruegge, M. Wierschem and P. Lutze, Chem. Eng. Process., 2014, 84, 54–70 CrossRef CAS.
- J. Holtbruegge, M. Wierschem, S. Steinruecken, D. Voss, L. Parhomenko and P. Lutze, Sep. Purif. Technol., 2013, 118, 862–878 CrossRef CAS.
- A. Sánchez, L. M. Gil and M. Martín, J. CO2 Util., 2019, 33, 521–531 CrossRef.
- L. Shi, S.-J. Wang, D. S.-H. Wong and K. Huang, Ind. Eng. Chem. Res., 2017, 56, 11531–11544 CrossRef CAS.
- I. Patraşcu, S. C. Bîldea and A. A. Kiss, Chem. Eng. Res. Des., 2020, 160, 486–498 CrossRef.
- P. Kongpanna, V. Pavarajarn, R. Gani and S. Assabumrungrat, Chem. Eng. Res. Des., 2015, 93, 496–510 CrossRef CAS.
- Department of Defense, Technology Readiness Assessment (TRA) Guidance, 2011 Search PubMed.
- European Commission, Technology Readiness Level: Guidance Principles for Renewable Energy Technologies Final Report, Brussels, 2017 Search PubMed.
- P. Anastas and N. Eghbali, Chem. Soc. Rev., 2010, 39, 301–312 RSC.
- I. I. Alkhatib, L. M. Pereira and L. F. Vega, Ind. Eng. Chem. Res., 2019, 58, 6870–6886 CrossRef CAS.
- S. Moioli, A. Giuffrida, M. C. Romano, L. A. Pellegrini and G. Lozza, Appl. Energy, 2016, 183, 1452–1470 CrossRef CAS.
- K. V. Bussche and G. Froment, J. Catal., 1996, 161, 1–10 CrossRef.
- C. Seidel, A. Jörke, B. Vollbrecht, A. Seidel-Morgenstern and A. Kienle, Chem. Eng. Sci., 2018, 175, 130–138 CrossRef CAS.
- A. Wolf, A. Jess and C. Kern, Chem. Eng. Technol., 2016, 39, 1040–1048 CrossRef CAS.
- S. Schemme, J. L. Breuer, M. Köller, S. Meschede, F. Walman, R. C. Samsun, R. Peters and D. Stolten, Int. J. Hydrog. Energy, 2020, 45, 5395–5414 CrossRef CAS.
- K.-Y. Hsu, Y.-C. Hsiao and I.-L. Chien, Ind. Eng. Chem. Res., 2010, 49, 735–749 CrossRef CAS.
- Aspen Technology, Aspen Plus Urea Synthesis Loop Model, 2011 Search PubMed.
- M. Carmo, D. L. Fritz, J. Mergel and D. Stolten, Int. J. Hydrog. Energy, 2013, 38, 4901–4934 CrossRef CAS.
- M. Ho and D. Wiley, in Absorption-based post-combustion capture of carbon dioxide, Elsevier, 2016, pp. 711–756 Search PubMed.
- R. Peters, M. Baltruweit, T. Grube, R. C. Samsun and D. Stolten, J. CO2 Util., 2019, 34, 616–634 CrossRef CAS.
- R. Turton, R. Bailie, W. Whiting and J. Shaeiwitz, Analysis, Synthesis, and Design of Chemical Processes, Pearson Education Inc., 3rd edn, 2008 Search PubMed.
- M. D. Staples, R. Malina, H. Olcay, M. N. Pearlson, J. I. Hileman, A. Boies and S. R. H. Barrett, Energy Environ. Sci., 2014, 7, 1545–1554 RSC.
- A. Apostolakou, I. Kookos, C. Marazioti and K. Angelopoulos, Fuel Process. Technol., 2009, 90, 1023–1031 CrossRef CAS.
- P. Noothout, F. Wiersma, O. Hurtado, D. Macdonald, J. Kemper and K. van Alphen, Energy Procedia, 2014, 63, 2481–2492 CrossRef CAS.
- S. Brynolf, M. Taljegard, M. Grahn and J. Hansson, Renewable Sustainable Energy Rev., 2018, 81, 1887–1905 CrossRef.
- M. Robinius, J. Linßen, T. Grube, M. Reuß, P. Stenzel, K. Syranidis, P. Kuckertz and D. Stolten, Comparative analysis of infrastructures: hydrogen fueling and electric charging of vehicles, 2018 Search PubMed.
- M. Fasihi, D. Bogdanov and C. Breyer, Energy Procedia, 2016, 99, 243–268 CrossRef CAS.
- https://m.made-in-china.com/search/product?word=Dimethyl%20Carbonate%20Price , (accessed August.2020).
- R. Detz, J. Reek and B. Van Der Zwaan, Energy Environ. Sci., 2018, 11, 1653–1669 RSC.
- M.-O. Schach, R. d. Schneider, H. Schramm and J.-U. Repke, Ind. Eng. Chem. Res., 2010, 49, 2363–2370 CrossRef CAS.
- R. Becka, CFD-Modelling and Evaluation of Methanol Synthesis Reactors for Power-to-Fuel Application, Master Thesis, RWTH Aachen University, 2018 Search PubMed.
- P. Kaiser, R. B. Unde, C. Kern and A. Jess, Chem. Ing. Tech., 2013, 85, 489–499 CrossRef CAS.
Footnote |
| † Electronic supplementary information (ESI) available. See DOI: 10.1039/d0gc03865b |
| This journal is © The Royal Society of Chemistry 2021 |

