DOI:
10.1039/D0FO02092C
(Paper)
Food Funct., 2021,
12, 230-240
High n-3 fatty acids counteract hyperglycemia-induced insulin resistance in fat-1 mice via pre-adipocyte NLRP3 inflammasome inhibition†
Received
8th August 2020
, Accepted 25th November 2020
First published on 27th November 2020
Abstract
Although n-3 polyunsaturated fatty acids (n-3 PUFAs) have potential anti-insulin resistance activity, the mechanism remains largely unknown. In this study, increased glucose resistance, insulin sensitivity, and lower glycemia were observed upon streptozotocin (STZ) treatment in n-3 PUFA-enriched fat-1 mice compared to wild type (WT) mice. Endogenous n-3 PUFAs in fat-1 mice were found to impair hyperglycemia or high glucose level-induced nucleotide-binding domain and leucine-rich repeat pyrin 3 domain (NLRP3) inflammasome activation and inhibit IL-1β secretion in adipose tissues. In addition, endogenous n-3 PUFAs also inhibited high glucose-induced caspase-1 activity and IL-1β secretion in pre-adipocyte-enriched stromal vascular fractions (SVF) isolated from adipose tissues. Furthermore, in 3T3-L1 pre-adipocytes, high levels of glucose induced thioredoxin interacting protein (TXNIP) expression and activated the NLRP3 inflammasome, which was counteracted by docosahexaenoic acid (DHA), the major n-3 PUFA in fat-1 mice, by downregulating TXNIP via the phosphatidylinositol-3-kinase (PI3K)/Akt pathway. Our results suggest that n-3 PUFA-mediated insulin sensitivity is at least partly associated with inflammasome inhibition in pre-adipocytes. Our findings highlight the potential clinical use of dietary n-3 PUFAs in the prevention or intervention of T2D and other NLRP3 inflammasome-driven inflammatory diseases.
1. Introduction
Diabetes mellitus is characterized by high blood sugar levels due to the pancreas not producing sufficient insulin, an impaired response to insulin termed insulin resistance, or both.1 Infection and inflammation are commonly coupled with insulin resistance. In particular, increasing evidence from both human and animal studies has demonstrated that dietary long-chain n-3 polyunsaturated fatty acids (n-3 PUFAs), in particular eicosapentaenoic acid (EPA; 20:5n-3) and docosahexaenoic acid (DHA; 22:6n-3), have anti-inflammatory properties, and have been shown to provide protection against insulin resistance and T2D.2–5 However, the anti-insulin resistance mechanisms of n-3 PUFAs remain elusive.
It is now recognized that adipose tissue secretes numerous pro-inflammatory cytokines known to cause metabolic syndrome and insulin resistance.6,7 Among the cytokines secreted by adipose tissues, IL-1β plays a crucial role in the development of insulin resistance and type 2 diabetes (T2D).8,9 Biologically active IL-1β is produced by the cleavage of its inactive precursor by the cysteine protease caspase-1, which is activated by large cytosolic protein complexes, known as inflammasomes.10,11 A prominent example of an inflammasome implicated in insulin resistance is the nucleotide-binding domain and leucine-rich repeat pyrin 3 domain (NLRP3) inflammasome.12,13 A recent study found that high glucose-mediated caspase-1 activation in murine β-cells is tightly controlled by thioredoxin interacting protein (TXNIP), which directly interacts with the NLRP3 inflammasome.14 In addition, hyperglycemia has recently been shown to activate caspase-1 and TXNIP-mediated IL-1β transcription in human adipocytes and may contribute to the development of insulin resistance.15 n-3 PUFAs have been shown to suppress the production of pro-inflammatory cytokines, including IL-1β. For example, it has been reported that n-3 PUFAs abolished NLRP3 inflammation activation and subsequent IL-1β secretion in bone-marrow-derived macrophages from high fat diet-induced T2D.16 However, whether n-3 PUFA can prevent or attenuate hyperglycemia-induced insulin resistance through the inhibition of NLRP3 inflammasome activation in pre-adipocytes remains largely unknown. In addition, there were some discrepancies among the outcomes of animal models and human studies on the effects of n-3 PUFAs on insulin resistance.17,18 Many dietary complications, such as the rapid rate of oxidation of many PUFA-rich diets and potential variations in overall diet composition between control and experimental diets, may have been responsible for the above-mentioned discrepancies. The fat-1 mouse model avoids these potential diet variations because both wild type (WT) and transgenic mice were maintained on the same n-6 PUFA diet.19–23 Therefore, the fat-1 transgenic mouse model is an ideal in vivo system for elucidating the role of the n-6/n-3 PUFA ratio in insulin resistance.
In the present study, we compared blood glucose levels and insulin sensitivity in fat-1 and WT mice treated with STZ or citrate and explored the molecular mechanism underlying the protective effects of endogenousn-3 PUFAs against hyperglycemia-induced insulin resistance. Our results indicated that n-3 PUFA-mediated protective effects against hyperglycemia-induced insulin resistance are associated with the activation of the phosphatidylinositol 3-kinase (PI3K)/Akt pathway, which suppresses high glucose-induced TXNIP expression and subsequently inactivates pre-adipocyte NLRP3 inflammasome.
2. Experimental section
2.1. Animals and diets
Fat-1 transgenic mice were kindly provided by Dr Jing X. Kang at Massachusetts General Hospital and Harvard Medical School (Boston, MA, USA). Fat-1 transgenic mice were generated and backcrossed onto a C57BL/6 background as previously described.24 The presence of the fat-1 gene was confirmed by genotyping. All mice were housed under temperature and humidity-controlled conditions with a 12 h light/dark cycle. At 6 weeks of age, male heterozygous fat-1 and WT mice were maintained on a 10% safflower oil diet. The diet was comprised of (per 100 g diet) 4.5 g sucrose, 18.6 g casein, 8.6 g cellulose, 50 g wheat starch, 0.3 g DL-methionine, 7 g mineral mix, 1 g vitamin mix, and 10 g safflower oil. All animal procedures were performed in accordance with the Guidelines for Care and Use of Laboratory Animals of Ningbo University and approved by the Animal Ethics Committee of Ningbo University.
2.2. Streptozotocin (STZ) administration
Diabetes was induced by STZ. At 8 weeks of age, 15 fat-1 and 15 WT mice were intraperitoneally injected with 60 mg kg−1 of STZ in 0.1 mol L−1, pH 4.5 sodium citrate buffer for 5 consecutive days to produce a β-cell destruction model. A total of 15 control fat-1 and 15 WT mice were injected intraperitoneally with citrate buffer as a vehicle. The blood glucose concentrations from tail venous blood in non-fasted mice were measured using a glucometer (LifeScan, Milpitas, CA). Mice were considered diabetic when blood glucose levels exceeded 16.7 mmol L−1. All mice were killed in blind for tissue collection as follows: 7 mice were killed in blind for tissue collection when fat-1 and WT mice developed hyperglycemia 5 days after the fifth STZ injection. The remaining mice (8 mice per group) were killed 75 days after the fifth STZ injection, and tissues were collected and stored at −80 °C for further analysis.
2.3. Glucose and insulin tolerance test
Glucose tolerance test (GTT) and insulin tolerance test (ITT) were performed as described previously.25 Briefly, for the GTT, mice were fasted for 16 h, followed by intraperitoneal injection of glucose (1.5 g kg−1). For the ITT, non-fasted mice were injected intraperitoneally with human regular insulin (0.75 U kg−1). Blood glucose concentrations were measured at the indicated time points before and after a glucose/insulin challenge.
2.4. Cell culture
3T3-L1 pre-adipocytes were obtained from the American Type Culture Collection (Manassas, VA, USA) and cultured in Dulbecco's modified Eagle's Medium (DMEM) supplemented with 10% foetal bovine serum (FBS), 100 U ml−1 penicillin, and 100 mg mL−1 streptomycin.
2.5. Stromal vascular fraction culture
To separate the stromal vascular fraction (SVF) from the adipose tissues, 5 days after the fifth STZ injection, epididymal adipose tissues from WT, Fat-1, WT + STZ, and Fat-1 + STZ were isolated, minced, and digested by collagenase. The collagenase digests were filtered through a 200 μm filter and diluted ½ with HBSS containing 10% FBS to stop collagenase activity prior to centrifugation. The cell pellet constituting the SVF was cultured in complete media (DMEM, 10% FBS, and 1% penicillin/streptomycin) for 7 days to remove non-adherent cells, promoting a pre-adipocyte-enriched SVF.
2.6. RT-PCR analysis
RNA was extracted from the total adipose tissue or the SVF from adipose tissues using TRIzol reagent (Invitrogen, Carlsbad, CA). cDNA synthesis was performed using a reverse transcriptase system (Bio-Rad Laboratories, Hercules, CA). SYBR green-based real-time PCR was performed on an Agilent Mx3000P QPCR System (Agilent, CA). Relative gene expression was determined by real-time PCR. Relative quantification of each transcript was normalized to 36B4 gene expression levels. The following primers were used: IL-1β (forward 5′-CTCACAAGCAGAGCACAAGC-3′, reverse 5′-CTCAGTGCAGGCTATGACCA-3′) and TXNIP (forward 5′-CAGCGATCTCACTGATTG-3′, reverse 5′-AGTTTCAAGCAGGAGGCG-3′).
2.7. Transfection of TXNIP shRNA
Control shRNA and TXNIP shRNA lentiviruses were obtained from Xizhao Biotech (Shanghai, China). Cultured 3T3-L1 pre-adipocytes were transfected with control shRNA and TXNIP shRNA lentiviruses according to the protocol of the shRNA transfection kit (Xizhao Biotech, Shanghai, China). After 72 h, cells were harvested and TXNIP expression was detected.
2.8. Western blotting analysis
White adipose tissues were homogenised in 20 mM Tris-HCl, pH 7.6, 1 mM EDTA, 140 mM NaCl, 1% aprotinin, 2 mM PMSF, 1 mM phenylmethylsulfonyl fluoride, 1 mM sodium vanadate, and complete phosphatase inhibitor cocktail (Roche) without Triton X-100. After low-speed centrifugation (2500g at 4 °C), the fat layer was removed and Triton X-100 was added to a final concentration of 1%. SVF and 3T3-L1 pre-adipocytes were directly homogenised in Triton X-100 containing buffer. The extracts were sonicated and centrifuged at 15![[thin space (1/6-em)]](https://www.rsc.org/images/entities/char_2009.gif) 000g at 4 °C for 15 min. Protein concentration was determined using a bicinchoninic acid (BCA) protein assay kit (Biyuntian Biotech, Haimen, China). Protein extracts were separated by 10% SDS-PAGE and blotted on nitrocellulose membranes (Millipore). Membranes were blocked in milk at room temperature for 1 h and incubated at 4 °C overnight with primary antibodies, followed by incubation with secondary antibodies for 1 h at room temperature. Proteins were detected by enhanced chemiluminescence. The primary antibodies rabbit anti-pro-IL-1β, rabbit anti-IL-1β, rabbit anti-pro-caspase-1, rabbit anti-TXNIP, rabbit anti-Akt, rabbit anti-phosphor-Akt (Ser473), rabbit anti-NLRP3, mouse anti-β-actin, and the horseradish peroxidase-linked secondary antibodies were purchased from Cell Signaling Technology (Danvers, MA, USA).
000g at 4 °C for 15 min. Protein concentration was determined using a bicinchoninic acid (BCA) protein assay kit (Biyuntian Biotech, Haimen, China). Protein extracts were separated by 10% SDS-PAGE and blotted on nitrocellulose membranes (Millipore). Membranes were blocked in milk at room temperature for 1 h and incubated at 4 °C overnight with primary antibodies, followed by incubation with secondary antibodies for 1 h at room temperature. Proteins were detected by enhanced chemiluminescence. The primary antibodies rabbit anti-pro-IL-1β, rabbit anti-IL-1β, rabbit anti-pro-caspase-1, rabbit anti-TXNIP, rabbit anti-Akt, rabbit anti-phosphor-Akt (Ser473), rabbit anti-NLRP3, mouse anti-β-actin, and the horseradish peroxidase-linked secondary antibodies were purchased from Cell Signaling Technology (Danvers, MA, USA).
2.9. Caspase-1 activity assay
The caspase-1 activity in SVF was determined using the fluorogenic substrate YVAD-AFC (Biovision), as previously described.26 Briefly, SVF was lysed in hypotonic cell lysis buffer (25 mM HEPES, 5 mM EGTA, and 5 Mm dithiothreitol (DTT) (pH 7.5) on ice for 10 min and centrifuged to remove the insoluble fraction (12000g, 10 min). The SVF lysates (50 μL) were incubated with 50 μM peptide YVAD-AFC and 50 μL of reaction buffer (0.2% CHAPS, 0.2 MHEPES, 20% sucrose, 29 mM DTT, pH 7.5) for 2 h. Fluorogenic caspase activity was measured using a fluorometer at set time intervals.
2.10. Adipose tissue and SVF fatty acid composition
The fatty acid profiles in adipose tissues and SVF were determined by gas chromatography, as described previously.27
2.11. Histological analysis
For histological investigations, adipose tissues were fixed in 4% formaldehyde in phosphate buffer overnight and then embedded in paraffin. Histological sections were stained with hematoxylin and eosin (H&E).
2.12. Statistical analysis
The results are presented as the mean ± standard error of the mean (SEM). Differences between more than two groups were tested using two-way analysis of variance (ANOVA), followed by Newman–Keuls test. A value of P < 0.05 was considered statistically significant.
3. Results
3.1. Effects of endogenous n-3 PUFAs in STZ-induced diabetes
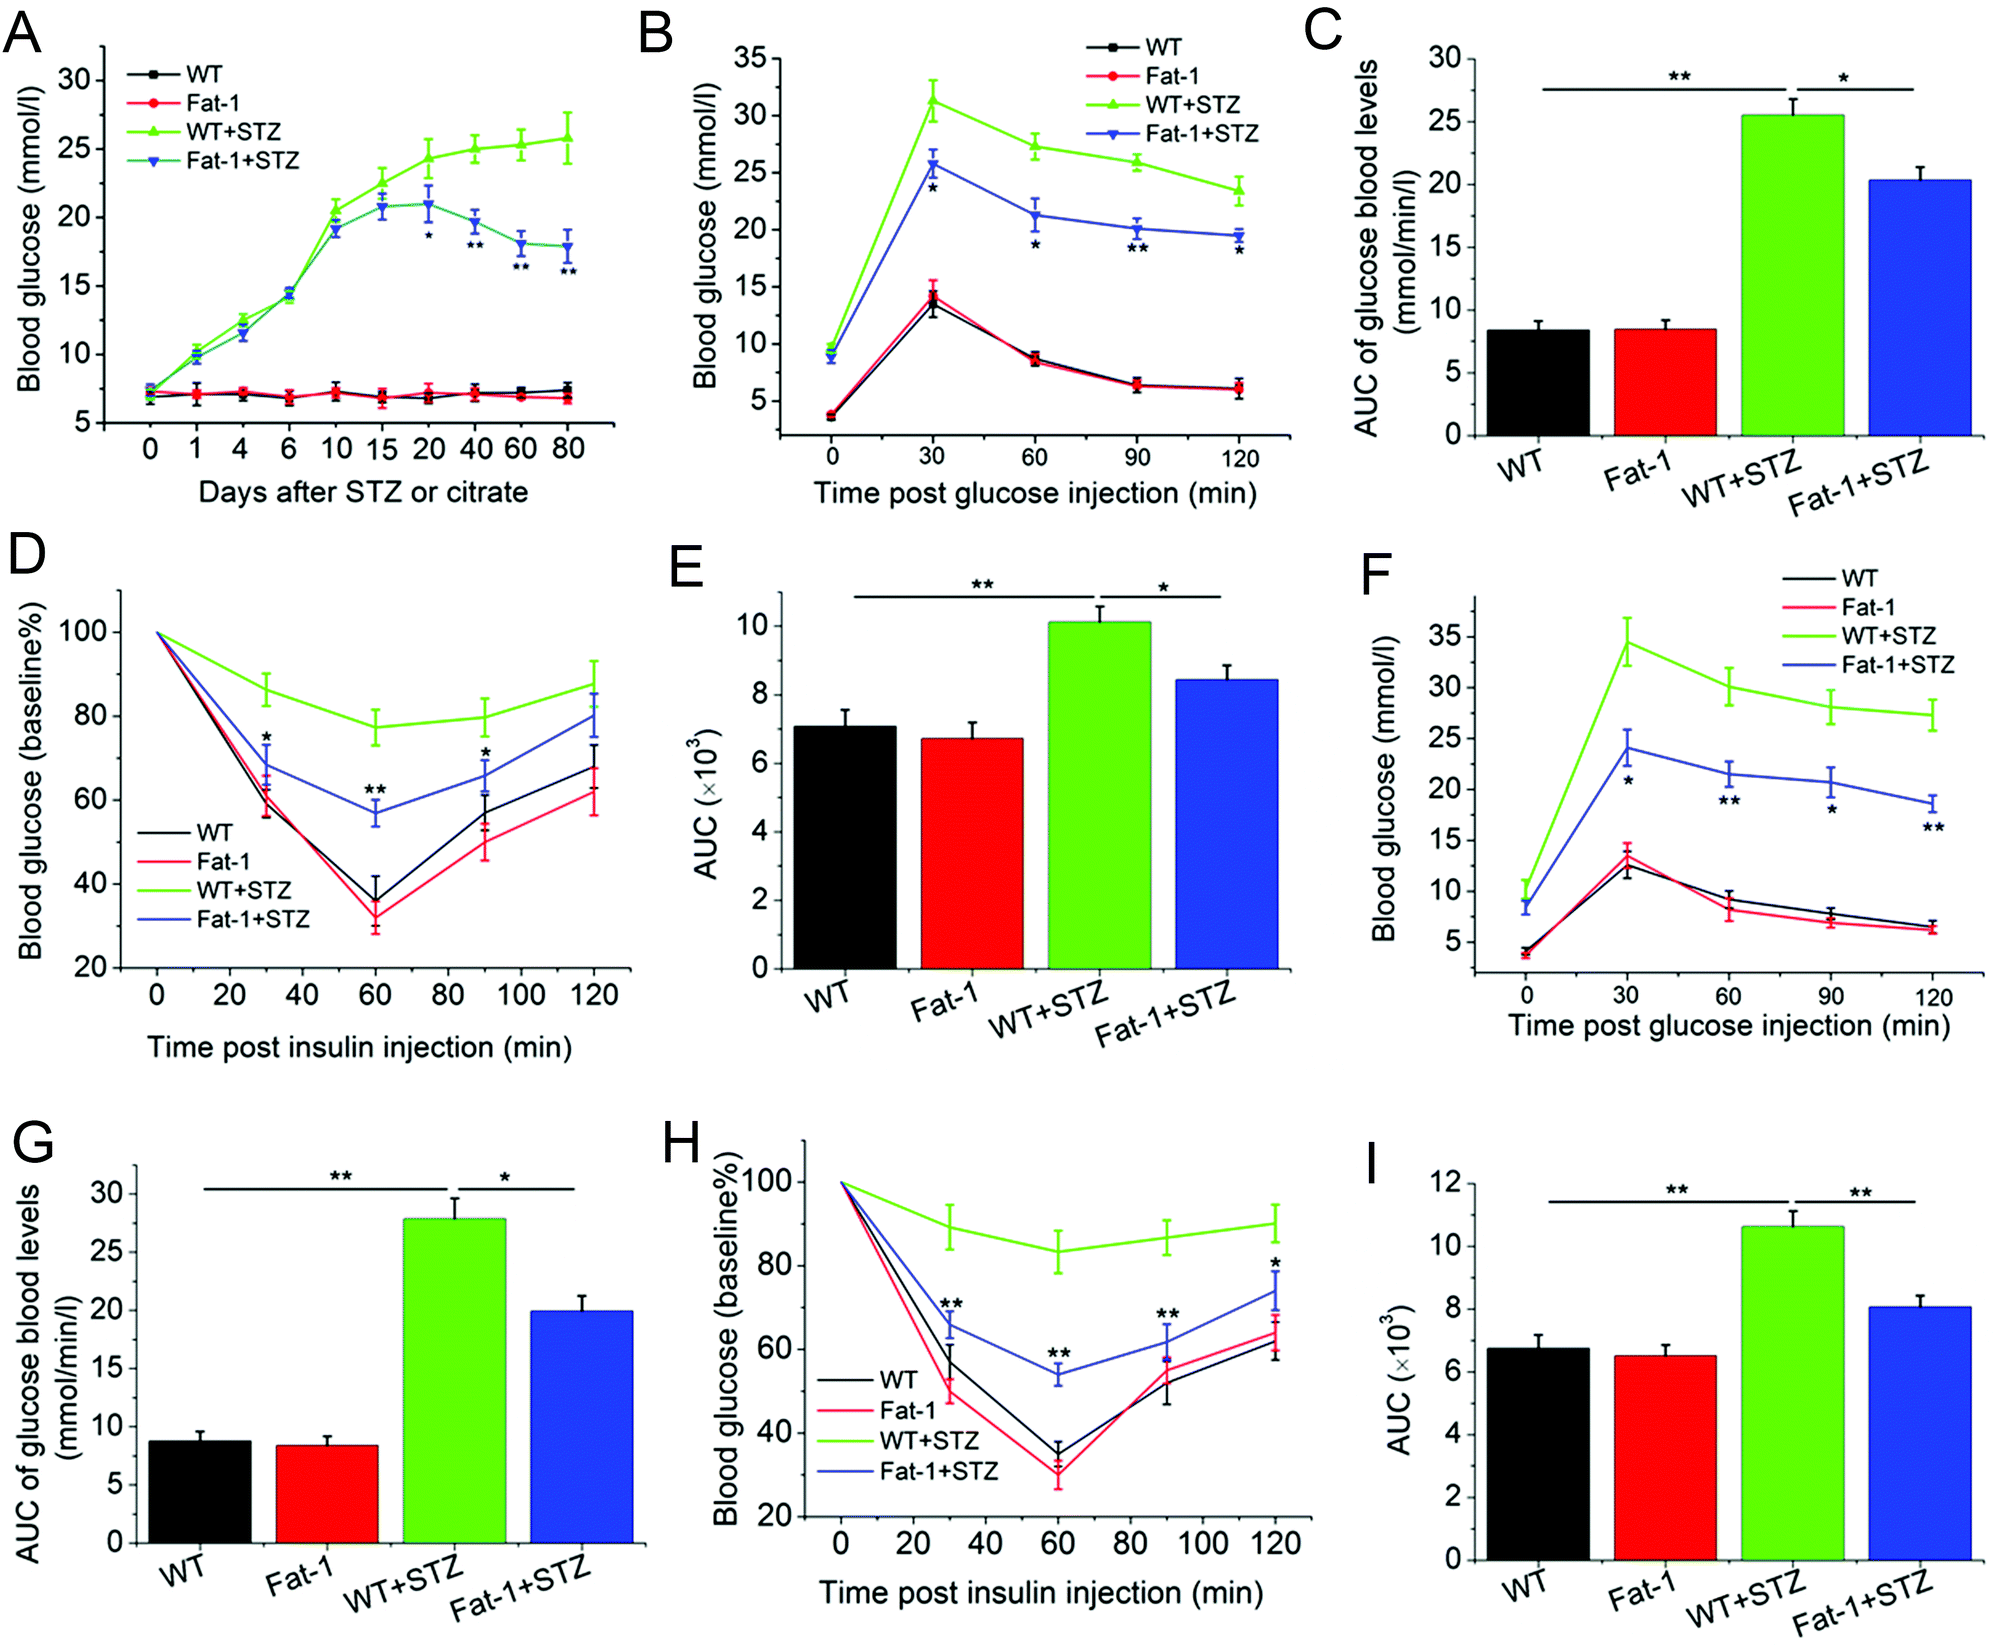
To assess whether endogenous n-3 PUFA levels are capable of preventing STZ-induced diabetic progression, fat-1 and WT mice were treated with STZ or citrate. As shown in Fig. 1A, 5 days after the last injection of STZ, fat-1, and WT mice started to develop hyperglycemia; however, STZ-treated fat-1 mice maintained a significantly lower glycemic level than STZ-treated WT mice from 20 to 80 days, while all citrate-treated mice maintained normal blood glucose levels. In addition, about 6 days following the fifth treatment of STZ, endogenously increased n-3 PUFAs led to an improvement in glucose tolerance (Fig. 1B & C), and insulin sensitivity (Fig. 1D & E) in fat-1 mice compared to WT mice. Similar glucose tolerance and insulin sensitivity were achieved in fat-1 mice by about 70 days, compared with 5 days after the fifth STZ treatment (Fig. 1F–I). It was found that although STZ treatment resulted in significant weight loss in both animals, it did not induced significant difference in body weight between fat-1 and WT mice (Fig. S1†). Simultaneously, no significant differences in adipose tissue expansion were observed between STZ-treated and citrate-treated mice. However, significantly increased inflammatory cell infiltration was observed in WT + STZ mice, compared with Fat-1 + STZ group (Fig. S2†).
 |
| | Fig. 1 Endogenous n-3 PUFAs improved glucose tolerance and insulin sensitivity, and lowered hyperglycemia levels. (A) Blood glucose levels were measured in non-fasted WT and fat-1 transgenic mice treated with STZ or citrate as control (n = 5). (B and F) 6 days (B) and 70 days (F) after the fifth STZ injection, GTT was performed in fasted WT and fat-1 transgenic animals treated with STZ or citrate (n = 5). (C and G) Area under the curve (AUC) of the mean glucose levels after GTT 6 days (C) and 70 days (G) after the fifth STZ injection. (D and H) 7 days (D) and 71 days (H) after the fifth STZ injection, ITT was performed and normalized for base blood glucose in nonfasted animals (n = 5). (E and I) The total area under the curve (AUC) evaluation after 7 days (E) and 71 days (I) after the fifth STZ injection. *P < 0.05; **P < 0.01 compared to WT + STZ mice in (A, B, D, F and H). WT, citrate-treated WT mice; WT + STZ, STZ-treated WT mice; Fat-1, citrate-treated fat-1 mice; Fat-1 + STZ, STZ-treated fat-1 mice. | |
3.2. Fatty acid profiles in adipose tissues and SVF from fat-1 and WT mice
Analysis of total lipid extracts from adipose tissues and SVF showed distinctly different profiles between fat-1 and WT mice five days for the fifth STZ or citrate injection (Fig. 2A & C). There were significantly higher levels of n-3 PUFAs [20:5n-3 (EPA), 22:5n-3 docosapentaenoic acid (DPA), and 22:6n-3 (DHA)] and a much lower level of n-6 PUFAs (AA, 20:4 n-6) in the adipose tissues and SVF from fat-1 transgenic mice compared with WT animals, regardless of STZ or citrate treatment. Simultaneously, the endogenous n-6/n-3 PUFA ratio in the adipose tissues was significantly decreased in STZ- and citrate-treated fat-1 mice (5.1 and 4.1, respectively), as compared to STZ or citrate-treated WT mice (27.3 and 24.6, respectively) (Fig. 2B). In addition, the endogenous n-6/n-3 PUFA ratio was also significantly decreased in SVF from STZ- and citrate-treated fat-1 mice (6.3 and 7.2, respectively), as compared to STZ or citrate-treated WT mice (25.9 and 28.6, respectively) (Fig. 2D), whereas the n-6/n-3 PUFA ratio increased slightly in SVF compared to that in adipose tissues from STZ- or citrate-treated fat-1 mice. Similar fatty acid profile was observed in adipose tissues from animals 75 days after fifth STZ or citrate injection (Fig. S3†).
 |
| | Fig. 2 Fatty acid composition in adipose tissues or SVF from control or STZ-treated WT and fat-1 mice. Five days after the fifth STZ treatment, adipose tissues from WT, Fat-1, WT + STZ, and Fat-1 + STZ were isolated (n = 4). (A) Adipose tissue profiles of major n-6 and n-3 PUFAs, total n-6, and total n-3. (B) Ratio of n-6/n-3 PUFA of adipose tissues. (C) SVF was isolated from the above-mentioned adipose tissues and cultured for 7 days, the SVF profiles of major n-6 and n-3 PUFAs, total n-6, and total n-3 were analysed. (D) Ratio of n-6/n-3 PUFA of SVF. Different letters denote groups that were significantly different (P < 0.05). ND, not detectable. WT, citrate-treated WT mice; WT + STZ, STZ-treated WT mice; Fat-1, citrate-treated fat-1 mice; Fat-1 + STZ, STZ-treated fat-1 mice. | |
3.3. Effects of endogenous n-3 PUFAs on IL-1β transcription and IL-1β secretion
Hyperglycemia was found to induce the production of IL-1β in different cell types, including adipocytes.15 Therefore, we next studied the effects of endogenous n-3 PUFAs on hyperglycemia-induced IL-1β secretion. As shown in Fig. 3A, 5 days after the fifth STZ treatment, hyperglycemia induced IL-1β secretion in STZ-treated mice compared to citrate-treated mice, whereas IL-1β levels in cultured adipose tissues were significantly lower in Fat-1 + STZ mice than in WT + STZ mice. It was also found that endogenously synthesised n-3 PUFAs partly counteracted hyperglycemia-induced IL-1β mRNA expression in adipose tissues from Fat-1 + STZ mice compared to WT + STZ mice (Fig. 3B). Similarly, endogenous n-3 PUFAs significantly counteracted hyperglycemia-induced IL-1β levels and IL-1β mRNA expression in fat-1 mice, compared with WT mice approximately 75 days after the fifth STZ treatment (Fig. 3C & D). In order to study the effects of endogenous n-3 PUFAs on high glucose-induced IL-1β transcription and IL-1β secretion, adipose tissues from citrate-treated WT and fat-1 mice were treated with 25 mM glucose for 48 h. As shown in Fig. 3E & F, significantly lower levels of bioactive IL-1β and IL-1β gene expression were observed in high glucose-treated adipose tissues from fat-1 mice compared to WT mice. MCC950, a NLRP3 inflammasome inhibitor, was also found to significantly suppress high glucose-induced bioactive IL-1β and IL-1β gene expression. We further assessed the effects of endogenous n-3 PUFAs on the expression of the NLRP3 inflammasome protein complex. As shown in Fig. 3G, the NLRP3 protein levels were significantly upregulated in adipose tissues from WT + STZ mice compared with those from Fat-1 + STZ mice, while pro-caspase-1 and pro-IL-1β protein levels remained unchanged. In addition, there was no difference in the protein levels of NLRP3, pro-caspase-1, and pro-IL-1β in high glucose-treated fat-1 and WT mice with or without MCC950 treatment (Fig. 3F). These results suggest that hyperglycemia or high glucose mainly activates NLRP3 inflammation and does not directly affect pro-IL-1β expression.
 |
| | Fig. 3 Endogenous n-3 PUFAs counteracted hyperglycemia or high glucose-induced IL-1β gene expression and IL-1β secretion in adipose tissues. (A and C) 5 days (A) and 75 days (C) after the fifth STZ injection, adipose tissues from WT, Fat-1, WT + STZ, and Fat-1 + STZ were isolated and cultured. IL-1β secretion into culture media was detected by ELISA (n = 3). (B and D) 5 days (B) and 75 days (D) after the fifth STZ injection, adipose tissues from WT, Fat-1, WT + STZ, and Fat-1 + STZ were isolated and IL-1β gene expression was detected. (E and F) Five days after the fifth STZ injection, adipose tissues from WT and Fat-1 were isolated and treated with 25 mM glucose with or without MCC950, a NLRP3 inflammasome inhibitor. IL-1β secretion (E) and IL-1β gene expression (F) were measured (n = 3). (G) Five days after the fifth STZ injection, adipose tissues from WT and Fat-1 were isolated and the expression of NLRP3, pro-caspase-1, and pro-IL-1β was detected by immunoblotting. (H) Five days after the fifth STZ injection, adipose tissues from WT and Fat-1 were isolated and treated with 25 mM glucose with or without MCC950. The expression of NLRP3, pro-caspase-1, and pro-IL-1β was detected by immunoblotting. *P < 0.05; **P < 0.01 (Newman–Keuls test). WT, citrate-treated WT mice; WT + STZ, STZ-treated WT mice; Fat-1, citrate-treated fat-1 mice; Fat-1 + STZ, STZ-treated fat-1 mice. | |
3.4. Endogenous n-3 PUFAs inhibited high glucose-induced NLRP3 inflammasome activation by suppressing TXNIP expression
To determine whether endogenous n-3 PUFAs inhibited IL-1β secretion in cultured adipose tissues via the inhibition of NLRP3 inflammasome activation, caspase-1 activity was measured in SVF from STZ- and citrate-treated mice. As shown in Fig. 4A, endogenous n-3 PUFAs significantly inhibited hyperglycemia-induced caspase-1 activity in SVF from Fat-1 + STZ mice compared to WT + STZ mice. Similarly, endogenous n-3 PUFAs also significantly suppressed high glucose-induced caspase-1 activity in SVF from citrate-treated fat-1 mice compared to citrate-treated WT mice (Fig. 4B). TXNIP was characterized as a thioredoxin-binding protein that regulates the antioxidant function of thioredoxin. Recently, TXNIP was found to be capable of binding to the NLRP3 inflammasome and activating it.14 Therefore, we further uncovered whether TXNIP was associated with endogenous n-3 PUFA-mediated inhibition of NLRP3 inflammasome activation. As shown in Fig. 4C & D, endogenous n-3 PUFAs significantly suppressed hyperglycemia-induced TXNIP mRNA levels and TXNIP protein expression in adipose tissues from Fat-1 + STZ mice compared to WT + STZ mice. In addition, endogenous n-3 PUFAs also significantly inhibited high glucose-induced TXNIP and IL-1β expression in SVF from Fat-1 mice compared to WT mice (Fig. 4E). These data suggested that TXNIP may be implicated in endogenous n-3 PUFA-mediated inhibition of NLRP3 inflammasome activation. To further confirm whether TXNIP was indispensable for endogenous n-3 PUFA-mediated inhibition of NLRP3 inflammasome activation, we selectively knocked down TXNIP expression using TXNIP specific shRNA (Fig. 5A). Because the DHA levels were significantly higher than EPA and DPA levels in adipose tissues from fat-1 mice (Fig. 2A). Thus, DHA was used in subsequent studies. As shown in Fig. 5B, high glucose-induced caspase-1 activity in cells transfected with control shRNA but not in cells transfected with TXNIP shRNA, whereas DHA significantly suppressed high glucose-induced caspase-1 activity. Similarly, DHA significantly downregulated TXNIP and IL-1β expression induced by high glucose, whereas the successful knockdown of TXNIP blocked high glucose-induced IL-1β expression (Fig. 5C), suggesting that DHA blocked high glucose-induced TXNIP expression and led to NLRP3 inflammasome inhibition. Next, we investigated the underlying mechanism by which DHA counteracted high glucose-induced IL-1β expression. Previous observations suggest that PI3K/Akt signaling inhibits TXNIP expression.28,29 It was found that DHA markedly upregulated p-Akt levels and decreased TXNIP expression, whereas LY294002, a PI3K inhibitor, significantly blocked p-Akt expression and markedly increased TXNIP expression (Fig. 5D). As expected, LY294002 blocked DHA-induced p-Akt expression and restored TXNIP expression (Fig. 5D). These results suggest that DHA blocks high glucose-NLRP3 inflammasome activation through the PI3K/Akt pathway-mediated downregulation of TXNIP.
 |
| | Fig. 4 Endogenous n-3 PUFAs counteracted hyperglycemia or high glucose-induced inflammasome activation via the downregulation of TXNIP. (A) Caspase-1 activity assay in SVF. (B) The SVF from WT and fat-1 adipose tissues was seeded at a density of 1 × 10⁶ cells per mL and cultured for 24 h with 5 mM ATP, with or without glucose (25 mM). Caspase-1 activity was detected. (C) TXNIP gene expression and (D) TXNIP protein expression in adipose tissues from WT, Fat-1, WT + STZ, and Fat-1 + STZ mice were measured. (E) The SVF from WT and fat-1 adipose tissues was treated with 5 mM ATP, with or without glucose (25 mM) for 48 h. The expression of NLRP3, TXNIP, Pro-IL-1β and IL-1β was detected with immunoblotting. Data are representative of at least three independent experiments. *P < 0.05; **P < 0.01 (Newman–Keuls test). WT, citrate-treated WT mice; WT + STZ, STZ-treated WT mice; Fat-1, citrate-treated fat-1 mice; Fat-1 + STZ, STZ-treated fat-1 mice. | |
 |
| | Fig. 5 DHA reduced high-induced TXNIP expression via PI3K/Akt signaling. (A) The expression of TXNIP after shRNA treatment against TXNIP in 3T3-L1 pre-adipocytes. (B) Caspase-1 activity and (C) the protein expression of TXNIP, pro-IL-1β, and pro-IL-1β were detected in 3T3-L1 adipocytes transfected with TXNIP shRNA or control shRNA, and treated with glucose or DHA alone or in combination. (D) The protein expression of p-Akt, Akt, and TXNIP was detected in 3T3-L1 pre-adipocytes treated with DHA or LY294002, a PI3K inhibitor, or in combination. Data are representative of at least three independent experiments. *P < 0.05; **P < 0.01 (Newman–Keuls test). | |
4. Discussion
The major marine long-chain n-3 PUFAs, namely EPA and DHA, exert anti-inflammatory properties and are attractive candidates for the prevention of many inflammation-driven human diseases, including obesity, diabetes, colitis, and arthritis.30–32 Several earlier studies have reported that endogenous n-3 PUFAs protect fat-1 mice against STZ-induced diabetes.33–35 However, in the present study, STZ treatment induced diabetes in both fat-1 and WT mice. This discrepancy may largely be explained by the different doses of STZ used in these studies. For example, a lower dose of 45 and 50 mg kg−1 day−1 was used in both the Bellenger and Hwang groups and the Bak group, respectively. In contrast, a relatively high dose of 60 mg kg−1 day−1 was used in this study. Although endogenous n-3 PUFAs failed to protect fat-1 mice against STZ-induced hyperglycemia, it was noteworthy that fat-1 mice maintained a significantly lower glycaemic level from day 15 after the fifth STZ treatment to the end of the entire observation period (80 days). Furthermore, GTT and ITT indicated that endogenous n-3 PUFAs led to an improvement in glucose tolerance and insulin sensitivity in STZ-treated fat-1 mice. The beneficial role of endogenous n-3 PUFAs in attenuating hyperglycemia and increasing glucose tolerance and insulin sensitivity was associated with the inhibition of adipose NLRP3 inflammasome. Mechanically, DHA-mediated NLRP3 inflammasome inhibition was due to blockade of high glucose-induced TXNIP via the PI3K/Akt pathway in pre-adipocytes.
Previous studies suggest that a chronic, low-grade inflammation in the adipose tissue is associated with the development of insulin resistance and diabetes.36,37 Although adipose tissue macrophage infiltration induces the development of obesity-induced inflammation,38 it is now recognized that adipocytes and pre-adipocytes can produce cytokines, which trigger the onset of adipose tissue inflammation and subsequent insulin resistance.39,40 Pro-inflammatory cytokine IL-1β secreted by macrophages and pancreatic beta cells resulted in islet beta-cell dysfunction, such as impaired insulin secretion.41,42 Evidence is increasingly demonstrating that IL-1β was elevated in T2D,43 and IL-1 receptor antagonist (IL-1RA) or IL-1β antibody shows encouraging progress in treating T2D.44 n-3 PUFAs have been reported to suppress NLRP3 inflammasome-dependent IL-1β secretion in macrophages and prevent high-fat-diet-induced insulin resistance.16 In addition, in an earlier study, it was found that high glucose-induced IL-1β secretion in adipocytes and may contribute to the development of insulin resistance.15 Here, we presented that endogenous n-3 PUFAs suppressed hyperglycemia-induced IL-1β secretion in adipose tissues, which contributed to lower glycaemia and increased glucose tolerance and insulin sensitivity in STZ-treated fat-1 mice. Although adipocytes are a source of IL-1β, pre-adipocytes from the stromal vascular fraction (SVF) can produce even higher levels of IL-1β, compared with adipocytes.25 Our results showed that high glucose-induced NLRP3 inflammasome-dependent IL-1β secretion in pre-adipocyte-enriched SVF separated from epididymal adipose tissues and in 3T3L1 pre-adipocytes, which was significantly counteracted by endogenous n-3 PUFAs or DHA, respectively. Our findings support a crucial role of inhibition of NLRP3 inflammasome activation in adipose pre-adipocytes underlying the beneficial effects of n-3 PUFAs in insulin resistance.
TXNIP was originally described as an inhibitor of thioredoxin, which regulates its antioxidant roles. It has been reported that TXNIP binds to the NLRP3 inflammasome complex to activate it and induce IL-1β secretion.14 Our results demonstrated that hyperaemia induced TXNIP expression in adipose tissues in fat-1 and WT mice upon STZ treatment. In line with our results, hyperglycemia was found to induce TXNIP expression in adipose tissues in ob/ob animals.15 Our results also showed that hyperglycemia or high glucose-induced TXNIP expression failed to regulate pro-IL-1β expression (Fig. 3G & H and 4E & 5C). Furthermore, the successful knockdown of TXNIP expression was found to markedly abrogate high glucose-induced IL-1β expression in 3T3-L1 pre-adipocytes, suggesting that TXNIP is indispensable for NLRP3 inflammasome activation upon high glucose stimulation in 3T3-L1 pre-adipocytes. Whereas TXNIP was found to mainly regulate intracellular pro-IL-1β expression and did not directly activate caspase-1 at least in adipocytes.15 In agreement with our results, TXNIP was found to directly control caspase-1 activation in pancreatic β-cells.14 TXNIP expression is regulated by Ras/mitogen-activated protein kinase (MAPK) and phosphatidylinositol-3-kinase (PI3K)/Akt signaling.45 Although inconsistency exists with regards to the DHA-mediated regulation of Akt activation, DHA was found to promote neuronal survival by facilitating membrane translocation and the subsequent activation of Akt by its capacity to increase phosphatidylserine.46 In agreement, we demonstrated that DHA activated Akt and then suppressed TXNIP expression, which subsequently inactivated NLRP3 inflammasome activation upon high glucose treatment in 3T3-L1 pre-adipocytes. It is noteworthy that whether EPA is also involved in protection against hyperglycemia-induced insulin resistance cannot be excluded. A previous study reported that n-3 PUFAs inhibited NLRP3 inflammasome activation via GPR40 and GPR120-dependent pathway in macrophages.16 Therefore, it also cannot be excluded that inflammasome activation in adipocytes and macrophages in adipose tissue was also inhibited by n-3 PUFAs, leading to an improvement of insulin sensitivity.
5. Conclusions
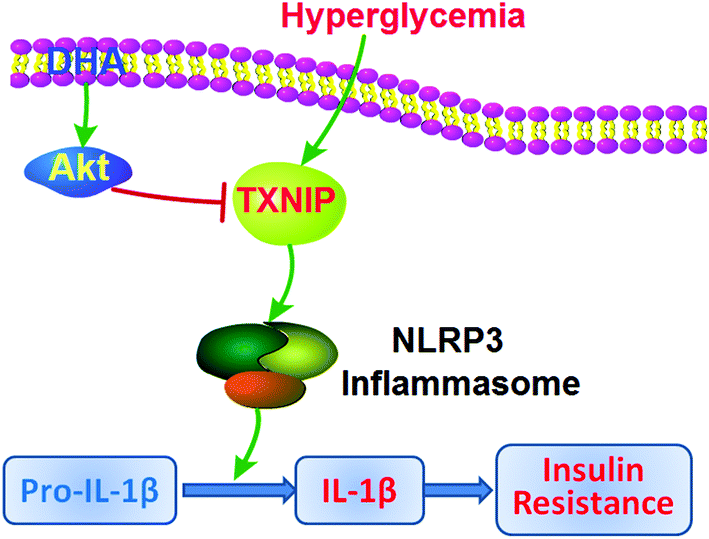
As summarized in Fig. 6, our results indicate that endogenous n-3 PUFAs may suppress NLRP3 inflammasome activation by downregulating TXNIP expression via the PI3K/Akt signalling in pre-adipocytes of adipose tissues, leading to an improvement in glucose tolerance, insulin sensitivity, and lower glycaemia. Our findings also highlight the potential clinical use of dietary n-3 PUFAs in the intervention of T2D and other NLRP3 inflammasome-driven inflammatory diseases.
 |
| | Fig. 6 Schematic depiction of the role of endogenous n-3 PUFAs, such as DHA in hyperglycemia-induced insulin resistance in adipose tissues. Hyperglycemia induces TXNIP expression and triggers NLRP3 inflammasome-dependent IL-1β secretion, which is counteracted by n-3 PUFAs such as DHA through the PI3K/Akt pathway-mediated downregulation of TXNIP in adipose pre-adipocytes. | |
Author contributions
Z-Z Zou and J-J Zhang designed the study; Q-Q Yu, T-T Wang, and Y Yang performed the experiments and data analysis: C–X He collected and analysed references; F Wang and W-G Yang analysed data and performed statistical analysis; Z-Z Zou wrote the manuscript. All authors contributed to the manuscript review and approved the final version of the manuscript.
Conflicts of interest
The authors declare that there are no conflicts of interest.
Acknowledgements
This work was supported by National Key R&D Program of China (grant no. 2018YFD0901105, 2020YFD0900900), and partly sponsored by the Fang Runhua Fund of Hong Kong, the K.C. Wong Magna Fund of Ningbo University, Zhejiang Key Laboratory of Pathophysiology (grant no. 201802), the Natural Science Foundation of Zhejiang (grant no. LY19H030001), the Ningbo Civil Natural Science Foundation of China (grant no. 2018A610377, 2018A610370 and 2019A610253), and the Medical Science and Technology of Zhejiang Province (grant no. 2018KY726).
References
- American Diabetes, Diagnosis and classification of diabetes mellitus, Diabetes Care, 2009, 32(Suppl 1), S62–S67 CrossRef.
- J. Delarue, Are marine n -3 fatty acids protective towards insulin resistance? From cell to human, Proc. Nutr. Soc., 2020, 1–11 CrossRef.
- N. Kobyliak, T. Falalyeyeva, G. Mykhalchyshyn, N. Molochek, O. Savchuk, D. Kyriienko and I. Komisarenko, Probiotic and omega-3 polyunsaturated fatty acids supplementation reduces insulin resistance, improves glycemia and obesity parameters in individuals with type 2 diabetes: a randomised controlled trial, Obes. Med., 2020, 17, 100248 CrossRef.
- D. Fedor and D. S. Kelley, Prevention of insulin resistance by n-3 polyunsaturated fatty acids, Curr. Opin. Clin. Nutr. Metab. Care, 2009, 12, 138–146 CrossRef CAS.
- D. Lucero, C. Olano, M. Bursztyn, C. Morales, A. Stranges, S. Friedman, E. V. Macri, L. Schreier and V. Zago, Supplementation with n-3, n-6, n-9 fatty acids in an insulin-resistance animal model: does it improve VLDL quality?, Food Funct., 2017, 8, 2053–2061 RSC.
- A. S. Greenberg and M. L. Mcdaniel, Identifying the links between obesity, insulin resistance and beta-cell function: potential role of adipocyte-derived cytokines in the pathogenesis of type 2 diabetes, Eur. J. Clin. Invest., 2015, 32, 24–34 CrossRef.
- M. Kassem, F. Philippe and W. Isabelle, Adipose Tissue in Obesity-Related Inflammation and Insulin Resistance: Cells, Cytokines, and Chemokines, ISRN Inflammation, 2013, 2013, 139239 Search PubMed.
- B. S. Marc and Y. Donath, Increased IL-1β activation, the culprit not only for defective insulin secretion but also for insulin resistance?, Cell Res., 2011, 21, 995–997 CrossRef.
- X. Bi, H. Ai, Q. Wu, Q. Fan and W. Ding, Insulin Resistance Is Associated with Interleukin 1β (IL-1β) in Non-Diabetic Hemodialysis Patients, Med. Sci. Monit., 2018, 24, 897–902 CrossRef CAS.
- M. S. J. Mangan, E. J. Olhava, W. R. Roush, S. H. Martin, G. D. Glick and L. Eicke, Targeting the NLRP3 inflammasome in inflammatory diseases, Nat. Rev. Drug Discovery, 2018, 17, 588–606 CrossRef CAS.
- A. Abderrazak, T. Syrovets, D. Couchie, K. El Hadri, B. Friguet, T. Simmet and M. Rouis, NLRP3 inflammasome: from a danger signal sensor to a regulatory node of oxidative stress and inflammatory diseases, Redox Biol., 2015, 4, 296–307 CrossRef CAS.
- B. Vandanmagsar, Y. H. Youm, A. Ravussin, J. E. Galgani, K. Stadler, R. L. Mynatt, E. Ravussin, J. M. Stephens and V. D. Dixit, The NLRP3 inflammasome instigates obesity-induced inflammation and insulin resistance, Nat. Med., 2011, 17, 179–188 CrossRef CAS.
- K. V. Swanson, M. Deng and J. P. Ting, The NLRP3 inflammasome: molecular activation and regulation to therapeutics, Nat. Rev. Immunol., 2019, 19, 477–489 CrossRef CAS.
- R. Zhou, A. Tardivel, B. Thorens, I. Choi and J. Tschopp, Thioredoxin-interacting protein links oxidative stress to inflammasome activation, Nat. Immunol., 2010, 11, 136–140 CrossRef CAS.
- T. B. Koenen, R. Stienstra, L. J. v. Tits, J. d. Graaf, A. F. H. Stalenhoef, L. A. B. Joosten, C. J. Tack and a. M. G. Netea, Hyperglycemia Activates Caspase-1 and TXNIP-Mediated IL-1β Transcription in Human Adipose Tissue, Diabetes, 2011, 60, 517–524 CrossRef CAS.
- Y. Yan, W. Jiang, T. Spinetti, A. Tardivel, R. Castillo, C. Bourquin, G. Guarda, Z. Tian, J. Tschopp and R. Zhou, Omega-3 fatty acids prevent inflammation and metabolic disorder through inhibition of NLRP3 inflammasome activation, Immunity, 2013, 38, 1154–1163 CrossRef CAS.
- V. A. Mustad, S. Demichele, Y. S. Huang, A. Mika, N. Lubbers, N. Berthiaume, J. Polakowski and B. Zinker, Differential effects of n-3 polyunsaturated fatty acids on metabolic control and vascular reactivity in the type 2 diabetic ob/ob mouse, Metab., Clin. Exp., 2006, 55, 1365–1374 CrossRef CAS.
- U. Risérus, Fatty acids and insulin sensitivity, Curr. Opin. Clin. Nutr. Metab. Care, 2008, 11, 100–105 CrossRef.
- J. X. Kang, From Fat to Fat-1: A Tale of Omega-3 Fatty Acids, J. Membr. Biol., 2005, 206, 165–172 CrossRef CAS.
- Q. Jia, J. R. Lupton, R. Smith, B. R. Weeks, E. Callaway, L. A. Davidson, W. Kim, Y. Y. Fan, P. Yang, R. A. Newman, J. X. Kang, D. N. McMurray and R. S. Chapkin, Reduced colitis-associated colon cancer in Fat-1 (n-3 fatty acid desaturase) transgenic mice, Cancer Res., 2008, 68, 3985–3991 CrossRef CAS.
- K. H. Weylandt, L. F. Krause, B. Gomolka, C. Y. Chiu, S. Bilal, A. Nadolny, S. F. Waechter, A. Fischer, M. Rothe and J. X. Kang, Suppressed liver tumorigenesis in fat-1 mice with elevated omega-3 fatty acids is associated with increased omega-3 derived lipid mediators and reduced TNF-alpha, Carcinogenesis, 2011, 32, 897–903 CrossRef CAS.
- K. A. Kimmerling, S. J. Oswald, J. L. Huebner, D. Little, V. B. Kraus, J. X. Kang, C. L. Wu and F. Guilak, Transgenic conversion of omega-6 to omega-3 polyunsaturated fatty acids via fat-1 reduces the severity of post-traumatic osteoarthritis, Arthritis Res. Ther., 2020, 22, 83 CrossRef CAS.
- C. He, X. Qu, L. Cui, J. Wang and J. X. Kang, Improved spatial learning performance of fat-1 mice is associated with enhanced neurogenesis and neuritogenesis by docosahexaenoic acid, Proc. Natl. Acad. Sci. U. S. A., 2009, 106, 11370–11375 CrossRef CAS.
- J. Kang, Fat-1 transgenic mice convert 1-6 to n-3 fatty acids, Nature, 2004, 427, 504–505 CrossRef CAS.
- O. M. Finucane, C. L. Lyons, A. M. Murphy, C. M. Reynolds, R. Klinger, N. P. Healy, A. A. Cooke, R. C. Coll, L. Mcallan and K. N. Nilaweera, Monounsaturated fatty acid-enriched high-fat diets impede adipose NLRP3 inflammasome-mediated IL-1β secretion and insulin resistance despite obesity, Diabetes, 2015, 64, 2116–2128 CrossRef CAS.
- G. Lopez-Castejon, N. M. Luheshi, V. Compan, S. High, R. C. Whitehead, S. Flitsch, A. Kirov, I. Prudovsky, E. Swanton and D. Brough, Deubiquitinases regulate the activity of caspase-1 and interleukin-1beta secretion via assembly of the inflammasome, J. Biol. Chem., 2013, 288, 2721–2733 CrossRef CAS.
- J. Bellenger, S. Bellenger, L. Clément, S. Mandard, C. Diot, J. P. Poisson and M. Narce, A new hypotensive polyunsaturated fatty acid dietary combination regulates oleic acid accumulation by suppression of stearoyl CoA desaturase 1 gene expression in the SHR model of genetic hypertension, FASEB J., 2004, 18, 773–775 CrossRef CAS.
- S. Y. Hong, F. X. Yu, Y. Luo and T. Hagen, Oncogenic activation of the PI3K/Akt pathway promotes cellular glucose uptake by downregulating the expression of thioredoxin-interacting protein, Cell. Signalling, 2016, 28, 377–383 CrossRef CAS.
- Z. C. M. Antonio and M. Julio, Reactive Oxygen Species Evoked by Potassium Deprivation and Staurosporine Inactivate Akt and Induce the Expression of TXNIP in Cerebellar Granule Neurons, Oxid. Med. Cell. Longevity, 2017, 2017, 8930406 Search PubMed.
- P. C. Calder, n-3 Fatty acids, inflammation and immunity: new mechanisms to explain old actions, Proc. Nutr. Soc., 2013, 72, 326–336 CrossRef CAS.
- A. A. De Boer, J. M. Monk, D. M. Liddle, A. L. Hutchinson, K. A. Power, D. W. L. Ma and L. E. Robinson, Fish-oil-derived n-3 polyunsaturated fatty acids reduce NLRP3 inflammasome activity and obesity-related inflammatory cross-talk between adipocytes and CD11b+ macrophages, J. Nutr.
Biochem., 2016, 34, 61–72 CrossRef CAS.
- A. Wallin, D. D. Giuseppe, N. Orsini, P. S. Patel and N. G. Forouhi, Fish Consumption, Dietary Long-Chain n-3 Fatty Acids, and Risk of Type 2 Diabetes: Systematic review and meta-analysis of prospective studies, Diabetes Care, 2012, 918–929 CrossRef CAS.
- D. H. Bak, E. Zhang, M. H. Yi, D. K. Kim, K. Lim, J. J. Kim and D. W. Kim, High ω3-polyunsaturated fatty acids in fat-1 mice prevent streptozotocin-induced Purkinje cell degeneration through BDNF-mediated autophagy, Sci. Rep., 2015, 5, 15465 CrossRef CAS.
- J. Bellenger, S. Bellenger, A. Bataille, K. A. Massey, A. Nicolaou, M. Rialland, C. Tessier, J. X. Kang and M. Narce, High pancreatic n-3 fatty acids prevent STZ-induced diabetes in fat-1 mice: inflammatory pathway inhibition, Diabetes, 2011, 60, 1090–1099 CrossRef CAS.
- W. M. Hwang, H. B. Dong, H. K. Dong, Y. H. Ju and M. L. Dong, Attenuation of streptozotocin-induced pancreatic beta cell death in transgenic fat-1 mice via autophagy activation, Endocrinol. Metab., 2015, 30, 569–575 CrossRef CAS.
- F. Zatterale, M. Longo, J. Naderi, G. A. Raciti and F. Beguinot, Chronic Adipose Tissue Inflammation Linking Obesity to Insulin Resistance and Type 2 Diabetes, Front. Physiol., 2020, 10, 1607–1626 CrossRef.
- L. K. Heilbronn and L. V. Campbell, Adipose tissue macrophages, low grade inflammation and insulin resistance in human obesity, Curr. Pharm. Des., 2008, 14, 1225–1230 CrossRef CAS.
- A. Asghar and N. Sheikh, Role of immune cells in obesity induced low grade inflammation and insulin resistance, Cell. Immunol., 2017, 315, 18–26 CrossRef CAS.
- C. Soonkyu, L. P. Kathleen, M. Kristina, K. Arion, B. S. Maria and M. K. Mcintosh, Preadipocytes mediate lipopolysaccharide-induced inflammation and insulin resistance in primary cultures of newly differentiated human adipocytes, Endocrinology, 2006, 5340–5351 Search PubMed.
- A. Eljaafari, M. Robert, M. Chehimi, S. Chanon, C. Durand, G. Vial, N. Bendridi, A. M. Madec, E. Disse and M. Laville, Adipose tissue-derived stem cells from obese subjects contribute to inflammation and reduced insulin response in adipocytes through differential regulation of the Th1/Th17 balance and monocyte activation, Diabetes, 2015, 64, 2477–2488 CrossRef CAS.
- D. Su, G. M. Coudriet, D. H. Kim, Y. Lu, G. Perdomo, S. Qu, S. Slusher, H. M. Tse, J. Piganelli and N. Giannoukakis, FoxO1 Links Insulin Resistance to Proinflammatory Cytokine IL-1β Production in Macrophages, Diabetes, 2009, 58, 2624–2633 CrossRef CAS.
- H. Khodabandeloo, S. Gorgani-Firuzjaee, S. Panahi and R. Meshkani, Molecular and cellular mechanisms linking inflammation to insulin resistance and β-cell dysfunction, Transl. Res., 2015, 167, 228–256 CrossRef.
- C. Herder, A. G. Tabák, E. J. Brunner, N. C. Schloot, W. Rathmann, D. R. Witte and K. Strassburger, Elevated levels of the anti-inflammatory Interleukin-1 Receptor Antagonist Precede the Onset of Type 2 Diabetes, Diabetes Care, 2009, 32, 421–423 CrossRef.
- O. Osborn, S. E. Brownell, M. Sanchez-Alavez, D. Salomon, H. Gram and T. Bartfai, Treatment with an Interleukin 1 beta antibody improves glycemic control in diet-induced obesity, Cytokine, 2008, 44, 141–148 CrossRef CAS.
- M. G. Elgort, J. M. O'Shea, Y. Jiang and D. E. Ayer, Transcriptional and Translational Downregulation of Thioredoxin Interacting Protein Is Required for Metabolic Reprogramming during G1, Genes Cancer, 2010, 1, 893–907 CrossRef CAS.
- M. Akbar, F. Calderon, Z. Wen and H. Y. Kim, Docosahexaenoic acid: A positive modulator of Akt signaling in neuronal survival, Proc. Natl. Acad. Sci. U. S. A., 2005, 102, 10858–10863 CrossRef CAS.
Footnotes |
| † Electronic supplementary information (ESI) available. See DOI: 10.1039/d0fo02092c |
| ‡ These authors contributed equally to this work. |
|
| This journal is © The Royal Society of Chemistry 2021 |
Click here to see how this site uses Cookies. View our privacy policy here. 
 d,
Wenge
Yang
a,
JinJie
Zhang
*a and
Zuquan
Zou
d,
Wenge
Yang
a,
JinJie
Zhang
*a and
Zuquan
Zou