 Open Access Article
Investigation of clogging in porous media induced by microorganisms using a microfluidic application
Calvin Lumban
Gaol
 *a,
Leonhard
Ganzer
a,
Soujatya
Mukherjee
b and
Hakan
Alkan
b
aInstitute of Subsurface Energy Systems, TU Clausthal, Agricolastrasse 10, 38678, Clausthal-Zellerfeld, Germany. E-mail: calvin.lumban.gaol@tu-clausthal.de; Fax: +49 5323 72 99 3910; Tel: +495323722449
bWintershall Dea GmbH, Friedrich-Ebert-Str. 160, 34119, Kassel, Germany
First published on 8th December 2020
Abstract
The presence of microorganisms could alter the porous medium permeability, which is vital for several applications, including aquifer storage and recovery (ASR), enhanced oil recovery (EOR) and underground hydrogen storage. The objective of this work was to investigate the effect of bacteria and their metabolism products on clogging using micromodels under elevated pressure and temperature and anaerobic conditions. Novel micromodels (real-structure) were fabricated based on μCT images of a Bentheimer core plug to mimic the reservoir conditions. As a result, in situ bacteria growth, biomass accumulation, biofilm formation and gas production were observed in the micromodel throughout the flooding experiments. During the injection, microbes were partly transported (planktonic) through the micromodel and the sessile attached to the model surface, causing a reduction in permeability (PRF). The results showed that the PRFs in artificial-structure micromodels are in line with the Kozeny–Carman model. Meanwhile biomass straining in small pore throats shows a more significant impact on the permeability reduction in real-structure micromodels. The injection of tracer particles after incubation showed a water flow diversion that confirmed bioclogging in the micromodels. The bioclogging evaluation presented in this work improved the understanding of the clogging process in porous media and can support ASR and EOR studies on a larger scale before field implementation.
Water impactUnderstanding of bioclogging is crucial for several engineering applications, from wastewater disposal to enhanced oil recovery. We developed microfluidic chips based on real reservoir rocks that enable the investigation of bacteria growth, biomass accumulation and gas production at the pore-scale level. These newly generated chips improve the understanding of bacteria attachment and straining effects on bioclogging in porous media. |
1 Introduction
Understanding of clogging processes in porous media is essential for several environmental and petroleum engineering applications, including aquifer storage and recovery (ASR),1–3 enhanced oil recovery (EOR)4,5 and underground gas storage. The reduction of pore space leading to a decrease in porous medium permeability, generally referred to as clogging,6 can be a problem for some applications or a benefit for others, depending on its objectives. Based on a survey conducted by Dillon et al. (1994), 32 out of 40 aquifer injection wells had clogging problems, mainly caused by suspended solid particles, gas bubbles, microbial growth and mineral precipitation.7 Similar issues were reported by Bloetscher et al. (2014), where several ASR sites in the United States encountered a reduction in injection (recharge) rates due to clogging problems.2 However, this clogging could be beneficial for other purposes, such as in microbial enhanced oil recovery (MEOR) applications. Improvement of oil displacement efficiency in a heterogeneous reservoir could be achieved by blocking the high permeability layer so that the remaining oil in low permeability zones can be displaced.8Clogging in porous media is a complex process governed by physical, chemical (physicochemical) and biological processes, which in most cases are related to each other.3,9 Jeong et al. (2018) described that physicochemical clogging is mainly induced by suspended solids, fine aquifer sediments, gas bubbles (entrapped air and biogenic gases) and mineral precipitation, while the growth of microorganisms and biomass accumulation are the primary causes of biological clogging.1 The physicochemical processes are mainly governed by rock properties such as pore size and permeability.10 However, these rock properties can be altered by physical filtration and straining processes during microbial growth and transport in porous media.
The physical filtration and straining processes represent the microbe extraction from solution by physical forces in porous media. Physical filtration occurs when microbes are removed from the solution caused by attachment and sedimentation.9 The attachment process in porous media is strongly related to biological processes, particularly microbial growth. During metabolism, cells produce natural polymers, which are called extracellular polymeric substances (EPS). This polymer then forms a biofilm that reduces the pore size and permeability of porous media.6 Moreover, the straining process or mechanical trapping occurs when the pore throats are too narrow for microbes to flow. The ratio between the bacteria diameter and the pore size is the primary determinant for straining to occur; for example, Matthess and Pekdeger (1985) defined that the ratio must be higher than 1.5.45
Numerous studies have investigated bioclogging in porous media at different scales such as those in column reactors, core plugs and sandpacks, as well as in micromodels. Microfluidic applications offer several benefits for investigating bioclogging in porous media, particularly for visualization of microbes and biomass at the pore-scale level.6,11–14 Dupin and McCarty (2000)16 and Kim and Fogler (2000)15 reported the utilization of silicon and glass etched micromodels to investigate clogging phenomena in porous media. These micromodels were constructed with a rectangular pattern of channels (mean width of 75 and 123 μm) and nodes (pore space of 500 μm) and an etching depth of 200 μm.16 Their results showed that the attachment of microorganisms onto the micromodel surface could be the most significant factor for reducing the permeability. Kirk et al. (2012)11 and Deng et al. (2013)12 used a reactor filled with glass beads to investigate the bioclogging in porous media and the effect of biofilm permeability on the fluid flow behavior. Their results showed that the permeability could be significantly reduced due to biomass clogging in porous media. In addition, Deng et al. (2013)12 and Karimifard et al. (2020)13 reported that the biofilm permeability and volume ratio are essential factors affecting the bulk permeability of clogged porous media based on the integration of microfluidic experiments and simulation studies. Although micromodels are perfect for visualizing bioclogging in porous media, most of the investigation was conducted in artificial network chips and few researchers have addressed the pore structure effect. The most recent work by Zhou et al. (2020)14 described the effect of the porous media's morphologies on infiltration flow properties with biofilm growth. They used micromodels constructed based on X-ray images of a column reactor filled with different filter media (i.e., zeolite, gravel and ceramsite). Their report showed that the grain morphologies and biomass accumulation significantly affected the porous media's fluid flow behavior.
Furthermore, some studies have shown that in situ gas produced by bacteria such as methane, carbon dioxide and hydrogen could cause clogging17 and also change the fluid mobilities4 in porous media. Beckwith and Baird (2001)17 reported a reduction in hydraulic conductivity in a column filled with peat due to gas bubbles. Their study showed that the hydraulic conductivity was 5–8 times lower than the case without gas bubbles. However, at a certain pressure level where all produced gas dissolves in liquid (no trapped bubbles), the liquid viscosity will be reduced, thus improving the fluid mobilities in porous media. Under two-phase conditions where water and oil exist in the reservoir, gases generated during MEOR processes are dissolved in both phases. Alkan et al. (2014) reported a decrease in oil viscosity in batch experiments due to the dissolution of CO2 in the oil.4 This viscosity reduction effect could be beneficial for EOR applications.
This study's objective was to understand the effects of bacteria attachment, biomass straining, and the gas bubbles produced during metabolism on the porous medium permeability. Clogging induced by chemical processes was not covered in this work. Real-structure micromodels generated based on μCT images of real rocks and artificial structure micromodels were used to understand the effects of pore morphologies on the bioclogging process. Furthermore, the Kozeny–Carman analytical model was used to control the measurement data quality.
2 Materials and methods
2.1 Fluids, microorganisms and nutrients
The fluids used in this work were sampled from a German high-salinity oil field screened for MEOR field applications (Table 1). As shown in this table, the brine contains several ion components originally present in the reservoir. In this work, no modification of the water composition was performed since one of this study's objectives was to mimic the real reservoir conditions. Therefore effects of the specific composition of chemicals on the MEOR process and bacteria growth are not covered in this paper. In addition, the reservoir brine contains various bacteria families (reservoir community), including Halanaerobiaceae, Halobacteriaceae, Methanomicrobiaceae, Desulfovibrionales (sulfate-reducing bacteria) and Deferribacteraceae (nitrate, iron and manganese reducers).18 As shown in Fig. 1, the reservoir brine's bacteria community is dominated by the Halobacteriaceae and Halanaerobiaceae families.19These families are fermentative microorganisms living in high salinity environments (halophilic) and could only live under anaerobic conditions. The metabolic pathway of these bacteria is mixed-acid fermentation with H2, CO2, ethanol, and acetic, formic, lactic and succinic acids as end-products of the fermentation.8,20| Properties/component | Value | Unit |
|---|---|---|
| Density | 1114 | kg m−3 |
| Total dissolved solids (TDS) | 186 | g L−1 |
| Viscosity at 37 °C | 1.18 | mPa s |
| pH | 5.7 | [−] |
| Iron | 86 | mg L−1 |
| Sulfate | 66.5 | mg L−1 |
| Calcium | 14![[thin space (1/6-em)]](https://www.rsc.org/images/entities/char_2009.gif) 000 000 |
mg L−1 |
| Sodium | 45![[thin space (1/6-em)]](https://www.rsc.org/images/entities/char_2009.gif) 900 900 |
mg L−1 |
| Magnesium | 2245 | mg L−1 |
| Chloride | 106![[thin space (1/6-em)]](https://www.rsc.org/images/entities/char_2009.gif) 611 611 |
mg L−1 |
| Nitrate | 3.3 | mg L−1 |
| Phosphate | <2 | mg L−1 |
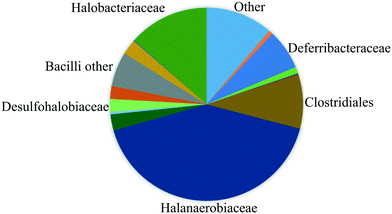 | ||
| Fig. 1 Composition of the bacteria communities sampled from the reservoir determined by using pyrosequencing of 16S DNA (after Kögler, 2020 (ref. 19)). | ||
A nutrient concentrate (diluted 100× in sterile ultra-pure water) containing sucrose, yeast extract and molybdate was used to stimulate the growth of microorganisms.19 In this work, the molybdate was used to mitigate H2S formation during the metabolism.21 Before injection, 100 mL brine in an anoxic bottle was gently mixed and stirred languorously with 1.0 mL nutrient concentrate under sterile and anaerobic conditions to reach the defined concentration for creating MEOR effects. In addition, for maintaining a stable pH during experiments, 100 mM 2-(N-morpholino)ethanesulfonic acid (MES) was added as a pH buffer.19,21
2.2 Experimental setup
Fig. 2 shows a schematic of the experimental setup used in this study. This setup consists of three primary systems comprising the fluid handling, image acquisition and micromodel system. The fluid handling system's primary role was to transfer different fluids into the micromodel under anaerobic and uncontaminated (free from extraneous microorganisms) conditions. In this work, tubing (ID 0.5 mm/OD 1/16′′) and valves (Idex P-732 Natural PEEK, Upchurch Scientific Inc.) based on the polyether ether ketone (PEEK) material were used to maintain anaerobic conditions (gas permeability of PEEK: 14 cm3/100 in2 × 24 h × atm mil−1 at 25 °C (ref. 22)). Moreover, a low-flow syringe pump (Harvard Pump 11 Elite Series, Harvard Apparatus Ltd.) and PD-33X differential pressure transmitters with an accuracy of ±1.5 mbar (±0.05% of full-scale range, Keller GmbH) were used to provide high-accuracy injection rates and to measure the differential pressure across the micromodel during flooding experiments, respectively. The image acquisition system composed of an inverted epifluorescence microscope and a CCD camera (Axio Imager.Z2m, Carl Zeiss GmbH) was used to obtain high-resolution images during the flooding process, mainly to visualize bacteria in micromodels. The last system was the micromodel system, which consists of a micromodel and a holder integrated with a heating system. This integrated holder was used to maintain the working temperature of the micromodel, particularly during bacteria incubation. With this setup configuration, flooding experiments could be operated at temperatures up to 90 °C and a backpressure of 10 bar (g).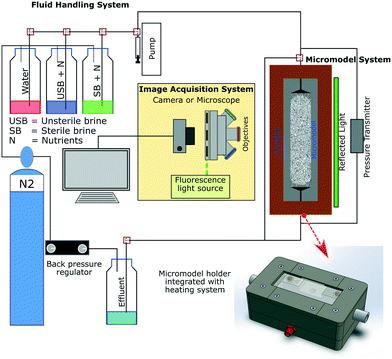 | ||
| Fig. 2 Schematic of the experimental microfluidic setup used for flooding experiments (after Gaol et al., 2020 (ref. 23)). | ||
Two types of glass–silicon–glass (GSG) micromodels, artificial- and real-structure, were used for the flooding experiments. As shown in Fig. 3a and Table 2, the artificial-structure micromodel was a quarter five-spot (typical injector and producer well patterns in oil and gas reservoirs) chip with a porosity of 27.6% and a permeability of 13 Darcy. The real-structure micromodel (linear model) was generated based on the properties and morphological features of reservoir rocks. A new workflow was developed to construct a digital 3D model based on μCT images of a Bentheimer core plug and transfer its properties into a 2D microfluidic chip.23 The properties of real-structure micromodels, including porosity, pore and grain size distribution, tortuosity and permeability, were designed to mimic real rocks' properties. Therefore the fluid flow behavior in these micromodels was considered more representative of reservoir conditions than that in the artificial-structure micromodels. Fig. 3b shows the image of a real-structure micromodel with an average porosity and permeability of 19.2% and 1.2 Darcy, respectively. The other main difference between the two different chips was the pore size distribution, where the average pore diameter of the artificial- and real-structure micromodels was 178.2 and 35.1 μm, respectively. This difference was because the artificial-structure was generated by randomly distributing radial grains while the pore size distribution of real-structure micromodels was dependent on the Bentheimer core plug properties. A detailed description of the design and construction of the micromodels was reported by Gaol et al. (2020).23
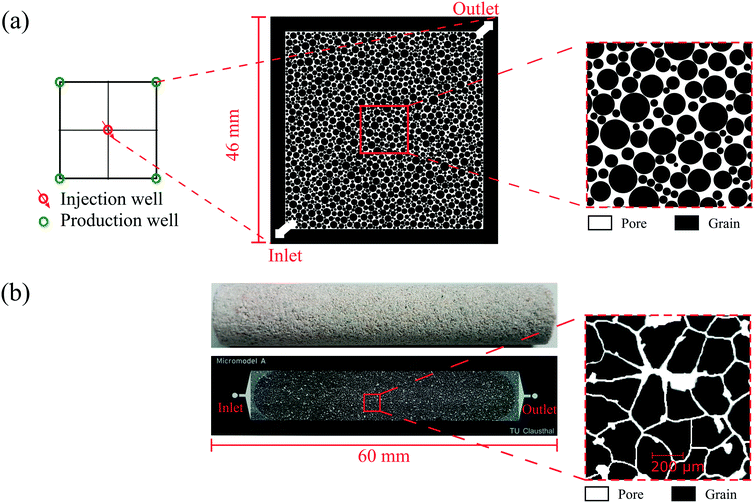 | ||
| Fig. 3 Image of micromodels used for flooding experiments: (a) artificial- and (b) real-structure based on μCT images of a Bentheimer core plug. | ||
| Rock properties | Micromodel structures | |
|---|---|---|
| Artificial | Real | |
| Porosity (−) | 0.28 | 0.19 |
| Pore volume (mm3) | 22.07 | 4.30 |
| Permeability (milliDarcy) | 13![[thin space (1/6-em)]](https://www.rsc.org/images/entities/char_2009.gif) 250 250 |
1237 |
| Mean pore size (μm) | 178.23 | 31.50 |
| Mean grain size (μm) | 895.62 | 178.15 |
| Surface area (mm2) | 1120 | 404 |
2.3 Experimental procedure
The flooding experiments were started by establishing anaerobic and sterile conditions in the setup. The microfluidic setup was evacuated for at least 2 hours and then connected to pre-purified N2 bottles. To sterilize the microfluidic setup, isopropanol was used and then it was rinsed with distilled water, which was already boiled and purged with N2 for one hour. Subsequently, visual inspection was performed using a microscope (40× magnification) to confirm the sterile conditions.There were two types of single-phase flow experiments performed in this study: sterile (without bacteria) and unsterile (with bacteria) experiments. The sterile flooding tests were used as a benchmark to investigate microbial activity and metabolites produced during unsterile experiments. Similar brine was used for both tests, and only for the sterile analysis, the reservoir brine was filtered through a 0.2 μm filter (Stericup, Merck Millipore)24 to remove the target microorganisms (mainly the Halobacteriaceae and Halanaerobiaceae families). Based on previous studies reported by Alkan et al. (2016)25 and Klueglein et al. (2016),5 these families were the only bacteria groups that generated MEOR effects for the target reservoir while other bacterial species had little or no effect. They also reported that the average diameter of one microbe cell based on scanning electron microscopy (SEM) was ∼2 μm.5,25
Both sterile and unsterile experiments were performed by injecting 10 pore volume (PV) of the brine + nutrients through the water-saturated micromodel. The injection rates used in this experiment were 1 μL min−1 and 0.2 μL min−1 (equivalent to ∼2–3 ft per day Darcy velocity) for the artificial- and real-structure micromodels, respectively. The difference in the injection rates was due to the variation of micromodel dimensions and pore volume. The calculated Reynolds numbers based on these injection rates were in the range of ∼0.333–0.621, which was an indication that the flow regime of brine in the micromodels was laminar flow. Afterward, static incubation was performed for seven to ten days and during this time, images of the micromodel were obtained every day to observe the microbial growth. As a continuation, a solution of Syto™ green fluorescent nucleic acid stain (Syto-9) was injected through the micromodel after the static incubation. This injection was performed to stain the DNA of microorganisms in the micromodel.
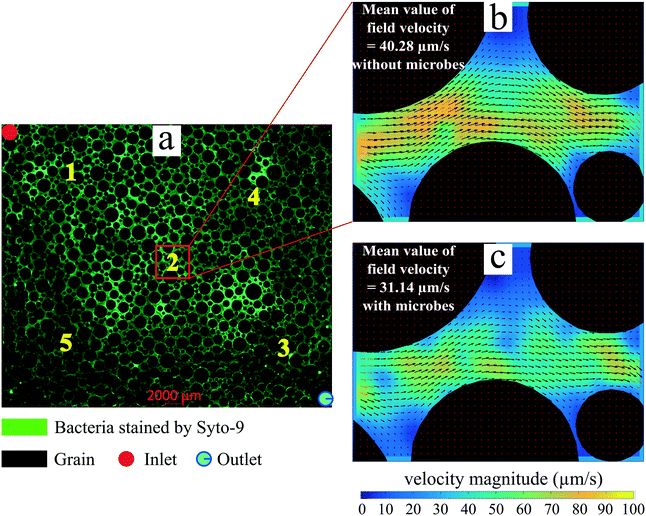
Subsequently, after the Syto-9 injection, tracer particles were injected to evaluate the effects of the bioclogging on the micromodels' fluid flow behavior. During the injection, streamlines and the field velocity of the tracer particles were evaluated. The field velocity of the tracer particles was estimated using a particle image velocimetry (PIV) tool.26 Then by comparing the velocity field of the tracer particles between the sterile and unsterile experiments, the bioclogging process in the micromodels was evaluated. In this work, all flooding experiments were performed at the reservoir temperature of 37 °C and backpressure of 6 bar (g). Solely for the investigation of in situ gas production, the backpressure was set to 1 bar (g).
2.4 Image processing and bacteria enumeration
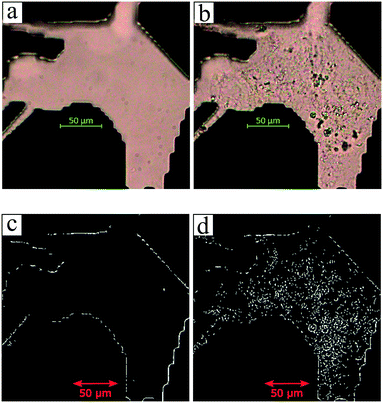
The utilization of the micromodels enables an in situ bacteria enumeration during the experiments. In this study, the approach to estimate the microbe concentration was analogous to the direct microscopic cell count by using a Petroff-Hausser chamber. An image processing tool was developed in MATLAB to process the raw images obtained during the experiment. This tool was used to estimate the microbe concentration and metabolism products, such as the gas production volume. The microbe concentration was estimated based on two different microscopy images. The first image was obtained by using bright-field light and the second image using fluorescence light. Fig. 4a and b show the typical raw bright-field images of the micromodel during static incubation at days 0 and 10, respectively. It should be noted that in these images, a few blurry areas were observed at several pore throats. This issue occurred because of the non-uniform surface roughness of the silicon and glass layer, as a result of the micromodel's bonding process.To estimate the microbe concentration, all raw images obtained during static incubation were converted into binary images. The size of one raw image captured with a 40× objective was 6300 × 4768 pixels with a resolution of 0.512 μm per pixel. The binary images contain the information of microorganisms (pixel = 1) which covered the pore space (pixel = 0). Then by computing all the microbes' matrix entry, the area covered by microorganisms was estimated. Since the bright-field images also captured all objects in the micromodel, including those that were not microorganisms, a reference image (image of the micromodel before incubation as shown in Fig. 4c) was used to avoid overestimation of the number of bacteria cells. This approach was performed by subtracting all the binary images during incubation (Fig. 4d) to the reference image. Then, the relative area (pixel2) covered by microbes (RAC) was used to determine the bacteria concentration Cm [cells per mL].
 | (1) |
The microbe concentration was estimated by dividing the RAC (μm2) with the area of the single-cell Acell [μm2] per unit volume. Moreover, based on the visual investigation, microbes can be located at different positions throughout the micromodel's thickness (50 μm in the Z-direction, vertically distributed in 3D). In this work, only one layer image was used to estimate the microbe concentration in the 3D domain. The layer was selected based on the most populated area in the Z-direction of the micromodel. Normally most of the microbes grew near the top or the bottom glass surface. Therefore, the typical channel's depth for the selected layer was in the range of ∼1–10 μm or ∼40–50 μm from the top glass surface of micromodels.
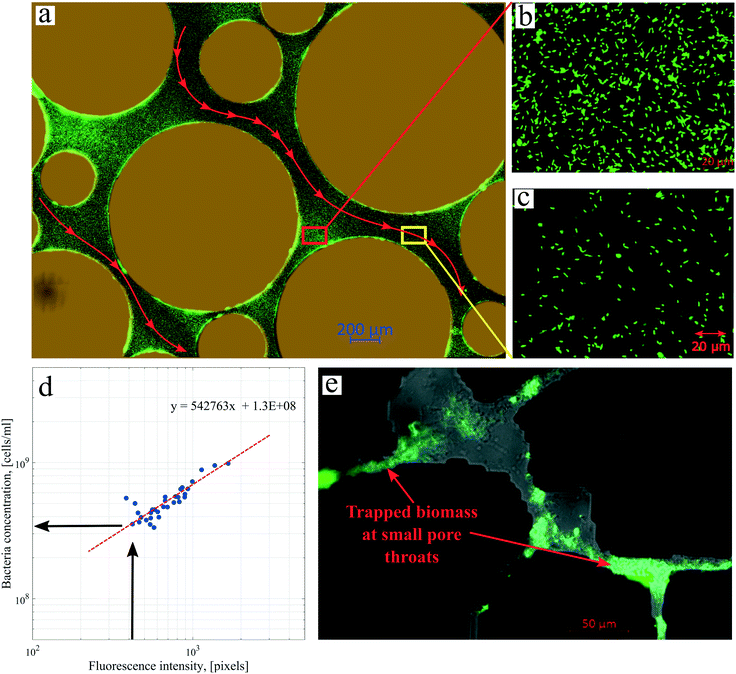
The second microscopy image was obtained by using fluorescence light after the injection of Syto-9. This image was used to differentiate viable and dead cells and biomass. However, since most of the planktonic microbes were displaced during the injection of Syto-9, only the sessile microbe concentration could be estimated. Additionally, image processing also facilitates the estimation of phase saturation in micromodels. During the static incubation at a backpressure of 1 bar (g), microorganisms produced in situ gas (free gas) as a metabolism product. Images of the micromodels were captured every day and used to estimate the produced gas saturation during the metabolism.
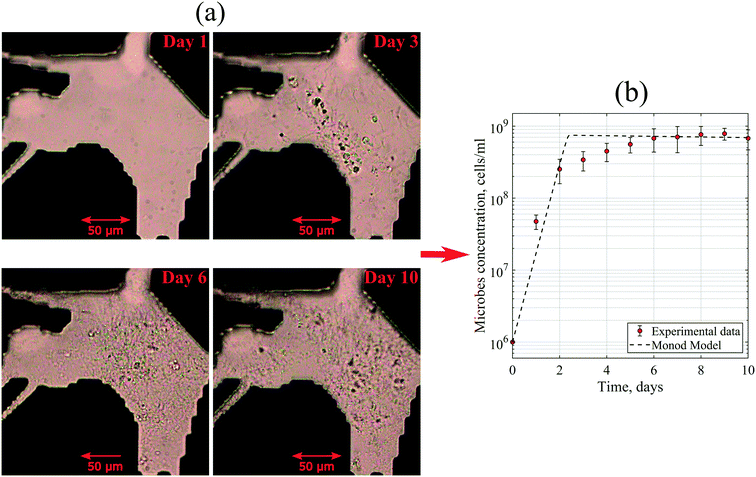
A 0D model was developed in MATLAB based on the Monod (without decay) kinetic equation27 to validate the bacteria concentration obtained during experiments. This model was developed based on the following first-order ordinary differential equations:
 | (2) |
 | (3) |
2.5 Estimation of permeability reduction
The bioclogging effect in the micromodels was evaluated by estimating the permeability change during the experiments. The permeability k [m2 = 1.013 × 10¹² Darcy] of the micromodels was estimated by using Darcy's law as described in the following equation: | (4) |
 | (5) |
The experimental PRF values were then compared to a mathematical model based on the Kozeny–Carman (KC) approach. The KC model is a well-established and relatively straight-forward mathematical model to evaluate the permeability, porosity and specific surface area.28,29 This model was developed for idealized porous media, which is relatively close to the micromodels used in this study. Although this analytical model cannot replace the experimental data, it can still be used to control the measurement data quality due to its internal consistency.30 Numerous studies have reported this model's application to evaluate the porosity and permeability change in porous media caused by many different processes, including particle sedimentation, swelling or microbial growth, and mineral precipitation.28 The modification of the original KC model was reported in the literature to estimate the effect of the surface area change on the permeability of porous media due to microbial growth or biomass deposition.31–33
The KC approach was derived by assuming a porous medium as a solid medium composed of a round pipe conduit bundle. Then by applying the Darcy law and Hagen–Poiseuille equation and introducing the specific surface area of the rock Sp, the relationship between the permeability k and porosity ϕ can be described as follows:
 | (6) |
 | (7) |
Subsequently, to evaluate the permeability change due to bioplugging, the ratio of the final and initial permeability can be estimated as follows:
 | (8) |
| Sp,bio = Sp,0 + Scell | (9) |
| Scell = NbΠDb2 | (10) |
 | (11) |
 | (12) |
 | (13) |
 | (14) |
As described in eqn (12), the permeability reduction due to bioclogging (PRF) could be estimated using the KC approach by calculating the surface area change due to attachment of microbes. This surface area change was determined based on the image processing on the micromodel images after incubation, particularly after injection of the Syto-9 solution. The other form of the relationship described in eqn (14) can be used to estimate PRF values based on the microbe concentration in the micromodel. In this calculation, the average bacteria diameter needs to be introduced. As previously mentioned, the average diameter of one microbe cell based on scanning electron microscopy (SEM) from previous studies was about 2 μm.5,25
3 Results and discussion
The result of benchmark experiments indicated that the microfluidic experimental setup was excellent for microbial investigations. Visual inspection indicated no microbial growth in the micromodel during the benchmark experiments, which confirmed sterile/uncontaminated conditions. In addition, the dissolved O2 content of the water was in the range of 200 ± 50 ppb (measured with an R-7501 dissolved oxygen refill, Karmina LTD). The results also showed no iron precipitation during the experiment, which was a confirmation of anaerobic conditions in the micromodel.3.1 Microorganism growth and transport
Moreover, to match the experimental data, the maximum specific growth rate of 3 day−1 and the yield coefficient of 3.75 × 10¹⁰ cells per g were defined in the Monod model. At the exponential phase, the generation time of these microbes was 4.3–6 hours. This generation time was slightly higher than the average value of Halobacteriaceae found in the literature. Robinson et al. (2005) reported that the generation times of halophilic bacteria ranged from 1.5 to 3.0 hours under optimum conditions.35 This dissimilarity could be explained by the diversity of the bacteria community in the reservoir brine used in this work with a variation of kinetic parameters.
Several images (Fig. 6b and d) from different micromodel positions were evaluated for the microbe enumeration. A relationship between the fluorescence intensity and the attached bacteria concentration from all these locations was established to quantify the attached bacteria concentration in the whole micromodel. As shown in Fig. 6d, the number of cells increased as the fluorescence intensity increased. The attached microbe concentration was 3.44 × 10⁸ cells per mL (standard deviation ±0.97 × 10⁸ cells per mL). This concentration was then used for the PRF calculation based on the KC analytical model. In addition, experiments with identical conditions were repeated three times with very similar results.
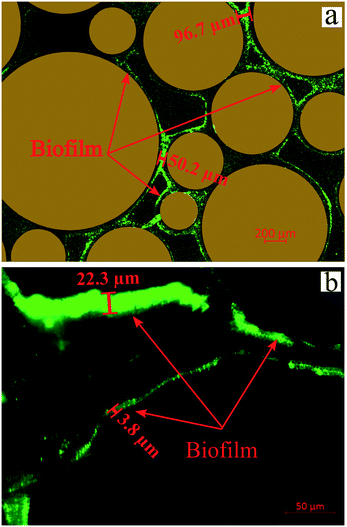 | ||
| Fig. 7 Images of biofilms after injection of Syto-9 in the (a) artificial-structure and (b) real-structure micromodels (scales are different in the images). | ||
Several studies have indicated that the biofilm impacts the fluid flow behavior in clogged porous media.11–14 Deng et al. (2013) and Karimifard et al. (2020) reported that the biofilm properties such as permeability and porosity play an essential role in permeability reduction due to bioclogging.12,13 Their report showed that the permeability reduction of clogged porous media is at the maximum level when the biofilm is impermeable based on experimental and numerical modeling results. Oppositely, the permeability reduction is smaller when the biofilm is permeable (i.e., kbiofilm > 10−11 m2). Their results also showed that the fluid flow path after bioclogging was highly dependent on the biofilm development, which was in agreement with our experimental results.
3.2 Permeability reduction
As mentioned previously, the differential pressure during the injection of the Syto-9 solution was used to estimate the permeability of the micromodels based on Darcy's law. As a result, the permeability reduction was observed in both micromodels. The micromodel's permeability was reduced from 1.2 to 0.67 Darcy (PRF = ∼0.56) for the real-structure micromodel and 13.5 to 10.9–12.6 Darcy (PRF = ∼0.81–0.94) for the artificial-structure micromodel. These PRF values were then compared to a mathematical model based on the KC approach given in eqn (14). It should be mentioned that in this work, the tortuosity [−] of porous media was assumed to be equal to 3 (generally between 2 and 4) and the unit correction constant was introduced to convert the microbe concentration from cells per mL to cells per m3.As can be concluded from Fig. 8, the experimental PRF values of the artificial-structure micromodels align with the KC model. However, this KC model delivers higher PRFs than experimental values for the real-structure micromodels, even assuming that all grown microbes contributed to the permeability reduction by adsorption and surface area change. As previously described in eqn (8), the KC model proposed by Kaster et al. (2011) only considers the change in specific surface area due to bacteria attachment.34 This result implies that other mechanisms contribute to the total permeability reduction in the real-structure micromodels.
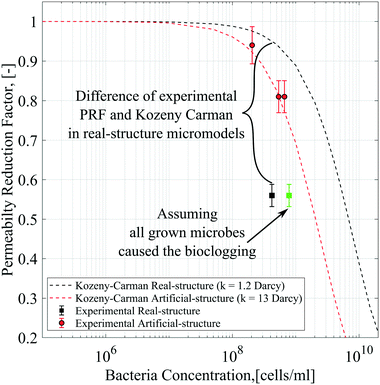 | ||
| Fig. 8 Permeability reduction factor based on differential pressure data compared to the Kozeny–Carman model. | ||
As mentioned previously, physiochemical processes can be distinguished between filtration and straining. Murphy and Ginn (2000) defined the solution's ionic strength, pH, and mineralogy as three main factors that governed microbe physical filtration in porous media.9 Since these three factors were similar in all flooding experiments, it could be inferred that the effect of physical filtration on permeability reduction should be similar for the artificial and real-structure micromodels. Moreover, the straining process or mechanical trapping occurs when the pore throats are too narrow for microbes to flow. This process most likely occurred in the real-structure micromodels, where the average pore diameter is about 31 μm and the pore morphology mimics the reservoir rock pore structure. Therefore, the difference in PRF values between the KC model and experimental data for the real-structure micromodel could be due to the straining process effect.
The experimental PRF values of the micromodels suggest that the KC approach could not accurately address the bioclogging effect, mainly when the pore throats are blocked (straining).31 Some criticisms of the KC approach were reported in the literature mainly because this method assumes that the porous media's permeability is only governed by the specific surface area or hydraulic radius.38 This approach failed to describe the porous media's fluid flow behavior with small pore throats or fissures that do not contribute much to the specific surface area and porosity but to the permeability. In our case, any blocking of the pore throats and fissures due to biomass agglomeration should result in more permeability reduction, as we observed in the experiments. Several researchers have proposed different models to evaluate the straining effect during bacteria transport in porous media, including Harvey and Garabedian (1991), Lindqvist and Enfield (1992), Sarkar et al. (1994), Blanc et al. (1996), Thullner (2000) and many others.6,31,39–41,46 One of the examples proposed by Civan (2001) included the valve effect on the permeability reduction model to facilitate the pore-throat plugging. By introducing the pore throat connectivity parameter Γ, the PRF value can be obtained as follows:31,42
 | (15) |
Furthermore, it was found that the permeability reduction in the micromodels was related to the injection volume of nutrients and the kinetic properties of bacteria. Our experimental PRF values were comparable with the results reported by Kim and Fogler (2000).15 Their results showed that after 30 PV injection of nutrients, the micromodels' permeability was decreased to 0.9 of the initial value. Kim and Fogler (2000)15 also reported that the PRF dropped to 0.01 as the injection of nutrients reached 131 PV. These low PRF values were also reported by Klueglein et al. (2016)5 and Kim et al. (2010).43 Their report showed that by continuously injecting nutrients for a more extended period, the porous media's permeability could be reduced to 0.01–0.03 of the initial value.
| Point | Area | Mean velocity field magnitude of tracer particles (μm s−1) | |
|---|---|---|---|
| Sterile case | Unsterile case | ||
| 1 | Inlet | 36.72 | 17.00 |
| 2 | Middle | 40.28 | 31.14 |
| 3 | Outlet | 36.40 | 21.39 |
| 4 | Right corner | 11.26 | 16.08 |
| 5 | Left corner | 14.65 | 22.06 |
3.3 In situ gas production
As mentioned in the methodology, to investigate in situ gas production by microorganism metabolism, single-phase flooding experiments were performed under 1 bar (g) backpressure. During the static incubation, the free-gas saturation develops, as shown in Fig. 10. At the end of incubation, the micromodel's gas saturation was measured to be 18% of the total pore volume. These gas bubbles magnified the clogging effect in porous media, indicated by a lower PRF value than previous experiments where all produced gas was dissolved in the brine. Due to gas bubbles, the PRF values of the artificial-structure micromodels were decreased from 0.81–0.94 to 0.69. Based on these results, it was suggested that the presence of gas bubbles under moderately low pressure, for example, 1 bar (g), could significantly alter the fluid flow behavior in porous media. However, under certain conditions, such as in oil reservoirs where the pressure is sufficiently large, almost all the produced CO2 dissolves in the liquid phase.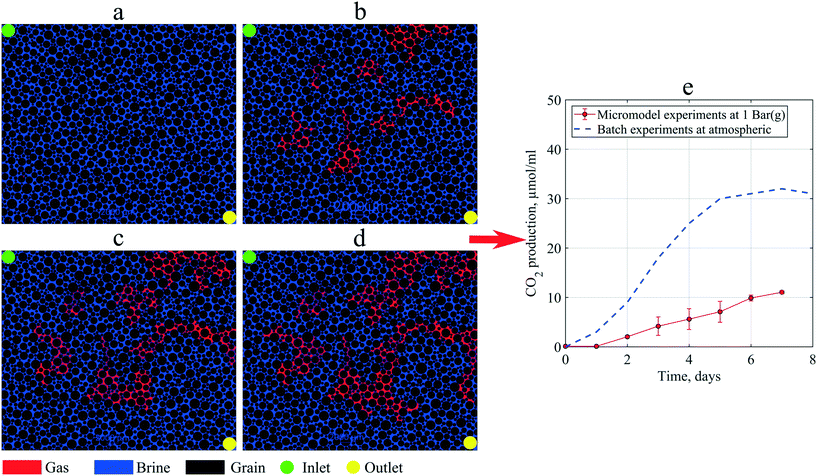 | ||
| Fig. 10 Images of the micromodel indicating in situ gas (red color) production by microorganisms during static incubation: (a) day 0, (b) day 3 (c) day 5, and (d) day 7, and (e) CO2 production in micromodel experiments compared to batch experiments (after Alkan et al. (2020)44). | ||
Previous studies indicated that 80% of gas produced by these types of microorganisms was CO2.25,44 Using this information, the CO2 production in the micromodel during static incubation was estimated. Fig. 10(e) compares the CO2 production during the static incubation in the micromodels with that in batch experiments. In the micromodels, the amount of CO2 produced (free gas) after seven days of incubation was estimated to be ∼11.35 μmol mL−1 culture. Alkan et al. (2020) reported production of CO2 up to 30 μmol mL−1 under atmospheric conditions after ten days of incubation under batch conditions, a result confirmed by the measurements in a high-pressure reactor connected to an ISCO pump.4 This batch value was higher than the micromodel results, which suggests that a fraction of CO2 produced in the micromodel was already dissolved in the brine under 1 bar (g) backpressure. However, based on the viscosity mixing rule, the dissolution of 30 μmol mL−1 CO2 in oil could decrease the oil viscosity by 2–3 mPa s under reservoir conditions. Although the reduction of oil viscosity is minor, this effect could considerably improve the reservoir's oil mobility, potentially increasing oil production.
4 Conclusions
In this work, bioclogging in porous media was evaluated in two different micromodels; artificial- and real-structures that mimic the reservoir rock properties. Based on the results, the following conclusions can be drawn:• Utilization of micromodels and image processing enables evaluating in situ microorganism growth, biomass accumulation and gas production at the pore-scale level. This approach improves the understanding of the effect of bacteria growth and transport on permeability reduction in porous media. Image processing results are promising; however, care should be taken to keep the error margin acceptable, which is essential in evaluating the bioclogging effect.
• The experimental results showed that the PRFs in the artificial-structure micromodels are in line with the Kozeny–Carman model. However, the experimental data of the real-structure micromodels, which closely represent the reservoir conditions, show lower PRF values than the KC model. One reason for this difference could be the additional impact of biomass straining in small pore throats that magnified the bioclogging. Nevertheless, other factors, such as different sizes, injection rates, and pore size distributions of the micromodels and the biofilm permeability and volume ratio, could also affect the results. In addition, the continuous interplay between the biofilm and biomass during the flooding experiments also needs to be considered affecting bioclogging processes in porous media.
• During the incubation, the biofilm tends to form in the vicinity of the grain surface. Although the biofilm was not uniformly distributed in the micromodel, it also contributed to the permeability reduction of porous media. An important question for future studies is to evaluate the biofilm's effect on the surface characteristics of micromodels that could also alter the porous media's permeability.
• The results of particle image velocimetry (PIV) showed a significant variation in the velocity field of tracer particles in unsterile (with bacteria) and sterile experiments (without bacteria) that confirmed the bioclogging in the micromodels. A water flow diversion was also observed in the micromodels due to bioclogging at the diagonal of the micromodels. In a particular application such as MEOR flooding, this flow diversion could be favorable, where the areal sweep efficiency can be enhanced leading to better oil recovery.
• Furthermore, the in situ gas production by bacteria was observed in the micromodels at a pressure of one bar (g). These gas bubbles enhanced the clogging effect in the micromodels, which was indicated by lower PRF values. However, under certain conditions, such as in oil reservoirs where the pressure is sufficiently large, almost all the produced CO2 dissolves in the liquid phase. This CO2 dissolution could decrease the fluid viscosity and improve its mobility in reservoirs.
Conflicts of interest
There are no conflicts to declare.Acknowledgements
The authors of this paper would like to thank Wintershall Dea GmbH for financially supporting this research through the project of “Investigation of Microbial Enhanced Oil Recovery using Micromodels that Resemble Porous Media”. We acknowledge support by the Open Access Publishing Fund of Clausthal University of Technology.References
- H. Y. Jeong, S. C. Jun, J. Y. Cheon and M. Park, A review on clogging mechanisms and managements in aquifer storage and recovery (ASR) applications, Geosci. J., 2018, 22(4), 667–679, DOI:10.1007/s12303-017-0073-x.
- F. Bloetscher, C. H. Sham, J. J. Danko and S. Ratick, Lessons Learned from Aquifer Storage and Recovery (ASR) Systems in the United States, J. Water Resour. Prot., 2014, 06(17), 1603–1629, DOI:10.4236/jwarp.2014.617146.
- S. Rinck-Pfeiffer, Interrelationships between biological, chemical, and physical processes as an analog to clogging in aquifer storage and recovery (ASR) wells, Water Res., 2000, 34(7), 2110–2118, DOI:10.1016/s0043-1354(99)00356-5.
- H. Alkan, E. Biegel, M. Kruger, J. Sitte, F. Kogler and H. Bultemeier, et al. An Integrated MEOR Project Workflow to Develop a Pilot in a German Field, in SPE Improved Oil Recovery Symposium, Society of Petroleum Engineers, 2014, DOI:10.2118/169151-ms.
- N. Klueglein, F. Kögler, I. J. Adaktylou, M. L. Wuestner, E. Mahler and J. Scholz, et al. Understanding Selective Plugging and Biofilm Formation of a Halophilic Bacterial Community for MEOR Application, in SPE Improved Oil Recovery Conference, Society of Petroleum Engineers, 2016, DOI:10.2118/179620-MS.
- M. Thullner, Comparison of bioclogging effects in saturated porous media within one- and two-dimensional flow systems, Ecol. Eng., 2010, 36(2), 176–196, DOI:10.1016/j.ecoleng.2008.12.037 , Special Issue: BioGeoCivil Engineering.
- P. J. Dillon, M. R. Hickinbotham and P. Pavelic, Review of International Experience in Injecting Water into Aquifers for Storage and Reuse [Article; Article/Conference paper], Water Down Under 94: Groundwater Papers, Preprints of Papers, 1994, pp. 13–19 Search PubMed.
- N. Youssef, M. S. Elshahed and M. J. McInerney, Chapter 6 Microbial Processes in Oil Fields, in Advances in Applied Microbiology, Elsevier, 2009, pp. 141–251 Search PubMed.
- E. M. Murphy and T. R. Ginn, Modeling microbial processes in porous media, Hydrogeol. J., 2000, 8(1), 142–158, DOI:10.1007/s100409900043.
- R. Harvey, in Parameters involved in modeling movement of bacteria in groundwater, 1991, pp. 89–114 Search PubMed.
- M. F. Kirk, E. F. U. Santillan, L. K. McGrath and S. J. Altman, Variation in hydraulic conductivity with decreasing pH in a biologically-clogged porous medium, Int. J. Greenhouse Gas Control, 2012, 11, 133–140, DOI:10.1016/j.ijggc.2012.08.003.
- W. Deng, M. B. Cardenas, M. F. Kirk, S. J. Altman and P. C. Bennett, Effect of Permeable Biofilm on Micro- And Macro-Scale Flow and Transport in Bioclogged Pores, Environ. Sci. Technol., 2013, 47(19), 11092–11098, DOI:10.1021/es402596v.
- S. Karimifard, X. Li, C. Elowsky and Y. Li, Modeling the impact of evolving biofilms on flow in porous media inside a microfluidic channel, Water Res., 2021, 188, 116536, DOI:10.1016/j.watres.2020.116536.
- Y. Zhou, S. Weng, Y. Zhang, D. Z. Zhu, P. Tang and Z. Xiang, et al. Experimental study of seepage flow properties with biofilm development in porous media with different filter morphologies, J. Hydrol., 2020, 591, 125596, DOI:10.1016/j.jhydrol.2020.125596.
- D. S. Kim and H. S. Fogler, Biomass evolution in porous media and its effects on permeability under starvation conditions, Biotechnol. Bioeng., 2000, 69(1), 47–56, DOI:10.1002/(sici)1097-0290(20000705)69:1<47::aid-bit6>3.0.co;2-n.
- H. J. Dupin and P. L. McCarty, Impact of Colony Morphologies and Disinfection on Biological Clogging in Porous Media, Environ. Sci. Technol., 2000, 34(8), 1513–1520, DOI:10.1021/es990452f.
- C. W. Beckwith and A. J. Baird, Effect of biogenic gas bubbles on water flow through poorly decomposed blanket peat, Water Resour. Res., 2001, 37(3), 551–558, DOI:10.1029/2000WR900303.
- M. Krüger, N. Dopffel, J. Sitte, E. Mahler, S. Mukherjee and A. Herold, et al. Sampling for MEOR: Comparison of surface and subsurface sampling and its impact on field applications, J. Pet. Sci. Eng., 2016, 146, 1192–1201 CrossRef.
- F. Kögler, The Potential of Halanaerobiales for Microbial Enhanced Oil Recovery Evaluated in Dynamic Sandpack Experiments, Doctoral Dissertation, Technical University Berlin, Berlin, Germany, 2020 Search PubMed.
- N. Parker, M. Schneegurt, A. H. T. Tu, B. M. Forster and P. Lister, Microbiology, OpenStax College, 2016 Search PubMed.
- N. Klueglein, E. Mahler, R. Sonwa, A. Herold, S. Hatscher and H. Alkan, Testing of H2S Inhibitors for Application in a MEOR Field Pilot in Germany, in SPE International Oilfield Corrosion Conference and Exhibition, Society of Petroleum Engineers, 2016 Search PubMed.
- P. Kjeldsen, Evaluation Of Gas Diffusion Through Plastic Materials Used In Experimental And Sampling Equipment, Water Res., 1993, 27(1), 121–131 CrossRef CAS.
- C. L. Gaol, J. Wegner and L. Ganzer, Real structure micromodels based on reservoir rocks for enhanced oil recovery (EOR) applications, Lab Chip, 2020, 20, 2197–2208, 10.1039/d0lc00257g.
- F. Kögler, N. Dopffel, E. Mahler and H. Alkan, Dynamic Screening for Microbial Enhanced Oil Recovery (MEOR), in IOR 2017 – 19th European Symposium on Improved Oil Recovery, EAGE Publications BV, 2017 Search PubMed.
- H. Alkan, N. Klueglein, E. Mahler, F. Kögler, K. Beier and W. Jelinek, et al. An Integrated German MEOR Project, Update: Risk Management and Huff and Puff Design, in SPE Improved Oil Recovery Conference, Society of Petroleum Engineers, 2016, DOI:10.2118/179580-ms.
- W. Thielicke and E. J. Stamhuis, PIVlab – Towards User-friendly, Affordable and Accurate Digital Particle Image Velocimetry in MATLAB, J. Open Res. Softw., 2014, 2, e30, DOI:10.5334/jors.bl.
- B. Hagemann, M. Rasoulzadeh, M. Panfilov, L. Ganzer and V. Reitenbach, Hydrogenization of underground storage of natural gas, Comput. Geosci., 2015, 20(3), 595–606, DOI:10.1007/s10596-015-9515-6.
- J. Hommel, E. Coltman and H. Class, Porosity–Permeability Relations for Evolving Pore Space: A Review with a Focus on (Bio-)geochemically Altered Porous Media, Transp. Porous Media, 2018, 124(2), 589–629, DOI:10.1007/s11242-018-1086-2.
- R. Schulz, N. Ray, S. Zech, A. Rupp and P. Knabner, Beyond Kozeny–Carman: Predicting the Permeability in Porous Media, Transp. Porous Media, 2019, 130(2), 487–512, DOI:10.1007/s11242-019-01321-y.
- G. Mavko, T. Mukerji and J. Dvorkin, The Rock Physics Handbook: Tools for Seismic Analysis of Porous Media. Stanford-Cambridge program, Cambridge University Press, 2003, Available from: https://books.google.de/books?id=2sFrj-6_Zh0C Search PubMed.
- F. Civan, Scale effect on porosity and permeability: Kinetics, model, and correlation, AIChE J., 2001, 47(2), 271–287, DOI:10.1002/aic.690470206.
- R. G. Moghanloo, D. Davudov and E. Akita, Formation Damage by Organic Deposition, in Formation Damage During Improved Oil Recovery, Elsevier, 2018, pp. 243–273, DOI:10.1016/b978-0-12-813782-6.00006-3.
- C. S. Fitzpatrick and J. Gregory, Coagulation and filtration, in, Handbook of Water and Wastewater Microbiology, Elsevier, 2003, pp. 633–655, DOI:10.1016/b978-012470100-7/50039-x.
- K. M. Kaster, A. Hiorth, G. Kjeilen-Eilertsen, K. Boccadoro, A. Lohne and H. Berland, et al. Mechanisms Involved in Microbially Enhanced Oil Recovery, Transp. Porous Media, 2011, 91(1), 59–79, DOI:10.1007/s11242-011-9833-7.
- J. L. Robinson, B. Pyzyna, R. G. Atrasz, C. A. Henderson, K. L. Morrill and A. M. Burd, et al. Growth Kinetics of Extremely Halophilic Archaea (Family Halobacteriaceae) as Revealed by Arrhenius Plots, J. Bacteriol., 2005, 187(3), 923–929, DOI:10.1128/JB.187.3.923-929.2005.
- M. Gray, A. Yeung, J. Foght and H. W. Yarranton, Potential Microbial Enhanced Oil Recovery Processes: A Critical Analysis, in SPE Annual Technical Conference and Exhibition, Society of Petroleum Engineers, 2008, DOI:10.2118/114676-ms.
- W. G. Characklis and K. Marshall, Wiley Series in Ecological and Applied Microbiology, Biofilms, Wiley, 1990, Available from: https://books.google.de/books?id=soAXAQAAIAAJ Search PubMed.
- A. E. Scheidegger, The Physics of Flow Through Porous Media, University of Toronto Press, 3rd edn, 1974, Available from: http://www.jstor.org/stable/10.3138/j.ctvfrxmtw Search PubMed.
- R. Lindgvist and C. Enfield, Cell density and non-equilibrium sorption effects on bacterial dispersal in groundwater microcosms, Microb. Ecol., 1992, 24(1), 25–41, DOI:10.1007/bf00171968.
- A. K. Sarkar, G. Georgiou and M. M. Sharma, Transport of bacteria in porous media: II. A model for convective Transport and growth, Biotechnol. Bioeng., 1994, 44(4), 499–508, DOI:10.1002/bit.260440413.
- P. C. D. Blanc, D. C. McKinney and G. E. Speitel, Modeling subsurface biodegradation of non-aqueous phase liquids, in Advances in Porous Media, Elsevier, 1996, ch. 1, pp. 1–86, DOI:10.1016/s1873-975x(96)80003-5.
- R. G. Moghanloo, D. Davudov and E. Akita, Formation Damage by Organic Deposition, in Formation Damage During Improved Oil Recovery, ed. B. Yuan and D. A. Wood, Gulf Professional Publishing, 2018, ch. 6, pp. 243–273, DOI:10.1016/B978-0-12-813782-6.00006-3.
- J. W. Kim, H. Choi and Y. A. Pachepsky, Biofilm morphology as related to the porous media clogging, Water Res., 2010, 44(4), 1193–1201, DOI:10.1016/j.watres.2009.05.049 , Transport and Fate of Colloids and Microbes in Granular Aqueous Environments.
- H. Alkan, S. Mukherjee and F. Koegler, Reservoir engineering of in-situ MEOR; impact of microbial community, J. Pet. Sci. Eng., 2020, 195, 107928, DOI:10.1016/j.petrol.2020.107928.
- G. Matthess and A. Pekdeger, Survival and transport of pathogenic bacteria and viruses in groundwater, John Wiley & Sons, Inc., New York, 1985, pp. 472–482 Search PubMed.
- R. W. Harvey and S. P. Garabedian, Use of colloid filtration theory in modeling movement of bacteria through a contaminated sandy aquifer, Environ. Sci. Technol., 1991, 25(1), 178–185 CrossRef CAS.
| This journal is © The Royal Society of Chemistry 2021 |

