
 Open Access Article
 This Open Access Article is licensed under a Creative Commons Attribution-Non Commercial 3.0 Unported Licence
In situ determination of engineered nanomaterial aggregation state in a cosmetic emulsion – toward safer-by-design products
Riccardo
Catalano
a,
Danielle L.
Slomberg
a,
Céline
Picard
b,
Nicolas
Hucher
 b,
Vladimir
Vidal
a,
François
Saint-Antonin
c,
Jean-Claude
Hubaud
d,
Jerome
Rose
a and
Jerome
Labille
*a
b,
Vladimir
Vidal
a,
François
Saint-Antonin
c,
Jean-Claude
Hubaud
d,
Jerome
Rose
a and
Jerome
Labille
*a
aAix Marseille Univ, CNRS, IRD, INRAE, Coll France, CEREGE, Aix-en-Provence, France. E-mail: labille@cerege.fr
bNormandie Univ, UNILEHAVRE, FR3038 CNRS, URCOM, 76600 Le Havre, France
cCEA, LITEN, Minatec Campus, Grenoble, France
dHélioscience, Marseille, France
First published on 14th October 2021
Abstract
Engineered nanomaterials (ENMs) can be used in cosmetics as UV blockers. For these products, the exposure-driven risk for humans and the environment is related to the ENM release during or after use, and thus to the original surface properties and aggregation state of the ENMs. Moreover, as the ENM dispersion in the product also affects the efficiency to screen UV rays, optimizing the formulation can lower the ENM load. Characterizing the ENM behaviour directly in a cosmetic formulation is thus crucial to better assess their risk and develop safer-by-design products. However, the complexity of such a multiphasic system limits in situ characterization using most common analytical tools. Here, we present a novel methodology based on two-dimensional X-ray absorption (2D-XRA) imaging to characterize the dispersion state of ENMs directly in a sunscreen product. Two commercial nano-TiO2 UV filters, displaying different surface coatings, were used to prepare contrasting sunscreen formulations at increasing ENM concentration. Cryogenic scanning transmission electron microscopy (Cryo-STEM) was also used for comparison to evaluate the advantages and limitations of both methods in this context. 2D-XRA proved to be a powerful and rapid technique to analyze both UV filter dispersion in the formulation and the overall product homogeneity. This was enabled by thresholding areas of contrasting ENM densities in the 2D-XRA image, which reflected ENM aggregates, fine ENM dispersions, or voids with a lower UV protection. Image analysis also allowed semi-quantitative evaluation of the relative area of each density range, and of the aggregate size in terms of projected area. In comparison, Cryo-STEM provided a larger magnification than 2D-XRA, which enabled visualisation and sizing of the ENM primary particles, plus the distinction of the emulsion oil and water phases thanks to EDX coupling, but with a smaller and less representative volume of analysis and a higher cost in time and energy. This work is a step forward in measuring ENM behavior in situ in a complex multiphasic matrix constituting a nano-enabled product. Such knowledge at the original stage of the product life cycle is crucial to better predict the ENM fate along with use and end of life, and eventually, develop safer-by-design nano-enabled products.
Environmental significanceAnalysing the nanomaterial (ENM) dispersion state in a cosmetic product, without altering the original matrix, is crucial to assess the exposure driven risk during and after use. Here, we present a novel methodology based on 2D X-ray absorption imaging to analyse, in situ, the aggregation state of ENM UV filters in a sunscreen emulsion. Our results demonstrate that this methodology is able to rapidly characterize, semi-quantitatively, the ENM dispersion and homogeneity in the formulation and can be a useful tool to optimize the UV filter type and concentration with regard to the product efficacy. Eventually, this can help to develop sunscreens with a lower ENM load, still maintaining an acceptable sun protection factor, but with a lower environmental footprint. |
1. Introduction
In the last 20 years, nanotechnology has been widely used in different areas such as cosmetics, painting, drug delivery, packaging and food.1,2 Together with the higher efficiency of the so-called nano-products, increasing concern has been expressed in the literature regarding the potentially higher toxicity of these engineered nanomaterials (ENMs) to consumers and the environment due to their higher active surface and bioavailability.3,4Cosmetic products, like sunscreens, often contain nanoparticulate TiO2 or ZnO minerals, used mainly as UV filters. They are preferred over the corresponding micron-sized particulate filters because of their better screening efficiency and transparency on the skin.5 During use, these ENMs may penetrate the human skin,6 causing cytotoxicity,7–10 or be released into aquatic and soil environments during bathing activities or showering,11 with potential hazards to the surrounding ecosystems.4,12 The European Commission's regulation program, Registration, Evaluation, Authorization and Restriction of Chemicals (REACH), is currently working on the regulation of products containing nanomaterials. The regulatory process normally requires basic physico-chemical characterization of the product (stability; purity; molecular weight; crystal structure) and, when necessary, a toxicological evaluation (in vivo/in vitro toxicity tests).13,14
Since the risk associated with these ENMs is related to the sunscreen composition and to the ENM content in the formulation, optimizing the mineral filter performance and concentration is crucial to anticipate and minimize this risk.11 One way to obtain a cosmetic product with a lower ENM content without affecting its efficiency (solar protection factor – SPF) is to enhance the particle dispersion and stability in the formulation medium.15 It was observed that a finer nano-UV filter dispersion can be twice as efficient as a formulation containing aggregated nano-UV filters.16 Consequently, the determination of nanoparticle size and dispersion state (i.e. aggregation; agglomeration) in a cosmetic formulation is a key step to optimizing the product efficiency and thus minimizing the UV filter load and environmental footprint after release. Although the physico-chemical characterization of raw nanomaterials prior to their integration into a cosmetic product is relatively straightforward,17 it is more challenging to characterize the final nano-enabled product because of the matrix complexity, which makes many routine approaches unsuitable.
One of the main experimental issues is related to the oily nature of the product, which impedes the complete drying of the sample. Therefore, size, structure and chemical analyses using transmission electron microscopy (TEM) in standard mode are not possible, because this works under a complete vacuum, and can eventually lead to sample aspiration which could damage the instrument.18 Dilution of the cream with an organic solvent, followed by evaporation of the volatile components, is often used prior to the analysis in order to avoid this effect with conventional TEM or SEM.19,20 Such a sample preparation changes the ENM dispersion state and its interaction with the formulation ingredients, which is not compatible for characterizing the final sunscreen product. To avoid sample aspiration or drying during TEM analysis, Butler et al.21 used high-pressure freezing substitution of the creamy medium with a suitable resin. The resulting images allowed the finer characterization of particle size, shape and aggregation state. However, this experimental set-up is very time-consuming and the resin addition could likely change the interaction of the nanoparticles with the surrounding medium. Recently, Philippe et al.,22 performed a TEM analysis on different commercial sunscreens in cryogenic mode. This technique is suitable for obtaining finer electron microscopy images of nanoparticles in sunscreen formulations without altering the original composition of the product.23 Nevertheless, although Cryo-TEM is able to give insight on the size and shape of primary particles and aggregates, the images cannot be representative of the entire product structure (i.e. nanoparticle aggregation or agglomeration state; inhomogeneities), as a high resolution often implies a limited analyzed area. It is thus crucial to use a methodology which does not alter the original formulation matrix, gives a resolution on the order of the UV filter aggregate size, and enables the analysis of a representative area of the product.
Tyner et al.18 compared more than 20 analytical methods to characterize nanomaterials in sunscreen formulations. They concluded that four of them were capable of providing insight on some specific ENM characteristics without changing the composition of the original product. Laser-scattering confocal microscopy (LSCM) is able to give insight on the presence of nanoparticles and their average dispersion state, but due to the diffraction-limit resolution of optical microscopy and low optical contrast, the particles cannot be detected or sized accurately. X-ray diffraction (XRD) is suitable for characterizing the crystalline structure and size of the coherent domain of primary particles. Variable pressure scanning electron microscopy (VPSEM) provides surface characterization of the sample, and coupling with a back-scattering detector gives a contrast function of the atomic number, which leads to a better visualization of Ti or Zn-based ENMs in the sample. Finally, atomic force microscopy (AFM) is able to detect nanomaterials in the formulation and give insight on morphological features, even though phase imaging is required for bulk characterization. Because AFM is really sensitive to topographical changes, height analysis can be complicated due to artifacts arising from sample preparation.
The present work was aimed at developing a novel methodology based on two-dimensional X-ray absorption (2D-XRA) imaging to characterize the aggregation and dispersion state of nanoparticles directly in a sunscreen product together with the formulation homogeneity. Different sunscreen formulations were prepared in-house in order to obtain contrasting case studies that were analyzed by this method. The sun protection factor (SPF) of each formulation was measured in order to evaluate the impact of the filter dispersion on the SPF and if the latter could be used as a possible indicator of the formulation homogeneity. Cryo-STEM was also used to measure the particle size, shape and dispersion state in the emulsion in order to give insights on the advantages and limitations of both methods for sunscreen characterization.
2. Materials and methods
UV filter properties
Two commercial UV-filters, T-Lite SF (BASF) and Eusolex T-S (Merck), were used as case studies in this work, hereafter named T-Lite and T-S. They were directly purchased from the supplier as dry powders. Chemical speciation of the pristine powders (NMR; EDX; elemental analysis) together with the evaluation of the primary particle sizes and shapes has been reported elsewhere.16 Both are characterized by a rutile TiO2 nanoparticulate core (≈76 wt% in T-S and ≈84 wt% in T-Lite, according to the manufacturers) with a similar size (≈60 nm) and rod shape. Both UV filters are coated with a primary mineral layer of aluminum (hydr)oxide (≈10 wt%) and a secondary hydrophobic polymer layer. The latter is composed of stearic acid in the T-S UV filter (≈9 wt%) and polydimethylsiloxane in T-Lite (≈3.5 wt%).Formulation of sunscreens
Water-in-oil (W/O) sunscreen emulsions were prepared with various UV filter characteristics and concentrations, following a procedure and using products that are typically used in the cosmetic industry. The formulation ingredients are listed in Table 1. The emollients and emulsifier and preservative components used were provided by the suppliers. The continuous oil phase of the sunscreen was prepared by mixing the two emollient oils and the emulsifier in a 2![[thin space (1/6-em)]](https://www.rsc.org/images/entities/char_2009.gif) :2:1 ratio. It was gently homogenized for 20 min through magnetic agitation. Then, an appropriate mass of UV filter (T-S or T-Lite) was dispersed in 15 g of this oil phase under stirring (1000 rpm) for 10 minutes, using a Heidolph Hei-Torque 400 stirrer equipped with a four-bladed pitch blade turbine with a blade angle of 45°. Meanwhile, 70.3 g of Milli-Q Water (ρ = 18.2 Ω m) were mixed with 3 g of glycerol (Sigma Aldrich) using a bench-top mixer (Turbotest evo, VMI, France) equipped with a 35 mm deflocculator turbine, rotating at 400 rpm. 1.2 g of gelling agent (Sepiplus 400) was added to this aqueous phase while increasing the agitation speed to 1600 rpm for 10 min. Then, the aqueous phase was mixed and emulsified with the oil phase using the bench-top mixer equipped with a 25 mm rotor/stator emulsifier at a 2000 rpm speed during 10–15 min. Finally, 0.5 g of the preservative Euxyl PE 9010 was added and the emulsion was mixed for 10 min at 1000 rpm with the deflocculator.
:2:1 ratio. It was gently homogenized for 20 min through magnetic agitation. Then, an appropriate mass of UV filter (T-S or T-Lite) was dispersed in 15 g of this oil phase under stirring (1000 rpm) for 10 minutes, using a Heidolph Hei-Torque 400 stirrer equipped with a four-bladed pitch blade turbine with a blade angle of 45°. Meanwhile, 70.3 g of Milli-Q Water (ρ = 18.2 Ω m) were mixed with 3 g of glycerol (Sigma Aldrich) using a bench-top mixer (Turbotest evo, VMI, France) equipped with a 35 mm deflocculator turbine, rotating at 400 rpm. 1.2 g of gelling agent (Sepiplus 400) was added to this aqueous phase while increasing the agitation speed to 1600 rpm for 10 min. Then, the aqueous phase was mixed and emulsified with the oil phase using the bench-top mixer equipped with a 25 mm rotor/stator emulsifier at a 2000 rpm speed during 10–15 min. Finally, 0.5 g of the preservative Euxyl PE 9010 was added and the emulsion was mixed for 10 min at 1000 rpm with the deflocculator.
| Commercial name | Supplier | Composition | Function |
|---|---|---|---|
| SEPIPLUS 400 | SEPPIC | Polyacrylate; polyisobutene polysorbate 20; water; sorbitan; isooctadecanoate | Gelling agent |
| EASYNOV | SEPPIC | Octyldodecanol; octyldodecyl xyloside; PEG30 dipolyhydroxystearate | Emulsifier |
| CETIOL LC | AMI CHIMIE | Coco-caprylate/caprate | Emollient |
| TEGOSOFT P | EVONIK | Isopropyl palmitate | Emollient |
| EUXYL PE 9010 | SCHUELCKE | Phenoxyethanol; ethylhexylglycerin | Cosmetic preservative |
A total of seven sunscreen formulations were prepared using this procedure, which include the two UV filters incorporated at three different concentrations (2.8; 5; 10 wt%), and a blank formulation free of UV filter. In the formulations prepared with 10 wt% UV filter, 10 g of the dry UV filter powder were incorporated. In the formulations prepared with a lower amount of UV filter (2.8 and 5 wt%), the weight difference was balanced by adding the same mass of ultrapure water.
Contact angle measurements and surface free energy calculations
Although both UV filters are commercially labeled as lipophilic, their actual dispersion in the sunscreen formulation is expected to depend on the affinity of the outermost coating for the oil dispersing medium. In order to characterize the surface polarity of both UV filters, contact angle measurements were conducted with the oil phase used to prepare the sunscreen emulsions, and with three reference liquids characterized by different polar/dispersive components: ultrapure water; diiodomethane and formamide. Stable and compact pellets with a perfectly flat surface were obtained from solid dispersions by mixing and grinding manually 20 wt% pure T-Lite or T-S ENMs with 80 wt% KBr powder (Sigma-Aldrich), and then compacting under 3 tons using a high-pressure press. KBr was used here as a binder in order to maintain the strength of each pellet during manipulation and a similar structure. Of note, due to the much higher specific surface area of the TiO2 nanomaterial compared to that of the micronized KBr, it is assumed that the whole pellet surface consists of the nanomaterial and that KBr does not affect the contact angle.24 The sessile-drop method was conducted on each pellet with a portative goniometer PGX+ (ScanGaule, Gravigny, France) connected to the PGPlus software.25 The goniometer was equipped with a high-resolution camera and a specific lighting system coupled to a mirror to visualize liquid droplets deposited onto the surface. A syringe (Ø = 0.77 mm) was used to deposit a droplet on the pellet surface and an image was recorded 4 seconds after droplet deposition. The advanced contact angle was determined on the identified triple point at the intersection of the liquid, solid and vapor phases using the software. The surface energy components (dispersive and polar) were then calculated using the van Oss–Chaudhury–Good equation.26,27 The measurements with each liquid were performed in triplicate and 9 replicates of the pellet were made for each solid dispersion.Sun protection factor (SPF) measurements
The SPF of each sunscreen formulation was measured in vitro using the method of spectral transmittance defined by eqn (1):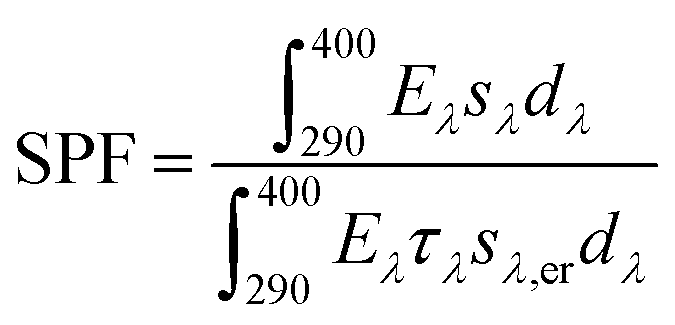 | (1) |
UV transmitting poly(methyl methacrylate) (PMMA) plates (50 × 50 mm) with a 5 μm medium roughness were used as a substrate that mimics skin. Between 1.2 and 1.4 mg cm−2 of cream was spread on the substrate, accurately weighing the amount deposited before and after evaporation occurred. By using light finger pressure, the cream was spread over the entire surface until a homogeneous distribution was achieved and the sample was left to settle for 15 min at room temperature to ensure self-leveling of the formulation. A bare PMMA plate was used as a blank for UV transmittance. The transmittance of each sample was measured in the UV range (400–290 nm) using a spectrophotometer (Kontron UVIKON – UVK lab) equipped with an integrating sphere. For each sunscreen sample, the measurements were repeated 9 times at different locations of the PMMA plate.28
2D X-ray absorption imaging
2D X-ray absorption (2D-XRA) imaging analysis was performed using an UltraXRM-L200 X-ray tomograph (Zeiss Xradia). The instrument is equipped with a copper rotating anode X-ray source (E = 8.048 keV) running at 40 kV and 30 mA. The UltraXRM-L200 is a lab based ultra-high-resolution computed tomography scanner usually used for structural analysis of microscopic sample volumes via 3D visualization. It was used here in 2D projection mode in order to attempt rapid assessment of the aggregation and dispersion state of nanoparticles directly in the sunscreen product together with the formulation homogeneity. Each sunscreen formulation was aspirated into a 249 μm diameter Kapton capillary, using a disposable syringe fitted with a needle. The portion of the capillary not filled with the sample was cut-off and the extremities were closed with epoxy glue to avoid sample evaporation. A mosaic of 5 × 5 images was recorded in a large field of view (64.5 × 64.5 μm2), to be able to cover the entire sample area, with a pixel resolution of 60 × 60 nm2. Each sample measurement took only 25 min, which likely avoided any aging of the sample structure. As the extent of X-rays absorbed by the sample depends on the electronic contrast of its summed components, 2D X-ray absorption imaging is theoretically able to distinguish the TiO2 based ENMs (high electron density) from the rest of the sunscreen formulation.Semi-quantitative image treatment
The original 2D-XRA images (8bit) were treated with ImageJ software in order to achieve a 256-level greyscale, in which black (maximum X-ray absorption) equals 0 and white (no X-ray absorption) equals 256. In order to compare sample portions of the same thickness (249 μm), the areas corresponding to capillary edges or the cream–air interface in the image were avoided, and only the central bulk area of the sample was taken into consideration. To distinguish the nanoparticle contribution accurately and compare the greyscales between samples at different ENM concentrations, the image from the blank sunscreen formulation was subtracted from those of sunscreens containing ENMs, using the subtract function available on ImageJ.In addition to this qualitative characterisation, the local ENM concentration in each area of the sample image could be quantitatively determined, using the calculated X-ray transmission through the sample, as follows. The transmission of X-rays through a slab of thickness d is given by eqn (2):29
| T = exp(−nμad) | (2) |
| μa = 2r0λf2 | (3) |
 | (4) |
To further quantify the ENM aggregation and dispersion state of the samples, when some large aggregates were revealed as discrete units in the 2D projection map, their average area (1–25 μm2) was determined using the particle size calculator feature of ImageJ. For this analysis, only the concentration domains higher than the expected nominal concentration in the sample were considered. In samples with 5 or 10 wt% nominal concentration, we considered the domains >10 wt%, while in samples with 2.8 wt% nominal concentration, we considered both domains 5–10 and >10 wt%.
Finally, the standard deviation of the greyscale distribution histogram was also calculated for each sample, after blank subtraction, and tested as a possible indicator of the sunscreen homogeneity.
Cryogenic microtome/cryogenic transmission electron microscopy
Scanning-transmission electron microscopy (STEM) in cryogenic mode was used to characterize the sunscreen formulations, in order to compare the advantages and limitations with regard to 2D-XRA imaging. A droplet of either T-S or T-Lite sunscreen at 2.8% w/w was allowed to settle on a metallic support and frozen at −100 °C in the cryochamber of a Leica EMF-UC7 ultramicrotome. Once the sample was homogeneously frozen and stable on the support, the temperature was raised to −80 °C to soften up the sample and ease the cutting procedure. Under such conditions, the diamond blade of the microtome should be able to perform a clean cut on the sample without altering the ENM distribution in the frozen sunscreen matrix. The samples were cut into thin slices of 80 nm thickness and 1–2 mm length (cut-speed = 1 mm s−1; FEED = 80 nm) using a diamond cutting-knife. The slices were placed in a suitable sample holder and stored in liquid nitrogen overnight. The frozen samples were placed on an Agar C-166-3 lacey carbon grid, inside a cryo-holder (Thermo Fisher) filled with liquid nitrogen. The samples were then transferred into a microscope (Thermo Fisher Tecnai Osiris) and analysed at an operating voltage of 200 kV. STEM mode was chosen instead of standard TEM to record the images, as it allowed for a clearer detection of the nanoparticles due to higher contrast. To attempt to distinguish more precisely the different phases of the formulation (oil; water; TiO2), elemental chemical analysis of the samples was performed using the energy dispersive X-ray (EDX) detector mounted inside the microscope. The EDX images were then processed with ESPRIT software (Bruker), in order to treat and minimize the background.3. Results and discussion
Surface free energy of the nanoparticles
The contact angles (θ), obtained with the different liquids, for the T-S and T-Lite pellets are reported in Fig. 1. Both T-Lite and T-S ENMs displayed a high affinity for the sunscreen continuous oil phase, with values of θ ≪ 90°. Nevertheless, the higher θTS–D for T-S (25°) suggests a slightly less effective interaction with the oil compared to T-Lite (θTLite–D = 18°). This observation is further supported by the results obtained using the three standard liquids (ultrapure water, diiodomethane and formamide) to calculate the surface free energy components (Table 2).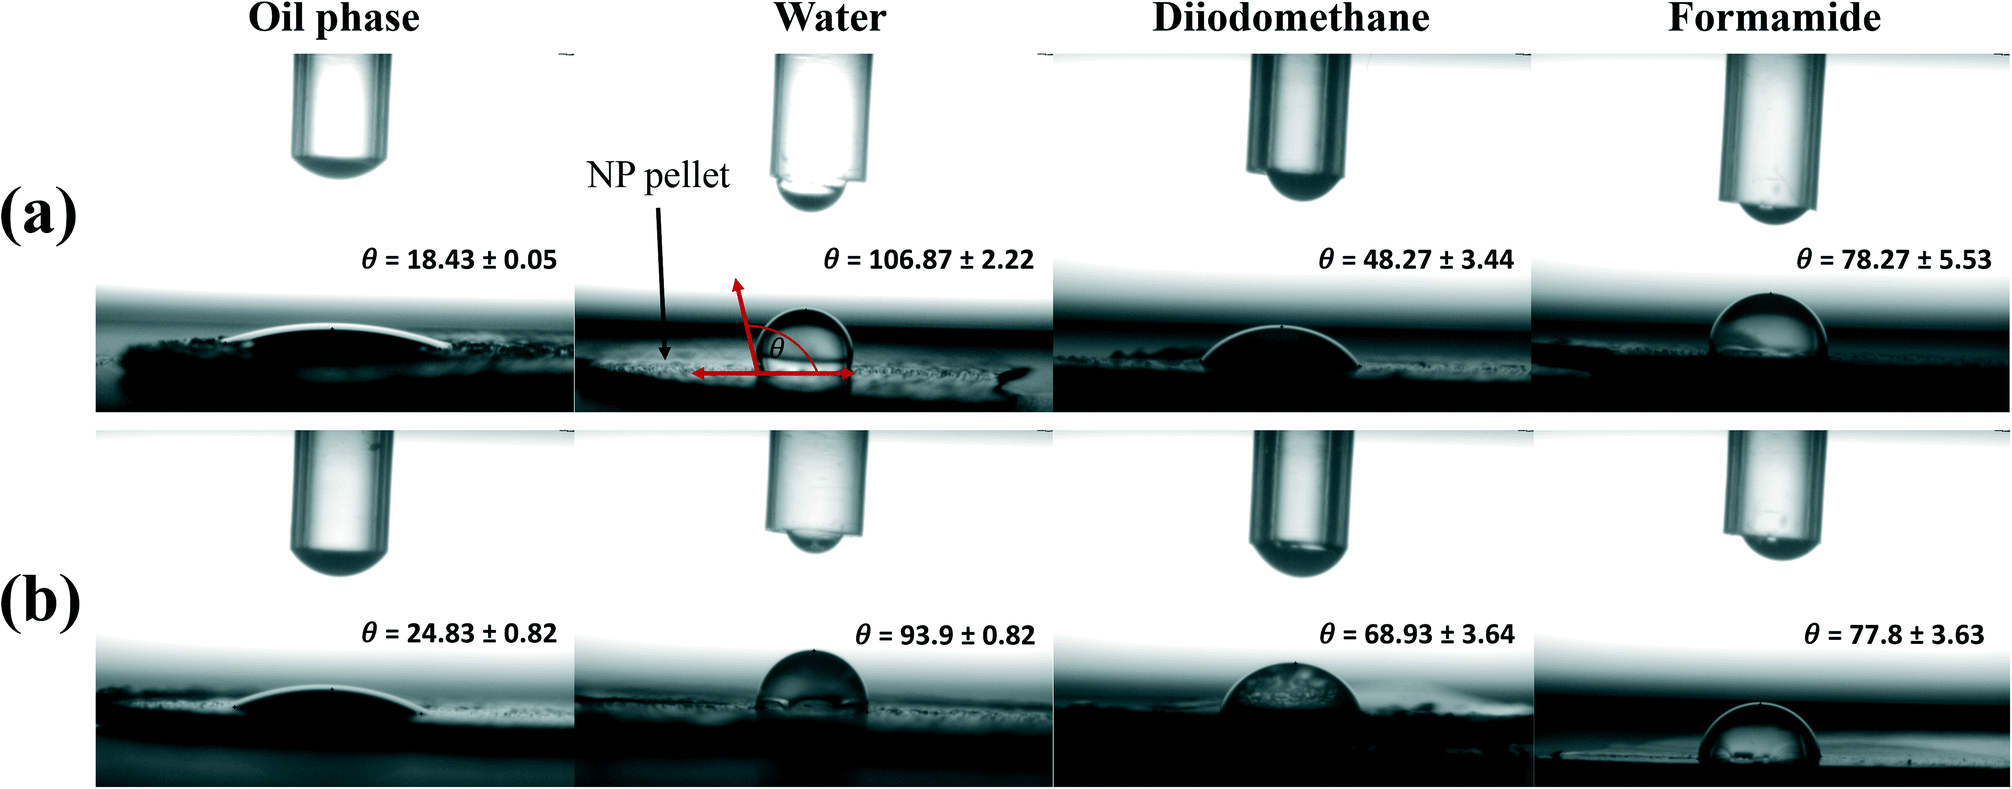 | ||
| Fig. 1 Contact angle measurements (θ) between different liquids and the T-Lite (a) or T-S (b) nanoparticle pellets, using the sessile drop method (3 replicates). | ||
| Nanoparticulate UV filters | Interfacial Lifshitz–van der Waals component (γLW) | Lewis base component (γ−) | Lewis acid component (γ+) | Surface free energy (γs) (mN/m) |
|---|---|---|---|---|
| T-S | 21.3 ± 2.0 | 3.9 ± 1.5 | 0.4 ± 0.4 | 23.1 ± 1.8 |
| T-Lite | 35.3 ± 1.4 | 0.1 ± 0.1 | 0.4 ± 0.2 | 35.7± 1.5 |
The interfacial Lifshitz–van der Waals component of the surface free energy (γLW) describes the likelihood of a compound surface to establish apolar interactions,31 while the Lewis base component value (γ−) describes the likelihood to interact with polar components. γLW is lower for T-S ENM (21 mN m−1) compared to that for T-Lite ENMs (35 mN m−1), while γ− is lower for T-Lite ENMs (0.1 mN m−1). These differences can reasonably be ascribed to the respective organic coatings of the two ENMs. The carboxylic groups of the T-S ENM stearic acid coating can likely act as an electron donor (Lewis base) and favor interactions with polar molecules. The T-Lite ENMs, instead, contain a dimethicone (polydimethyl siloxane) coating free of any electron donor (or acceptor) moiety, which does not favor polar interactions. Although we do not have any information about the stearic acid chain orientation or the nature of interactions with the nanoparticle surface, Paunov et al.32 estimated that a stearic acid coating on calcium carbonate particles brings intermediate surface hydrophobicity, which enables stable dispersion in both water-in-oil and oil-in-water emulsions. These relative polarities agree with the slight differences in affinity for the ultrapure water, or the oil phase, observed between the two ENMs. Due to their more polar aspects, the T-S ENMs, although still maintaining a hydrophobic character, showed a slightly higher affinity for ultrapure water (θTS–w = 93.9°) compared to the T-Lite ENMs (θTLite–w = 106.9°). In contrast, the wettability with the oil phase was likely favored by the apolar interactions present at the T-Lite ENM surface.
Solar protection efficacy and sunscreen formulation character
The sun protection factors (SPFs) of the different sunscreens, formulated with T-S or T-Lite ENMs, were measured in vitro and are reported in Fig. 2. Overall, at every tested UV filter concentration (2.8, 5, and 10 wt%), the sunscreens formulated with the T-Lite UV filter showed greater protection performance than those formulated with the T-S UV filter. Moreover, this difference increased with the ENM concentration (Fig. 2, dashed line).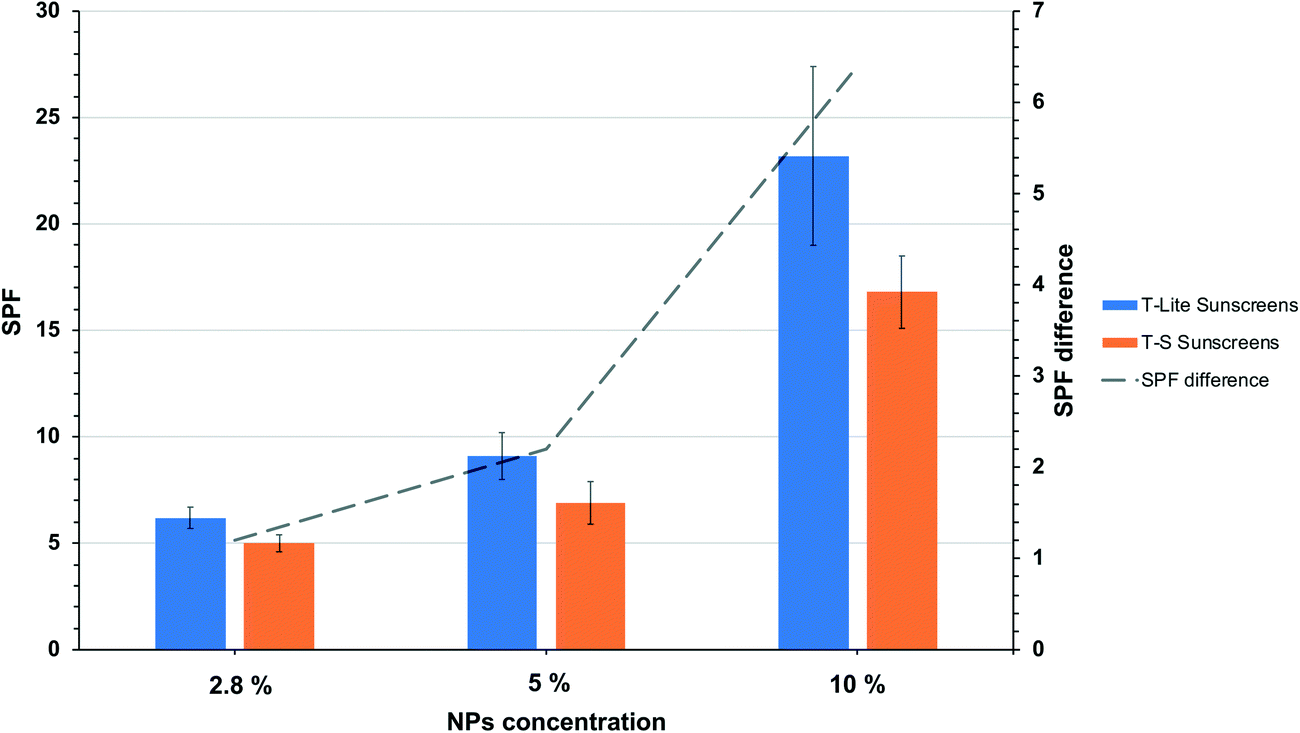 | ||
| Fig. 2 SPF values of sunscreens as a function of the UV filter nature and concentration. The dashed line represents the SPF differences between the T-Lite and T-S sunscreens at each concentration. Error bars correspond to standard deviations from 9 measurement replicates. | ||
As the SPF value is proportionally correlated to the UV absorbance,33 this trend cannot be biased by the calculation method. Furthermore, it is unlikely that this trend was due to differences in the T-S and T-Lite ENM primary particle sizes, because this would not lead to such a dependence on the ENM concentration. We assume that such a difference in SPF arises from various aggregation states of the nanoparticulate UV filters in the formulation. It is well-known that particle aggregation increases with particle concentration and leads to a lower sunscreen screening efficacy.34 Aggregation phenomena can indeed cause inhomogeneities in the UV filter distribution in the formulation, creating voids with low filter content that are more transparent to UV radiation. As such, T-S aggregation at the highest UV filter load resulted in an SPF 25% lower compared to that of T-Lite. With the aim to test the ability of 2D-XRA to evidence such contrasting formulation structures, the seven samples were analysed using this technique. The large field of view images are presented in Fig. 3 through the unmodified 8bit mosaics.
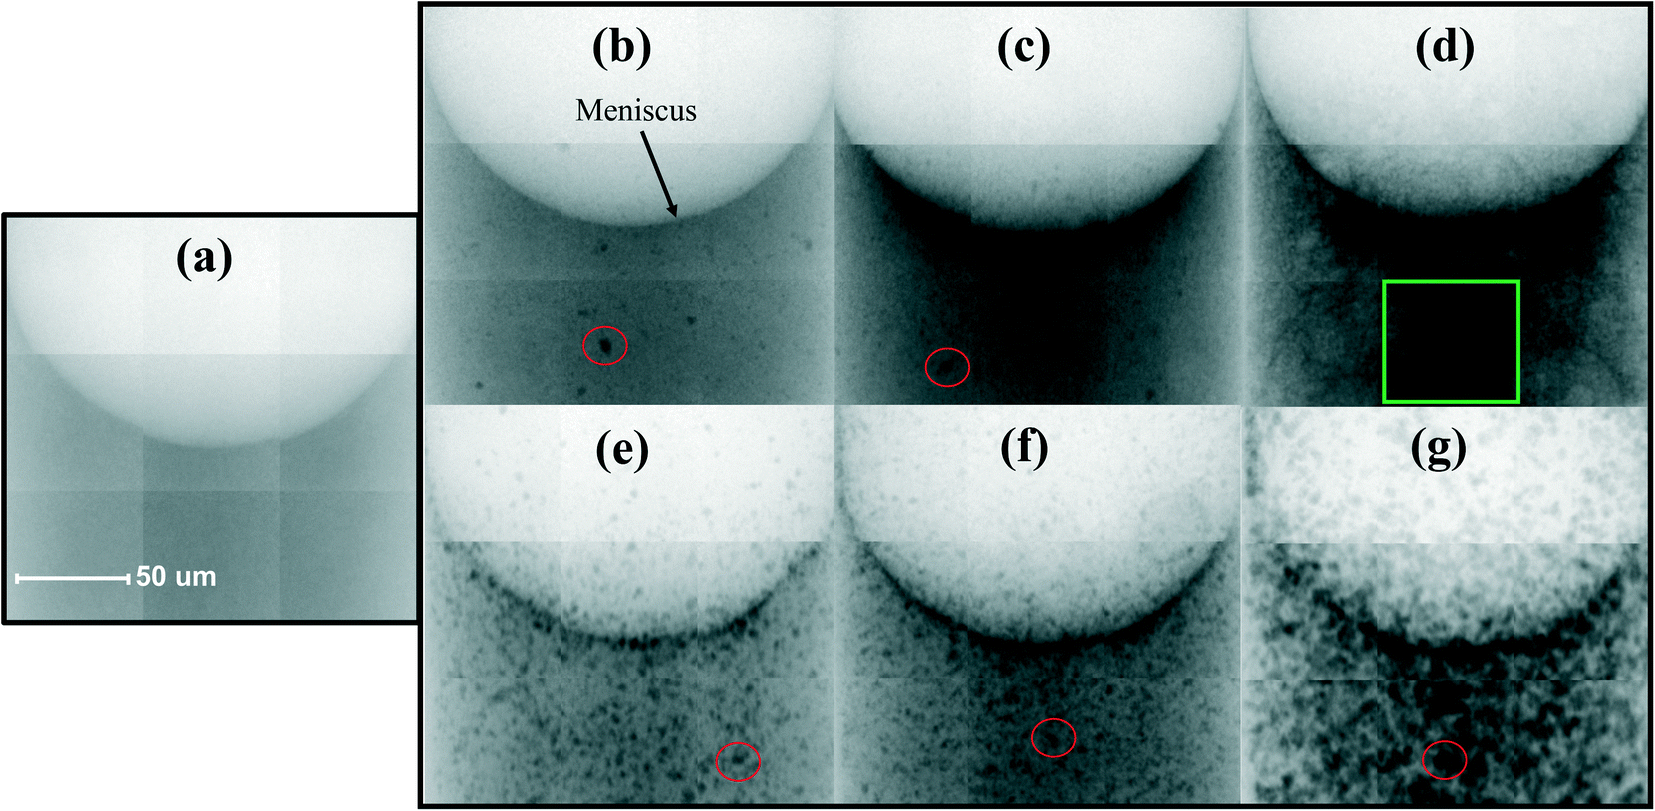 | ||
| Fig. 3 2D X-ray absorption imaging (raw data) of sunscreens: blank sunscreen (a); T-Lite sunscreens 2.8; 5; 10 wt% (b–d); T-S sunscreens 2.8; 5; 10 wt% (e–g). Red circles highlight particle aggregates. The green square indicates the bulk zone focused on for semi-quantitative analysis of the images. Pixel size = 60 × 60 nm2. Each mosaic results from the stitching of 9 separate analyses realized in neighboring volumes of the same sample. | ||
In each greyscale image, darker shades correspond to regions with higher X-ray absorption, while brighter shades correspond to lower X-ray absorption zones. Denser materials, like TiO2, are stronger X-ray absorbers compared to the aqueous or oily sunscreen components. The black dots with a size of a few micrometers (red circles) in sunscreens (b–g) can thus be easily associated with ENM aggregates, as they are not detected in the blank sunscreen free of ENMs (a). Based on these images, at each ENM concentration, the T-Lite sunscreens contain less micro-sized aggregates than the T-S sunscreens. The darker regions are more homogeneously dispersed in the T-Lite formulation than in the T-S formulation, indicating a finer dispersion of the ENMs in the former. Meanwhile, for a given UV filter nature, the particle distribution observed at 2.8 and 5 wt% appeared similar, and at the highest concentration tested, 10 wt%, the homogeneity of the dispersion was dramatically affected. In TS-10 (g), this is associated with increasing particle aggregation. In TLite-10 (d), although the presence of discrete micron-sized aggregates was not observed at this magnification, the dispersion itself appeared less homogeneous compared to those with lower T-Lite concentrations, with a marbling-like aspect in the center of the sample and nanoparticle accumulation along the meniscus. This nanoparticle accumulation at the air–cream interface was also observed in TLite-5 and in all the T-S samples. This suggests a higher affinity of the ENMs for the air phase than for the sunscreen medium. Such surface accumulation was already observed in aqueous colloidal dispersions with hydrophobic particles, usually accompanied by particle aggregation/coagulation,35 and this accumulation would likely increase at higher particle concentrations. The fact that ENM aggregation and concentration at the meniscus were already observed at the lowest particle concentration in TS-2.8 suggests that this ENM is less stable in the formulation compared to the T-Lite ENM. These qualitative observations are in accordance with the contact angle and SPF measurements obtained (Fig. 1 and 2), which attests to the utility of 2D-XRA as a rapid screening method to assess both the dispersion state of mineral UV filters in a sunscreen formulation and, indirectly, the emulsion homogeneity.
Nanoparticle dispersion state and aggregate size
The possibilities of 2D-XRA are not limited to this qualitative aspect, as quantitative information can also be obtained from image analysis, including the greyscale variance, the projected size area of the ENM aggregates, and the local ENM concentration in different areas of the sample. For this purpose, the greyscale distributions of the raw images were analyzed, considering only the central bulk portion of the capillary to avoid side effects. The results are reported in Fig. 4. The blank sample image was subtracted from the 6 raw images of samples containing ENMs. Then, three greyscale thresholds were applied, corresponding to the theoretical X-ray absorption values calculated for each of the three ENM nominal concentrations applied in the sunscreen formulation. Therefore, 4 different domains of ENM density can be distinguished in the map and compared to the expected nominal concentration (<2.8; 2.8–5; 5–10; >10 wt%). | ||
| Fig. 4 Local TiO2 concentration maps in T-Lite and T-S sunscreens at each ENM nominal concentration studied. The concentration domains were the threshold according to the theoretical X-ray absorption at 2.8, 5 and 10 wt% respectively, so that the actual concentration can be compared to the expected nominal concentration. | ||
It is important to underline that the images obtained by 2D-XRA are 2D projections of a 3D sample, where each pixel thus results from the sum of the projected voxels. The TiO2 ENMs are the most X-ray absorbing components in the formulation. Moreover, the other components constituting the blank formulation were subtracted. Thus, the greyscale distribution obtained in 2D reflects the ENM concentration and aggregation state in the total volume analysed, so that any local ENM large aggregation generates an increase of X-ray absorption, leading to a map region with an ENM density higher than the nominal sample concentration. Conversely, any map regions with lower X-ray absorption can be interpreted as containing a low ENM density, i.e. voids with under-protection against UV-rays.
From the 6 maps obtained as shown in Fig. 4, the respective area ratios of each ENM concentration domain were quantified and are reported in Fig. 5a. The greyscale distribution plots after blank subtraction are also reported in Fig. 5b, together with the thresholds used. The ENMs in TLite-2.8 and TLite-5 appear the most finely dispersed, making it difficult to distinguish between concentration domains. In the TLite-2.8 map, a majority (71%) of the area corresponds to the domain 2.8–5 wt% (Fig. 5a), which is in good agreement with the nominal concentration of the sample. The whole greyscale distribution actually lies around the theoretical X-ray absorption value for TiO2 at 2.8 wt% (Fig. 5b). In TLite-5, still in line with the ENM nominal concentration, the greyscale distribution is shifted close to the theoretical TiO2 X-ray absorption at 5 wt% concentration (Fig. 5b). The 2D map indicates that the ENMs occur essentially in the adjacent concentration domains 5–10% (61% area) and 2.8–5% (32% area) (Fig. 4 and 5a).
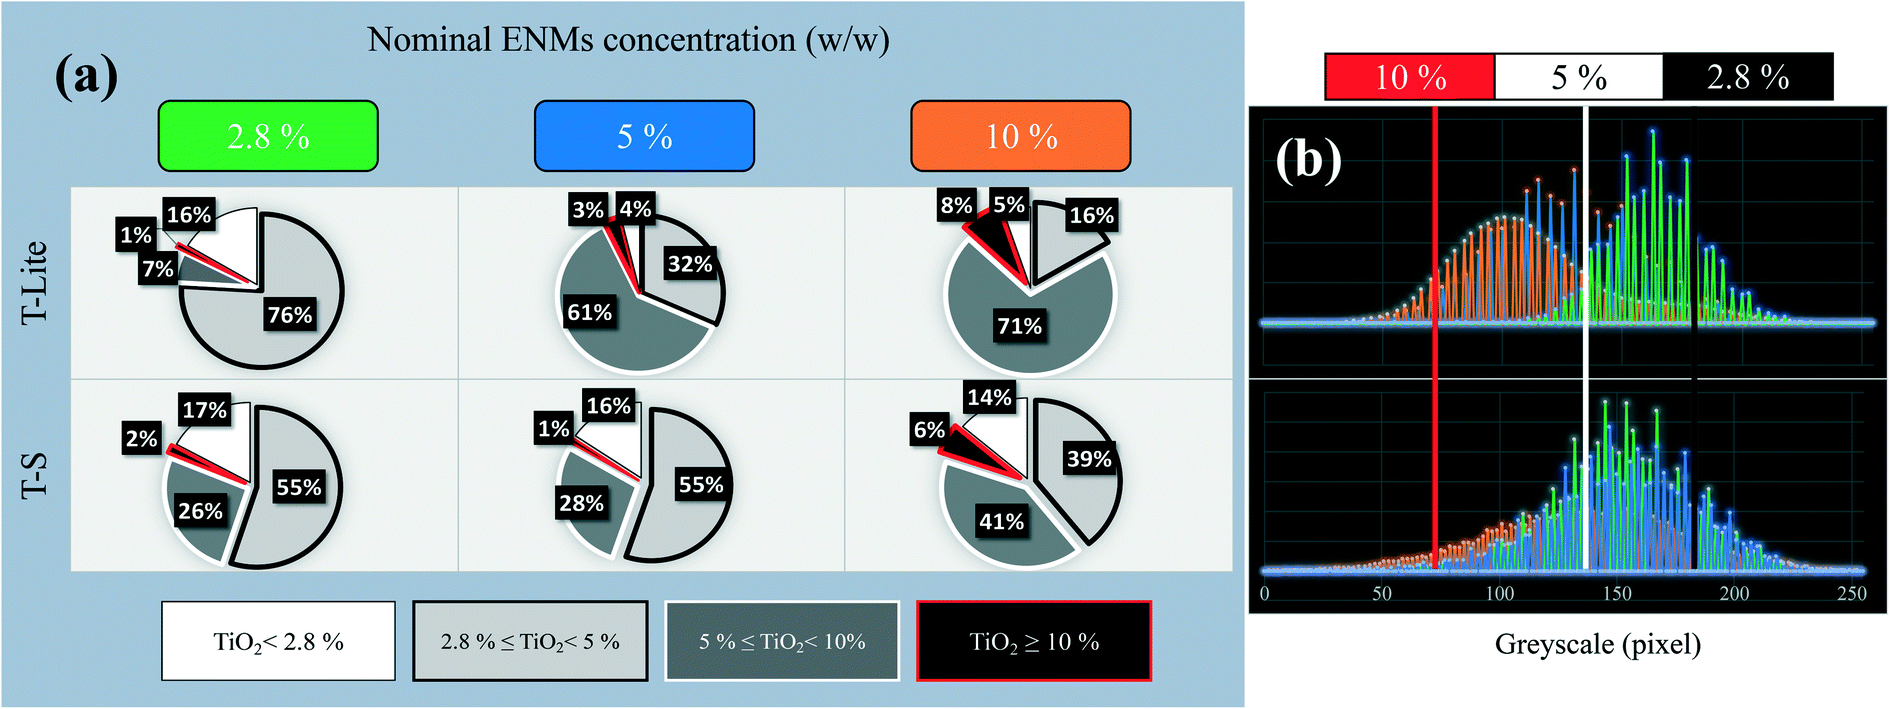 | ||
| Fig. 5 Area quantification of each ENM concentration domain in the 2D-XRA map after thresholding (a), and greyscale distribution plots superimposed to the threshold values (b), as a function of the ENM nature and nominal concentration in the sunscreen. | ||
On the other hand, the T-S samples do not follow the same trend. TS-2.8 and TS-5 do not show significant differences in their ENM distributions (Fig. 4 and 5b) in spite of their contrasting nominal concentrations. This is evidenced in Fig. 5, showing very similar distributions of the ENM concentration and greyscale plot for these two T-S samples. Moreover, in both maps, some large and discrete units appear, showing local areas of ENM concentration much higher than expected, as well as some large UV filter voids (16–17% of area <2.8 wt%). This is the result of the T-S ENM aggregation, which prevents homogeneous distribution in the sunscreen, even at the lowest concentration. This can be related to the lower Lifshitz–van der Waals component of T-S ENM (Table 2), which implies a lower affinity with the apolar oil phase of the sunscreen formulation, and leads thus to a lower ENM dispersion stability. Sizing of these projected aggregate areas was attempted and the values are reported in Fig. 6a. For the 2.8 and 5 wt% nominal concentrations, the T-S aggregate projected areas range between 10 and 15 μm2, while for T-Lite, much lower values are measured at around 2 μm2.
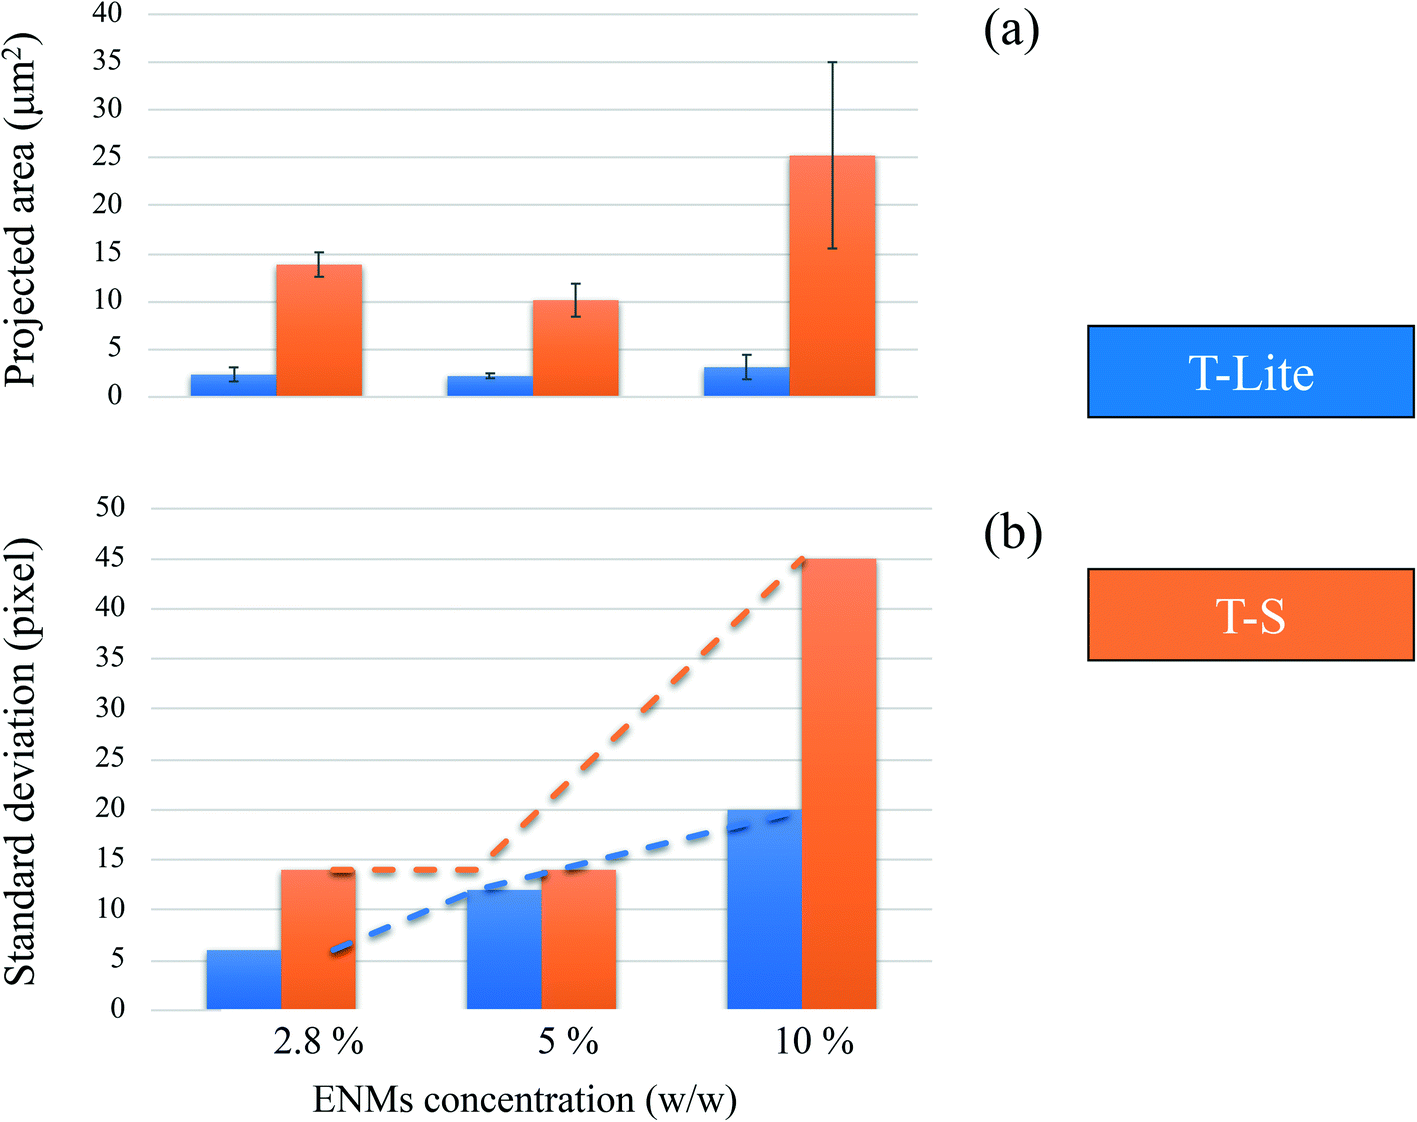 | ||
| Fig. 6 Image analysis of the 2D-XRA map as a function of the sunscreen ENM nominal concentration and type – (a): average projected areas of the ENM aggregates. Error bars correspond to the standard deviation of the area distribution; (b): standard deviation of the greyscale distribution after blank subtraction. | ||
At the highest ENM nominal concentration of 10 wt%, both T-S and T-Lite sunscreens show a lack of homogeneity in the ENM distribution, including the presence of highly concentrated ENM areas (>10 wt%) and voids (<5 wt%). In both cases, the greyscale distributions lie below the theoretical value of X-ray absorption for the 10% TiO2 concentration. This means that most of the sunscreen area is under-concentrated with regard to the expected 10 wt% value. Indeed 71 and 41% of the map areas correspond to the 5–10 wt% concentration domain, while only 8 and 6% correspond to the >10 wt% domain, in the T-Lite and T-S samples respectively. For the TS sunscreen series, this comes in line with the observations made at lower nominal concentrations, showing already a lack of homogeneity due to ENM aggregation. Here, the average projected aggregate area increases to around 25 μm2, together with a larger deviation of the size value, i.e. sample heterogeneity, compared to the T-S samples with lower concentrations (Fig. 6a). However, for the more performing T-Lite series, this observation at 10 wt% contradicts the relatively high affinity of the ENMs for the oil dispersing medium. This suggests that saturation of the sunscreen formulation takes place at a high ENM load, which leads to particle aggregation and loss of dispersion homogeneity. Nevertheless, the projected aggregate area for TLite-10 still remains much smaller, around 3 μm2, than those for the T-S samples (Fig. 6a). Indeed, the TLite-10 map shows a finer distribution of the highly concentrated units on its whole area than that for TS10, which shows larger units not homogeneously dispersed.
The standard deviations of each greyscale distribution after blank subtraction are reported in Fig. 6b, as a possible rapid indicator of the global formulation homogeneity. Here, we assume that a lower standard deviation, i.e. a narrower greyscale distribution width, would indicate a more homogeneous sunscreen emulsion, containing less high density aggregates and/or less voids. As expected, at every ENM concentration studied, the values for the T-Lite samples indicate a narrower greyscale distribution, i.e. a more homogeneous sunscreen emulsion, than those for the T-S samples. Nevertheless, the standard deviation for the T-Lite samples also increases linearly with the ENM concentration, indicating a progressive decrease of the sample homogeneity. This is certainly the effect of increasing ENM load that favors the formation of aggregates and voids, as already discussed. For the T-S samples, the greyscale standard deviation remains unchanged at 2.8 and 5% w/w, whereas it increases strongly at 10% load, indicating a dramatic decrease in homogeneity. This trend is in good agreement with the aggregate projected area plotted in Fig. 6a and with the dramatic loss of SPF value in the TS-10 sunscreen (Fig. 2). This confirms the relationship between these three characteristics, and thus, that the greyscale standard deviation could be used as a preliminary indicator of the emulsion dispersion.
Sunscreen samples were also analyzed using scanning-transmission electron microscopy in cryogenic mode, in order to compare the information provided by this analytical method to that from 2D-XRA. Cryo-STEM has already been used successfully to detect ENMs in sunscreen formulations and to provide additional information such as their primary particle size and shape.22
Here, only the TLite-2.8 and TS-2.8 samples were analyzed with Cryo-STEM, because higher ENM loads would lead to image saturation by the nanoparticles and prevent qualitative analysis. Of note, this constitutes a primary limitation of Cryo-STEM with regard to 2D-XRA. EDX analysis allows for the distinction and mapping of the three main sunscreen components: ENMs, oil and water. In both samples (Fig. 7 and 8), the presence of TiO2 ENMs is confirmed by the EDX mapping of titanium in the corresponding areas (images in Fig. 7c and f and 8c and f). Also, EDX analysis highlighted the carbon and oxygen distribution in the sample. We assume that the areas dominated by the presence of carbon are associated with the sunscreen oil phase while the areas dominated by the presence of oxygen are associated with the aqueous phase. Superimposition of different emulsion phases, which can affect the data interpretation of the STEM images, was minimized here by analyzing ultrathin sample slices (∼80 nm thickness) that allowed for a more accurate distinction of the emulsion phases. Of note, the lacey carbon background of the support grid superimposes with the carbon signal from the oil, due to the thin sample transparency, but distinction of the two contributions remains possible.
 | ||
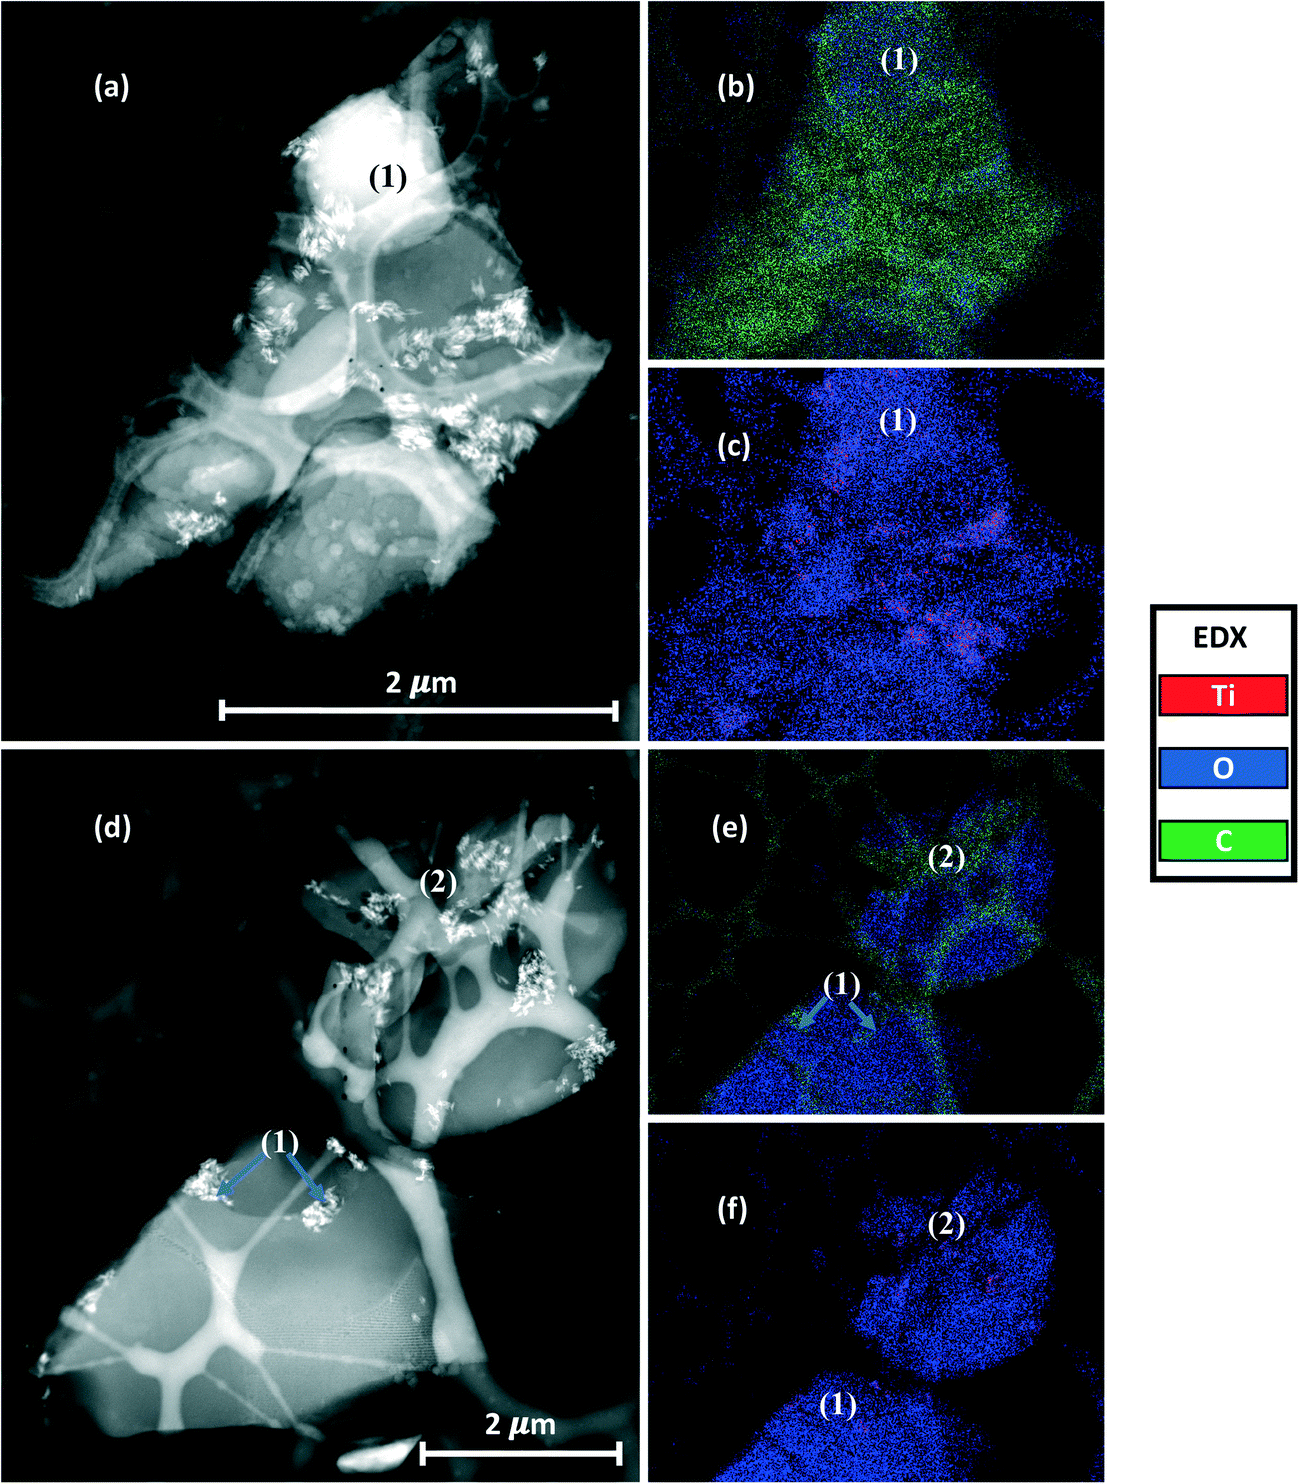
| Fig. 7 (a and c) Cryo-STEM images on TS-2.8. (b and d) Related EDX analysis of titanium, oxygen and carbon. | ||
 | ||
| Fig. 8 (a and d) Cryo-STEM image on TLite-2.8. (b and e) EDX analysis of oxygen/carbon and oxygen/titanium images (c and f). | ||
In the TS-2.8 sample (Fig. 7), the presence of brighter contrasting areas is attributed to nanoparticle aggregates of ≅2 μm size, which are clearly visible in Fig. 7a, and evidenced in the Ti map in Fig. 7b. In the second slice (Fig. 7c) the ENM dispersion appears finer with the presence of smaller aggregates of <1 μm size. In both slices, the water and oil phases constituting the emulsion are clearly distinguished in the EDX maps (Fig. 7b and d) by the distinction of high carbon signal areas (oil) and high oxygen signal areas (water). The detection of titanium from ENMs only inside the areas with high carbon content (Fig. 7b and d) suggests that UV filters are concentrated in the oil phase, which is in accordance with the hydrophobic property of the ENMs. It is worth noting that in the areas (1) and (2) of the images in Fig. 7c and d, the ENMs appear more concentrated at the interface between the water and oil phases (blue arrows). ENMs may compete here with some other oil phase components (e.g. surfactants) to interact at the oil–water interface, eventually stabilizing the emulsion.36 However, confirming this mechanism would require additional analysis. Two types of T-S ENM distributions in the formulation were evidenced by Cryo-STEM, with some larger aggregates remaining stuck in their original oil dispersing medium, and some finer particles reorganized in local areas with respect to their surface affinity, i.e. at the oil/water interface.
The Cryo-STEM images for the TLite-2.8 sample are shown in Fig. 8. In order to facilitate the interpretation of the EDX analysis, the C and O signals are mapped together to highlight the emulsion structure (Fig. 8b and e), and the O and Ti signals are mapped together to visualize the ENM dispersion (Fig. 8c and f). Compared to TS-2.8, the ENMs appear more dispersed with most of the aggregates observed being <1 μm. This results in a lower detection of Ti in the EDX map, due to a lower contrast in the image compared to the O and C contributions. Some titanium agglomerates however remain visible in Fig. 8c.
Regarding the emulsion structure, the EDX maps of the two TLite-2.8 slices show that the oil and water phases are barely distinguishable and poorly reproducible, while they were clearly separate in the TS-2.8 sample. Here, one TLite-2.8 slice (Fig. 8a and c) shows a carbon signal prevailing over the oxygen one, which is attributed to the oil phase, except in the area (1) where the presence of oxygen could correspond to a water droplet. The EDX map of the other slice (Fig. 8d and e) shows a prevalence of oxygen over carbon, suggesting an excess of the water phase with regard to the oil. Unlike what was seen in the TS-2.8 sample (Fig. 7c), it is not evident in TLite-2.8 whether the ENMs are preferentially concentrated at the O/W interface. See e.g. areas (1) and (2) (Fig. 8d and e). This is in line with the difficulty in distinguishing the particles and the emulsion phases (Fig. 8e(2)).
4. General discussion
The determination of the primary size, shape and aggregation state of nanoparticulate UV filters in a cosmetic formulation like sunscreens is essential to evaluate the product efficacy in absorbing UV rays, and to anticipate and minimize the potential risk related to the ENMs. 2D X-ray absorption imaging proved to be a powerful technique in this context, as it enabled in situ characterization of ENM distributions in a complex multiphasic system without altering the original characteristics of the emulsion. Not only qualitative but also quantitative information on the ENM distribution could be obtained from 2D-XRA image analysis by using greyscale thresholding. The respective proportions of the areas with high, low or optimal UV filter concentration could be measured, so a finer evaluation of the formulation homogeneity was achieved with a precise estimation of the sample surface giving appropriate protection or under-protection from UV-rays. Projected areas containing large ENM aggregates (roughly >300 nm) could be easily distinguished from the rest of the emulsion and measured. Smaller aggregates could not be distinguished, due to lower contrast to X-rays, and were even more attenuated in 2D projection analysis. However, the absence or low detection of such aggregates could be used as an indication of fine UV filter dispersion.The sensitivity to X-rays of the higher density of the mineral UV-filters dispersed in the formulation makes 2D-XRA imaging a powerful tool to provide more precise information compared to techniques such as multi-photon tomography (MPT) and laser scanning confocal microscopy (LSCM) used in previous studies19,21 to characterize similar colloidal systems. Although these methods are capable of providing qualitative information on the dispersion state of ENMs in a formulation at the micrometer scale, due to resolution limits, they could not provide a quantitative description of the particles or aggregate sizes and of the homogeneity of the formulation.
Ultramicrotome/Cryo-STEM analysis of the lower concentration sunscreens provided a larger magnification and thus a clearer visualization of particle aggregates and primary particles, complementing the observations made with 2D-XRA imaging. The preparation of ultrathin (80 nm) sample slices obtained using a cryogenic ultramicrotome, and coupling to EDX analysis, allowed a finer distinction of the emulsion phases and of the ENM dispersion characteristics. Notably, any eventual ENM concentration in particular areas, such as the oil/water interface, as known in Pickering-like emulsions, can be evidenced with this approach. However, due to the smaller observation field compared to that in 2D X-ray absorption imaging, Cryo-STEM could not give insight on the dispersion state and homogeneity of the overall product nor the presence of large micrometric aggregates that give evidence of a non-optimal formulation. Indeed, any variability of the ENM aggregate size when a heterogeneous sample is analyzed leads to a lack of reproducibility at this scale of observation. All these considerations taken together with the time-consuming sample preparation and imaging (2D-XRA: 2–3 h; Cryo-STEM: ∼2 days), as well as the expensive cost, suggest that Cryo-STEM should be employed only when the determination of the primary particle size and shape and precise ENM localization in an emulsion is required. However, the two techniques seem to be complementary and could be thus employed together in order to have a larger picture of the ENM fate and behavior in sunscreen formulations.
Conclusions
This work showed for the first time the capability of 2D X-ray absorption imaging to analyze and quantify both the distribution and dispersion behavior of ENMs in a sunscreen formulation, without altering its original structure. Such a methodology could eventually be employed in the future to analyze ENMs in other suitable multiphasic media (cosmetics; paintings; drugs).The determination of ENM UV filter aggregate size in a cosmetic formulation is essential not only for the biological/environmental risk assessment of the product, but also to optimize the product design. The relationship between the aggregation state of the ENMs in the formulation and the solar protection efficiency that was observed in the present work confirmed that more finely dispersed nanoparticles lead to a sunscreen with a higher SPF.15 In contrast, aggregation of the UV filters leads to a more heterogeneous formulation that eventually results in protection voids against UV-rays on the user's skin, which can be quantified by this method.
Two hydrophobic ENM UV-filters were selected and formulated here as case studies. They showed different affinities for the cosmetic oil dispersing medium, which was associated with contrasting dispersion states in the final formulation. The UV filter with a low polar character and higher Lifshitz–van der Waals component was better dispersed in the W/O sunscreen formulation at every concentration tested, which eventually led to more efficient UV screening compared to the formulation containing the more aggregated UV filter. In the case of 10 wt% ENMs, a concentration typically found in mineral sunscreens labeled with SPF 20, the gain in SPF reached 6 units in the sunscreen with less aggregated UV filters. Meanwhile, we could evidence that this high mineral load tended to decrease the formulation homogeneity, due to the ENMs favoring aggregation and/or over-saturation of the formulation, even with the most stable UV filter (T-Lite). These results illustrate the crucial effects of particle aggregation and formulation homogeneity on sunscreen performance. The 2D-XRA imaging methodology discussed herein is capable of rapidly quantifying these aspects inside a sunscreen, with no particular need for sample preparation. Moreover, this tool does not require any particular knowledge of the product or any calibration. Such quantitative structural analysis can be obtained simply by providing the nominal concentration of the mineral UV filter used in the product, the latter being used to calculate the theoretical X-ray absorption corresponding to an optimal UV filter dispersion.
This provides a powerful tool to fabricate sunscreens using a safe(r)-by-design approach, helping to select the most appropriate mineral UV-filter in a given matrix and its optimal concentration. Indeed, lowering the UV filter concentration and maximizing the formulation homogeneity while the product SPF is kept as high as possible would eventually allow the fabrication of sunscreens with a lower impact on consumer health and on the environment because a lower amount of active ingredient would be applied to the skin, thus reducing consumer exposure as well as the amount potentially released into the environment.
Conflicts of interest
There are no conflicts to declare.Acknowledgements
This work has received funding from the European Union's Horizon 2020 research and innovation program under the Marie Skłodowska-Curie grant agreement No713750. It has also received funding from the Excellence Initiative of Aix-Marseille University – A*MIDEX, a French “Investissements d'Avenir” program, through its associated Labex SERENADE project. This work is also a contribution to the OSU-Institut Pythéas and IPR Innove. This work benefited from the MATRIX 2D and 3D X-ray imaging platform (CEREGE, France), partly funded by the “Investissements d'Avenir” French Government program of the French National Research Agency (ANR) through Nano-ID (EQUIPEX project ANR-10-EQPX39-01) and Matrix is a member of the REGEF French CNRS-INSU network. TEM OSIRIS is part of the NanoID platform supported by the French Research National Agency in the frame of Investissement d'Avenir ANR-10-EQPX-39.References
- M. J. Pitkethy, Nanoparticles as Building Blocks?, Mater. Today, 2003, 6(12), 36–42, DOI:10.1016/S1369-7021(03)00022-1.
- A. D. Maynard, Nanotechnology: The Next Big Thing, or Much Ado about Nothing?, Ann. Occup. Hyg., 2007, 51(1), 1–12, DOI:10.1093/annhyg/mel071.
- J. Wang and W. Wang, Significance of Physicochemical and Uptake Kinetics in Controlling the Toxicity of Metallic Nanomaterials to Aquatic Organisms, J. Zhejiang Univ., Sci., A, 2014, 15(8), 573–592, DOI:10.1631/jzus.A1400109.
- D. M. E. Slijkerman and M. Keur, Sunscreen Ecoproducts : Product Claims, Potential Effects and Environmental Risks of Applied UV Filters, IMARES Onderzoeksformatie Wageningen Marine Research, Den Helder, 2018, DOI:10.18174/457209.
- U. Osterwalder, M. Sohn and B. Herzog, Global State of Sunscreens, Photodermatol. Photoimmunol. Photomed., 2014, 30(2–3), 62–80, DOI:10.1111/phpp.12112.
- A. M. Holmes, Z. Song, H. R. Moghimi and M. S. Roberts, Relative Penetration of Zinc Oxide and Zinc Ions into Human Skin after Application of Different Zinc Oxide Formulations, ACS Nano, 2016, 10(2), 1810–1819, DOI:10.1021/acsnano.5b04148.
- G. Oberdörster, A. Maynard, K. Donaldson, V. Castranova, J. Fitzpatrick, K. Ausman, J. Carter, B. Karn, W. Kreyling, D. Lai, S. Olin, N. Monteiro-Riviere, D. Warheit and H. Yang, Principles for Characterizing the Potential Human Health Effects from Exposure to Nanomaterials: Elements of a Screening Strategy, Part. Fibre Toxicol., 2005, 2(1), 8, DOI:10.1186/1743-8977-2-8.
- G. Oberdörster, E. Oberdörster and J. Oberdörster, Nanotoxicology: An Emerging Discipline Evolving from Studies of Ultrafine Particles, Environ. Health Perspect., 2005, 113(7), 823–839, DOI:10.1289/ehp.7339.
- N. A. Monteiro-Riviere, K. Wiench, R. Landsiedel, S. Schulte, A. O. Inman and J. E. Riviere, Safety Evaluation of Sunscreen Formulations Containing Titanium Dioxide and Zinc Oxide Nanoparticles in UVB Sunburned Skin: An In Vitro and In Vivo Study, Toxicol. Sci., 2011, 123(1), 264–280, DOI:10.1093/toxsci/kfr148.
- M. Shakeel, F. Jabeen, S. Shabbir, M. S. Asghar, M. S. Khan and A. S. Chaudhry, Toxicity of Nano-Titanium Dioxide (TiO2-NP) Through Various Routes of Exposure: A Review, Biol. Trace Elem. Res., 2016, 172(1), 1–36, DOI:10.1007/s12011-015-0550-x.
- J. Labille, R. Catalano, D. Slomberg, S. Motellier, A. Pinsino, P. Hennebert, C. Santaella and V. Bartolomei, Assessing Sunscreen Lifecycle to Minimize Environmental Risk Posed by Nanoparticulate UV-Filters – A Review for Safer-by-Design Products, Front. Environ. Sci. Eng., 2020, 8, 101, DOI:10.3389/fenvs.2020.00101.
- I. Fekete-Kertész, G. Maros, K. Gruiz and M. Molnár, The Effect of TiO2 Nanoparticles on the Aquatic Ecosystem: A Comparative Ecotoxicity Study with Test Organisms of Different Trophic Levels, Period. Polytech., Chem. Eng., 2016, 60(4), 231–243, DOI:10.3311/PPch.8869.
- Guidance for Industry CGMP for Phase 1 Investigational Drugs. 20.
- N. Zheng, D. D. Sun, P. Zou and W. Jiang, Scientific and Regulatory Considerations for Generic Complex Drug Products Containing Nanomaterials, AAPS J., 2017, 19(3), 619–631, DOI:10.1208/s12248-017-0044-1.
- K. M. Tyner, A. M. Wokovich, D. E. Godar, W. H. Doub and N. Sadrieh, The State of Nano-Sized Titanium Dioxide (TiO2) May Affect Sunscreen Performance: Nano-Sized TiO2 and Sunscreen Performance, Int. J. Cosmet. Sci., 2011, 33(3), 234–244, DOI:10.1111/j.1468-2494.2010.00622.x.
- R. Catalano, A. Masion, F. Ziarelli, D. Slomberg, J. Laisney, J. M. Unrine, A. Campos and J. Labille, Optimizing the Dispersion of Nanoparticulate TiO2-Based UV Filters in a Non-Polar Medium Used in Sunscreen Formulations – The Roles of Surfactants and Particle Coatings, Colloids Surf., A, 2020, 599, 124792, DOI:10.1016/j.colsurfa.2020.124792.
- L. Peltonen, Practical Guidelines for the Characterization and Quality Control of Pure Drug Nanoparticles and Nano-Cocrystals in the Pharmaceutical Industry, Adv. Drug Delivery Rev., 2018, 131, 101–115, DOI:10.1016/j.addr.2018.06.009.
- K. M. Tyner, A. M. Wokovich, W. H. Doub, L. F. Buhse, L.-P. Sung, S. S. Watson and N. Sadrieh, Comparing Methods for Detecting and Characterizing Metal Oxide Nanoparticles in Unmodified Commercial Sunscreens, Nanomedicine, 2009, 4(2), 145–159, DOI:10.2217/17435889.4.2.145.
- A. Wokovich, K. Tyner, W. Doub, N. Sadrieh and L. F. Buhse, Particle Size Determination of Sunscreens Formulated with Various Forms of Titanium Dioxide, Drug Dev. Ind. Pharm., 2009, 35(10), 1180–1189, DOI:10.1080/03639040902838043.
- P. J. Lu, W. L. Cheng, S. C. Huang, Y. P. Chen, H. K. Chou and H. F. Cheng, Characterizing Titanium Dioxide and Zinc Oxide Nanoparticles in Sunscreen Spray, Int. J. Cosmet. Sci., 2015, 37(6), 620–626, DOI:10.1111/ics.12239.
- M. K. Butler, T. W. Prow, Y.-N. Guo, L. L. Lin, R. I. Webb and D. J. Martin, High-Pressure Freezing/Freeze Substitution and Transmission Electron Microscopy for Characterization of Metal Oxide Nanoparticles within Sunscreens, Nanomedicine, 2012, 7(4), 541–551, DOI:10.2217/nnm.11.149.
- A. Philippe, J. Košík, A. Welle, J.-M. Guigner, O. Clemens and G. E. Schaumann, Extraction and Characterization Methods for Titanium Dioxide Nanoparticles from Commercialized Sunscreens, Environ. Sci.: Nano, 2018, 5(1), 191–202, 10.1039/C7EN00677B.
- K. Schilling, B. Bradford, D. Castelli, E. Dufour, J. F. Nash, W. Pape, S. Schulte, I. Tooley, J. van den Bosch and F. Schellauf, Human Safety Review of “Nano” Titanium Dioxide and Zinc Oxide, Photochem. Photobiol. Sci., 2010, 9(4), 495, 10.1039/b9pp00180h.
- L. Rowenczyk, C. Duclairoir-Poc, M. Barreau, C. Picard, N. Hucher, N. Orange, M. Grisel and M. Feuilloley, Impact of Coated TiO2-Nanoparticles Used in Sunscreens on Two Representative Strains of the Human Microbiota: Effect of the Particle Surface Nature and Aging, Colloids Surf., B, 2017, 158, 339–348, DOI:10.1016/j.colsurfb.2017.07.013.
- D. Terescenco, N. Hucher, G. Savary and C. Picard, From Interface towards Organised Network: Questioning the Role of the Droplets Arrangements in Macroscopically Stable O/W Emulsions Composed of a Conventional Non-Ionic Surfactant, TiO2 Particles, or Their Mixture, Colloids Surf., A, 2019, 578, 123630, DOI:10.1016/j.colsurfa.2019.123630.
- C. J. Van Oss, M. K. Chaudhury and R. J. Good, Interfacial Lifshitz-van Der Waals and Polar Interactions in Macroscopic Systems, Chem. Rev., 1988, 88(6), 927–941, DOI:10.1021/cr00088a006.
- C. J. Van Oss, R. J. Good and M. K. Chaudhury, Additive and Nonadditive Surface Tension Components and the Interpretation of Contact Angles, Langmuir, 1988, 4(4), 884–891, DOI:10.1021/la00082a018.
- L. Ferrero, M. Pissavini, A. Dehais, S. Marguerie and L. Zastrow, Importance of Substrate Roughness for in Vitro Sun Protection Assessment, Int. J. Cosmet. Sci., 2007, 29(1), 59–59, DOI:10.1111/j.1467-2494.2007.00340_2.x.
- B. L. Henke, E. M. Gullikson and J. C. Davis, X-Ray Interactions: Photoabsorption, Scattering, Transmission, and Reflection at E = 50-30,000 eV, Z = 1-92, At. Data Nucl. Data Tables, 1993, 54(2), 181–342, DOI:10.1006/adnd.1993.1013.
- J. H. Hubbell, W. M. J. Veigele, E. A. Briggs, R. T. Brown, D. T. Cromer and R. J. Howerton, Atomic Form Factors, Incoherent Scattering Functions, and Photon Scattering Cross Sections, J. Phys. Chem. Ref. Data, 1975, 4(3), 471–538, DOI:10.1063/1.555523.
- Z. Xu, Q. Liu and J. Ling, An Evaluation of the van Oss-Chaudhury-Good Equation and Neumann's Equation of State Approach with Mercury Substrate, Langmuir, 1995, 11(3), 1044–1046, DOI:10.1021/la00003a058.
- V. N. Paunov, O. J. Cayre, P. F. Noble, S. D. Stoyanov, K. P. Velikov and M. Golding, Emulsions Stabilised by Food Colloid Particles: Role of Particle Adsorption and Wettability at the Liquid Interface, J. Colloid Interface Sci., 2007, 312(2), 381–389, DOI:10.1016/j.jcis.2007.03.031.
- J. Chou, T. J. Robinson and H. Doan, Rapid Comparison of UVB Absorption Effectiveness of Various Sunscreens by UV-Vis Spectroscopy, J. Anal. Bioanal. Tech., 2017, 08(02), 355, DOI:10.4172/2155-9872.1000355.
- D. R. Sambandan and D. Ratner, Sunscreens: An Overview and Update, J. Am. Acad. Dermatol., 2011, 64(4), 748–758, DOI:10.1016/j.jaad.2010.01.005.
- F. Martínez-López, M. A. Cabrerizo-Vílchez and R. Hidalgo-Álvarez, Colloidal Interaction at the Air–Liquid Interface, J. Colloid Interface Sci., 2000, 232(2), 303–310, DOI:10.1006/jcis.2000.7172.
- S. Stiller, H. Gers-Barlag, M. Lergenmueller, F. Pflücker, J. Schulz, K. P. Wittern and R. Daniels, Investigation of the Stability in Emulsions Stabilized with Different Surface Modified Titanium Dioxides, Colloids Surf., A, 2004, 232(2–3), 261–267, DOI:10.1016/j.colsurfa.2003.11.003.
| This journal is © The Royal Society of Chemistry 2021 |