
Understanding controls on the geochemistry of hydrocarbon produced waters from different basins across the US†
Shikha
Sharma
 *a,
Vikas
Agrawal
a,
Rawlings N.
Akondi
a,
Yifeng
Wang
b and
Alexandra
Hakala
c
*a,
Vikas
Agrawal
a,
Rawlings N.
Akondi
a,
Yifeng
Wang
b and
Alexandra
Hakala
c
aWest Virginia University, Department of Geology & Geography, 330 Brooks Hall, 98 Beechurst Ave., Morgantown, WV 26506, USA. E-mail: shikha.sharma@mail.wvu.edu; Tel: +1-304-293-6717
bSandia National Laboratories, 4100 National Parks Highway, Carlsbad, New Mexico 88220, USA
cNational Energy Technology Laboratory, US Department of Energy, Pittsburgh, PA 15236, USA
First published on 15th December 2020
Abstract
The most massive waste stream generated by conventional and unconventional hydrocarbon exploration is the produced water (PW). The costs and environmental issues associated with the management and disposal of PW, which contains high concentrations of inorganic and organic pollutants, is one of the most challenging problems faced by the oil and gas industry. Many of the current strategies for the reuse and recycling of PW are inefficient because of varying water demand and the spatial and temporal variations in the chemical composition of PW. The chemical composition of PW is controlled by a multitude of factors and can vary significantly over time. This study aims to understand different parameters and processes that control the quality of PW generated from hydrocarbon-bearing formations by analyzing relationships between their major ion concentrations, O, H, and Sr isotopic composition. We selected PW data sets from three conventional (Trenton, Edwards, and Wilcox Formations) and four unconventional (Lance, Marcellus, Bakken, and Mesaverde Formations) oil and gas formations with varying lithology and depositional environment. Using comparative geochemical data analysis, we determined that the geochemical signature of PW is controlled by a complex interplay of several factors, including the original source of water (connate marine vs. non-marine), migration of the basinal fluids, the nature and degree of water–mineral–hydrocarbon interactions, water recharge, processes such as evaporation and ultrafiltration, and production techniques (conventional vs. unconventional). The development of efficient PW recycle and reuse strategies requires a holistic understanding of the geological and hydrological history of each formation to account for the temporal and spatial heterogeneities.
 Shikha Sharma | Shikha Sharma is Professor of Geology and Director of IsoBioGem Laboratory at West Virginia University. She is a multidisciplinary earth scientist with >15 years of experience addressing a wide range of issues revolving around the Water–Environment–Energy Nexus. Her research focuses on the application of isotopic, geochemical, biomarker, spectroscopic, and mineralogical tools, and proxies to understand molecular to field-scale physico-biogeochemical processes, transport of contaminants in anthropogenically disturbed hydrologic systems and, cycling of C/N/O/S/H in modern and ancient environments. She has authored several peer-review publications and spearheads outreach activities to enhance public understanding of environmental issues. |
 Vikas Agrawal | Vikas Agrawal is a Research Assistant Professor and the manager of the IsoBioGeM Laboratory. He has a PhD in Geochemistry from West Virginia University. He utilizes organic and inorganic geochemical tools to address various issues related to energy and the environment. His expertise in molecular geochemistry has improved the understanding of the structural heterogeneities in natural organic matter, that can impact hydrocarbon recovery and release of organic/inorganic contaminants. His recent research focuses on understanding subsurface rock–fluid interactions, geologic carbon sequestration, waste management, rare earth element (REE) association in coals, and the impact of seawater intrusion in coastal wetlands. |
 Rawlings Akondi | Rawlings Akondi is a Chemical Process Engineer with Intel Corporation. He has a PhD in Geochemistry in 2019 from West Virginia University, USA. He holds a diploma in Education (Geology/Physics) from the University of Yaounde 1 (2008) and a BS in Geology (First Class) from University of Buea (2000) Cameroon, an MS in Aqueous Geochemistry from Oklahoma state University (2014). |
 Yifeng Wang | Yifeng Wang is a Distinguished Member of the Technical Staff at Sandia with more than 110 peer-reviewed publications and 10 U.S. patents. He is a pioneer of nanogeochemistry – a new research area in understanding nanostructural controls on chemical reactions and fluid dynamics in both engineered and natural materials. He has, for the first time, demonstrated that nanopore confinement can significantly affect chemical reactions at mineral–water interfaces. Recently, using molecular dynamics and Monte-Carlo simulations, he and his colleagues have revealed many interesting emergent behaviors of fluid flow and mass transport in nanoporous natural materials, especially in nanoporous shale matrix. |
 Alexandra Hakala | Alexandra Hakala is a NETL Environmental Geochemist whose research interests focus on leveraging geochemical processes to increase the efficiency of producing energy while minimizing environmental impacts. She earned her A.B. cum laude in Geosciences with a Certificate in Environmental Studies from Princeton University in 2003, and her Ph.D. in the School of Earth Sciences at The Ohio State University in 2008. Dr Hakala was a post-doctoral research associate at NETL in 2008, and became a NETL research scientist in 2009. While at NETL, Dr Hakala has led collaborative R&D both as a research portfolio leader and principal investigator. |
Environmental significanceProduced water (PW) is the most massive waste stream generated by conventional and unconventional hydrocarbon exploration. Many of the current strategies for reuse and recycling of PW are inefficient because of varying water demand and the spatial and temporal variations in the chemical composition of PW. In this study, we selected PW data sets from three conventional and four unconventional oil and gas formations with varying lithology and depositional environment. This goal was to understand different parameters and processes that control the quality of PW generated from these hydrocarbon-bearing formations by analyzing relationships between their major ion concentrations, O, H, and Sr isotopic composition. |
1. Introduction
One of the most challenging issues faced by both the unconventional and conventional oil and gas industry is the economic and environmentally-sustainable management of “produced water (PW)” a byproduct associated with their drilling, completions and production operations. Global production of PW is estimated to be >70 billion barrels per annum, out of which 24.4 billion barrels are produced by the US alone.1,2 Most PWs are highly saline and can contain a variety of inorganic and organic contaminants, including calcium, magnesium, barium, sulfates, bromide; radioactive elements, oil and grease containing polyaromatic hydrocarbons (PAHs), benzene, toluene, ethylbenzene, xylenes (BTEX), phenols, and organic acids, and; other chemical additives used in drilling and well stimulation.3–7 These chemicals can have severe environmental impacts if discharged improperly.5,8–14 Because of its high toxicity and high treatment cost, approximately 46% of the PW is injected into non-commercial and commercial disposal wells.11 This results in wastage of a precious water resource and in some cases over pressurization and induced seismicity at the disposal sites.12,15,16 Considering the shortage of freshwater resources and environmental problems caused by PW disposal, there is a need for implementing better PW recycling strategies. Implementing improved strategies requires an understanding of the PW chemistry and how it changes both spatially and temporally in geological formations of varying lithologies, depositional environments, and hydrogeologic histories.17The quantity and quality of PW can vary significantly in different oil and gas basins because of the variations in lithology and burial history of the geological formation, hydrological history, extent of evaporation of paleo-seawater, diagenetic/dissolution reactions, meteoric recharge, type of hydrocarbons being produced, and the composition of water or chemicals injected into the formation.18 The conventional oil wells produce at an average of about 7 to 10 barrels, or 280 to 400 gallons, of water for every barrel of crude oil.11 The conventional oil wells produce more water than conventional gas wells, and the PW volumes generally increase over time in both types of wells as the oil and gas produced from the reservoirs start to decline.11,19 In nearly depleted fields, the volume of PW could reach 98%, with only 2% hydrocarbons in the produced volume.19,20
Unlike conventional wells, where the PW is composed almost entirely of formation water, the PW from unconventional wells is composed of both flowback water and formation water.21 The “flowback water” is the water produced during the initial days of production and is primarily composed of the returning hydraulic fracturing fluids injected into the formation during well development along with some of the formation water. The water generated after this initial period is referred to as “PW” and is dominantly composed of formation water.22 The cut off time between flowback and PW can range from days to years and is defined variably by different producers and researchers, and hence both waters are generally grouped as “flowback PW”.
Median volumes of flowback PW from the six major unconventional oil and gas formations in the US ranges from 0.5 to 3.8 million gallons or 1.7 to 14.3 million liters per well over the first 5–10 years of production.23 The quantity of flowback PW decreases rapidly after the first few months of production and is accompanied by a sharp increase in salinity.24–30 The mass balance calculations estimate that 92–96% of this flowback PW from unconventional wells is composed of natural formation water or brine.23 Since the significant constituent of flowback PW in unconventional wells is also the formation water, in this paper, we use the general term “PW” for both conventional and unconventional wells.
Numerous studies on PW chemistry suggest that the composition of PW depends mainly on the original source of water (connate marine vs. connate fluvial, intra-basinal, freshwater recharge) and degree of evaporation.18,24,28,30 Other factors affecting PW composition are various diagenetic inorganic and organic interactions, hydrocarbons in the geological formation, and ultrafiltration.18 PW from conventional reservoirs are also influenced by artificial fluids used in drilling and completions operations such as mud filtrates used for drilling, brines for well completion, and seawater for enhanced oil recovery.19,31–33 Further, PW and fresh ‘make-up’ water is commonly added from other formations to reservoirs for EOR with unknown consequences for in situ formation water chemistry.21 In the case of unconventional systems, these interactions are also influenced by the chemical additives included with hydraulic fracturing fluids injected in the formation.23,34–36 Alley et al. 2011 showed there is potential for large differences in chemical and physical properties of PW from different conventional and unconventional reservoirs, and therefore PW disposal and treatment strategies vary significantly.37
The goal of this study was to understand the geochemical variations in PW derived from different petroleum systems (conventional vs. unconventional) of varying lithology (siliciclastic vs. carbonates) and depositional environments (fluvial vs. marine). We utilized the geochemical variations in the major ion concentrations and O, H, and Sr isotopic composition of PW to understand the origin of formation water (i.e., marine or non-marine connate water or evaporite dissolution-derived brine); nature and degree of water-mineral interactions; role and extent of freshwater recharge; role of processes such as evaporation and ultrafiltration, and; impact of oil/gas production technique (i.e. conventional vs. unconventional). The results from this study could be utilized for better predictions of the PW quality at different sites and help to design better water management strategies.
2. Sample selection
Geochemical data of PW samples was compiled from USGS databases.38 All the data were organized and analyzed in an Excel database. The goal was to identify end-member formations in conventional and unconventional petroleum reservoirs with contrasting lithology, depositional environment, and a complete dataset for the major ion concentrations and O, H, Sr isotopic composition. The end-member formations chosen in the study are conventional vs. unconventional formations, carbonates vs. siliciclastic formations, and marine vs. non-marine formations. Seven different formations that were shortlisted based on the criterion mentioned above were Trenton, Edwards, Wilcox, Marcellus, Bakken, Lance, and Mesaverde. The conventional reservoirs chosen are carbonate-rich Trenton and Edwards Formation and clay-rich Wilcox Formation. On the other hand, the unconventional reservoirs are chert-arenite Lance Formation, organic-rich Marcellus Formation, low carbonate-sandstone Bakken Formation, Mesaverde Sandstone as shown in Table 1. The depositional environment, geological time period, and depth of these formations are also variable. The PWs from Marcellus and Trenton Formations have been extensively studied by several researchers; however, there is a limited number of studies on PWs from Mesaverde, Lance, Wilcox, and Edwards Formations.39–42 Moreover, several of these studies were conducted during the 1980s and 1990s and significant new research on the local geology and hydrogeology of these formations has been published after that time period. In this study, we not only determine the role of local geology, hydrogeological history, and different chemical and physical processes on PW chemistry, but also evaluate if our interpretations are in agreement with the previous studies conducted on these formations (including the original studies from which USGS compiled the dataset).| Formation | Reservoir type | Period | Lithology | Basin | Depositional environment |
|---|---|---|---|---|---|
| Trenton | Conventional | Middle ordovician | Limestone | Michigan | Shallow marine to relatively deep-water conditions |
| Edwards | Conventional | Early cretaceous | Limestone | Gulf coast | Extensive, shallow-water, marine platform bounded by deeper water basins |
| Wilcox | Conventional | Paleogene | Clay rich mudstones | Gulf coast | Predominantly fluvial deltaic, with some turbidite deposition in deeper marine environments |
| Marcellus | Unconventional (shale gas) | Middle devonian | Mudstones with low carbonates | Appalachian | Dysoxic to anoxic conditions marine environment |
| Bakken | Unconventional (tight oil) | Late devonian | Sandstones and siltstones with low to high carbonates | Williston | Epicontinental sea - shallow-water high energy conditions |
| Lance | Unconventional (tight gas) | Late cretaceous | Chert-arenite | Green river | Fluvial to marginal marine conditions |
| Mesaverde | Unconventional (tight gas) | Late cretaceous | Sandstones | Green river | Fluvial to marginal marine conditions |
The geochemical parameters, including the major ions, stable isotopes (oxygen and hydrogen), and Sr isotope data of the 387 PW samples from these formations, are listed in the ESI table, ST1.†
3. Results
3.1 Total dissolved solids (TDS)
The TDS values of the PW from all the formations are shown in a box and whisker plot (Fig. 1). The TDS values of all the formations range from 125 mg L−1 to 346![[thin space (1/6-em)]](https://www.rsc.org/images/entities/char_2009.gif) 100 mg L−1. The highest mean values of TDS are observed in Bakken Formation (275069 mg L−1), followed by Trenton (214746 mg L−1), Edwards (139270 mg L−1), Marcellus (133185 mg L−1), Wilcox (37433 mg L−1), Lance (10847 mg L−1), and Mesaverde (8861 mg L−1) Formations (Fig. 1). The highest variation in TDS values are observed in Edwards Formation (values range from 139,500 mg L−1 to 346,100 mg L−1) and least variations in Lance Formation (values range from 4118 mg L−1 to 21395 mg L−1). The TDS values in Bakken Formation range from 128124 mg L−1 to 338868 mg L−1, in Trenton Formation it ranges from 139500 mg L−1 to 346100 mg L−1, in Wilcox Formation it ranges from 1658 mg L−1 to 135268 mg L−1, in Marcellus Formation it ranges from 14800 mg L−1 to 316000 mg L−1, in Mesaverde Formation it ranges from 125 mg L−1 to 13427 mg L−1 (Fig. 1).
100 mg L−1. The highest mean values of TDS are observed in Bakken Formation (275069 mg L−1), followed by Trenton (214746 mg L−1), Edwards (139270 mg L−1), Marcellus (133185 mg L−1), Wilcox (37433 mg L−1), Lance (10847 mg L−1), and Mesaverde (8861 mg L−1) Formations (Fig. 1). The highest variation in TDS values are observed in Edwards Formation (values range from 139,500 mg L−1 to 346,100 mg L−1) and least variations in Lance Formation (values range from 4118 mg L−1 to 21395 mg L−1). The TDS values in Bakken Formation range from 128124 mg L−1 to 338868 mg L−1, in Trenton Formation it ranges from 139500 mg L−1 to 346100 mg L−1, in Wilcox Formation it ranges from 1658 mg L−1 to 135268 mg L−1, in Marcellus Formation it ranges from 14800 mg L−1 to 316000 mg L−1, in Mesaverde Formation it ranges from 125 mg L−1 to 13427 mg L−1 (Fig. 1).
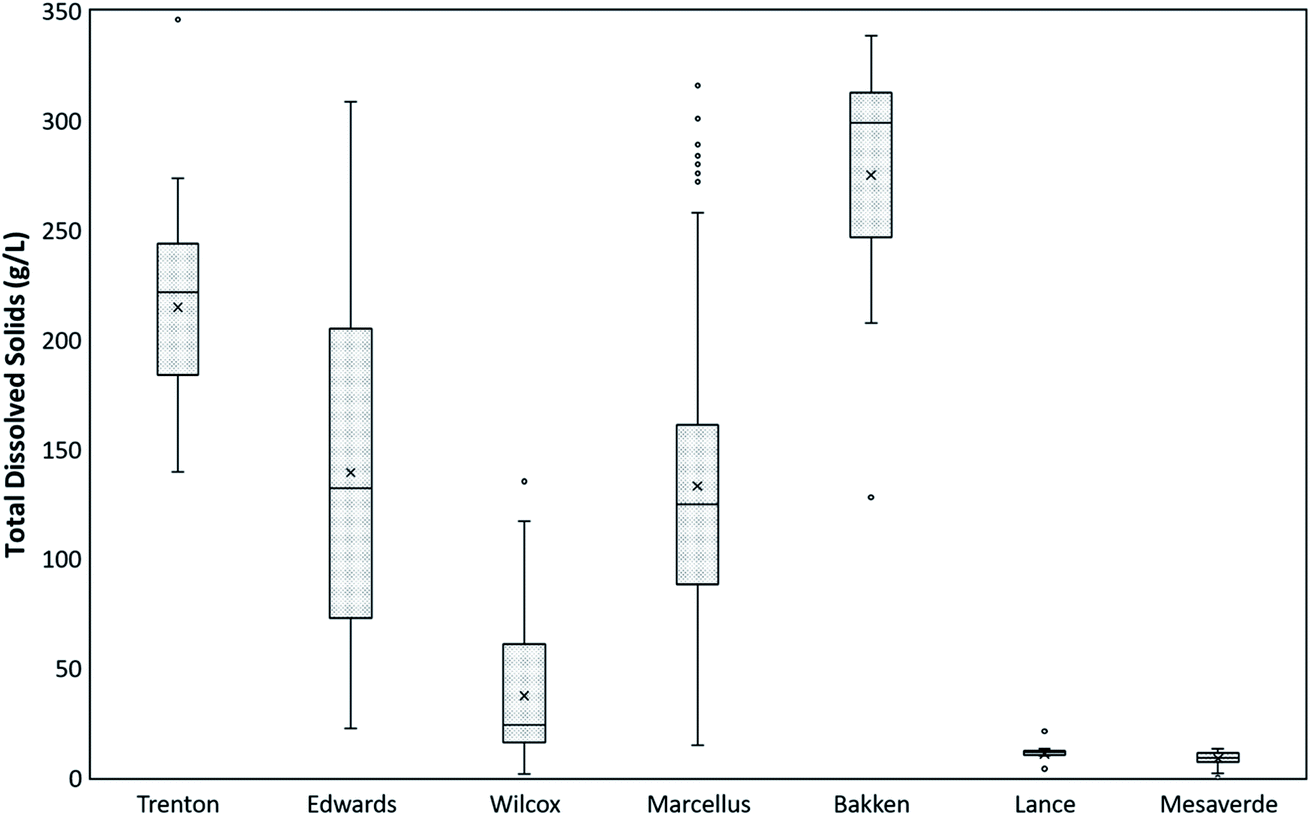 | ||
| Fig. 1 TDS values of PW from different geologic formations. | ||
3.2 Major ions
The major ions present in the PW from all the formations are dominated by Cl followed by Na, then by Ca (Fig. 2). The mean Cl ions concentrations is highest in Bakken Formation (166416 mg L−1), followed by Trenton (134640 mg L−1), Marcellus (80882 mg L−1), Edwards (84613 mg L−1), Wilcox (22688 mg L−1), Lance (7366 mg L−1), and Mesaverde Formations (3626 mg L−1). The mean Na ions concentrations also show a similar trend in different formations. However, the mean Ca ion concentrations are highest in Trenton, followed by Edwards, Bakken, Marcellus, Wilcox, Lance, and Mesaverde Formations. Other major ions include Mg and K (Fig. 3). However, they do not follow a particular trend in different formations. Like the TDS results, the highest variation in major ion values is observed in Edwards Formation and the least variations in Lance Formation.
 | ||
| Fig. 2 Concentrations of dominant major ions Ca, Na, and Cl in PW from different geologic formations. | ||
 | ||
| Fig. 3 Concentrations of major ions Mg and K in PW from different geologic formations. | ||
3.3 Sr concentrations and Sr isotopes
Sr concentration in all the PW samples shows a large range from 0.097 mg L−1 to 10300 mg L−1. The highest Sr ion concentration was present in Marcellus PWs (mean value 2362 mg L−1), followed by Edwards (1568 mg L−1), Bakken (945 mg L−1), Trenton (568 mg L−1), Wilcox (201 mg L−1), Lance (24 mg L−1), and Mesaverde (3 mg L−1) PW (Fig. 4). The 87Sr/86Sr isotope values in all the formations range from 0.70660 to 0.72016. The highest mean 87Sr/86Sr ratio is observed in Mesaverde Formation (0.71641), followed by Lance (0.71218), Marcellus (0.71131), Wilcox (0.71044), Bakken (0.70999), Trenton (0.70989), and Edwards (0.70883) Formations (Fig. 5).
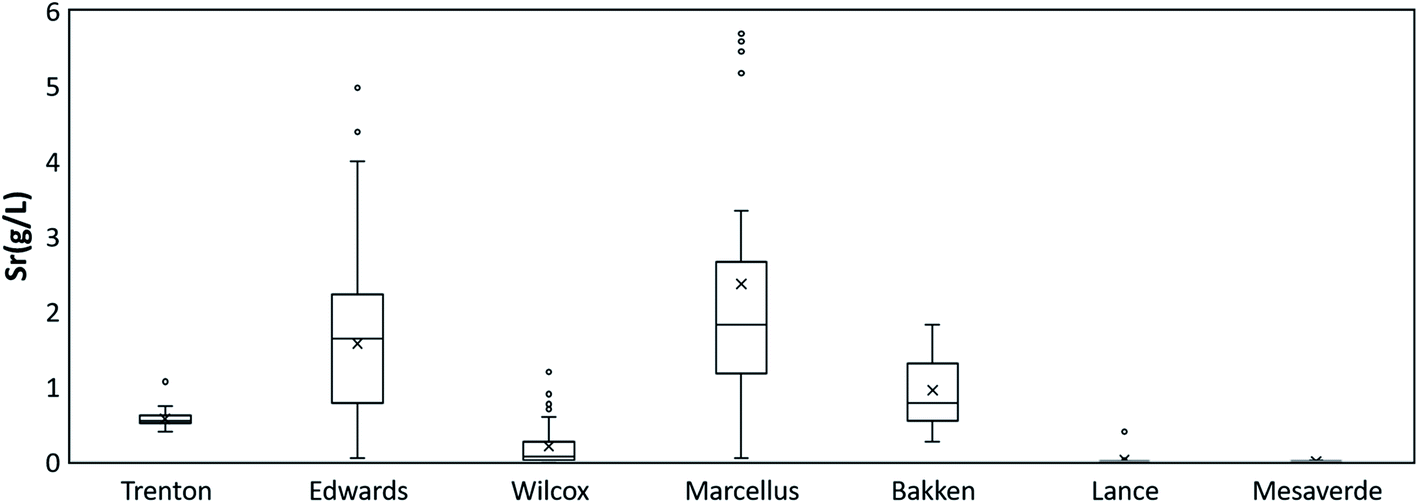 | ||
| Fig. 4 Sr Concentrations in PW from different geologic formations. | ||
 | ||
| Fig. 5 87Sr/86Sr values in PW from different geologic formations. | ||
3.4 Oxygen and hydrogen isotopes
The δ18O values from all the formations range from −10 to 18‰ VPDB. The highest (mean) δ18O values were observed in Edwards (8.8‰ VPDB), followed by Bakken (4.7‰ VPDB), Wilcox (1.0‰ VPDB), Trenton (−2.0‰ VPDB), Marcellus (−2.1‰ VPDB), Lance (−2.9‰ VPDB), and Mesaverde (−4.9‰ VPDB) (Fig. 6). The δ18O values in Edwards Formation range from −3.6 to 18.0‰ VPDB, in Bakken from −10.0 to 11.6‰ VPDB, in Wilcox from −5.4 to 9.7‰ VPDB, in Trenton from −3.1 to 0.4‰ VPDB, in Lance from −6.0 to −0.1‰ VPDB, in Marcellus −5.6 to −0.4‰ VPDB, in Mesaverde −9.2 to −1.9‰ VPDB (Fig. 6).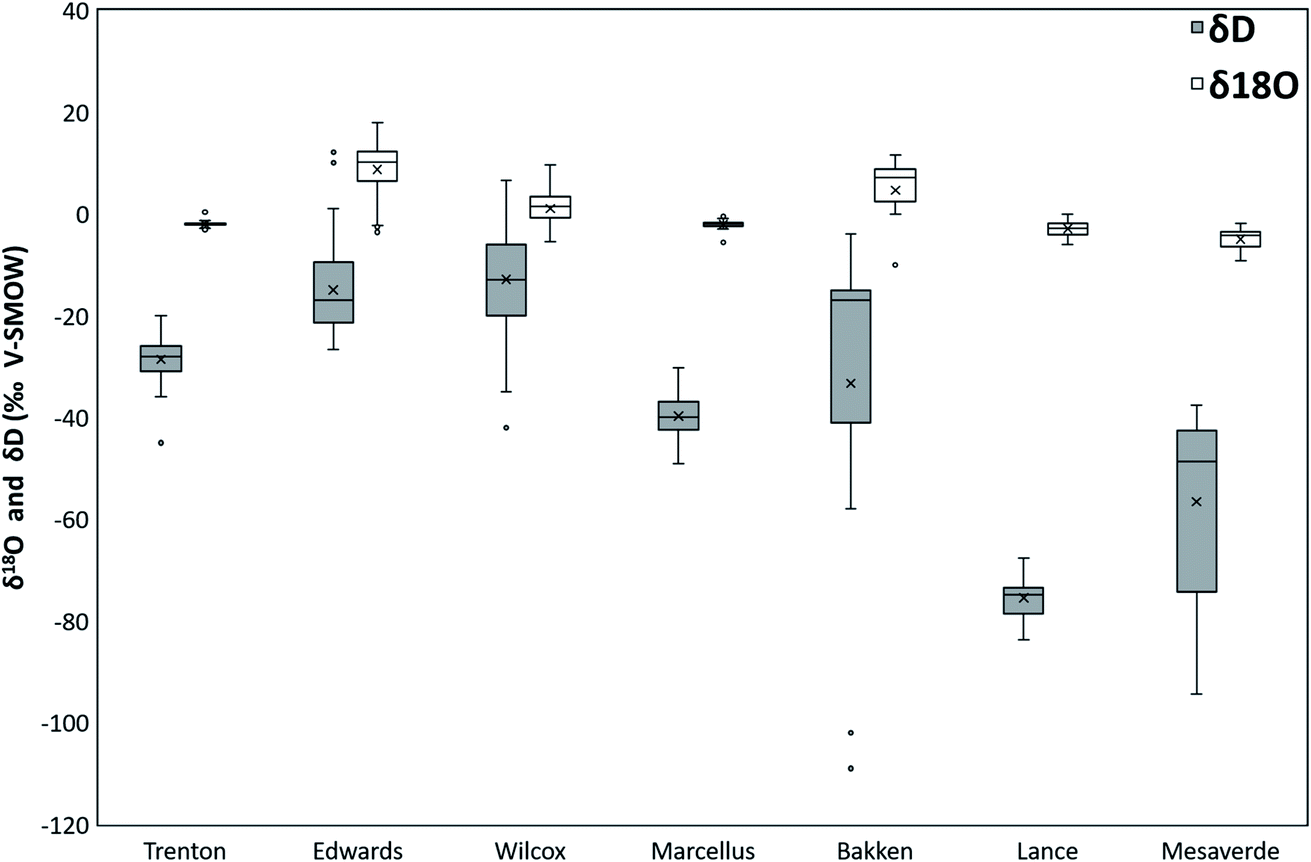 | ||
| Fig. 6 Range of δ18O and δD values of PW from different geologic formations. | ||
The δD values range from −109 to 12.1‰ VSMOW. The highest (mean) δD values were observed in Edwards Formation (−15.0‰ VSMOW), followed by Trenton (−28.6 ‰ VSMOW), Bakken (−33.3‰ VSMOW), Marcellus (−39.7‰ VSMOW), Mesaverde (−56.6‰ VSMOW), Wilcox (−12.9‰ VSMOW), and Lance (−75.5‰ VSMOW) Formations (Fig. 6). The δD values in Edwards Formation ranges from −26.6 to 12.1‰ VSMOW, in Trenton from −45.0 to −20.0‰ VSMOW, in Bakken from −109.0 to −4.0‰ VSMOW, in Marcellus from −49.1 to −30.2‰ VSMOW, in Mesaverde from −94.4 to −37.6‰ VSMOW, in Wilcox from −42.0 to 6.6‰ VSMOW, and in Lance from −83.7 to −67.6‰ VSMOW (Fig. 6).
3.5 Statistical analysis
One-way ANOVA and Tukey's post hoc comparisons were used to determine similarity/differences in concentrations of TDS, and major ions Na, Ca, and Cl between different PW samples (ESI Tables 1–4†). Significant similarities (α = 0.05) in TDS concentrations were observed between Marcellus vs. Edwards PW, Wilcox vs. Mesaverde PW, Wilcox vs. Lance PW, Lance vs. Mesaverde PW. For Na, similarities (α = 0.05) were observed between Trenton vs. Edwards PW, Lance vs. Mesaverde PW. For Cl, similarities (α = 0.05) were observed between Marcellus vs. Edwards PW, Lance vs. Wilcox PW, Lance vs. Mesaverde PW. For Ca, similarities (α = 0.05) were observed between Bakken vs. Edwards PW, Bakken vs. Marcellus PW, Edwards vs. Marcellus PW, Lance vs. Mesaverde PW, Lance vs. Wilcox PW, Wilcox vs. Mesaverde PW.4. Discussion
4.1 Geochemical and isotopic composition of PWs
In this section, we compare the geochemical and isotopic parameters such as TDS and major ion concentrations, Na–Cl–Br systematics, Sr systematics, Ca/Na vs. Cl cross plots, O and H isotopes of the PW samples from all formations. The primary aim is to determine the major geochemical differences and trends in PWs within the same formation and between different end-member formations. These geochemical signatures are used to understand how the local geology and hydrogeological history impacted PW chemistry in different formations. | ||
| Fig. 7 Plot of major ions vs. solutes (TDS) in the PWs from different geologic formations. | ||
The TDS and major ion concentration of PWs from the Wilcox Formation in the Texas region of the Gulf Coast Basin lie in lower to lower-middle value range as compared to other PWs. Wilcox Formation is known to be deposited in a dominantly normal marine environment with some minor fluvio-deltaic input.55 Therefore, PW from Wilcox Formation most likely represents connate marine saline water with relatively higher TDS levels. These relatively higher TDS and major ion concentrations could also be attributed to the pervasive introduction of brines derived from the subsurface dissolution of up-dip salt domes as suggested by.42,45 On the other hand, the Wilcox PWs with lower TDS range might be results of the expulsion of low salinity waters, termed as “shale water,” derived in part from dehydration reactions, including the transformation of smectite to illite or by addition of organic acids by kerogen.42,47,56 Another possibility for low TDS could be fresh meteoric water recharge, especially if the samples are derived from shallower formations.42 These lower TDS (and major ion) PW samples could have led to statistical similarities (p value < 0.05) of Wilcox PWs with Mesaverde and Lance PWs (ESI Tables 1–4†). Similar low-salinity values have also been noted at Wilcox PWs at the Righthand Creek field in Allen Parish, LA.47
Trenton PWs in the Michigan Basin had the second-highest TDS and major ion concentrations (after Bakken). Trenton limestone is known to be deposited in a shallow platform, ramp, and peritidal settings and have undergone dolomitization due to interaction with hot saline hydrothermal brines.57–62 These hydrothermal, basinal saline brines are likely to be the major source of high TDS and major ions in the Trenton PWs. The lower TDS Trenton PWs are plausibly sourced from the part of the basin that received freshwater recharge during the Pleistocene by melting of the Laurentide Ice Sheet resulting in dilution.46,63,64
PWs from the Edwards Formation had intermediate TDS and major ion concentrations but showed the largest range and variations in values when compared to other formations (Fig. 1–3 and 7). The broader range of values can be attributed to the varying origins of the formation waters. Although it is established that limestones of Edwards Formation were deposited in a shallow-marine platform, studies have indicated that there are at least two distinct hydrological and geochemical regimes.65 Based on hydrogen and oxygen isotopes and radiocarbon data, it has been interpreted that there is a shallower up dip regime recharged by fresh meteoric water in recent geologic time (less than tens of thousands of years) and a deeper (down dip) regime that is hydrologically isolated and has been thermally altered by reactions with the carbonate rocks.65,66 The deeper saline zone is thought to be hydrologically isolated because of faults that function as barriers to downdip flow of recharge water.65 This compartmentalization of the hydrologic regime possibly results in the wide range of TDS and major ion values observed in the PWs from Edwards Formation.
The PW from unconventional Marcellus shale wells also shows a broad range of TDS and major ion concentrations, as shown in Fig. 1 and 7. The Marcellus Formation is known to be deposited in a deeper marine environment.67–70 Previous studies on Marcellus PW suggested that salinity originated predominantly from the evaporative concentration of paleo-seawater past the onset of halite precipitation.25,28,30,34,48,49,71,72 The higher TDS Marcellus PW represents waters from later production stages.24,28,30,48,49,71 On the other hand, PW samples showing lower TDS and major ion concentrations are from early stages of production and represent a mixture of returning injected fresh water-based hydraulic fracturing fluids and small amounts of saline formation water. The scattered TDS plots of Marcellus PW (as compared to other PW samples) could also indicate that the shale formation is more heterogeneous, with varying mineralogy and organic matter content/structure.36,68,105,124–127 This variation in TDS could also be due to the low permeability of the Marcellus Formation, resulting in limited communication between isolated pools of fluids. These broader range of TDS and major ions values in both Marcellus and Edwards PWs samples could be the reason for the statistical similarities seen between these two formations (p value < 0.05, ESI Tables 1–4†).
Unconventional Bakken Formation PWs have very high TDS and inorganic ion concentrations. Previous studies have indicated that the middle Bakken Formation was deposited in an epicontinental sea under shallow marine high-energy conditions.73–75 Several hypotheses have been proposed for the high TDS and major ion concentrations, including seawater evaporation, halite dissolution, migration of high salinity brines from evaporitic environments stratigraphically above or below the Bakken Formation (allochthonous source), or by salinity enrichment of native pore water by membrane filtration (autochthonous source).73,76
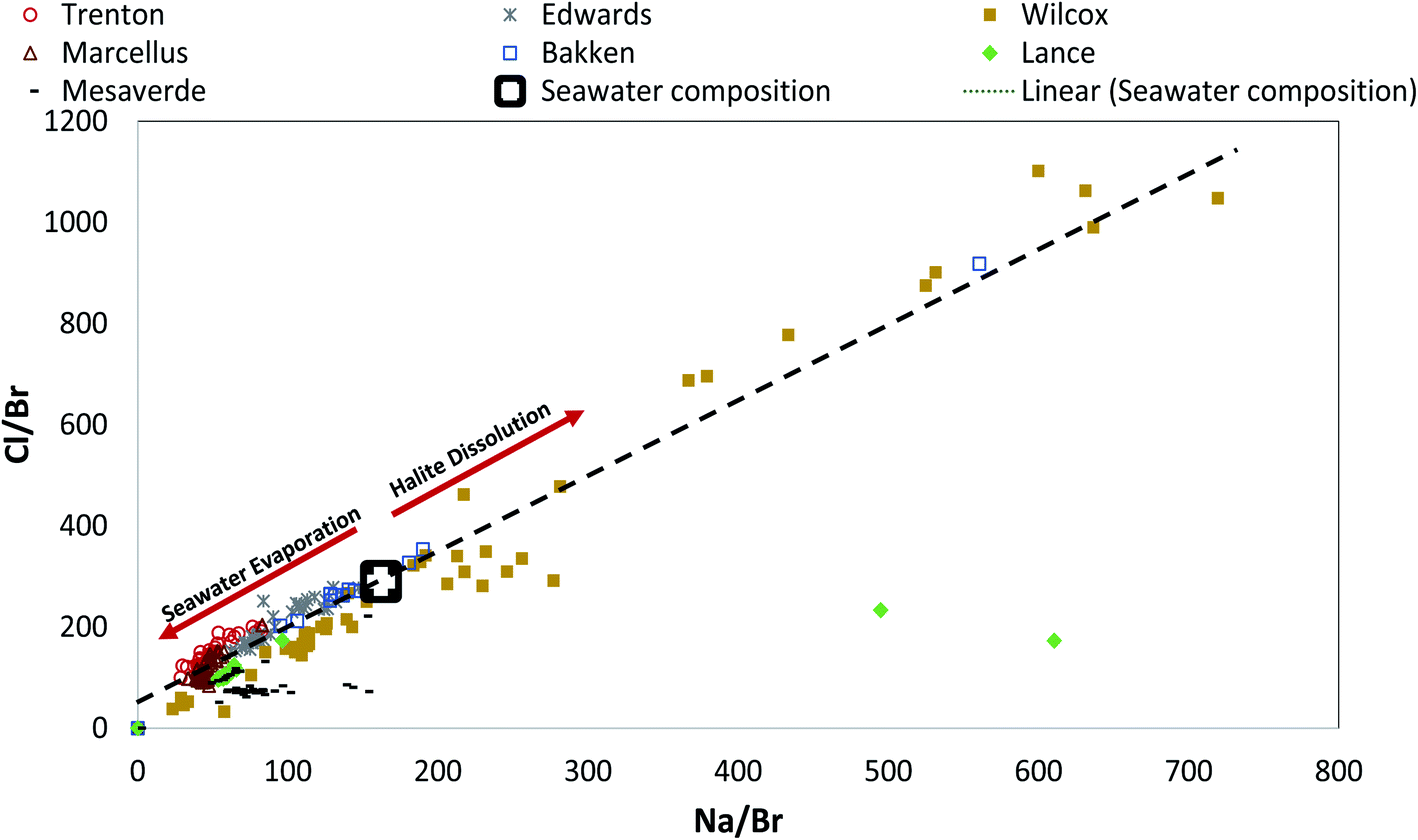
:1 mole ratio. Bromide is almost entirely excluded from the lattice of halite and is rarely incorporated into other mineral phases allowing it to become increasingly concentrated in the residual brine during evaporation.41,82 On the other hand, brines formed from halite dissolution releases Na and Cl ions, and almost no Br ions, making the brines very low in Br or high Na/Br and Cl/Br ratios. Na/Br and Cl/Br in the residual fluid plot as a trend with a constant slope (1:1 in molar units) extending from seawater toward lower ratios.81 Halite dissolution yields Na/Br and Cl/Br ratios that increase along with the same trend away from seawater composition. If the brines are from any other sources such as meteoric recharge or mineral dissolution (other than halite), they plot away from the seawater evaporation–halite precipitation trendline. Therefore, the position of PW samples related to this trend when plotted on the Na/Br vs. Cl/Br plot helps delineate whether salinity is derived from seawater evaporation, halite dissolution, or an independent source.41,81,82
We plotted the ratio of Na/Br against Cl/Br on an equivalent basis to understand the geochemical evolution of the PWs (Fig. 8). There was a good correlation between Na/Br and Cl/Br in all of the PW samples. All PW samples from Marcellus, Trenton, and Edwards Formations and several of the Bakken and Wilcox samples lie to the left of modern seawater composition indicating that these highly saline Na–Cl type fluids are predominantly derived from seawater evaporation.83 Previous studies on PWs from Bakken and Marcellus Shale made similar observations.30,73 Although most of the sample from these formations lie along the seawater evaporation trend line, a wide variation can be observed in the Na/Br and Cl/Br values indicating a varying degree of evaporation, and/or dilution with fresh waters via recharge or introduction of hydraulic fracturing fluids.30,73,79,81 It is interesting to note that although Edwards Formation is generally divided into two distinct hydrological and geochemical regimes (a shallower recharged meteoric water and a deeper saline water regime) the Cl/Br and Na/Br ratios of all samples fall along the seawater evaporation trend. This could be because of two possibilities (1) the PW samples are mostly from deeper hydrologically isolated part of the Edwards Formation (2) the PW samples are from both hydrologically active and isolated regimes but the Cl/Br and Na/Br ratio of recharged water is similar to seawater evaporation trend.84,85 Some of the Bakken PW samples and a significant number of Wilcox PW lie to the right of seawater composition, indicating halite dissolution. In Wilcox Formation, the high Na/Br and Cl/Br ratios could be a result of the pervasive introduction of brines from the dissolution of up-dip salt domes.45 The original study (from which the PW data was taken by USGS) did not show such evidence of brines from the dissolution salt domes.42
 | ||
| Fig. 8 Plot of Cl/Br vs. Na/Br in PWs from different geologic formations. | ||
PW samples that have low Cl/Br and Na/Br ratios and lie along the seawater evaporation trend indicate that samples have undergone extensive seawater evaporation. However, this does not hold true for Lance and Mesaverde PWs as they are mainly derived from freshwater recharge, as discussed in the previous section. This points to the limitation of using Cl/Br and Na/Br plots plot if there are multiple sources of formation water. The low Cl/Br and Na/Br in Lance and Mesaverde Formations probably just indicates that the meteoric water recharging these aquifers was depleted in Cl/Br and Na/Br as compared to modern seawater. Further, interestingly a majority of Mesaverde PWs were enriched in Na as compared to Cl indicating ion exchange reactions (Ca replacing Na) and rock–water interactions (such as albite dissolution) that have been occurring for longer periods within the aquifer.51,84,86
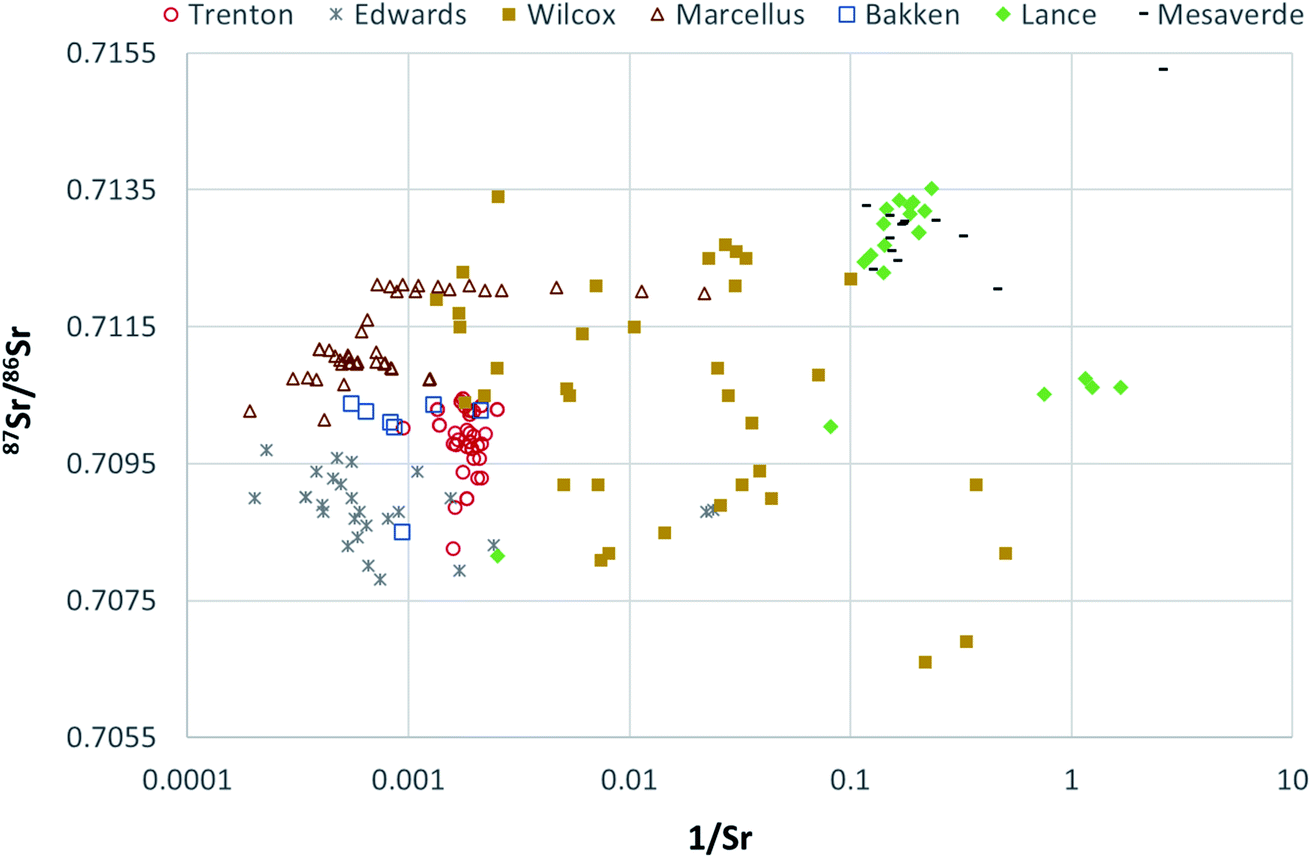 | ||
| Fig. 9 Plot of 87Sr/86Sr vs. 1/Sr in produced from different geologic formations. | ||
Further, Mesaverde PWs indicate two groups of samples, both groups have higher 87Sr/86Sr than Late Cretaceous seawater 87Sr/86Sr isotopes, but one group is relatively much more enriched in 87Sr as compared to the other (Fig. 9). This may be indicative of an alternate source of aquifer recharge or from dilution of water-mineral (mineral with low 87Sr/86Sr) interactions such as dolomite dissolution,as postulated by Henderson, 1985 (ref. 51) for Mesaverde Formation. The Lance PWs fall in the range similar to the Mesaverde PWs (Fig. 9) with relatively lower 87Sr/86Sr values indicating that both these formations are hydrologically connected and have a similar source of aquifer recharge.
The Marcellus PWs show a narrow range of 87Sr/86Sr values (0.710 to 0.712) and higher Sr concentrations (Fig. 9). Similar values have been reported for Marcellus PWs previously.25 These 87Sr/86Sr values are higher than the range of Middle Devonian seawater values, in fact more than any Phanerozoic seawater.25,98,99 The enriched 87Sr/86Sr could be due to interaction with 87Sr enriched clays in Marcellus Formation or due to interaction of basinal fluids with adjacent units enriched in 87Sr before being incorporated (as brine or salt) in the Marcellus Formation.25 However, if the basinal fluids interacted with adjacent units, the Marcellus PW would inherit the isotope signatures of brines or salts from those units, and it is highly unlikely that they would have such narrow range of 87Sr/86Sr values reported here and elsewhere.25,28,48,49 Therefore, 87Sr/86Sr ratios are Sr concentrations in the Marcellus PWs are best explained by interactions with salts or brines with the clay minerals having high 87Sr/86Sr ratios and Sr concentrations.
The PWs from Bakken Formation also show a very narrow range of 87Sr/86Sr values (with the exception of 1 sample) ranging from 0.7100 to 0.7104 and high Sr concentrations (Fig. 9). Similar values are reported previously by Peterman et al., 2017.73 The Bakken Formation was deposited in seawater with a 87Sr/86Sr values ranging from 0.7078 to 0.7082.100 Bakken Formation is composed of a mixture of minerals with different Rb/Sr ratios ranging from low (plagioclase and carbonates) to high (illite and microcline) values with average Rb/Sr ratio of Middle Bakken Formation, being reported between 0.716 and 0.722.73,101 Therefore, the high 87Sr/86Sr values of Bakken PWs most likely indicate long-term interactions with silicate minerals in the formation. The low 87Sr/86Sr value in one of the Bakken PW samples might be due to a relatively low concentration of silicate/clay minerals or due to basinal fluid migration with low 87Sr/86Sr ratios in that part of the basin.
Edwards PW samples are characterized by relatively low 87Sr/86Sr ratios but the highest Sr concentrations (Fig. 9). The average 87Sr/86Sr ratio in Jurassic seawater was 0.7070, and the average ratio in Cretaceous seawater ranged from 0.7071 to 0.7080; marine limestones should generally reflect the seawater ratio at the time of deposition.65 The high Sr concentration PW is indicative of carbonate dissolution in Edwards Formation.65 However, the majority of the Edward PWs have a higher 87Sr/86Sr ratio (as compared to paleo seawater composition), that cannot be attributed to the dissolution of carbonates depleted in 87Sr/86Sr. Therefore, the source of enriched 87Sr/86Sr is probably an allochthonous brine derived from silicate diagenesis as proposed by Land and Prezbindowski, 1985.42 Although the silicate sediments (Tertiary clastic sediments) in the Texas Gulf Coast subsurface lie stratigraphically above the Edwards aquifer in kilometer-scale, the vertical water convection could move silicate-influenced brines into the Edwards aquifer.102 Further, Groschen and Buszka, 1997 (ref. 65) observed that the 87Sr/86Sr of the stagnant-group (hydrologically isolated) samples was higher than the 87Sr/86Sr of the hydrologically active-group samples. Since most of the 87Sr/86Sr ratios observed here are similar to the 87Sr/86Sr ratio of the stagnant-group samples, it can be inferred that PW samples in this study are mostly from deeper saline water regime. These results are interesting as the original study39 did not made such interpretations as the local geology was not well understood. This interpretation is also supported by Na, Cl, Br systematics of Edwards PW.
Trenton Formation had a similar 87Sr/86Sr ratio compared to Edwards Formation but a lower Sr concentration. Middle Ordovician seawater has been reported to have 87Sr/86Sr of ∼0.7080 to ∼0.7090.98,103 Since the majority of the Trenton PWs have higher 87Sr/86Sr ratios, a basinal fluid enriched in 87Sr/86Sr could be the source of this enrichment. Although the original study60 did not indicate such intra-basinal migration, other studies in Trenton Formation have provided evidence of the interaction of hot saline hydrothermal brines with the carbonate country rock.57,59,62 Therefore, it is plausible that these brines had higher 87Sr/86Sr values but a lower Sr concentration. The Sr concentrations could have also been lowered by glacial recharge.46,63,64 However, further investigation is needed to confirm this hypothesis.
The Wilcox PWs have a wide range of 87Sr/86Sr values and Sr concentration indicative of different types of mineral–water reactions and/or multiple brines sources. The seawater composition of Paleocene to Early Eocene age has values of 0.7076 to 0.7078.98 The majority of Wilcox PWs have much higher 87Sr/86Sr values indicating Rb or 87Sr enriched sources. One of the plausible causes of enrichment could be the pervasive introduction of brines derived from the subsurface dissolution of Sr enriched up-dip salt domes, as suggested by Funayama and Hanor, 1995.45 Other possibilities include clay mineral water interaction, conversion of smectite to illite, albitization of plagioclase, dilution of potassium feldspar or 87Sr released from detrital silicate phases during diagenetic alteration such as ankerite dissolution.47,56,104 The wide range in 87Sr/86Sr and Sr concentration values indicate that a combination of these processes controlled the Sr geochemistry in Wilcox PWs and a further detailed investigation of PWs and rocks derived from different parts of the basin is required to develop a better understanding.
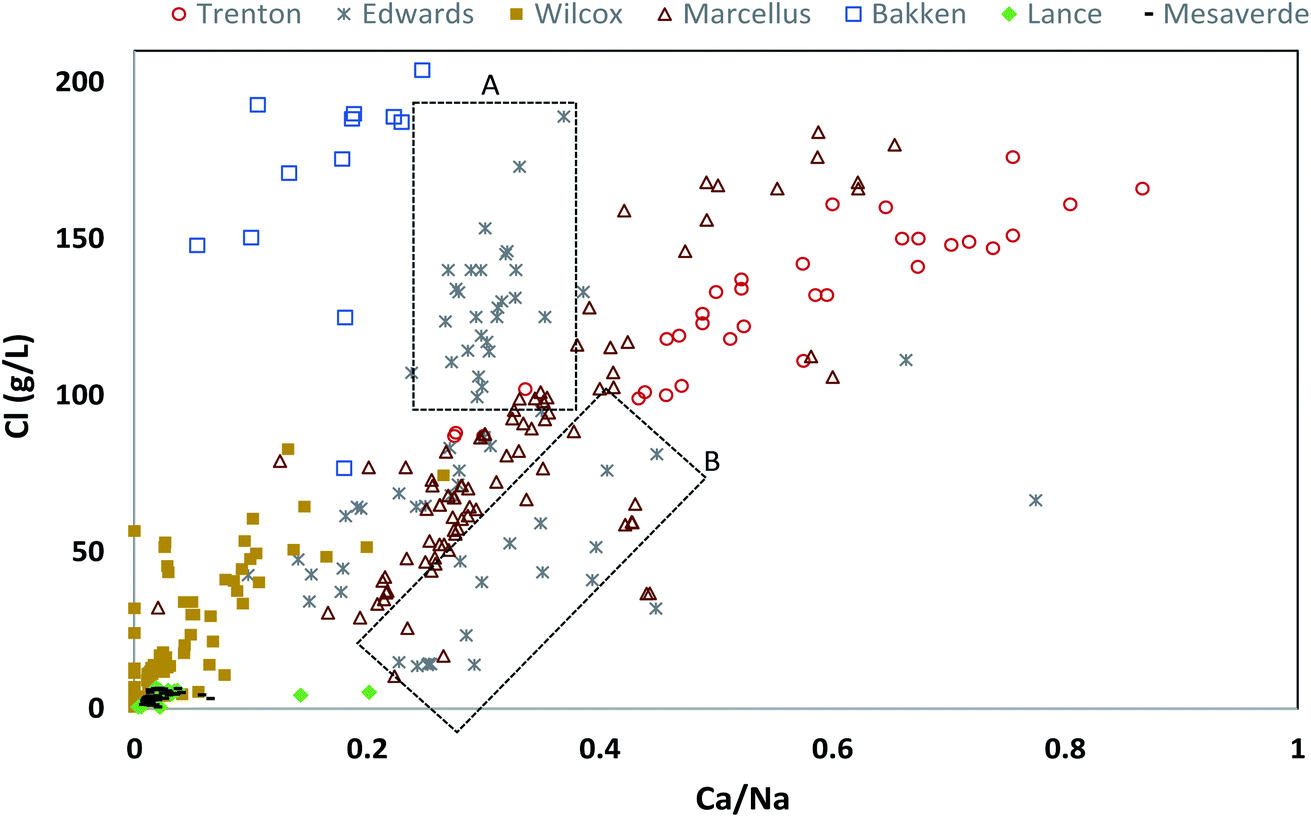 | ||
| Fig. 10 Plot of Cl vs. Ca/Na in PWs of different geologic formations. A and B represents different groups of PW within Edwards Formation. Group B samples have undergone more carbonate dissolution than group B. | ||
The Ca/Mg ratio, on the other hand, is a good indicator of dolomitization. It has been observed that Ca/Mg molar ratio reaches to a value of approximately 3 when the system is at equilibrium with dolomite at the reservoir formation temperature and is unable to further dolomitize limestones.106–109 The average Ca/Mg molar ratio of 2.9 in Trenton limestone indicates that it has undergone dolomitization to a maximum extent, probably by saline hydrothermal fluids.57–59,61,62 A high Ca/Mg molar ratio in Edwards limestone (8.3) and Marcellus (6.3) indicate that there might be dolomitization in these formations but it has still not reached equilibrium.
We used the relationship of stable isotopic values of oxygen (δ18O) and hydrogen (δD) for the PWs together with the global meteoric water line (GMWL) and local meteoric waters of the respective regions to further characterize the source of geochemical changes. The local meteoric water lines (LMWL) were constructed for each region using the hydrogen (δD) and oxygen isotope ratios (δ18O) from selected sites of the U.S. Geological Survey's National Stream Quality Accounting Network (NASQAN) and BENCHMARK surface water networks, to provide the best proxy record for precipitation.122
Except for the PW samples from Wilcox and Mesaverde Formations and a few samples from Marcellus, the PW samples from other formations show a general shift in the δ18O and δD, with a large δ18O enrichment relative to meteoric water, but a relatively small enrichment in δD (Fig. 11). This indicates that PWs are primarily composed of formation waters that have undergone extensive evaporation, especially in Trenton, Bakken, Marcellus, Lance Formations. These isotopes may have been further modified by meteoric recharge, clay dewatering or ultrafiltration. Other processes that enrich the O isotopes are carbonate interaction.79,113,114,116
 | ||
| Fig. 11 Plot of δD vs. δ18O for the PWs of different geologic formations plotted together with the local meteoric water constructed by using local O and H isotope data of local waters of individual regions. For the legend: GWML = global meteoric water line; Meteoric = local meteoric water line; Eva = evaporation; ultra = ultrafiltration. | ||
To further delineate the processes controlling the δ18O and δD, signatures of PW samples were plotted with respect to an “evaporation” and “ultrafiltration” line of meteoric water with slope 5 and 3, respectively for each formation.114 The enrichment slopes of most of the PWs in Trenton and Bakken Formations coincided with calculated slopes of evaporation (slope of 5), indicating that these extensive evaporated seawaters might have received meteoric water recharge. Most of the PWs from the Marcellus Formation lie along the calculated slopes for ultrafiltration. This suggests that formation waters primarily derived from seawater evaporation are later affected by ultrafiltration by clay minerals, which fractionate both isotopes and lowers the δ18O and δD concentrations in the hyper-filtrated PW.114 This observation corroborates well with the enriched Sr isotopic composition in Marcellus PWs. Another possible cause for enrichment of δ18O in Marcellus produced water is related to carbonate mineral interactions as discussed previously. A lot of Marcellus PW samples plot closely to meteoric water, indicating they are from the early production stage and are composed mostly of returning hydraulic fracturing fluids.28,30 Edwards PWs show considerable δ18O enrichment indicating the occurrence of water–carbonate interactions accompanied with seawater evaporation.50 Similar isotopic enrichment in δ18O has been reported in brines from several sedimentary basins worldwide and is attributed to isotopic exchange reactions between waters and associated carbonate minerals.110,111,123
The PWs from the Lance Formation and some from the Mesaverde Formation have isotopic values that fall between the evaporation and ultrafiltration curves, which indicates two end member mixing of evaporation and ultrafiltration derived PWs. This suggests the recharged water in these formations underwent membrane filtration on percolation through soils or soil substrates (probably by soil clay minerals) and then underwent evaporation in the formation. Mesaverde and Lance also have a few data points along the meteoric water line, indicating dominant meteoric charge. Another interesting observation was that the meteoric water line of samples from Mesaverde and Lance PW regions coincide with the evaporation trend line indicating the meteoric waters sampled from these regions have undergone evaporation. Several PW samples from Mesaverde Formation fall to the left of the evaporation trend line possibly indicating silicate dehydration.116 However, this hypothesis needs further investigation.
The PWs from the Wilcox Formation showed a wide spread of isotopic values indicating a hydrologically-complex system with possible different sources of connate water (marine vs. fluvial deltaic as suggested by Slatt et al., 1992),55 pervasive introduction of brines derived from the subsurface dissolution of up dip salt domes,45 or up dip migration or expulsion of low salinity waters derived in part from clay dehydration reactions or meteoric recharge.47,56
4.2 Major controls on produced water quality
In this section we utilize the geochemical signatures and key processes we discussed in Section 4.1 to delineate the role of the key variables in controlling the PW quality in different formations.Both Lance and Mesaverde Formations have low TDS, major ion and Sr concentration reflective of their fluvial depositional environment, and therefore have the best overall PW quality that would require less extensive treatment prior to recycle and reuse. Wilcox Formation is deposited in a mixed marine-fluvio-deltaic environment.55 This is one of the primary reasons that TDS, major ion, and Sr concentration of PWs from the Wilcox Formation lie in the intermediate range as compared to other PWs, making their PW quality intermediate (e.g., slightly more challenging to treat to various target water quality standards). The considerable variation in Wilcox PWs indicates that several other processes control its quality (discussed later). The Marcellus Formation was deposited in a deeper marine environment.67–70 The higher TDS, and major ions in the majority of the Marcellus Formation PW samples is primarily due to its marine connate water origin, and therefore has lower PW quality (e.g., more extensive water treatment techniques required for beneficial use). The PW quality from Marcellus is worsened by other processes such as evaporation and carbonate dissolution in the formation (discussed later). Trenton PWs had the second-highest TDS and major ion concentrations (after Bakken). This is primarily because the Trenton Formation sourced waters from paleo-seawater and intra-basinal saline hydrothermal brines. Trenton PW quality might have improved due to meteoric water recharge (discussed later). Bakken PWs have the highest major ions and TDS and high Sr concentration, therefore have the lowest PW quality. This low PW quality is mainly attributed to paleo-seawater origin of fluids, and probable migration of high salinity intra basinal brines, which further degraded the PW quality. Edwards Formation PW showed a signature of original marine connate seawater mixed with migrated of deeper saline brines. However, the mean TDS and major ion concentration from Edwards Formation is intermediate and has high Sr concentration, indicating that other factors (discussed later) were the primary controls on quality of PW.
This discussion shows that the PW quality derived from majority of the formations is primarily controlled by origin of fluids. A generalized trend of PW quality from different sources is marine connate water mixed with intra basinal brines ≤ marine connate water < fluvial connate water.
All the PW samples from Lance and Mesaverde Formations have low TDS, major ions and Sr concentrations and have good water quality. This is primarily because the PWs are derived from formation water which primarily had fluvial origin and has received significant meteoric water recharge (discussed in the next section). These observations indicate that to properly evaluate PW quality, it is important to keep in perspective not only the stages of production but also the hydrogeology of the formations.
5. Conclusions & future directions
Recycling and reuse of produced waters is an issue of immediate importance considering the shortage of freshwater resources, costs associated with its transport, and the environmental problems caused by its improper management. In this study, we utilized the major ion concentrations, O, H and Sr isotopic of PWs from conventional and unconventional formations with varying lithology and depositional environments to understand the role of local geology and hydrology on PW chemistry. Using these geochemical tools, we delineated the dominant variables, namely origin of PW, impact of artificial (hydraulic fracturing fluid) and natural water recharge, degree of mineral–water interactions and physical processes on PW quality, as summarized in Fig. 12.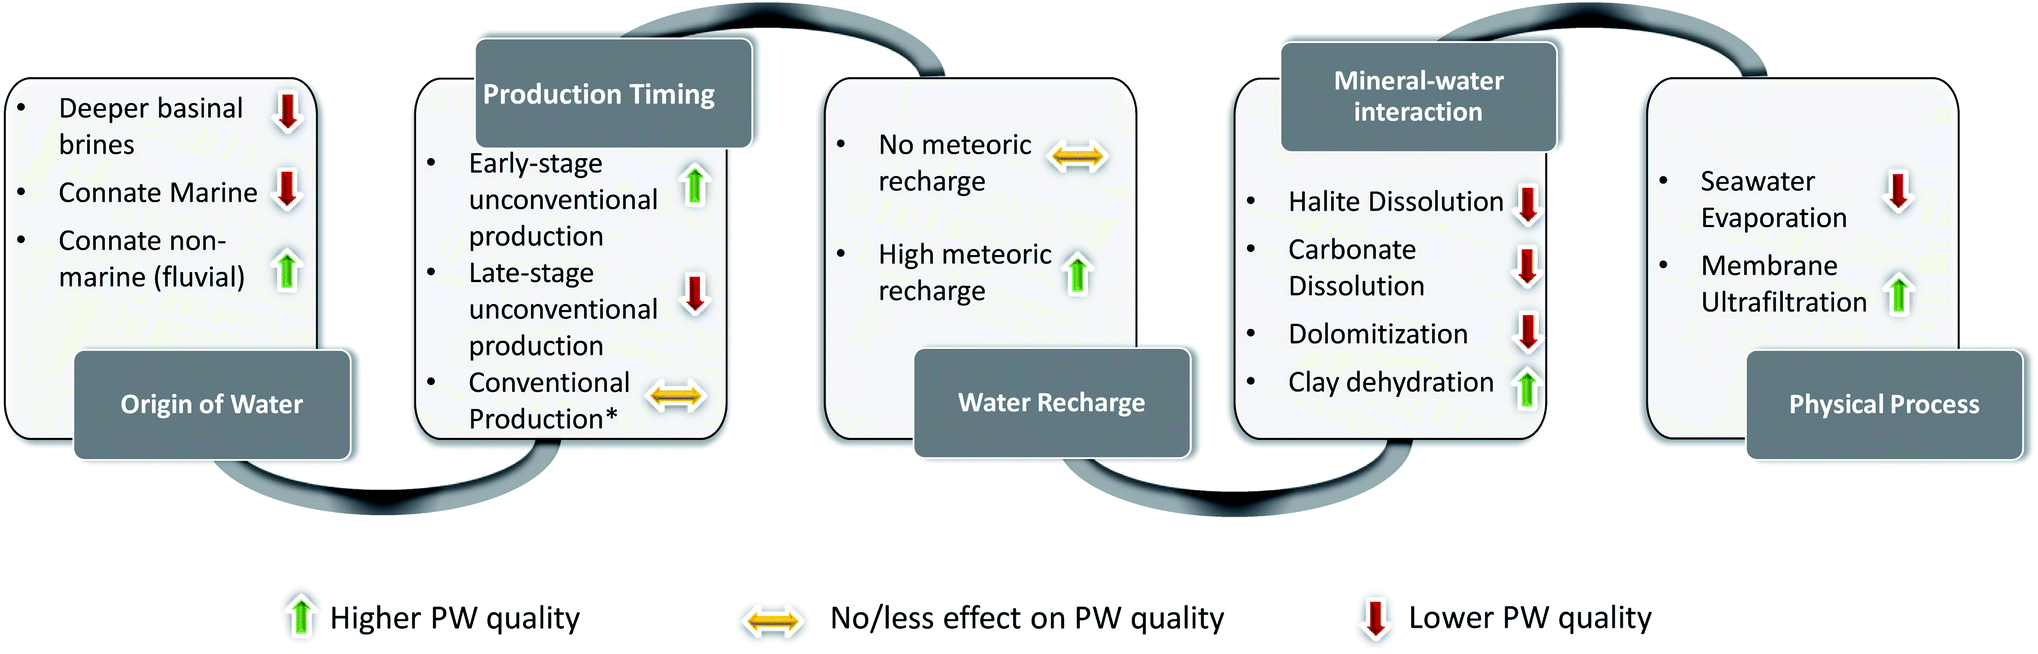 | ||
| Fig. 12 Role of origin of water, production type and timing, water recharge, mineral–water interactions, and physical processes on PW quality (where quality is inversely related to the extent of treatment required for beneficial use or surface discharge). * indicates that PW quality from conventional reservoirs does not change significantly at different production timing. | ||
Of the formations we analyzed, the Mesaverde and Lance Formations had better PW quality due to the fluvial origin of formation water and meteoric freshwater recharge. Lance PW show signatures of evaporation, whereas Mesaverde PW showed evidence of ultrafiltration. Wilcox PW had intermediate PW quality and are derived from a hydrologically complex origin. The Wilcox PW showed evidence of evaporated seawater, the pervasive introduction of brines from the dissolution of salt domes, meteoric recharge, and clay dehydration. The Bakken and Trenton PWs had the poorest PW quality and are primarily composed of connate seawater that underwent evaporation. Some of Bakken PWs showed evidence of halite dissolution. Trenton PWs showed evidence of carbonate dissolution and dolomitization by introduction of intra-basinal hydrothermal brine. Marcellus PWs had variable PW quality, showing signatures of seawater evaporation, carbonate dissolution and possibly ultrafiltration. Some of the better quality Marcellus PWs correspond to early stages of production and represent a mixture of fresh water based hydraulic fracturing fluids and formation water. Edwards PWs had intermediate quality originating from evaporated seawater derived form a deeper hydrologically isolated regime. Although the Edwards Formation is carbonate rich, some of the PW samples did not show evidence of carbonate dissolution.
Our study indicates that significant geochemical variations can exist in PWs from the same formation in different parts of the basin. Therefore to accurately predict PW quality, we need to develop a more holistic understanding of the geological and hydrological history of the formation, the mineralogical interactions and physical processes. This study also demonstrated that the role of geologic ultrafiltration on PW quality is underestimated, and further research is needed to evaluate its impact on trace metal and major ion partitioning. There is also a need to develop more robust geochemical tracers that can distinguish contribution from meteoric water recharge vs. fresh water based hydraulic fracturing fluids, carbonate interaction vs. ultrafiltration, and in situ halite dissolution vs. salt dome derived intra-basinal fluids.
Further, due to the limited availability of geochemical data we utilized only major ions and stable isotopes to understand variations in PW quality. However, trace metals, pH and Eh of solution, dissolved organic constituents such as polyaromatic hydrocarbons (PAHs), benzene, toluene, ethylbenzene, xylenes (BTEX), phenols, and organic acids, and; other chemical additives used in drilling and well stimulation significantly impact the water quality and should also be more frequently analyzed and reported, wherever budget permits. These chemicals are toxic, which can induce severe health hazards, and otherwise may be challenging to remove from PW. Other important parameters that need to be documented are PW quantity and timing of production, especially in unconventional reservoirs. Accurate measurements of these parameters can then be used to optimize design of water handling and treatment facilities, reduce water handling costs, and make long-term strategies for overcoming water-shortage issues.
Author contributions
S. S.: Initial conception of idea. S. S., V. A. & R. A.: data collection, data analysis, wrote original draft of manuscript. Y. W. & A. H.: final edits and review of manuscript.Conflicts of interest
The authors declare that they have no known competing financial interests or personal relationships that could have appeared to influence the work reported in this paper.Acknowledgements
This research was supported by Department of Energy's Fossil Energy Office National Laboratory Fundamental Shale Research Program (FWP19-021410) through National Energy Technology Laboratory and NETL grants DE#FE0024297 and DE#FE0004000. We would like to thank Prof. Jennifer McIntosh and an anonymous reviewer for their insightful comments and constructive review of the manuscript.References
- C. E. Clark and J. A. Veil, Environmental SD, Produced Water Volumes and Management Practices in the United States, UNT Digital Library. Argonne National Laboratory, 2009, https://digital.library.unt.edu/ark:/67531/metadc836481/ Search PubMed.
- J. Veil, US Produced Water Volumes and Management Practices in 2017, 2020 Search PubMed.
- C. Danforth, J. McPartland, J. Blotevogel, N. Coleman, D. Devlin and M. Olsgard, et al., Alternative Management of Oil and Gas Produced Water Requires More Research on Its Hazards and Risks, Integr. Environ. Assess. Manage., 2019, 15(5), 677–682 CrossRef CAS.
- N. A. Khan, M. Engle, B. Dungan, F. O. Holguin, P. Xu and K. C. Carroll, Volatile-organic molecular characterization of shale-oil produced water from the Permian Basin, Chemosphere, 2016, 148, 126–136 CrossRef CAS.
- Produced Water: Environmental Risks and Advances in Mitigation Technologies, ed. K. Lee and J. Neff, Springer-Verlag, New York, 2011, https://www.springer.com/us/book/9781461400455 Search PubMed.
- G. T. Llewellyn, F. Dorman, J. L. Westland, D. Yoxtheimer, P. Grieve and T. Sowers, et al., Evaluating a groundwater supply contamination incident attributed to Marcellus Shale gas development, Proc. Natl. Acad. Sci. U. S. A., 2015, 112(20), 6325–6330 CrossRef CAS.
- A. J. Sumner and D. L. Plata, Exploring the hydraulic fracturing parameter space: a novel high-pressure, high-throughput reactor system for investigating subsurface chemical transformations, Environ. Sci.: Processes Impacts, 2018, 20(2), 318–331 RSC.
- B. D. Drollette, K. Hoelzer, N. R. Warner, T. H. Darrah, O. Karatum and M. P. O'Connor, et al., Elevated levels of diesel range organic compounds in groundwater near Marcellus gas operations are derived from surface activities, Proc. Natl. Acad. Sci. U. S. A., 2015, 112(43), 13184–13189 CrossRef CAS.
- E. G. Elliott, X. Ma, B. P. Leaderer, L. A. McKay, C. J. Pedersen and C. Wang, et al., A community-based evaluation of proximity to unconventional oil and gas wells, drinking water contaminants, and health symptoms in Ohio, Environ. Res., 2018, 167, 550–557 CrossRef CAS.
- G. Ferguson, J. C. McIntosh, D. Perrone and S. Jasechko, Competition for shrinking window of low salinity groundwater, Environ. Res. Lett., 2018, 13(11), 114013 CrossRef CAS.
- K. Guerra, K. Dahm and S. Dundorf, Oil and gas produced water management and beneficial use in the Western United States, US Department of the Interior, Bureau of Reclamation, 2011 Search PubMed.
- B. R. Scanlon, R. C. Reedy, P. Xu, M. Engle, J. P. Nicot and D. Yoxtheimer, et al., Can we beneficially reuse produced water from oil and gas extraction in the U.S.?, Sci. Total Environ., 2020, 717, 137085 CrossRef CAS.
- L. Torres, O. P. Yadav and E. Khan, A review on risk assessment techniques for hydraulic fracturing water and produced water management implemented in onshore unconventional oil and gas production, Sci. Total Environ., 2016, 539, 478–493 CrossRef CAS.
- R. D. Vidic, S. L. Brantley, J. M. Vandenbossche, D. Yoxtheimer and J. D. Abad, Impact of Shale Gas Development on Regional Water Quality, Science, 2013, 340(6134), 1235009 CrossRef CAS.
- B. R. Scanlon, R. C. Reedy, F. Male and M. Walsh, Water Issues Related to Transitioning from Conventional to Unconventional Oil Production in the Permian Basin, Environ. Sci. Technol., 2017, 51(18), 10903–10912 CrossRef CAS.
- F. R. Walsh and M. D. Zoback, Oklahoma's recent earthquakes and saltwater disposal, Sci. Adv., 2015, 1(5), e1500195 CrossRef.
- J. S. Hanor and J. C. Mcintosh, Diverse origins and timing of formation of basinal brines in the Gulf of Mexico sedimentary basin, Geofluids, 2007, 7(2), 227–237 CrossRef CAS.
- J. S. Hanor and J. C. McIntosh, Are secular variations in seawater chemistry reflected in the compositions of basinal brines?, J. Geochem. Explor., 2006, 89(1–3), 153–156 CrossRef CAS.
- M. A. Al-Ghouti, M. A. Al-Kaabi, M. Y. Ashfaq and D. A. Da’na, Produced water characteristics, treatment and reuse: A review, J. Water Process. Eng., 2019, 28, 222–239 CrossRef.
- P. J. McCabe, Oil and Natural Gas: Global Resources, in Fossil Energy: Selected Entries from the Encyclopedia of Sustainability Science and Technology, ed. R. Malhotra, Springer, New York, NY, 2013, pp. 7–23, https://doi.org/10.1007/978-1-4614-5722-0_2 Search PubMed.
- J. C. McIntosh and G. Ferguson, Conventional Oil—The Forgotten Part of the Water-Energy Nexus, Groundwater, 2019, 57(5), 669–677 CrossRef CAS.
- K. B. Gregory, R. D. Vidic and D. A. Dzombak, Water Management Challenges Associated with the Production of Shale Gas by Hydraulic Fracturing, Elements, 2011, 7(3), 181–186 CrossRef.
- A. J. Kondash, E. Albright and A. Vengosh, Quantity of flowback and produced waters from unconventional oil and gas exploration, Sci. Total Environ., 2017, 574, 314–321 CrossRef CAS.
- R. C. Capo, B. W. Stewart, E. L. Rowan, C. A. Kolesar Kohl, A. J. Wall and E. C. Chapman, et al., The strontium isotopic evolution of Marcellus Formation produced waters, southwestern Pennsylvania, Int. J. Coal Geol., 2014, 126, 57–63 CrossRef CAS.
- E. C. Chapman, R. C. Capo, B. W. Stewart, C. S. Kirby, R. W. Hammack and K. T. Schroeder, et al., Geochemical and Strontium Isotope Characterization of Produced Waters from Marcellus Shale Natural Gas Extraction, Environ. Sci. Technol., 2012, 46(6), 3545–3553 CrossRef CAS.
- M. A. Cluff, A. Hartsock, J. D. MacRae, K. Carter and P. J. Mouser, Temporal Changes in Microbial Ecology and Geochemistry in Produced Water from Hydraulically Fractured Marcellus Shale Gas Wells, Environ. Sci. Technol., 2014, 48(11), 6508–6517 CrossRef CAS.
- F. Osselin, S. Saad, M. Nightingale, G. Hearn, A.-M. Desaulty and E. C. Gaucher, et al., Geochemical and sulfate isotopic evolution of flowback and produced waters reveals water-rock interactions following hydraulic fracturing of a tight hydrocarbon reservoir, Sci. Total Environ., 2019, 687, 1389–1400 CrossRef CAS.
- T. T. Phan, A. N. Paukert Vankeuren and J. A. Hakala, Role of water−rock interaction in the geochemical evolution of Marcellus Shale produced waters, Int. J. Coal Geol., 2018, 191, 95–111 CAS.
- J. Rosenblum, A. W. Nelson, B. Ruyle, M. K. Schultz, J. N. Ryan and K. G. Linden, Temporal characterization of flowback and produced water quality from a hydraulically fractured oil and gas well, Sci. Total Environ., 2017, 596–597, 369–377 CrossRef CAS.
- E. L. Rowan, M. A. Engle, T. F. Kraemer, K. T. Schroeder, R. W. Hammack and M. W. Doughten, Geochemical and isotopic evolution of water produced from Middle Devonian Marcellus shale gas wells, Appalachian basin, PennsylvaniaGeochemistry of Produced Water from Marcellus Shale Water, PA, AAPG Bull., 2015, 99(2), 181–206 Search PubMed.
- J. D. Arthur, W. H. Hochheiser, M. D. Bottrell, A. Brown, J. Candler, L. Cole, et al., Management of produced water from oil and gas wells, Working Document of the NPC North American Resource Development Study Paper, 2011, vol. 2–17 Search PubMed.
- P. Birkle, M. Zouch, M. Alzaqebah and M. Alwohaibi, Machine Learning-based Approach for Automated Identification of Produced Water Types from Conventional and Unconventional Reservoirs, in European Association of Geoscientists & Engineers, 2019, pp. 1–5, https://www.earthdoc.org/content/papers/10.3997/2214-4609.201902193 Search PubMed.
- H. Li. Produced water quality characterization and prediction for Wattenberg field, 2013, undefined, https://paper/Produced-water-quality-characterization-and-for-Li/f355cc311a199536b8cb28830eaf503eb7f54b6f Search PubMed.
- E. Barbot, N. S. Vidic, K. B. Gregory and R. D. Vidic, Spatial and Temporal Correlation of Water Quality Parameters of Produced Waters from Devonian-Age Shale following Hydraulic Fracturing, Environ. Sci. Technol., 2013, 47(6), 2562–2569 CrossRef CAS.
- A. Kondash and A. Vengosh, Water Footprint of Hydraulic Fracturing, Environ. Sci. Technol. Lett., 2015, 2(10), 276–280 CrossRef CAS.
- S. Sharma, V. Agrawal and R. N. Akondi, Role of biogeochemistry in efficient shale oil and gas production, Fuel, 2020, 259, 116207 CrossRef CAS.
- B. Alley, A. Beebe, J. Rodgers and J. W. Castle, Chemical and physical characterization of produced waters from conventional and unconventional fossil fuel resources, Chemosphere, 2011, 85(1), 74–82 CrossRef CAS.
- M. S. Blondes, K. D. Gans, M. A. Engle, Y. K. Kharaka, M. E. Reidy, V. Saraswathula, et al., US Geological Survey national produced waters geochemical database (ver. 2.3, January 2018), US Geological Survey data release, 2018 Search PubMed.
- L. S. Land and D. R. Prezbindowski, The origin and evolution of saline formation water, Lower Cretaceous carbonates, south-central Texas, U.S.A, J. Hydrol., 1981, 54(1), 51–74 CrossRef CAS.
- L. S. Land and D. R. Prezbindowski, Chemical constraints and origins of four groups of Gulf Coast reservoir fluids: Discussion, AAPG Bull., 1985, 69(1), 119–121 CAS.
- M. A. McCaffrey, B. Lazar and H. D. Holland, The evaporation path of seawater and the coprecipitation of Br (super-) and K (super+) with halite, J. Sediment. Res., 1987, 57(5), 928–937 CAS.
- L. S. Land and G. L. Macpherson, Origin of Saline Formation Waters, Cenozoic Section, Gulf of Mexico Sedimentary Basin (1), AAPG Bull., 1992, 76(9), 1344–1362 CAS.
- T. Bartos and L. Hallberg. Geologic and hydrogeologic characteristics of selected hydrocarbon-producing lithostratigraphic units within three Wyoming Laramide structural basins, University of Wyoming, WY, 2018, Assessing rare earth element concentrations in geothermal and oil and gas produced waters: A potential domestic source of strategic mineral commodities Search PubMed.
- M. E. Blauch, R. R. Myers, T. Moore, B. A. Lipinski and N. A. Houston, Marcellus Shale Post-Frac Flowback Waters - Where is All the Salt Coming from and What are the Implications?, in Society of Petroleum Engineers, 2009, https://www.onepetro.org/conference-paper/SPE-125740-MS Search PubMed.
- M. Funayama and J. S. Hanor, Pore Water Salinity as a Tool for Evaluating Reservoir Continuity and Fluid Migration Pathways in the Wilcox Group of Central Louisiana. 1995, p. 45, http://archives.datapages.com/data/gcags/data/045/045001/0195.htm Search PubMed.
- J. C. Mcintosh, G. Garven and J. S. Hanor, Impacts of Pleistocene glaciation on large-scale groundwater flow and salinity in the Michigan Basin, Geofluids, 2011, 11(1), 18–33 CrossRef CAS.
- M. Pacheco, Diagenesis of Mudstones, Offshore Texas and Southwestern Louisiana, LSU Master's theses, 2005, https://digitalcommons.lsu.edu/gradschool_theses/1438.
- T. T. Phan, J. A. Hakala and S. Sharma, Application of isotopic and geochemical signals in unconventional oil and gas reservoir produced waters toward characterizing in situ geochemical fluid-shale reactions, Sci. Total Environ., 2020, 714, 136867 CrossRef CAS.
- T. T. Phan, J. A. Hakala, C. L. Lopano and S. Sharma, Rare earth elements and radiogenic strontium isotopes in carbonate minerals reveal diagenetic influence in shales and limestones in the Appalachian Basin, Chem. Geol., 2019, 509, 194–212 CrossRef CAS.
- S. Sharma, M. L. Mulder, A. Sack, K. Schroeder and R. Hammack, Isotope approach to assess hydrologic connections during Marcellus Shale drilling, Ground Water, 2014, 52(3), 424–433 CrossRef CAS.
- T. Henderson, Geochemistry of ground-water in two sandstone aquifer systems in the Northern Great Plains in parts of Montana and Wyoming, Professional Paper, 1985, https://pubs.er.usgs.gov/publication/pp1402C Search PubMed.
- R. D. Libra, D. Doremus and C. Goodwin, Occurrence and characteristics of ground water in the Bighorn basin, Wyoming, Water Resources Research Institute, University of Wyoming, 1981 Search PubMed.
- J. G. Rankl and M. E. Lowry, Ground-water-flow systems in the Powder River structural basin, Wyoming and Montana, Water-Resources Investigations Report. U.S. Geological Survey; Books and Open-File Reports, 1990, Report No. 85-4229, https://pubs.er.usgs.gov/publication/wri854229 Search PubMed.
- H. R. Richter Jr, Occurrence and characteristics of ground water in the Wind River Basin, University of Wyoming Water Resources Research Institute, report to US Environmental Protection Agency. Wyoming, Laramie, 1981, vol. 4 Search PubMed.
- R. M. Slatt, B. J. Katz, P. J. Hutchinson, H. G. Billman, S. M. Zucker and E. V. Eslinger, et al., AAPG-SEPM Gulf of Mexico type-well project, AAPG Bull., 1992, 76(12), 1925–1931 CAS.
- B. Wilcoxon, Depth and facies related diagenesis in the Wilcox group, Hurricane Creek Field, Allen Parish, Louisiana, Louisiana State University, Baton Rouge, 1989 Search PubMed.
- L. H. Wickstrom, J. D. Gray and R. D. Stieglitz, Stratigraphy, structure, and production history of the Trenton limestone (Ordovician) and adjacent strata in northwestern Ohio, 1992, https://kb.osu.edu/handle/1811/80253 Search PubMed.
- M. Chan, J. Gregg and K. Shelton, Dolomitization and Dolomite Neomorphism: Trenton and Black River Limestones (Middle Ordovician) Northern Indiana, U.S.A, J. Sediment. Res., 2000 Jan 1, 70(1), 265–274 Search PubMed.
- L. B. Smith Jr, Origin and reservoir characteristics of Upper Ordovician Trenton–Black River hydrothermal dolomite reservoirs in New York, AAPG Bull., 2006, 90(11), 1691–1718 CrossRef.
- M. Hobbs, S. Frape, O. Shouakar-Stash and L. Kennell, Regional hydrogeochemistry–southern Ontario, Nuclear Waste Management Organization Report NWMO DGR-TR. 2011-12:R000, 2011 Search PubMed.
- D. C. Petts, J. K. Saso, L. W. Diamond, L. Aschwanden, T. A. Al and M. Jensen, The source and evolution of paleofluids responsible for secondary minerals in low-permeability Ordovician limestones of the Michigan Basin, Appl. Geochem., 2017, 86, 121–137 CrossRef CAS.
- C. Laughrey and J. Kostelnik, Petrography of The Trenton And Black River Group Carbonate Rocks In The Appalachian Basin, Trenton Black River Project, http://www.wvgs.wvnet.edu/www/tbr/Petrography.asp Search PubMed.
- J. C. McIntosh and L. M. Walter, Volumetrically significant recharge of Pleistocene glacial meltwaters into epicratonic basins: Constraints imposed by solute mass balances, Chem. Geol., 2005, 222(3), 292–309 CrossRef CAS.
- J. C. McIntosh and L. M. Walter, Paleowaters in Silurian-Devonian carbonate aquifers: Geochemical evolution of groundwater in the Great Lakes region since the Late Pleistocene, Geochim. Cosmochim. Acta, 2006, 70(10), 2454–2479 CrossRef CAS.
- G. E. Groschen and P. M. Buszka, Hydrogeologic framework and geochemistry of the Edwards aquifer saline-water zone, south-central Texas, Hydrogeologic framework and geochemistry of the Edwards aquifer saline-water zone, south-central Texas, U.S. Geological Survey, Austin, TX, 1997, Water-Resources Investigations Report, vol. 97–4133, Report No. 97-4133, http://pubs.er.usgs.gov/publication/wri974133 Search PubMed.
- B. Smith and B. Darling, Hydrogeology of the Saline Edwards Zone, Southeast Travis County, Central Texas, Barton Springs Edwards Aquifer Conservation District, 2017, https://bseacd.org/2017/10/hydrogeology-of-the-saline-edwards-zone-southeast-travis-county-central-texas/ Search PubMed.
- V. Agrawal and S. Sharma, Testing Utility of Organogeochemical Proxies to Assess Sources of Organic Matter, Paleoredox Conditions, and Thermal Maturity in Mature Marcellus Shale, Front. Energy Res., 2018, 6 Search PubMed.
- V. Agrawal and S. Sharma, Molecular Characterization of Kerogen and its Implications for Determining Hydrocarbon Potential, Organic matter sources and Thermal Maturity in Marcellus Shale, Fuel, 2018, 228, 429–437 CrossRef CAS.
- R. Chen, S. Sharma, T. Bank, D. Soeder and H. Eastman, Comparison of isotopic and geochemical characteristics of sediments from a gas- and liquids-prone wells in Marcellus Shale from Appalachian Basin, West Virginia, Appl. Geochem., 2015, 60(supplement C), 59–71 CrossRef CAS.
- B. B. Sageman, A. E. Murphy, J. P. Werne, C. A. Ver Straeten, D. J. Hollander and T. W. Lyons, A tale of shales: the relative roles of production, decomposition, and dilution in the accumulation of organic-rich strata, Middle–Upper Devonian, Appalachian basin, Chem. Geol., 2003, 195(1), 229–273 CrossRef CAS.
- M. A. Engle and E. L. Rowan, Geochemical evolution of produced waters from hydraulic fracturing of the Marcellus Shale, northern Appalachian Basin: A multivariate compositional data analysis approach, Int. J. Coal Geol., 2014, 126, 45–56 CrossRef CAS.
- B. W. Stewart, E. C. Chapman, R. C. Capo, J. D. Johnson, J. R. Graney and C. S. Kirby, et al., Origin of brines, salts and carbonate from shales of the Marcellus Formation: Evidence from geochemical and Sr isotope study of sequentially extracted fluids, Appl. Geochem., 2015, 60, 78–88 CrossRef CAS.
- Z. Peterman, J. N. Thamke, K. Futa and T. A. Oliver, Characterization and origin of brines from the Bakken-Three Forks petroleum system in the Williston Basin, USA, Mt. Geol., 2017, 54, 203–221 Search PubMed.
- J. K. Pitman, L. C. Price and J. A. LeFever, Diagenesis and fracture development in the Bakken Formation, Williston Basin; implications for reservoir quality in the middle member, Diagenesis and fracture development in the Bakken Formation, Williston Basin; implications for reservoir quality in the middle member, 2001, Professional Paper, vol. 1653, Report No. 1653, http://pubs.er.usgs.gov/publication/pp1653 Search PubMed.
- A. Steptoe, Petrofacies and Depositional Systems of the Bakken Formation in the Williston Basin, North Dakota, Graduate Theses, Dissertations, and Problem Reports, 2012, https://researchrepository.wvu.edu/etd/3524 Search PubMed.
- O. Shouakar-Stash, Evaluation of Stable Chlorine and Bromine Isotopes in Sedimentary Formation Fluids, 2008, https://uwspace.uwaterloo.ca/handle/10012/3717 Search PubMed.
- A. B. Carpenter, Origin and chemical evolution of brines in sedimentary basins, in SPE Annual Fall Technical Conference and Exhibition, Society of Petroleum Engineers, 1978 Search PubMed.
- S. E. Kesler, M. S. Appold, A. M. Martini, L. M. Walter, T. J. Huston and J. Richard Kyle, Na-Cl-Br systematics of mineralizing brines in Mississippi Valley–type deposits, Geology, 1995, 23(7), 641–644 CrossRef CAS.
- Y. K. Kharaka and J. S. Hanor, 5.16 - Deep Fluids in the Continents: I. Sedimentary Basins, in Treatise on Geochemistry, ed. H. D. Holland and K. K. Turekian, Pergamon, Oxford, 2003, pp. 1–48, http://www.sciencedirect.com/science/article/pii/B0080437516050854 Search PubMed.
- D. I. Siegel, R. J. Szustakowski and S. Frape, Regional appraisal of brine chemistry in the Albion Group sandstones (Silurian) of New York, Pennsylvania, and Ohio. Association of Petroleum Geochemical Explorationists, Bulletin, 1990, 6, 66–77 Search PubMed.
- L. M. Walter, A. M. Stueber and T. J. Huston, Br-Cl-Na systematics in Illinois basin fluids: Constraints on fluid origin and evolution, Geology, 1990, 18(4), 315–318 CrossRef.
- R. K. Stoessell and A. B. Carpenter, Stoichiometric saturation tests of NaCl1−xBrx and KCl1−xBrx, Geochim. Cosmochim. Acta, 1986, 50(7), 1465–1474 CrossRef CAS.
- F. J. Alcalá and E. Custodio, Using the Cl/Br ratio as a tracer to identify the origin of salinity in aquifers in Spain and Portugal, J. Hydrol., 2008 Sep 15, 359(1), 189–207 Search PubMed.
- S. V. Panno, K. C. Hackley, H. H. Hwang, S. E. Greenberg, I. G. Krapac and S. Landsberger, et al., Characterization and identification of na-cl sources in ground water, Ground Water, 2006, 44(2), 176–187 CrossRef CAS.
- S. V. Panno, K. C. Hackley, H.-H. Hwang, S. E. Greenberg, I. G. Krapac and S. Landsberger, Source Identification of Sodium and Chloride Contamination in Natural Waters: Preliminary Results, 12th Annual Illinois Groundwater Consortium Symposium published by Illinois Groundwater, 2002, https://www.ideals.illinois.edu/handle/2142/55186 Search PubMed.
- K. C. Hackley, S. V. Panno and T. F. Anderson, Chemical and isotopic indicators of groundwater evolution in the basal sands of a buried bedrock valley in the midwestern United States: Implications for recharge, rock-water interactions, and mixing, Geol. Soc. Am. Bull., 2010, 122(7–8), 1047–1066 CrossRef CAS.
- R. J. Barnaby, G. C. Oetting and G. Gao, Strontium isotopic signatures of oil-field waters: Applications for reservoir characterization, AAPG Bull., 2004, 88(12), 1677–1704 CrossRef CAS.
- E. R. Bayless, T. D. Bullen and J. A. Fitzpatrick, Use of 87Sr/86Sr and δ11B to identify slag-affected sediment in southern Lake Michigan, Environ. Sci. Technol., 2004, 38(5), 1330–1337 CrossRef CAS.
- E. L. Brinck and C. D. Frost, Detecting infiltration and impacts of introduced water using strontium isotopes, Groundwater, 2007, 45(5), 554–568 CrossRef CAS.
- L. N. Christian, J. L. Banner and L. E. Mack, Sr isotopes as tracers of anthropogenic influences on stream water in the Austin, Texas, area, Chem. Geol., 2011, 282(3–4), 84–97 CrossRef CAS.
- B. L. Hamel, B. W. Stewart and A. G. Kim, Tracing the interaction of acid mine drainage with coal utilization byproducts in a grouted mine: Strontium isotope study of the inactive Omega Coal Mine, West Virginia (USA), Appl. Geochem., 2010, 25(2), 212–223 CrossRef CAS.
- Y. Jiang, Y. Wu and D. Yuan, Human impacts on karst groundwater contamination deduced by coupled nitrogen with strontium isotopes in the Nandong underground river system in Yunan, China, Environ. Sci. Technol., 2009, 43(20), 7676–7683 CrossRef CAS.
- C. Leung and J. J. Jiao, Use of strontium isotopes to identify buried water main leakage into groundwater in a highly urbanized coastal area, Environ. Sci. Technol., 2006, 40(21), 6575–6579 CrossRef CAS.
- Z. E. Peterman, J. N. Thamke and K. Futa, Use of Strontium Isotopes to Detect Produced-Water Contamination in Surface Water and Groundwater in the Williston Basin, Northeastern Montana, 2010 Search PubMed.
- J. M. McArthur, W. J. Kennedy, M. Chen, M. F. Thirlwall and A. S. Gale, Strontium isotope stratigraphy for Late Cretaceous time: Direct numerical calibration of the Sr isotope curve based on the US Western Interior, Palaeogeogr., Palaeoclimatol., Palaeoecol., 1994 Mar 1, 108(1), 95–119 Search PubMed.
- M. R. Palmer and J. M. Edmond, Controls over the strontium isotope composition of river water, Geochim. Cosmochim. Acta, 1992, 56(5), 2099–2111 CrossRef CAS.
- J. F. McLaughlin, C. D. Frost and S. Sharma, Geochemical analysis of atlantic rim water, carbon county, wyoming: New applications for characterizing coalbed natural gas reservoirs, Am. Assoc. Pet. Geol. Bull., 2011, 95, 27 Search PubMed.
- W. H. Burke, R. E. Denison, E. A. Hetherington, R. B. Koepnick, H. F. Nelson and J. B. Otto, Variation of seawater 87Sr/86Sr throughout Phanerozoic time, Geology, 1982, 10(10), 516–519 CrossRef CAS.
- A. Diener, S. Ebneth, J. Veizer and D. Buhl, Strontium isotope stratigraphy of the Middle Devonian: brachiopods and conodonts, Geochim. Cosmochim. Acta, 1996, 60(4), 639–652 CrossRef CAS.
- J. M. McArthur, R. J. Howarth and G. A. Shields. Strontium isotope stratigraphy. The geologic time scale. 2012, vol. 1, pp. 127–144 Search PubMed.
- R. Karma and G. R. Parslow, Sedimentology and geochemistry of the Bakken Formation (Devonian-Mississippian) in southern Saskatchewan, Summary of Investigations, 1989, vol. 89, pp. 141–147 Search PubMed.
- J. S. Hanor, Origin and migration of subsurface sedimentary brines, Sepm Society for Sedimentary, 1987 Search PubMed.
- H. Qing, C. R. Barnes, D. Buhl and J. Veizer, The strontium isotopic composition of Ordovician and Silurian brachiopods and conodonts: relationships to geological events and implications for coeval seawater, Geochim. Cosmochim. Acta, 1998, 62(10), 1721–1733 CrossRef CAS.
- R. S. Fisher and L. S. Land, Diagenetic history of Eocene Wilcox sandstones, South-Central Texas, Geochim. Cosmochim. Acta, 1986, 50(4), 551–561 CrossRef CAS.
- J. Pilewski, S. Sharma, V. Agrawal, J. A. Hakala and M. Stuckman, Effect of Maturity and Mineralogy on Fluid-Rock Reactions in the Marcellus Shale. Environ Sci: Processes Impacts, 2019, https://pubs.rsc.org/en/content/articlelanding/2019/em/c8em00452h Search PubMed.
- A. B. Carpenter, The Chemistry of Dolomite Formanon I: The Stability of Dolomite, 1980 Search PubMed.
- D. Langmuir, The geochemistry of some carbonate ground waters in central Pennsylvania, Geochim. Cosmochim. Acta, 1971, 35(10), 1023–1045 CrossRef CAS.
- R. A. Robie and R. RA, Thermodynamic properties of minerals and related substances at 298.15° K and 1 bar (105 pascals) pressure and at higher temperatures, 1978 Search PubMed.
- S. H. Siddiqui and R. R. Parizek, Hydrogeologic factors influencing well yields in folded and faulted carbonate rocks in central Pennsylvania, Water Resour. Res., 1971, 7(5), 1295–1312 CrossRef.
- R. N. Clayton, I. Friedman, D. L. Graf, T. K. Mayeda, W. F. Meents and N. F. Shimp, The origin of saline formation waters: 1. Isotopic composition, J. Geophys. Res., 1966, 71(16), 3869–3882 CrossRef CAS.
- B. Hitchon and I. Friedman, Geochemistry and origin of formation waters in the western Canada sedimentary basin—I. Stable isotopes of hydrogen and oxygen, Geochim. Cosmochim. Acta, 1969, 33(11), 1321–1349 CrossRef CAS.
- T. B. Coplen and B. B. Hanshaw, Ultrafiltration by a compacted clay membrane—I. Oxygen and hydrogen isotopic fractionation, Geochim. Cosmochim. Acta, 1973, 37(10), 2295–2310 CrossRef CAS.
- T. M. Whitworth, Hyperfiltration-induced isotopic fractionation: Mechanisms and role in the subsurface, Theses and Dissertations Available from ProQuest, 1993, pp. 1–240 Search PubMed.
- M. Mazurek, P. Alt-Epping, A. Bath, S. Buschaert, A. Gautschi, T. Gimmi, et al., CLAYTRAC Project: Evaluation of Tracer Profiles across Argillaceous Formations. 2009 Search PubMed.
- L. T. Bryndzia and N. R. Braunsdorf, From Source Rock to Reservoir: The Evolution of Self-Sourced Unconventional Resource Plays, Elements, 2014, 10(4), 271–276 CrossRef CAS.
- S. Serno, S. Flude, G. Johnson, B. Mayer, R. Karolytė and R. S. Haszeldine, et al., Oxygen isotopes as a tool to quantify reservoir-scale CO2 pore-space saturation, Int. J. Greenhouse Gas Control, 2017, 63, 370–385 CrossRef CAS.
- Y. Wang. From Nanofluidics to Basin-Scale Flow in Shale, in Shale, American Geophysical Union (AGU), 2019, pp. 45–58, https://agupubs.onlinelibrary.wiley.com/doi/abs/10.1002/9781119066699.ch3 Search PubMed.
- T. Maekawa, S.-I. Igari and N. Kaneko, Chemical and isotopic compositions of brines from dissolved-in-water type natural gas fields in Chiba, Japan, Geochem. J., 2006, 40(5), 475–484 CrossRef CAS.
- E. P. Moldovanyi, L. M. Walter and L. S. Land, Strontium, boron, oxygen, and hydrogen isotope geochemistry of brines from basal strata of the Gulf Coast sedimentary basin, USA, Geochim. Cosmochim. Acta, 1993, 57(9), 2083–2099 CrossRef CAS.
- A. M. Stueber, A. H. Saller and H. Ishida, Origin, Migration, and Mixing of Brines in the Permian Basin: Geochemical Evidence from the Eastern Central Basin Platform, Texas, AAPG Bull., 1998, 82(9), 1652–1672 CAS.
- N. R. Warner, R. B. Jackson, T. H. Darrah, S. G. Osborn, A. Down and K. Zhao, et al., Geochemical evidence for possible natural migration of Marcellus Formation brine to shallow aquifers in Pennsylvania, Proc. Natl. Acad. Sci. U. S. A., 2012, 109(30), 11961–11966 CrossRef CAS.
- T. B. Coplen and C. Kendall, Stable hydrogen and oxygen isotope ratios for selected sites of the US Geological Survey's NASQAN and benchmark surface-water networks, Geological Survey, Reston, VA, 2000 Search PubMed.
- Y. K. Kharaka and J. J. Thordsen, Stable isotope geochemistry and origin of waters in sedimentary basins, Isotopic Signatures and Sedimentary Records, Springer-Verlag, Berlin/Heidelberg, 1992, pp. 411–466 Search PubMed.
- B. N. Hupp and J. J. Donovan, Quantitative mineralogy for facies definition in the Marcellus Shale (Appalachian Basin, USA) using XRD-XRF integration, Sediment. Geol., 2018, 371, 16–31 CrossRef CAS.
- V. Agrawal and S. Sharma, Improved Kerogen Models for Determining Thermal Maturity and Hydrocarbon Potential of Shale, Sci. Rep., 2018, 8(1), 17465 CrossRef.
- V. Agrawal and S. Sharma, Are we modeling the properties of unconventional shales correctly?, Fuel, 2020, 267, 117316 CrossRef CAS.
- T. Paronish, R. Toth, T. Carr, V. Agrawal, D. Crandall and J. Moore, Multi-Scale Lithofacies and Chemostratigraphic Analysis of Two Middle Devonian Marcellus Shale Wells in Northern West Virginia, USA, Unconventional Resources Technology Conference, URTeC, 2020 Search PubMed.
Footnote |
| † Electronic supplementary information (ESI) available. See DOI: 10.1039/d0em00388c |
| This journal is © The Royal Society of Chemistry 2021 |