
 Open Access Article
 This Open Access Article is licensed under a Creative Commons Attribution-Non Commercial 3.0 Unported Licence
Delivering low-carbon electricity systems in sub-Saharan Africa: insights from Nigeria†
Habiba Ahut
Daggash
 *abc and
Niall
Mac Dowell
bc
*abc and
Niall
Mac Dowell
bc
aGrantham Institute – Climate Change and the Environment, Imperial College London, Exhibition Road, London, SW7 2AZ, UK. E-mail: h.daggash16@imperial.ac.uk; Tel: +44 (0)7714 262868
bCentre for Environmental Policy, Imperial College London, Exhibition Road, London, SW7 2AZ, UK
cCentre for Process Systems Engineering, Imperial College London, Exhibition Road, London, SW7 2AZ, UK
First published on 19th May 2021
Abstract
Sub-Saharan Africa (SSA) faces many challenges: two-thirds of the world's extreme poor population; a shrinking economy because of commodity price declines and the COVID-19 pandemic; widespread energy poverty; and climate variability that is disrupting agrarian livelihoods and stirring conflict over natural resources. Climate change threatens to exacerbate these through further disruption of the physical environment, and a transition away from the fossil fuels on which many of the region's economies depend. Through their nationally determined contributions (NDC) to the Paris Agreement, all SSA countries committed to the increased utilisation of intermittent renewable energy sources (IRES) to tackle the twin challenges of energy poverty—which limits economic development—and climate change. There is a dearth of analysis on the nature of sustainable energy transition(s) necessary to deliver these NDCs, especially given the limited financial and technical resources of SSA. Using Nigeria as a case study, this study seeks to address this gap by determining the power system transitions required to deliver NDCs alongside universal energy access in SSA by 2050; their financial and policy implications; and the barriers and opportunities that they present to sustainable development efforts. We find that Nigeria can deliver its NDCs with no added cost implications, thereby debunking the prevalent view that climate change mitigation is too costly to pursue in SSA. Furthermore, we find that the higher availability and dispatchability of fossil fuel generation makes it critical for the rapid scale-up of energy supply; thus, entirely leapfrogging carbon-intensive development will prove costly to SSA. Finally, owing to the limited cost reductions that IRES have experienced in SSA, delivering NDCs through the deployment of decentralised IRES systems proves more expensive than using conventional generation. The distributed nature of IRES however means that they can democratise energy investment and job creation, thus facilitating the equitable sharing of economic resources which is crucial to conflict prevention in the fragile socio-political landscapes that pervade the region.
Broader contextGiven its large population, poor socio-economic indices, and abundant fossil fuel resources, sub-Saharan Africa (SSA) can derail global climate change mitigation efforts if it pursues a carbon-intensive development model. Using Nigeria as a case study, this work offers a systems approach to determining integrated electrification pathways that deliver universal energy access alongside the nationally determined contributions (NDC) to the Paris Agreement in SSA countries. We find that the current NDCs have minimal cost implications; thus, there is potential for more ambitious climate change mitigation targets. Furthermore, we find that SSA is yet to experience cost reductions in solar and wind power to the extent seen in advanced economies. Consequently, fossil fuels remain cheaper, and an electrification strategy that seeks to minimise costs alone leads to significant fossil fuel use. We highlight that the value proposition that renewables offer to SSA is not due to their low cost, but to their ability to democratise energy infrastructure, investment, and job creation in undiversified economies and fractured geopolitical landscapes, the types of which are prevalent in the region. Thus, to promote sustainable energy use, electrification planning should have holistic objectives that seek energy equity alongside affordability. |
1. Introduction
Sub-Saharan Africa (SSA)‡ is uniquely vulnerable to the physical and socio-economic impacts of climate change because of its geography and economy. Climate change projections suggest a warming trend on the continent, particularly in the inland subtropics.1 SSA is expected to experience increased frequency of extreme weather events (droughts, floods and rainstorms), increased desertification, and changes in crop and soil productivity.2,3 These environmental stresses threaten the rain-fed agricultural systems that 70% of the region's population rely on for their livelihoods.4 Incidences of natural disasters and extreme weather also imperil other key sectors of the region's economy, including the urban economy, forestry, water resources, coastal areas and settlements, and health.5 The region's population, currently at 1.1 billion with 43% below the age of 15, is expected to double by 2050 and quadruple by 2100.6,7 Demographic pressures will intensify competition for scarce natural resources such as arable land and freshwater. Owing to the fragile socio-political landscapes of many SSA countries, natural resource competition and environmental degradation have historically triggered violent conflict, often across ethno-religious divides.8–12 Thus, if unmitigated, climate change is expected to interact with non-climatic stresses to exacerbate the vulnerability of the region's economic systems, deepen poverty and increase the likelihood of conflict.2,12,13Many SSA countries have recognised the harmful impacts of climate change and committed to both domestic policies and international treaties that promote mitigation and adaption, alongside development efforts. All 48 SSA countries have signed and, with the exception of Eritrea, ratified the 2015 Paris Agreement.14 However, the region's limited financial and technical resources, poor infrastructure, and weak governance and institutions means that addressing climate change is even more challenging than currently observed in more prosperous countries. Owing to the region's dependence on primary commodity (raw materials and food) exports for fiscal revenues, recent commodity price declines and the COVID-19 pandemic (which led to demand collapse) have depleted government coffers and intensified economic hardship.6,15 In 2020, SSA experienced its first recession in 25 years.6 Furthermore, demographic pressures from both urbanisation, which requires improved infrastructure, and a rapidly increasing working-age (15–64) population who require jobs, compound the challenge of designing effective climate change solutions.
The electricity sector has been identified as a potential driver of both economic growth and climate change mitigation in SSA because of the abundance of renewable energy sources (particularly solar, wind and hydro) in the region. All the nationally determined contributions (NDCs) submitted by SSA countries highlighted the increased deployment of renewable energy as a priority for climate action and development.16–18 Currently, 47.7% of the population are without access to electricity, and those with access suffer from poor quality and lack of affordability of supply.6Fig. 1 illustrates the per capita electricity consumption and gross domestic product (GDP)§ of SSA countries. The mean regional electricity consumption and GDP levels are 84% and 86% lower than the global averages, respectively.6,19 Thus, SSA must pursue climate change mitigation and universal energy access in the face of rapid population growth that contributes additional demand, and limited financial resources.
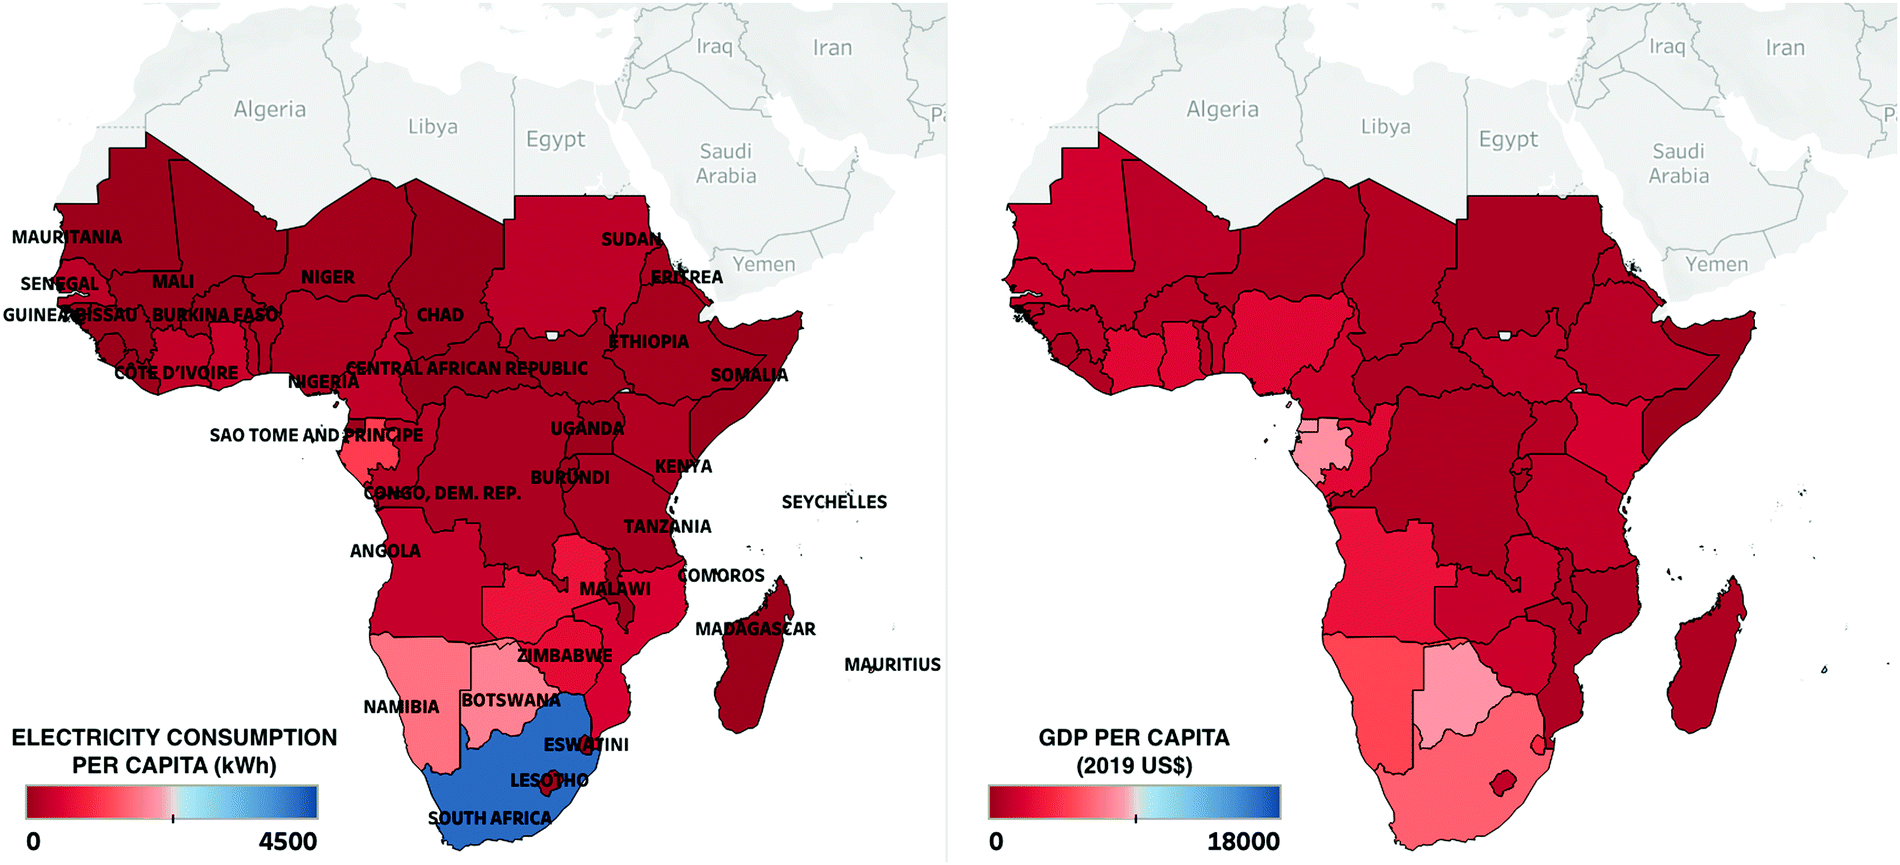 | ||
| Fig. 1 Per capita electricity consumption and gross domestic product (GDP) of sub-Saharan African countries. All data is obtained from the World Bank.6 | ||
There is a danger of imported narratives when discussing climate change mitigation in the sub-Saharan African (SSA) context. Many studies have suggested that SSA countries can leapfrog fossil-fuelled development owing to the falling costs of renewable electricity generation, mainly solar and wind power20,21—a recent study projected that some SSA countries could rely on solar photovoltaics alone for up to 90% of power generation by 2050.22 Additionally, it is often asserted that least-cost universal energy access can be achieved through the deployment of decentralised mini-grid systems that greatly reduce the need for centralised generation and transmission infrastructure.19 Often the energy system or integrated assessment models22,23 that underlie these studies have relatively low spatial or temporal granularity so grid reliability and operability—both crucial for the quality of electricity service provided especially in systems dominated by intermittent renewable energy sources (IRES)—are insufficiently assessed. Furthermore, the principally techno-economic nature of previous analyses means that socio-cultural or political considerations are entirely absent from discussions on the feasibility of future energy scenarios. Such analyses, whilst academically interesting, provide a very limited basis for real-world policy making in these regions.
This paper uses a spatio-temporal power systems planning tool, the ESONE model,24 to determine optimal transition pathways for a country's electricity system to deliver its NDC to the Paris Agreement. A key strength of this approach is that the spatially disaggregated nature of this tool allows attention to be given to the implications of fragile, subnational geopolitical landscapes on the feasibility of various transition pathways. ESONE is a mixed integer linear optimisation problem (MILP) that combines generation expansion planning and unit commitment model formulations to determine the lowest-cost system design and electricity dispatch pattern over a planning horizon, subject to a set of constraints that maintain grid reliability, operability and limit GHG emissions. The model is described in detail in the Methods section. Owing to the unavailability of data on electric power infrastructure, and computational complexity, it is not possible to model all 48 SSA countries at sufficient levels of spatial and temporal granularity. Consequently, this study uses Nigeria as a case study to derive insights for sustainable power systems planning for the rest of the region.
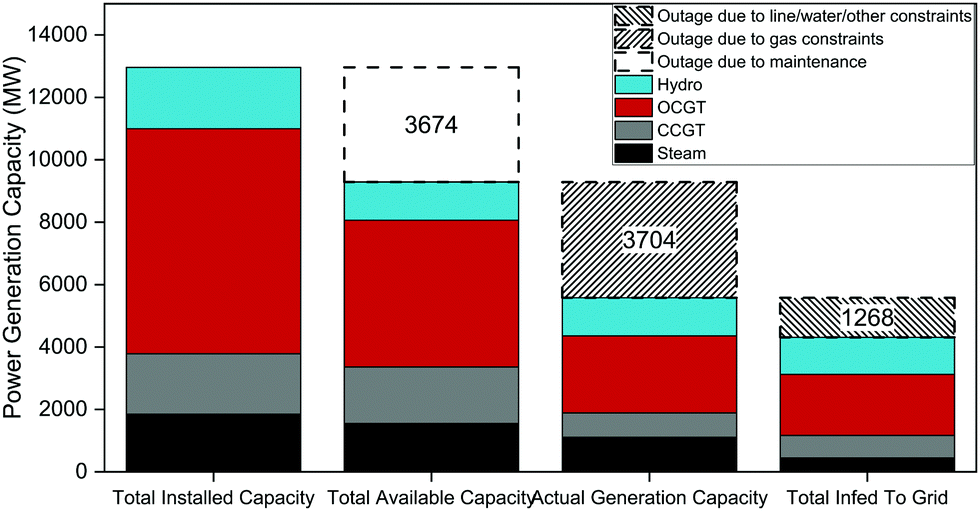 | ||
| Fig. 2 Installed and available power generation capacity in Nigeria. | ||
Nigeria exemplifies the challenges that the rest of the region faces. A historic dependence on the oil and gas exports for 47–85% of government revenues has left the economy vulnerable to a climate change-induced energy transition that will lower the price of, or demand for, fossil fuels.25,26 Crude oil price collapses in 2014 and 2020 (due to demand collapse from the COVID-19 pandemic) have since limited GDP growth rate to a maximum of 2% which is lower than the population growth rate.6 Population, currently 193 million with 44% below the age of 14, is expected to double by 2050 when it is expected to be the third most populous nation in the world.6,7 Furthermore, cultural and religious heterogeneity has created a fragile political landscape in the country, with ethno-religious conflicts often triggered by environmental insecurity (farmer–herder clashes over pastureland, water scarcity and pollution, and droughts).8–10 Similarly, Nigeria exemplifies the opportunities that climate action presents to SSA. Its abundance of well-distributed renewable energy sources holds significant potential for economic development and diversification, and job creation. Additionally, the international climate finance that has been pledged for developing countries could also prove to be a vital source of financing for climate change mitigation and economic development in the country.27
1.1 Overview of the Nigerian power sector
Until 2007, the government was responsible for all policy formulation, regulation, operation and investment in the power sector—with regulation handled by the Federal Ministry of Power and operation handled by the state-owned National Electric Power Authority (NEPA).25 In 2007, NEPA was restructured into the Power Holding Company of Nigeria (PHCN). In 2013, generation and distribution assets were privatised to improve efficiencies and attract investment into the sector. PHCN was unbundled into 6 state-owned generation companies (GenCos) and 11 distribution companies (DisCos) and sold to private entities.28 The Federal Government of Nigeria (FGN) retained ownership of the national transmission network under the Transmission Company of Nigeria (TCN), which consists of a system operator and a market operator.25,29,30 Thus far, privatisation efforts failed to create a functioning market that is fit for the purpose of providing reliable and affordable power to the population, owing to weak governance and institutions. The current power system continues to operate well-below international reliability and security standards resulting in frequent system collapses. In 2016 alone, 22 full collapses and 9 partial collapses occurred.28Although installed power generation capacity is near 13![[thin space (1/6-em)]](https://www.rsc.org/images/entities/char_2009.gif) 000 MW, actual generation has never been greater than 5000 MW31 for several reasons: outage of generation units due to lack of maintenance (3674 MW); inadequate gas supply to power plants (3704 MW) due to pipeline vandalism and lack of investment in network expansion;32 and transmission line constraints and water shortages (1268 MW) (Fig. 2).33 Ageing and non-maintenance has also rendered many transmission lines non-operational. 98 of the 114 inter-state high voltage lines were built before 2000.34 The radial structure of the network and single line contingency also leaves the system prone to failure as alternative routing is not available.35 Finally, the long length (>300 km) of many lines results in significant network losses which have been estimated at 14–20% of electricity generated.25,31,35
000 MW, actual generation has never been greater than 5000 MW31 for several reasons: outage of generation units due to lack of maintenance (3674 MW); inadequate gas supply to power plants (3704 MW) due to pipeline vandalism and lack of investment in network expansion;32 and transmission line constraints and water shortages (1268 MW) (Fig. 2).33 Ageing and non-maintenance has also rendered many transmission lines non-operational. 98 of the 114 inter-state high voltage lines were built before 2000.34 The radial structure of the network and single line contingency also leaves the system prone to failure as alternative routing is not available.35 Finally, the long length (>300 km) of many lines results in significant network losses which have been estimated at 14–20% of electricity generated.25,31,35
The lack of financial viability of the power sector has deterred domestic and foreign investment. This is principally due to the absence of a cost-reflective tariff; significant collection losses by distribution companies (DisCos) because of non-metering and non-payment of bills by consumers; and capped domestic gas prices that drive producers to export markets.25,32,33,36,37 Electricity tariffs are set by the Nigerian Electricity Regulatory Commission (NERC), the power sector's regulator. For reasons of political expediency (to avoid the loss of public support), Nigerian legislators have repeatedly blocked an increase in tariffs.38 Broader issues such as the perceived high risk investment environment due to security issues, widespread corruption, a multiple-rate foreign exchange regime, and political instability have deterred investment in the economy.39
The lack of appropriate regulatory frameworks for alternative energy technologies, such as power purchase agreements (PPAs) for renewable energy suppliers, discourages investment in the power system.29 Additionally, standards for equipment such as solar panels also have not been defined by the government. This is largely due to poor coordination between the relevant ministries, departments and agencies (MDAs), and a general lack of competence within those authorities.40 Finally, the inability of government to enforce the rule of law to ensure bill payment and to prevent illegal connections to the grid hampers the sector.40 The lack of public trust in DisCos and, more generally, the government greatly limits the latter's ability to implement necessary reforms in the sector.38,41
1.2 Nigeria's nationally determined contributions to the Paris Agreement
For the purpose of developing Nigeria's NDC, a Low Emissions Analysis Platform (LEAP) model of the economy was developed and a business-as-usual (BAU) GHG emissions projection was determined.42,43 LEAP uses a bottom-up approach to modelling that is grounded in sector-based analysis. With the foundational assumption of an average annual economic growth rate of 5% until 2030, the model estimated that economy-wide GHG emissions will rise to 900 million tonnes of CO2e per year by 2030 in a business-as-usual (BAU) scenario; this would be equivalent to per capita emissions of 3.4 tCO2e per person.43 In its first NDC submission, Nigeria committed to an unconditional reduction of 20% of economy-wide GHG emissions relative to the BAU scenario, and a conditional reduction of 45% relative to BAU if provided with sufficient international support “in the form of finance and investment, technology and capacity building”.43 Under the Conditional NDC, per capita emissions are expected to remain constant at 2 tCO2e per person. The NDC identified several measures, shown in Table 1, as the largest potential sources of GHG emissions reductions. It is seen that the power sector is considered most critical to climate change mitigation, with a GHG reduction potential of 159 MtCO2 from more efficient gas power plants, reduced transmission network losses and increased utilisation of renewable energy sources.44 This figure does not include further mitigation from the ending of gas flaring and improved economy-wide energy efficiency, some of which include the power sector.| Measure | Potential GHG reduction (million tonnes of CO2e per year in 2030) |
|---|---|
| Economy-wide energy efficiency | 179 |
| Efficient gas power stations | 102 |
| Work towards ending of gas flaring | 64 |
| Climate smart agriculture | 74 |
| Reduced transmission losses | 26 |
| Renewable energy | 31 |
Power sector decarbonisation targets have not been legislated in Nigeria so the annual GHG emissions allowances for the sector were determined as follows. The BAU GHG emissions projections were defined in the Nigeria's NDC, which also states that approximately 60% of emissions reductions by 2030 are achieved from electricity generation in an Unconditional NDC scenario. With this, a BAU projection for the power sector was derived and the mitigation potential estimates were used to determine the emissions reductions delivered by the sector in 2030 given the NDC commitments. Having determined the sector's carbon budget from 2015 to 2030, linear extrapolation was used to estimate the carbon budget until 2050. The carbon budget—that is, the amount of GHG emissions allowed from the sector—under BAU, Unconditional NDC and Conditional NDC scenarios are illustrated in Fig. 3. In the BAU scenario, electricity is expected to contribute 639 MtCO2 per year to economy-wide GHG emissions by mid-century. In the Unconditional and Conditional NDC scenarios, this is expected to fall to 414 and 134 MtCO2 per year, respectively, by 2050. In all scenarios, there is a significant increase in electricity-derived GHG emissions, which are currently estimated at 23.5 MtCO2 per year.45
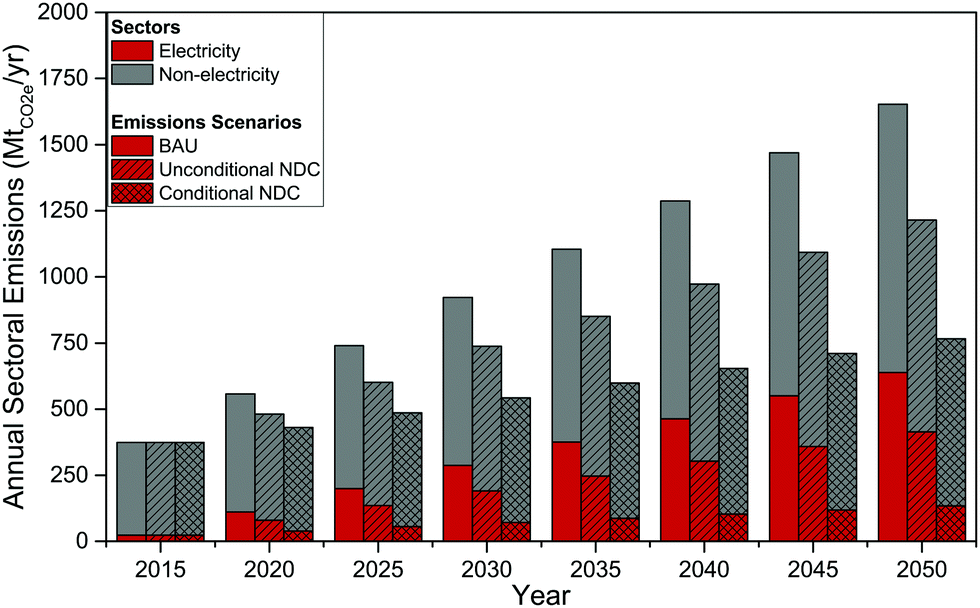 | ||
| Fig. 3 Emissions scenarios for Nigeria's nationally determined contributions to the Paris Agreement. | ||
1.3 Energy resources for power generation
Nigeria's significant reserves and production of fossil fuel resources are detailed in Table 2. Despite the abundance of natural gas in the country, dedicated exploration for the fuel has never occurred. The production figures shown below consist solely of associated petroleum gas.25 Nigeria's coal, concentrated in Kogi and Enugu states, is mainly lignite and sub-bituminous types with small quantity of high volatile bituminous coal.46 Hydro power potential has been estimated at 12220 MW.47 The technical potentials of other renewable energy sources are appreciable: small hydro (735 MW), solar CSP (36683 MW), solar PV (492471 MW), biomass (7291 MW), and wind (44024 MW).48
| Fossil fuel | Total proved reserves (end of 2018) | Annual production (2018) | Years of remaining at current extraction rates |
|---|---|---|---|
| Crude oil | 37.5 billion barrels | 2.051 million barrels per day | 50 years |
| Natural gas | 5.3 trillion cubic metres | 49.2 billion cubic metres | 108 years |
| Coal (total recoverable) | 209.4 million short tonnes | n/a | n/a |
2. Methods
2.1 Modelling the Nigerian electricity system
The Nigerian electricity system was modelled using the ESONE model. The ESONE is a spatially-disaggregated version of the Electricity System Optimisation modelling framework.24,50 It is a mixed integer linear optimisation problem (MILP) that combines generation expansion planning and unit commitment model formulations to determine the lowest-cost system design and electricity dispatch pattern over a planning horizon, subject to a set of constraints that maintain power system reliability, operability and limit GHG emissions. The spatial disaggregation allows for both generation and transmission capacity expansion planning, where the transmission network is modelled as power flow between zones. The detailed mathematical formulation of the model has been described previously.24 The key features of the model are provided below.• The country (for the purpose of this study, Nigeria) has been discretised into 37 zones. These correspond to the 36 states and the Federal Capital Territory, which are semi-autonomous regions in the Nigerian federation.
• The initial year in the model is 2020. Optimal system design—both generation and transmission capacity—are determined in time steps each of 10 years duration.
• Initial capacity availability, maximum deployment, and electricity demand are specified for each zone. Wind, solar and hydro resource availability is specified for each zone. Other system-wide constraints such as annual carbon emissions allowed, minimum reserve capacity and minimum system inertia required are specified for the whole system.
• Owing to the computational difficulty of running the model with perfect foresight, myopic foresight of two planning periods of 20 years is assumed. This is implemented by first solving the model for two planning periods (2020–2030 and 2030–2040). The solutions of the first iteration are then fixed as input parameters for the final iteration (2040–2050).
• Initial transmission network is specified according to the existing 132 kV and 330 kV lines across the country (see ESI†). It is assumed that power flow is between the centroid of each zone i.e., demand is concentrated at each transmission node. Power distribution to consumers is not considered. Power transmission is assumed to be possible between bordering zones only.
• Optimal power flow is modelled as direct current (DC) flow, assuming constant current, generator voltages, angles and power factor (VAr/Watt ratio). Energy losses are a function of transmission line length and power flow.24
• Owing to the relatively small size of Nigeria's neighbouring countries to which it exports electricity, electricity import potential was not considered.
• Unmet electricity demand is penalised through the Value of Lost Load (VoLL) – an added system cost of $10000 per MW h.
• Maximum power flow between zones, transmission line build rate, and maximum transmission capacity between states are all specified.
• To reduce computation time to less than a day per model run, technology cost learning is implemented exogenously i.e., capital costs vary temporally irrespective of their deployment level within the system. The cost projections input into the model are detailed in the ESI.†
• No shadow carbon price is included in the model.
2.2 ESONE-Nigeria model inputs
630 MW.31 This shows that Nigeria was then meeting only a third of estimated demand. Thus, power generation and transmission network must be expanded to both reduce suppressed load and cater to additional demand resulting from population and economic growth. The results presented above assume that suppressed demand decreases exponentially until 2050 when it is zero. This matches the historical evolution of electrification rates across sub-Saharan countries since the 1990s.6 A study by the Transmission Company of Nigeria showed that total electricity demand is expected to rise to approximately 70 GW by 2050. This projection and the daily electricity dispatch profile assumed in this study have been taken from that report (see ESI†).
3. Results and discussion
The ESONE model (detailed in the Methods section) was used to determine the lowest-cost power systems that deliver the three sets of emissions scenarios illustrated in Fig. 3. Initial model simulations revealed that historical rates of technology deployment are insufficient to deliver 100% energy access by mid-century. Instead, technology deployment rates of at least 0.5 GW per year—twice the fastest rate at which Nigeria has but power plants historically—are necessary. The results shown subsequently assume that this build rate increase is feasible.3.1 Cost-optimal decarbonisation pathways
We observe that, until 2050, the least-cost system design for all three emissions scenarios is the same (within model error). That is, a business-as-usual power system is sufficient to deliver even the conditional NDC under the Paris Agreement (see Fig. 4). Such a system sees an aggressive expansion of thermal generation from coal, gas and hydro power plants. Between 2030 and 2050, CCGT capacity rises by 417% to 15 GW, OCGT capacity almost quadruples to 25.2 GW, and hydro capacity (both large-scale and smaller run-of-the-river scale) increases twelvefold to its geographically-constrained maximum of 13.9 GW. Gas and hydro generation are maximally-deployed i.e., as much is built as allowed by the build rate constraints or geographic potential in the case of hydro. However, the expanded capacity is insufficient to meet nationwide demand which peaks at 69.3 GW in 2050. The initial stock of diesel generators (10 GW) which reached their end-life in 2030 is replaced in 2050 when 11.9 GW are deployed. New technologies are also relied upon to meet peak demand: coal (10 GW), solar-PV (5 GW), off-grid solar (5 GW), and onshore wind (8.6 GW) and battery storage (7.3 GW). Batteries compensate for the variability in IRES supply and store energy from thermal generators during low demand hours for peak times.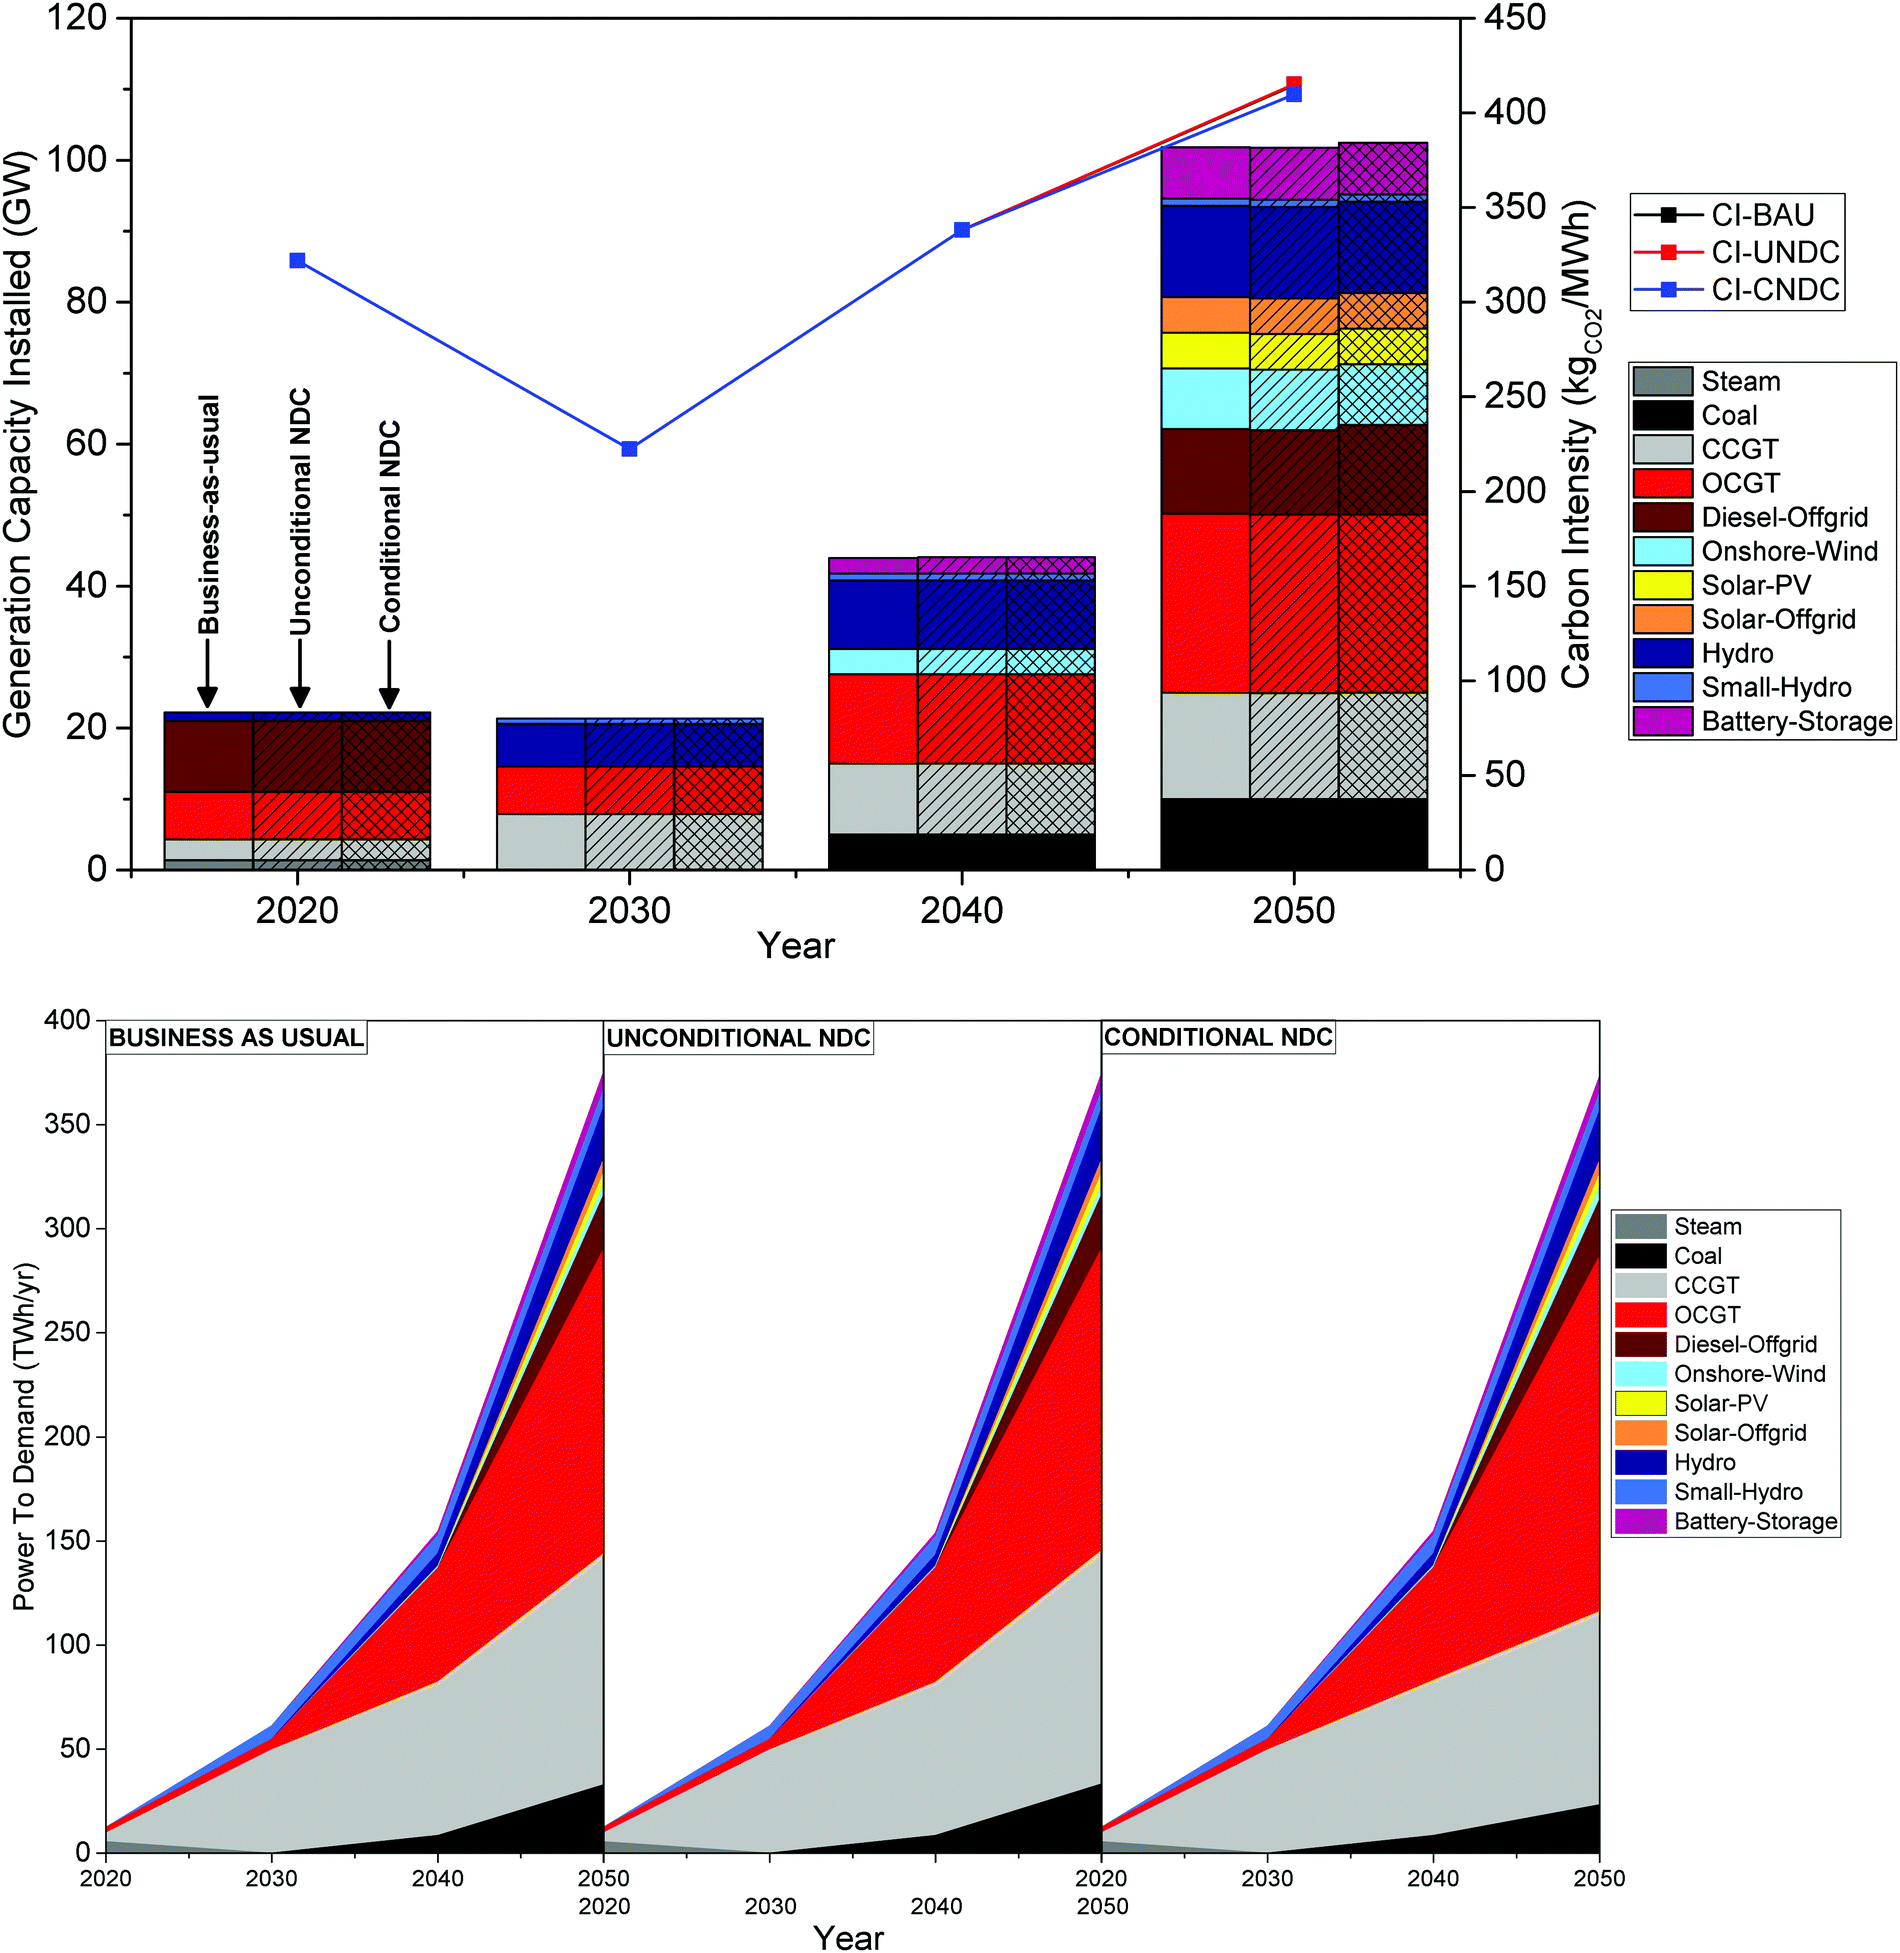 | ||
| Fig. 4 Optimal power generation mix (above) and electricity dispatch (below) for the Nigerian electricity system from 2020 to 2050 for different emissions targets, under base case assumptions for technology costs and build rates. The three emissions scenarios investigated are: ‘Business-as-usual (BAU)’, ‘Unconditional NDC’, and ‘Conditional NDC’; the emissions levels in each of these scenarios are illustrated in Fig. 3. The figure above also shows the carbon intensity of electricity generated in each year (right y-axis). | ||
Gas generation has the largest share of actual electricity out-put owing to its low CAPEX and OPEX. The Nigerian government mandates natural gas price caps and domestic quotas from producers which keeps the fuel cheap.25 In contrast, the diesel market was deregulated in 2013 so it is a relatively expensive fuel. Consequently, diesel's share of actual generation is approximately half of its share of capacity installed (12.5%). Owing to their low availabilities, IRES share of total demand met is low despite contributing 20% of installed capacity in 2050. The amount of CO2 emitted per MW h of electricity generated is seen to fall sharply between 2020 and 2030, mainly due to the temporary diesel phase-out. However, increased unabated fossil fuel use results in rising carbon intensity (CI) until 2050. Although power generation capacity rises by 325% over the planning horizon, the utilisation of relatively low-carbon natural gas results in only a 29% increase in carbon intensity.
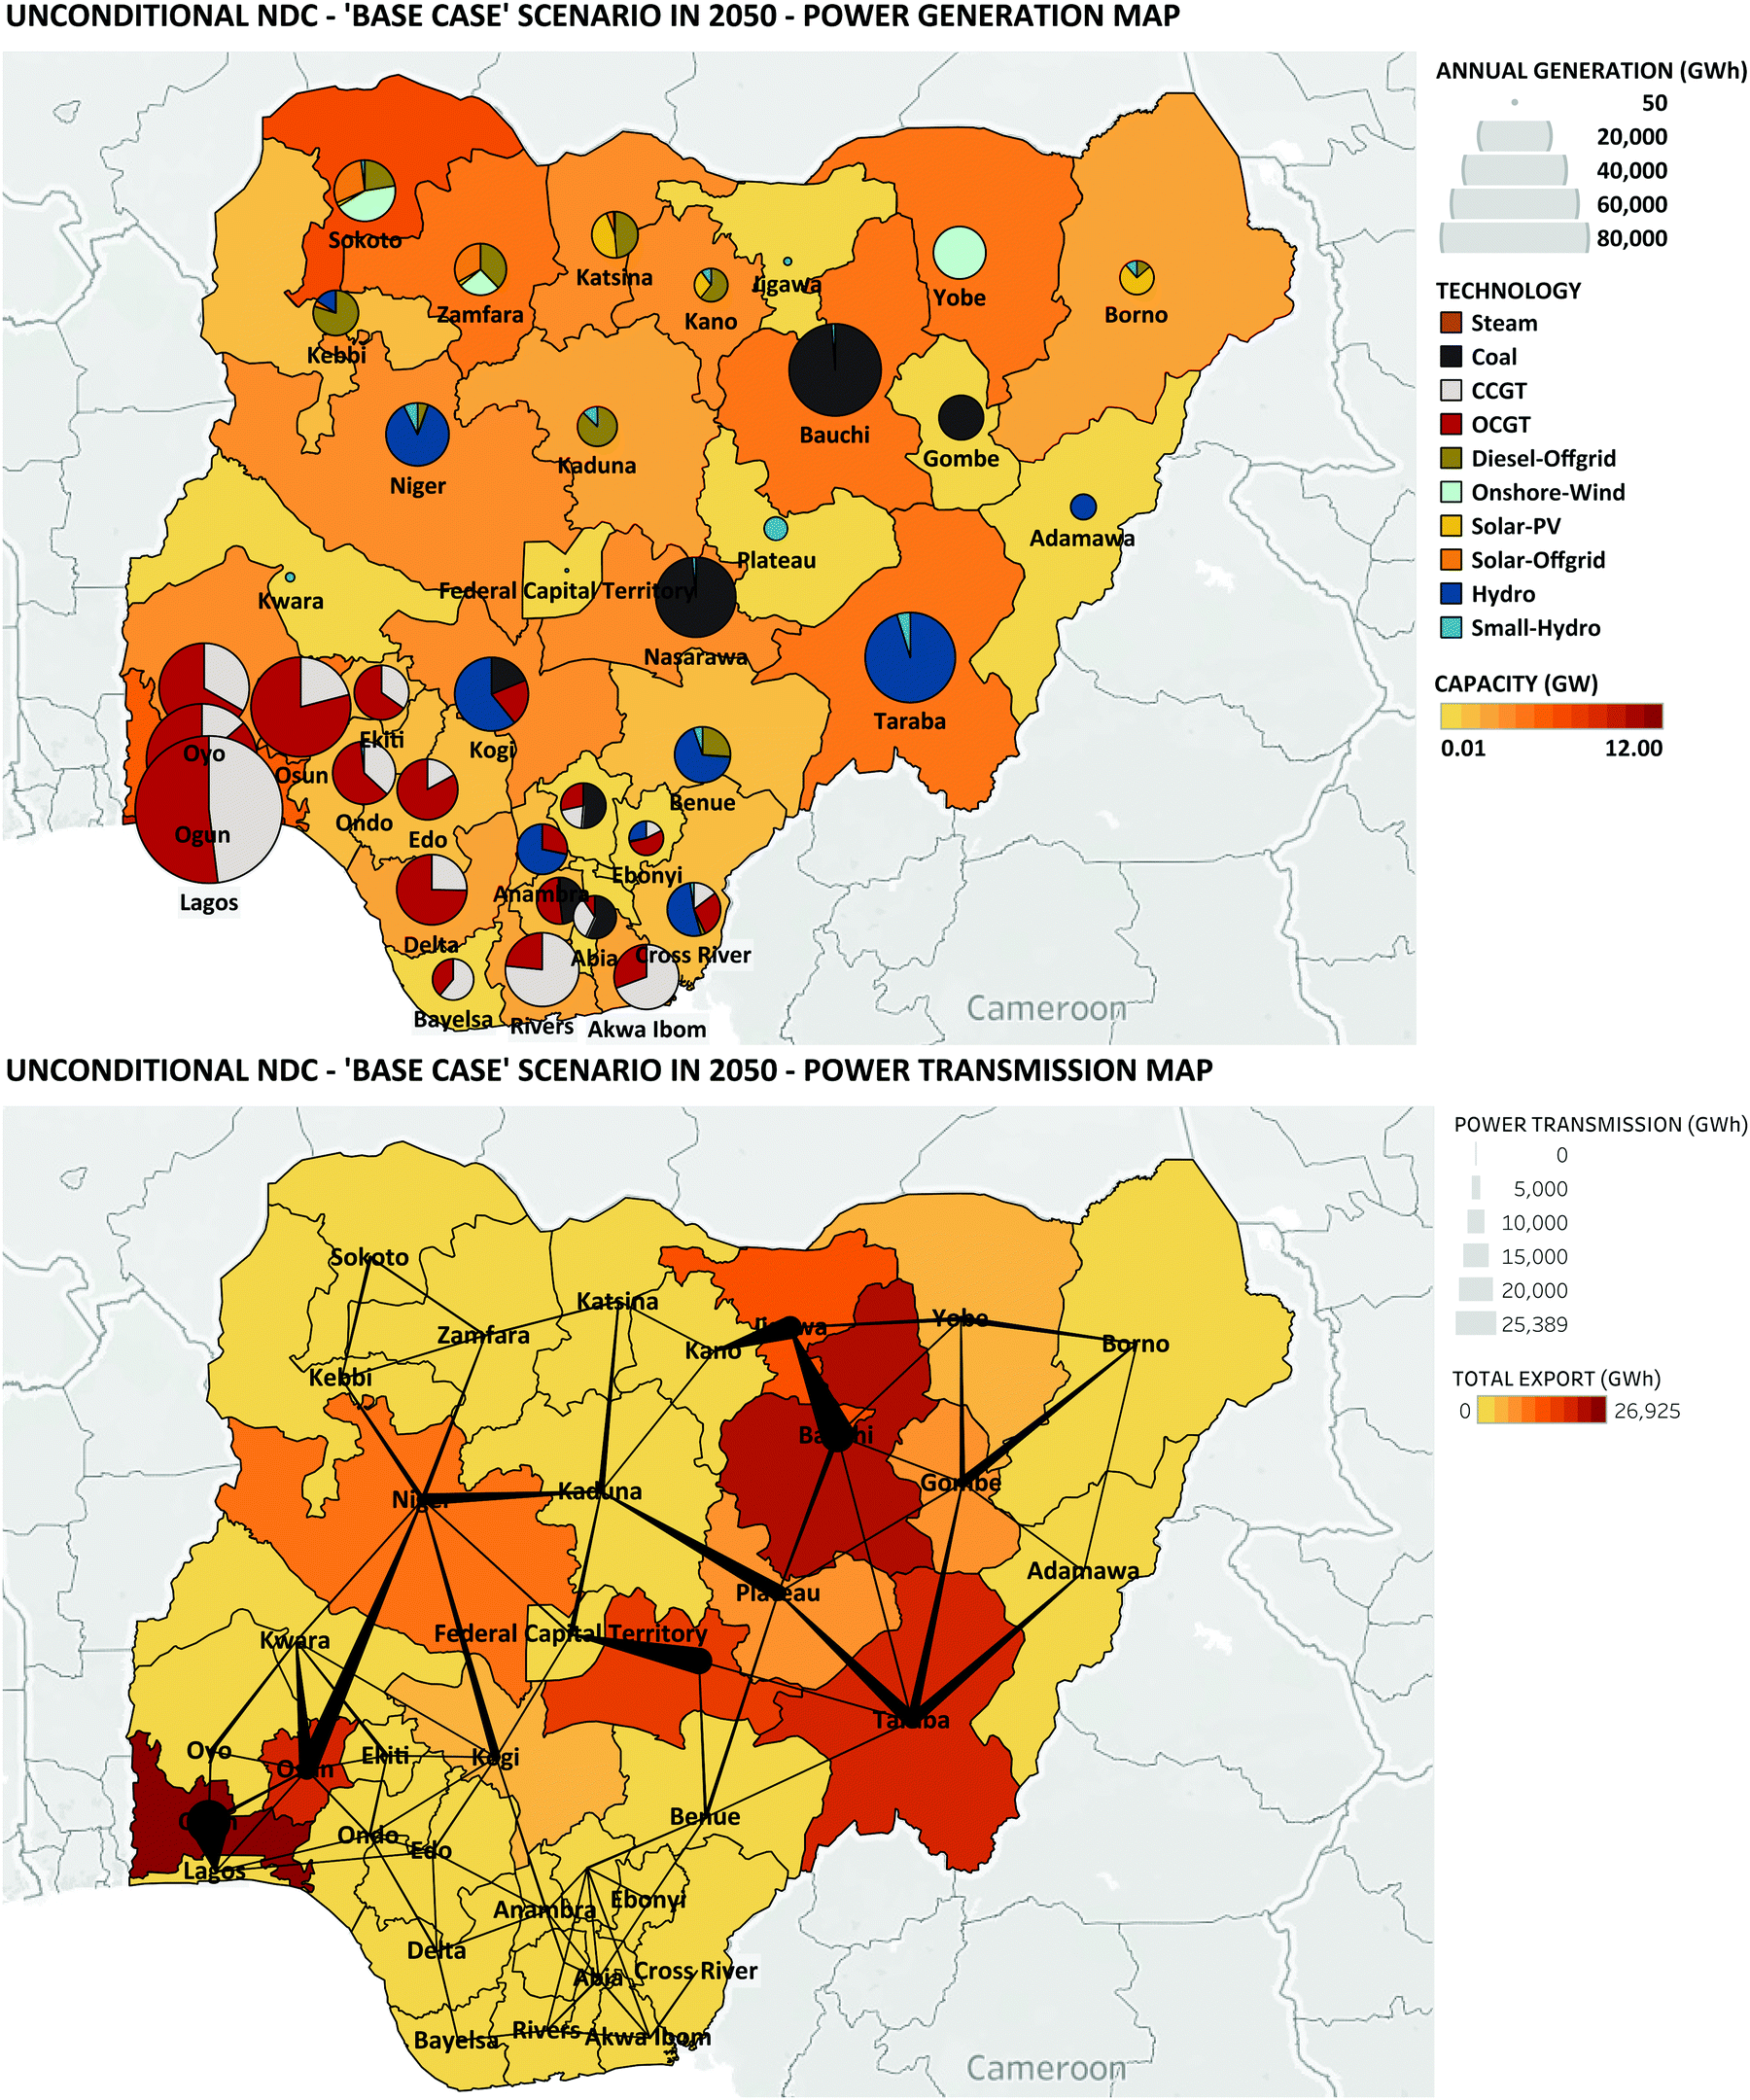 | ||
| Fig. 5 Map showing power generation capacity and transmission by state and by technology in 2050 under Nigeria's Unconditional NDC scenario. Base case technology costs and build rates are assumed. | ||
The unavailability of natural gas in the northern states and the lack of pipelines from production areas means that a diverse mix of energy sources is utilised to meet regional demand. Historically, the extension of the existing pipeline network has proved infeasible because of the large distances that need to be overcome. Additionally, a history of attacks on oil and gas infrastructure has rendered such a project to be considered as a security risk. In the absence of gas generation, large hydro (10.7 GW), small hydro (1 GW), onshore wind (8.6 GW), solar (8.2 GW), coal (4.8 GW), diesel (9.6 GW) and batteries (4 GW) are deployed across 14 states to meet demand. Solar and wind plants are mainly built in the Sahelian parts (Sokoto, Zamfara, Borno) of the country where availabilities are highest.
The North-West (NW), which accounts for a quarter of the country's population, still experiences unmet demand. This is satisfied with imports from southern states (via Osun and Niger) and 4 GW of battery storage which shift excess supply to the evening peak. For the North-East region, it proves cheaper to rely on coal than on diesel generation (because of its high OPEX) or other imports (because of the additional investment required in transmission capacity over long distances). High-utilisation coal plants in Bauchi (4 GW), Nasarawa (3 GW) and Gombe (1 GW)—all states with relatively low demand—make them the largest state-exporters of electricity to neighbouring states. Inter-state power transmission, and thus cooperation, is crucial to delivering electricity at least cost.57
Optimal system design differs significantly by region because of resource availability and geography. Southern states rely on natural gas-fired plants and minimal inter-state/regional transmission lines. Despite the abundant landmass and relatively high availability of IRES in the north, they are insufficient to meet domestic demand. Electricity imports from states with large hydro and coal generation capacities are critical to meet the shortfall in demand. Off-grid generation via diesel, solar and small-scale hydro is also necessary.
3.2 Cost of delivering the Paris Agreement
There is considerable uncertainty in the ESONE-Nigeria model parameters including technology costs, build rates and availabilities, owing to a lack of historic precedent. Consequently, the implications of a range of modelling assumptions for system design and decarbonisation costs were investigated (see Fig. 6 and 8). The cumulative system cost (CSC) in year a is the total capital and operating costs incurred by the system from the initial planning year (2020) until year a. Henceforth, system costs will be presented relative to the BAU cost.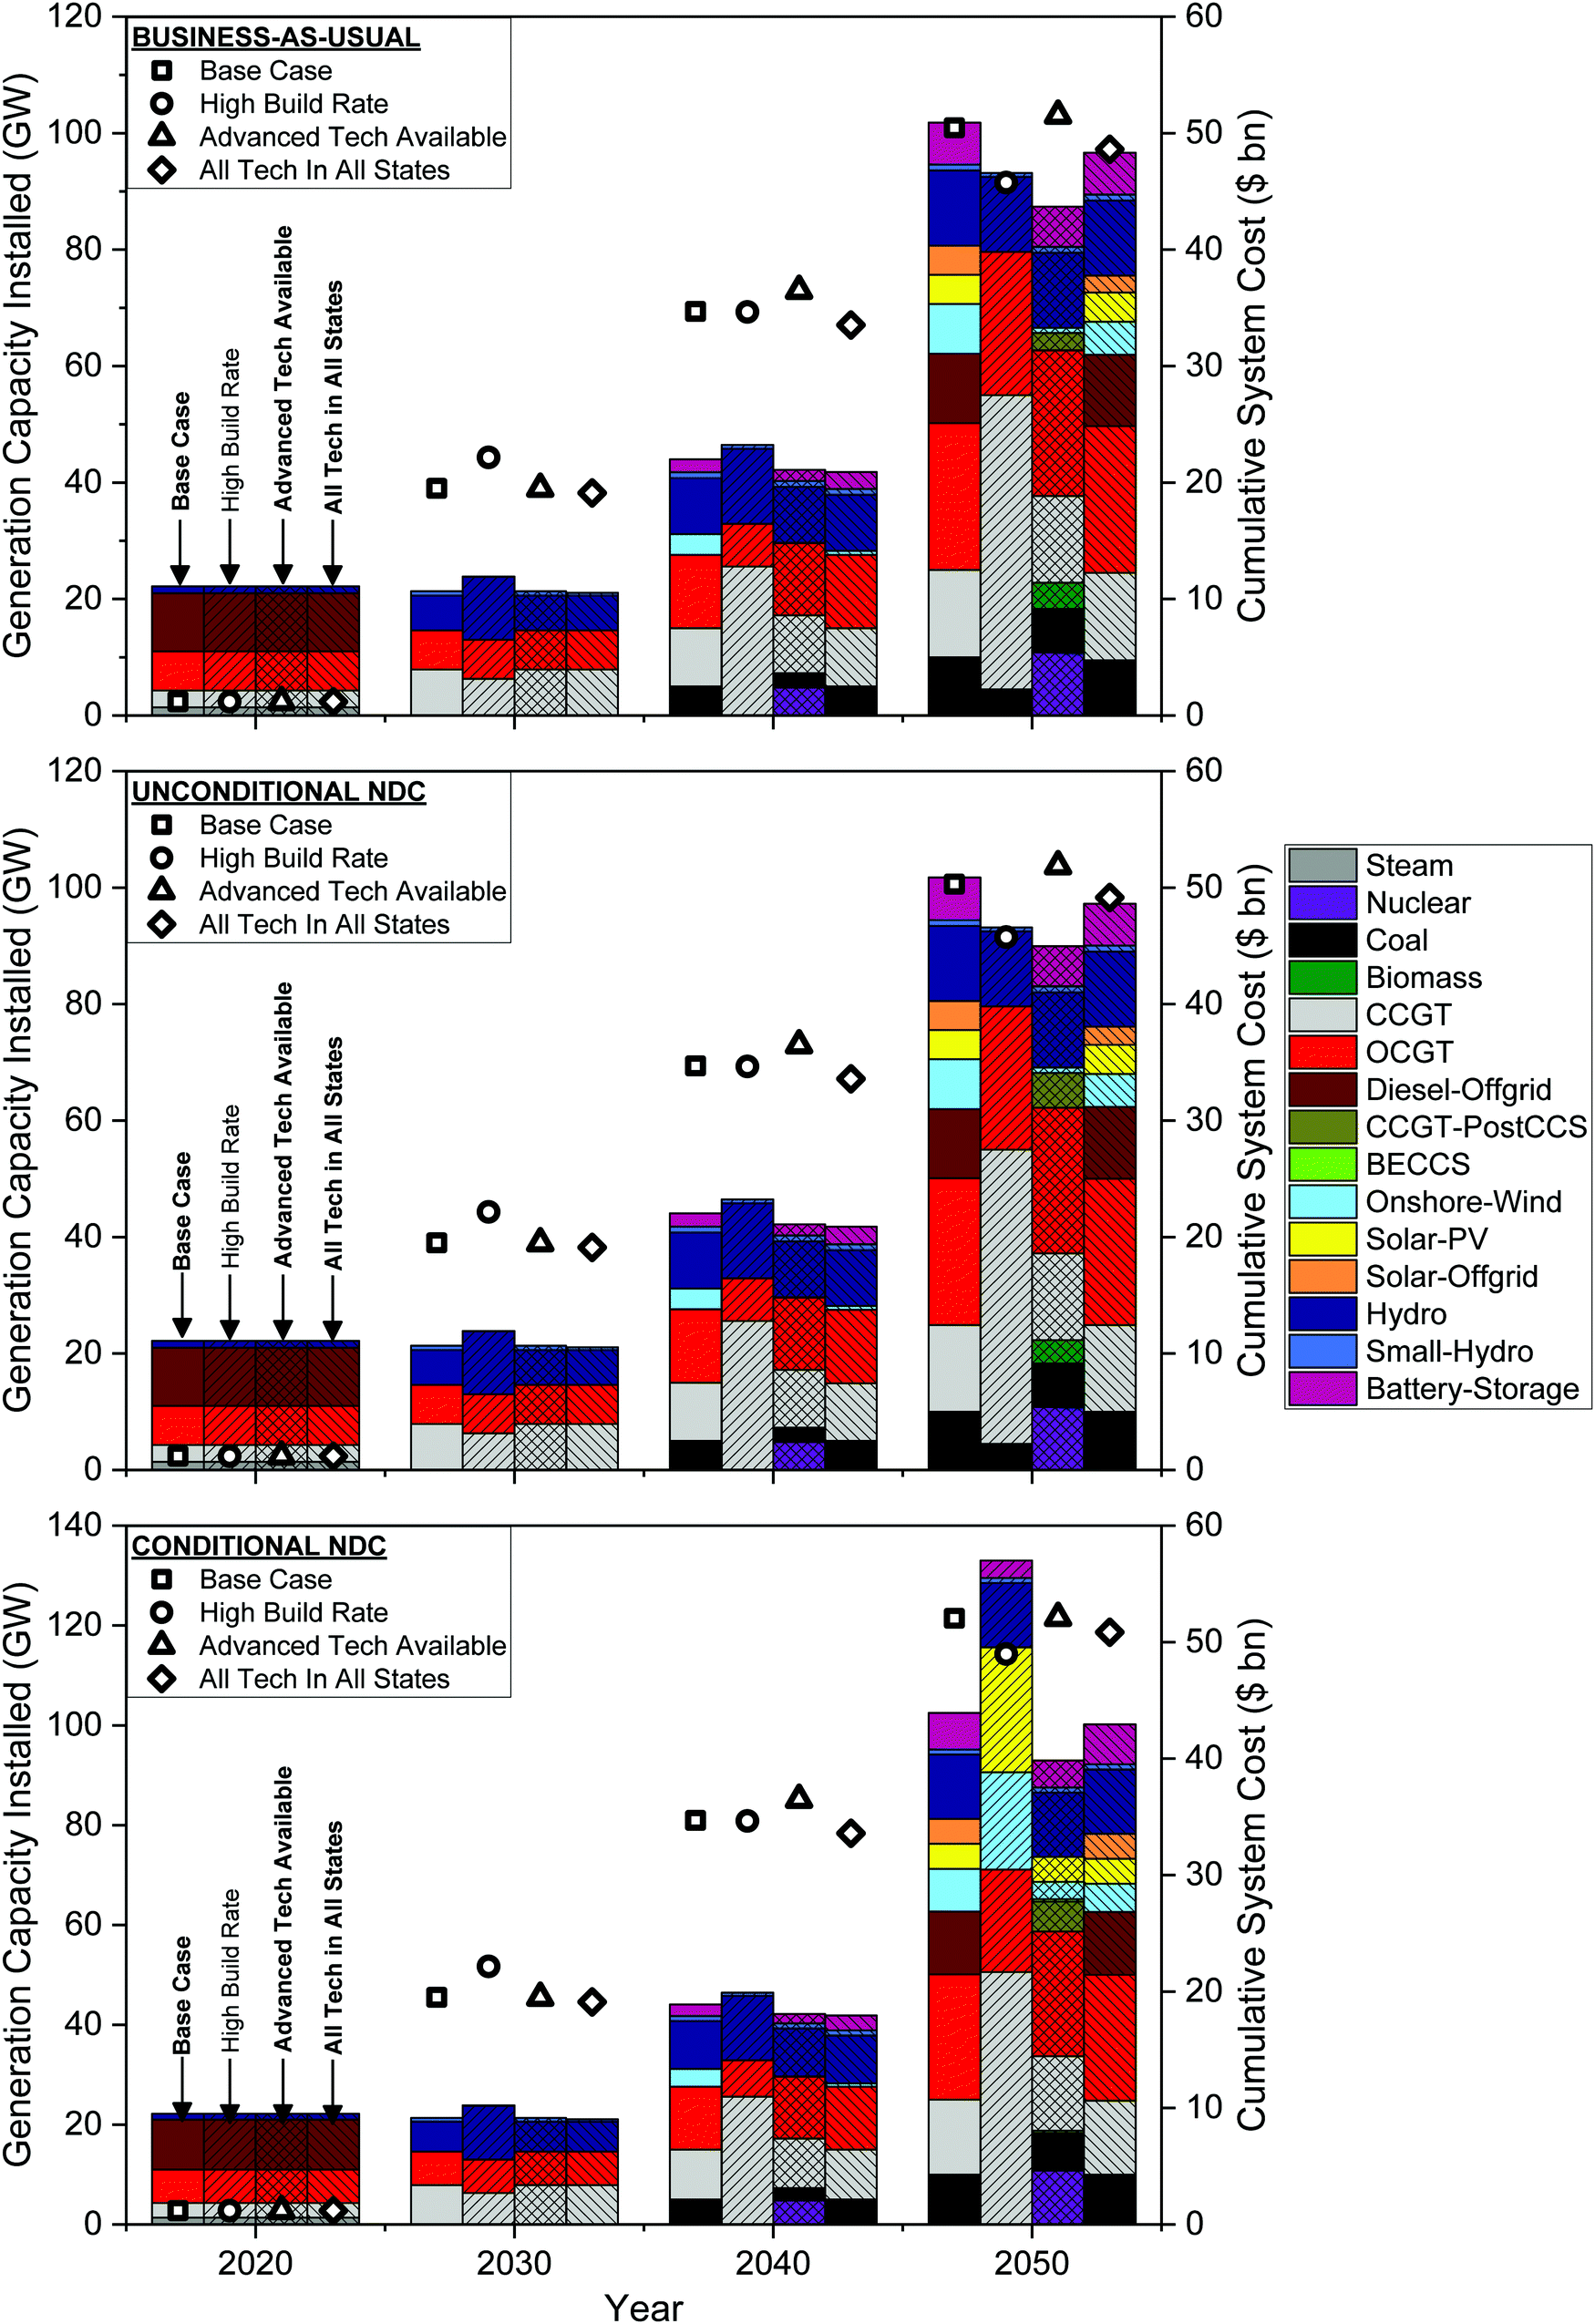 | ||
| Fig. 6 Optimal power generation capacity mix (left y-axis) and cumulative system cost (right y-axis) of the Nigerian power system under different emissions scenarios and modelling assumptions. Cumulative system cost in year a is the total capital and operating costs invested into the system until year a. The three emissions scenarios investigated are: ‘Business-as-usual (BAU)’, ‘Unconditional NDC’, and ‘Conditional NDC’; the emissions levels in each of these scenarios are illustrated in Fig. 3. The different sets of modelling assumptions are described in Section 3.2. | ||
In the unconditional NDC scenarios, the CSC in 2050 is 100% of the BAU cost (applying a 10% discount rate to future cash flows).¶ For the conditional NDC target, the CSC is 104% of the BAU case. Three alternative modelling assumptions are investigated: (1) a ‘High Build Rate’ scenario in which technology deployment rates are increased to 2.5 GW per year; (2) an ‘Advanced Tech Available’ scenario in which nuclear, biomass and CCS technologies are available for deployment throughout the planning horizon; and (3) an ‘All Tech In All States’ scenario in which fossil generation (Coal, CCGT, OCGT) can be built in states where the resource is not available and pipelines do not exist. The implications of these for decarbonisation costs are discussed below.
The availability of advanced generation technologies has no significant impact on the total system cost (within the model error) however total installed capacity in 2050 falls by 12%. By mid-century, nuclear (10.8 GW), biomass (4 GW) and CCGT-CCS (6 GW) are built. The higher availabilities of these baseload low-carbon generators displace the need for any solar, which has low availability and requires added grid flexibility, and diesel, which has a high OPEX thus is only used during peak hours. Onshore wind capacity is also displaced but 0.9 GW remain in 2050. Thus, the availability of advanced technologies could reduce the amount of infrastructure that needs to be built to meet demand, however their relatively high capital costs means that lower total installed capacity does not translate to reduced system costs.
When gas- and coal-fired power plants can be built in states that do not have the resource, the total system cost and installed capacity in 2050 both fall by 4%. These fossil plants are deployed in the North-West and North-East regions of the country, where they displace some off-grid solar and onshore wind capacity.
As previously observed, the deployment of high-availability, low-carbon generators decrease capacity installed by 9% but their higher CAPEX means that total system cost remains unchanged.
Additionally, the deployment of fossil generation in the north results in the displacement of some onshore wind capacity which falls from 8.6 GW to 5.7 GW in 2050. In contrast, battery storage capacity rises by 10% to 8 GW. Increased energy storage is required to supplement gas generation during peak hours in the North-West and North-East; batteries store surplus electricity from coal and gas during low demand hours. The rest of the energy mix remains unchanged. Total system cost and capacity installed also remain unchanged within the model error.
3.3 Delivering Nigeria's NDC at lowest cost
Fig. 6 shows that faster power plant build rates are most critical to driving down the costs of delivering the Paris Agreement. We find that increased technology deployment rates could mean that intermittent renewable energy sources are not critical to delivering Nigeria's unconditional NDC, and coal-fired generation could yet be part of a Paris Agreement-compliant electricity system. Fig. 7 shows the spatial distribution of power generation and transmission infrastructure in 2050 in such a ‘High Build Rate’ scenario. In this system, it proves sufficient to meet all demand and the unconditional NDC by utilising only natural gas (75.1 GW), coal (4.5 GW) and hydro (13.6 GW) generation. CCGTs are preferred over OCGTs because of their lower OPEX and higher availabilities; the latter is only deployed when the maximum deployment capacity of CCGTs is reached in a state. The lack of IRES, especially solar PV, in a least-cost electricity mix occurs for two reasons.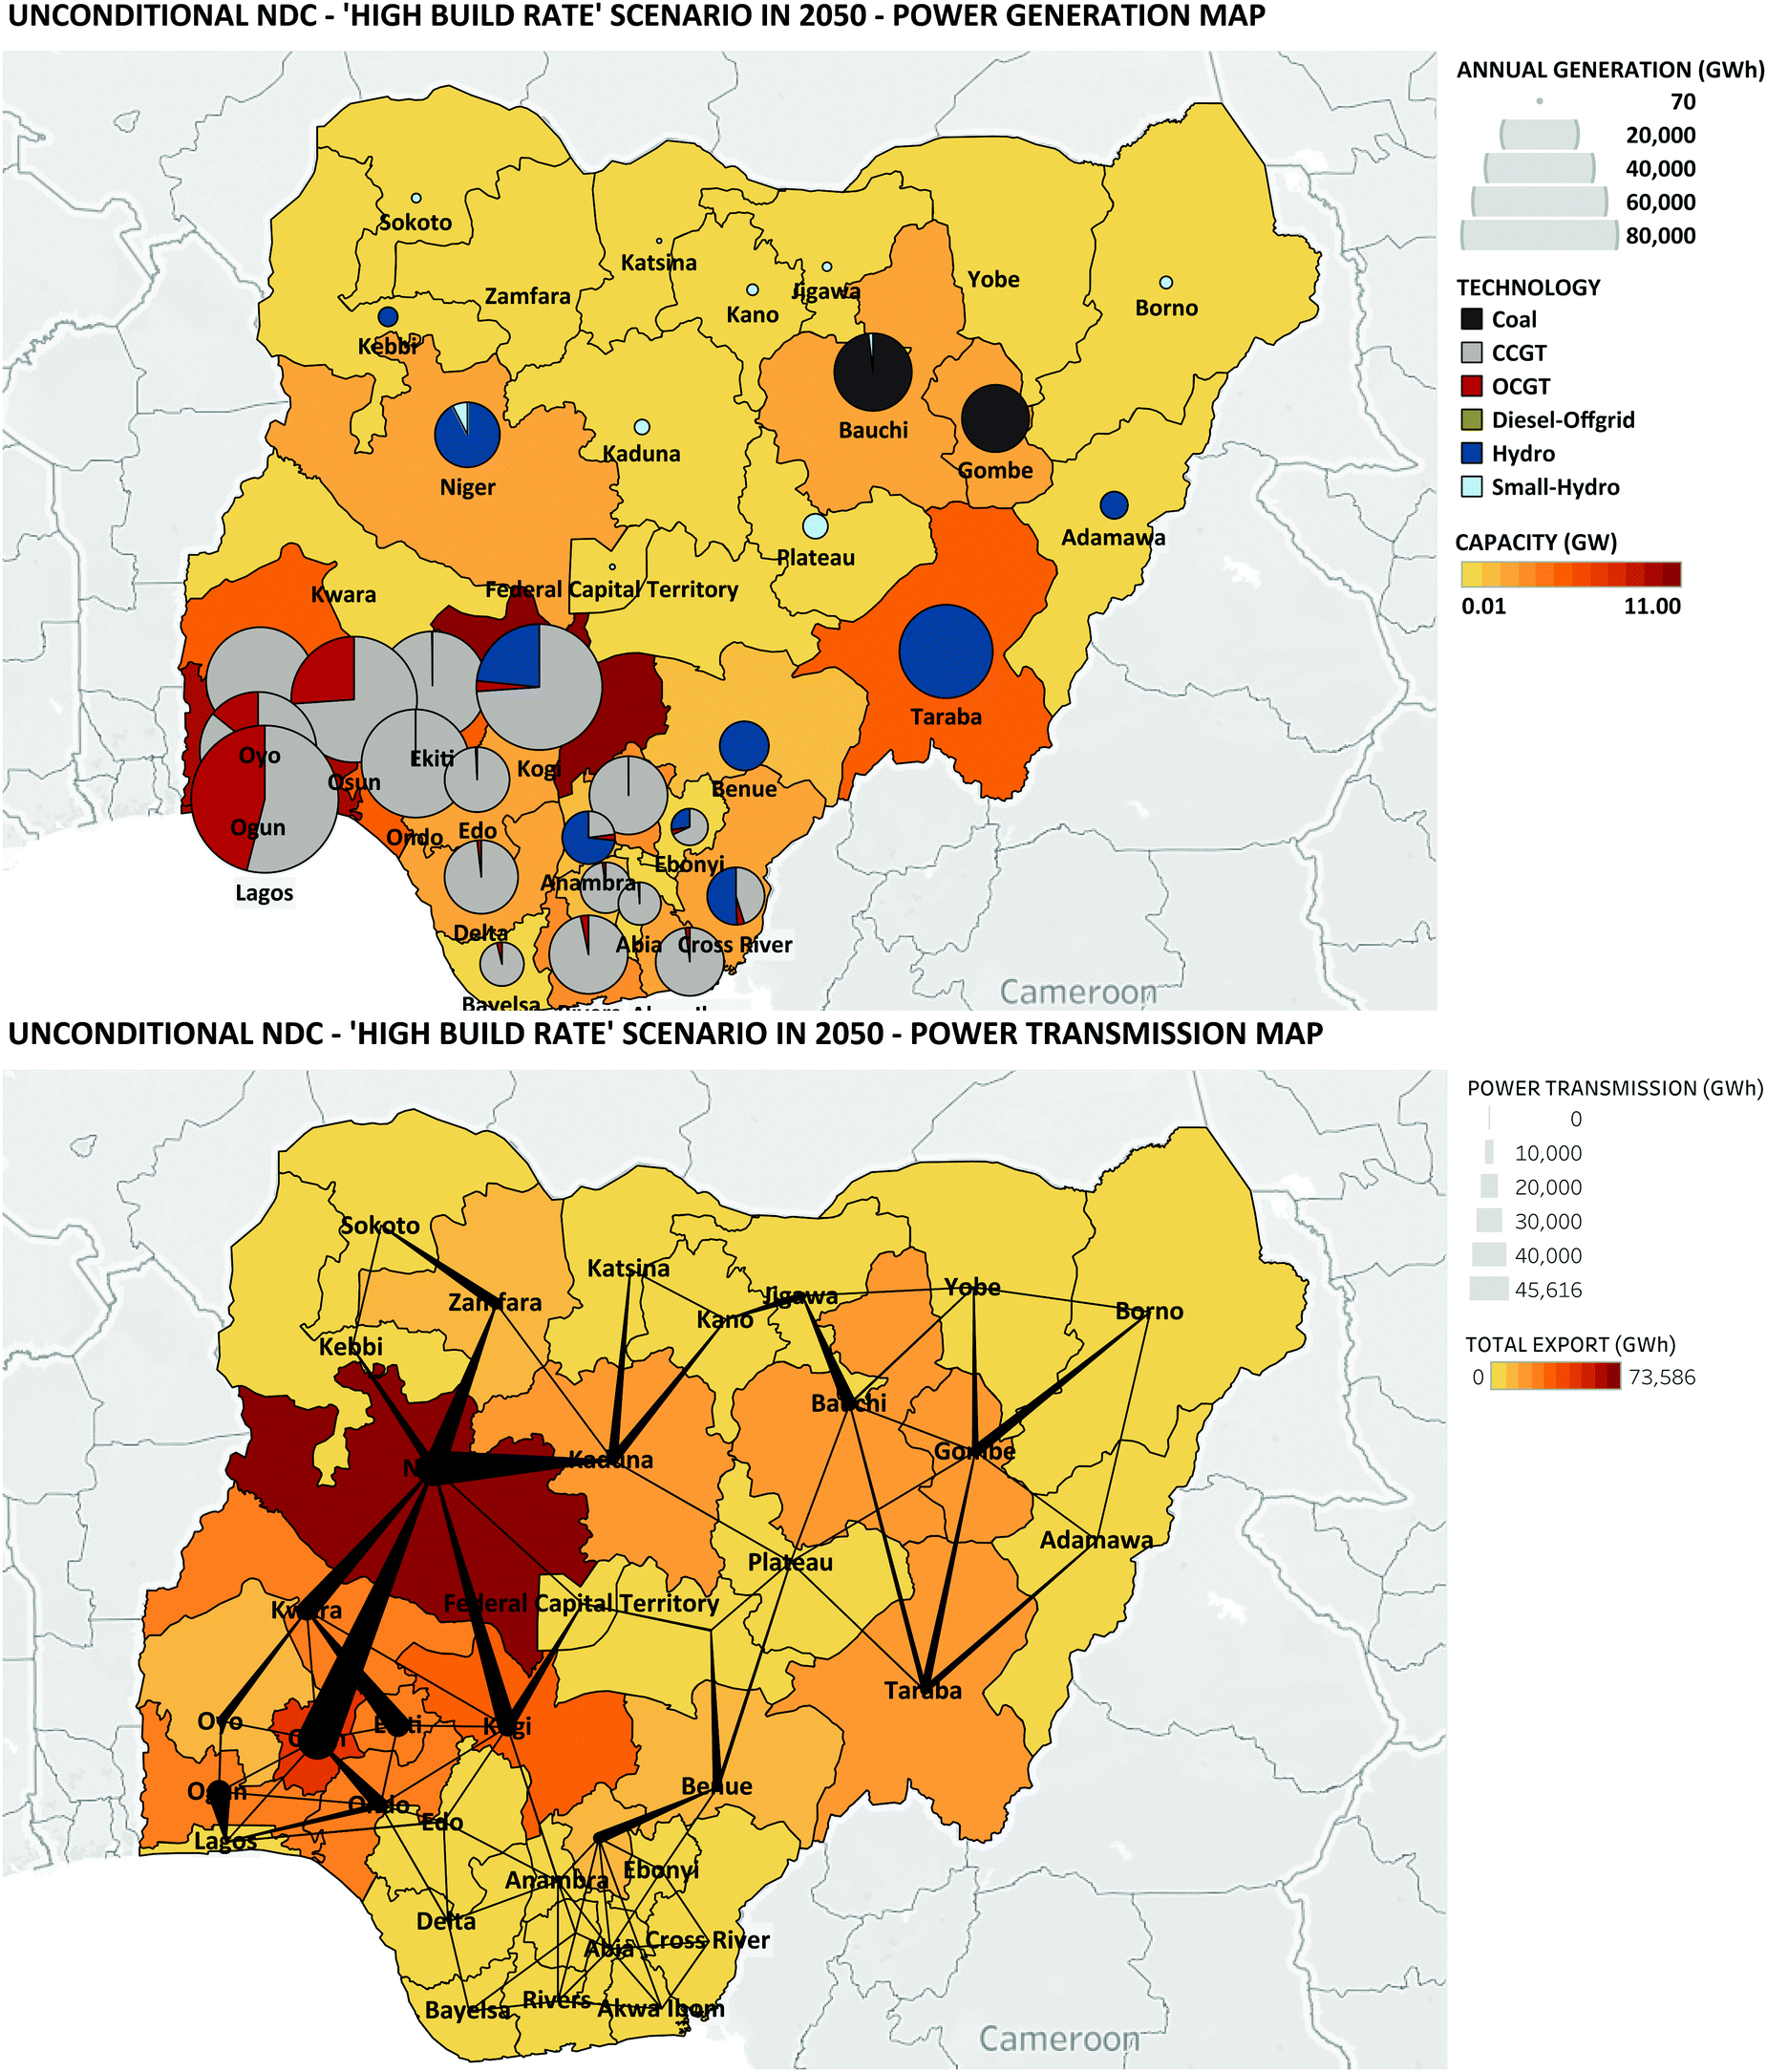 | ||
| Fig. 7 Map showing power generation capacity and transmission by state and by technology in 2050 under the lowest-cost unconditional NDC scenario. In this scenario, technology deployment rates of up to 2.5 GW per year are possible. | ||
First, Nigeria has not enjoyed the cost reductions in solar and wind power seen elsewhere globally as no grid-scale projects have been completed and investment has not been de-risked58—solar PV ($2180–2580 per kW) and wind ($1860–3900 per kW) CAPEX are still more expensive than natural gas-fired generation ($400–700 per kW) (see ESI†). Additionally, IRES have much lower availabilities than fossil generators and often require energy storage to compensate for the variability in their supply. Consequently, when build rates are not limited, it proves cheaper to deliver dispatchable electricity using gas-fired power plants instead of IRES.
Heavy reliance on natural gas, as described above, leads to the concentration of generation in the south. Thus, inter-regional transmission becomes critical to meeting demand. Northern states such as Kwara, Kogi and Niger that border regions with gas generation are key conduits for power transmission. In addition to its proximity to the gas-rich South-West, its large hydro generation makes Niger state the largest exporter of power, principally serving states in the North-West. The availability of coal plants in Bauchi and Gombe, and hydro in Taraba reduces the region's reliance on imports but they remain important for meeting domestic demand. Whilst the geographic concentration of power infrastructure (and thus investment and jobs) may deliver a cost-optimal electricity system, such a system is likely to be infeasible as Nigeria's political landscape mandates the equitable distribution of economic resources across geopolitical zones.
3.4 Facilitating Nigeria's energy transition
Many countries, including Nigeria have implemented policies to promote the use of low-carbon energy sources and drive down their costs. Since the adoption of the 2015 National Renewable Energy and Energy Efficiency Policy (NREEEP), Nigeria has developed feed-in tariff and mini-grid regulation, provided tax incentives for solar panels, and made available investment grants for low-carbon energy sources.44,59 A biofuels blending mandate and an act to establish the Rural Electrification Fund came into force in 2007 and 2014, respectively.59 Owing to a poor macroeconomic environment that has deterred investment, the effects of these policies are yet to be seen. We assess the effectiveness of common ‘green policies’ on optimal system design (see Fig. 8).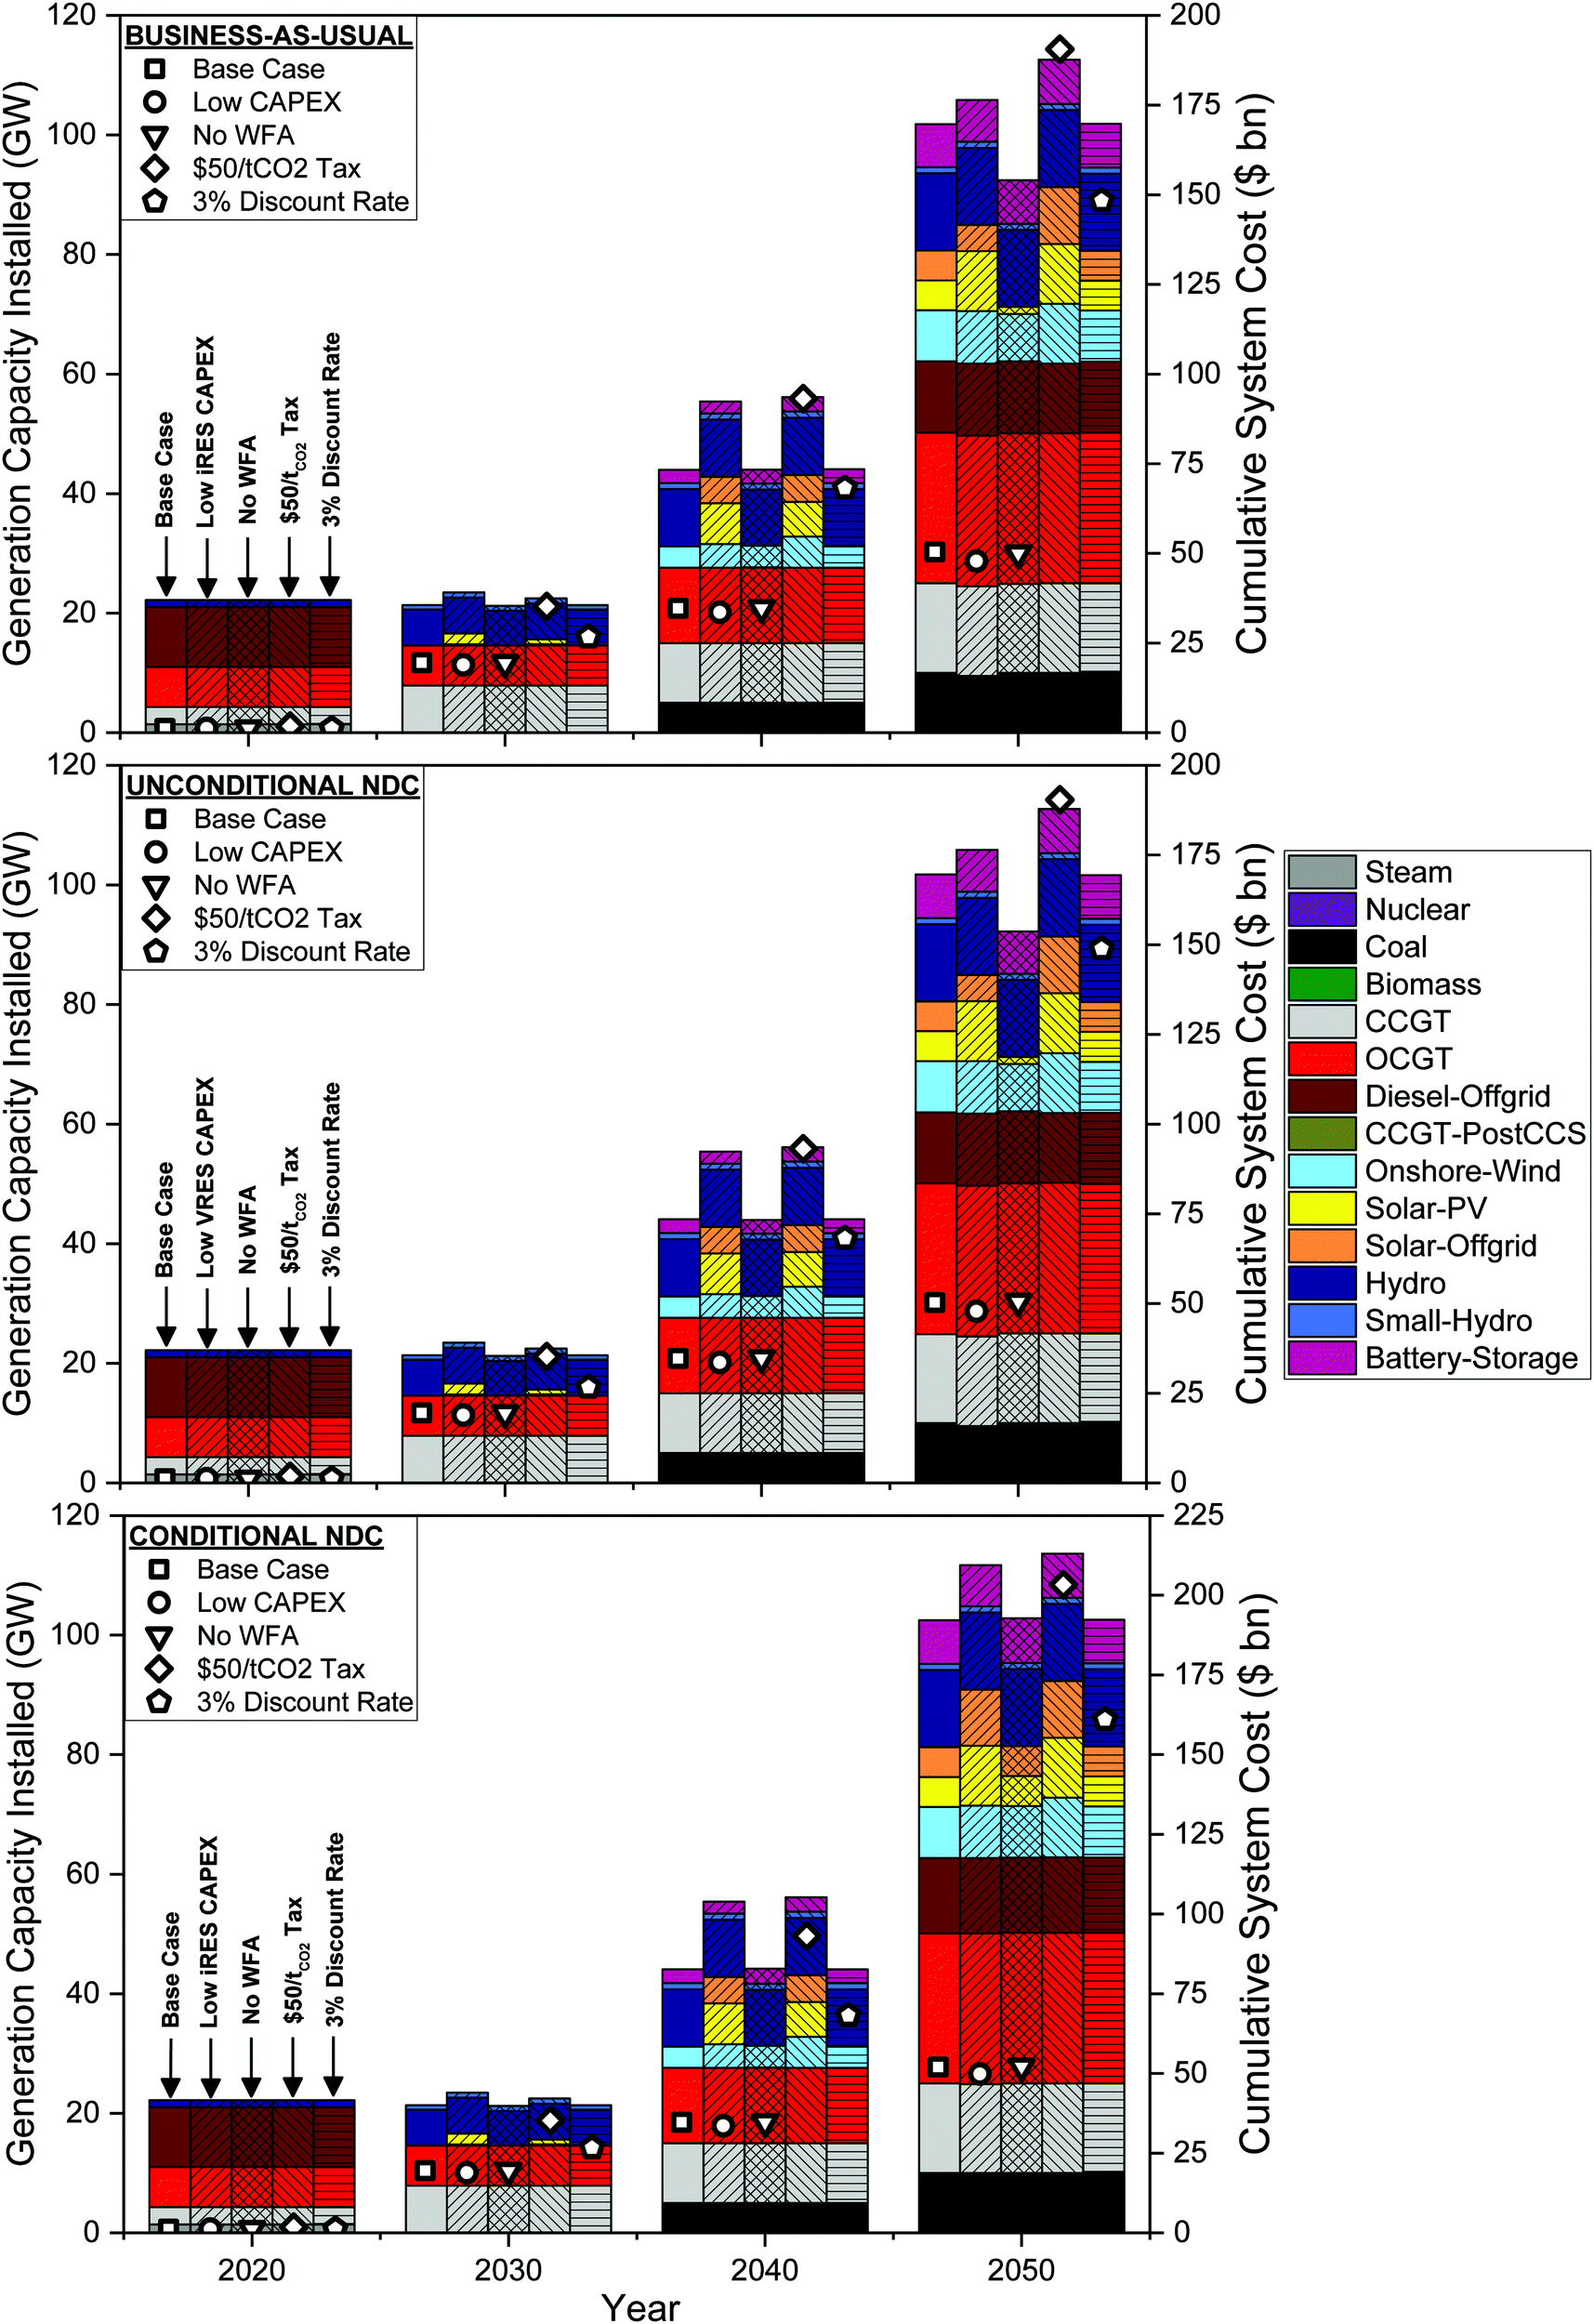 | ||
| Fig. 8 Optimal power generation capacity mix (left y-axis) and cumulative system cost (right y-axis) of the Nigerian power system under different emissions scenarios and policy interventions. Cumulative system cost in year a is the total capital and operating costs invested into the system until year a. The three emissions s scenarios investigated are: ‘Business-as-usual (BAU)’, ‘Unconditional NDC’, and ‘Conditional NDC’; the emissions levels in each of these scenarios are illustrated in Fig. 3. | ||
In all the scenarios assessed, the amount of fossil fuel generation capacity required is unchanged even when IRES deployment rises. This highlights the importance of dispatchability in a power system that needs to scale rapidly whilst maintaining grid reliability and operability. Fossil generation remains critical to delivering universal energy access because of its higher availability, dispatchability and, in the case of natural gas plants, relatively low capital costs.
3.5 Low-carbon barriers and opportunities
An extensive literature exists on the sectoral reforms necessary to improve Nigeria's power sector.25,32,33 Delivering universal energy access alongside its Paris Agreement commitments poses additional challenges and considerations for the design of these reforms.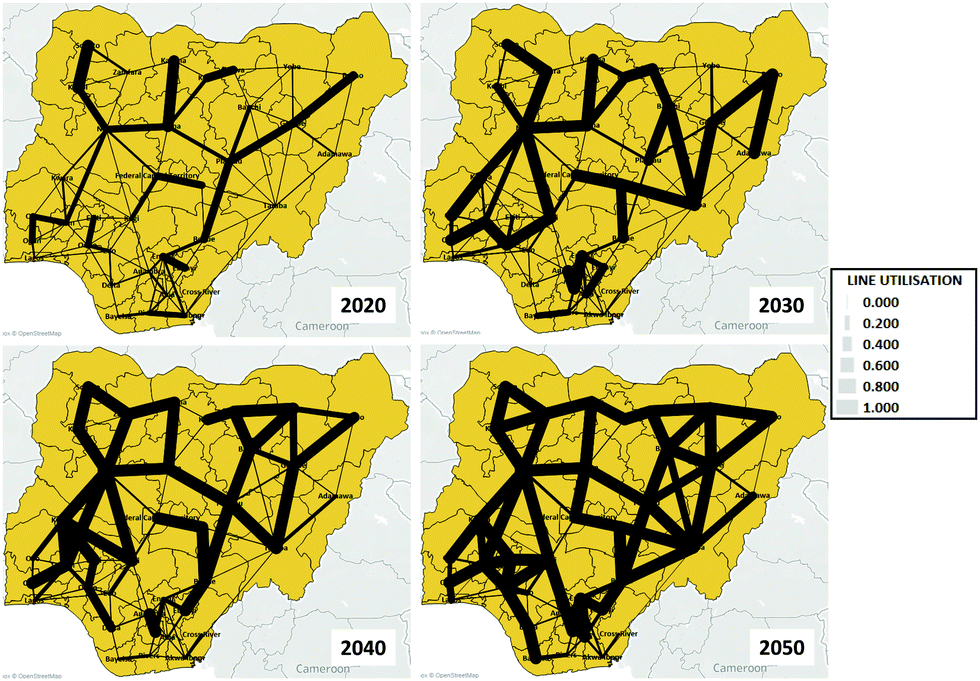 | ||
| Fig. 9 Inter-state transmission line utilisation factors from 2020 to 2050 under the Unconditional NDC base case scenario. Utilisation factors range from 0 to 1, with the upper-bound representing 100% utilisation of available power transmission capacity. | ||
Electricity tariffs are currently pre-determined by the sector's regulator, NERC, through the Multi-Year Tariff Order. The most recent revision of the MYTO sets prices at NGN 4–66 per kW h ($11–184 per MW h at the current official exchange rate of 360.5 NGN per $) depending on the type and scale of the consumer.65 Owing to the dearth of industrial and commercial users, majority of the electricity consumers are smaller-scale households that are charged at the lower-bound of the tariff range. These prices are a third of the current and projected marginal costs of generation according to the ESONE model. The highest-OPEX generators which typically set the marginal cost of electricity are OCGT ($37 per MW h) and diesel ($155 per MW h) plants. Therefore, if tariffs are not increased, GenCos and DisCos will continue to face significant revenue shortfalls and investment in additional generation capacity will be deterred. Historically, tariff increases have proved difficult owing to a range of socio-political factors—political actors resist price hikes to avoid using public support. This is likely to remain the case as long as the government retains price-setting control through the regulator.
Market-driven electricity prices can be achieved in Nigeria through two means: (1) an upward revision of tariffs by NERC, or (2) the creation of a competitive market for electricity through liberalisation of the entire power sector value chain. Without either of these, DisCos will continue to experience the revenue shortfalls that create illiquidity across the entire power value chain,|| and government financial support will remain necessary—government subsidies to the power sector drain re- sources from other critical sectors of the economy such as education and healthcare.64,66 In addition to higher tariffs, policies that incentivise the resolution of other sources of poor revenue collection rates, including poor metering and non-payment of bills by consumers, need to be implemented. According to NERC, 4.09 million of the 7.38 million DisCo customers (54.7%) are unmetered.67 Furthermore, 50% of the 3.39 million metered customers have faulty or obsolete meters. This has led to the practice of estimated billing by DisCos—this involves billing customers according to average service delivery to the region, not individual consumption. Owing to high incidence of electricity theft, many customers are overcharged for their power consumption, and refuse to pay bills which adds to the losses incurred by DisCos. The Credited Advance Payment Metering Implementation programme (2013) was designed to end estimated billing by allowing customers to purchase meters from DisCos with the promise of reduced fixed costs on future bills, however DisCos failed to deliver purchased meters.**68 The Meter Asset Provider regulation (2018) enacted allows for other independent companies to provide metering services, but positive results are yet to be seen.68 High upfront installation costs and poor service delivery have deterred the reduction of the unmetered population in the power sector. Better financing models and disincentives for poor service delivery need to be implemented.
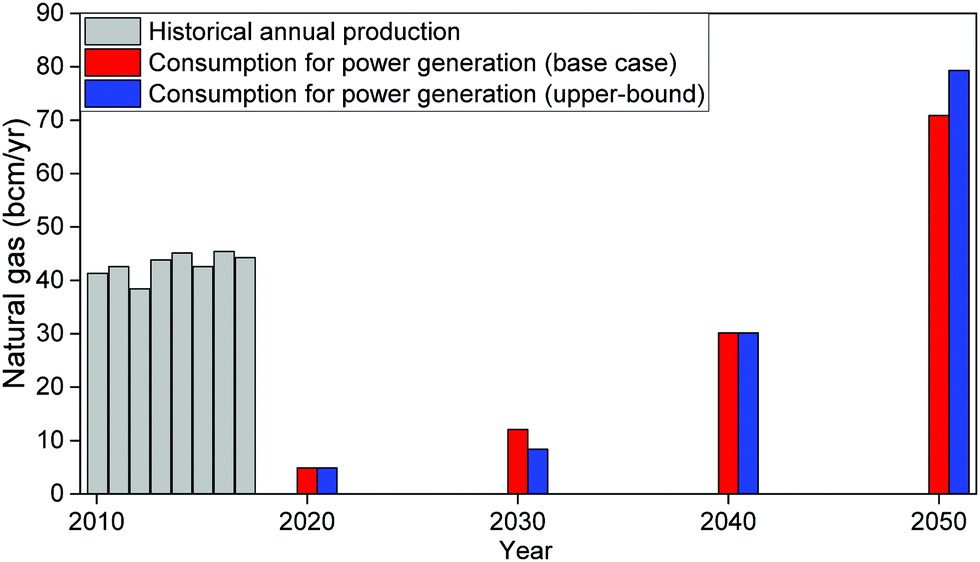 | ||
| Fig. 10 Forecast for natural gas consumption by the power sector, according to the ESONE model. Historical annual natural gas production is also shown. | ||
The above highlights that current NG production is insufficient to meet the needs of the power sector (and others) by 2050. An expansion of domestic production and a reduction of exports is therefore necessary. Currently, the Nigerian gas industry export-oriented because international LNG netback prices (>$2.5 per MMBtu) are far greater than local gas prices ($0.5 per MMBtu) which are capped by government.†† Domestic supply obligations are imposed on gas producers to ensure some local demand is satisfied.70 The National Gas Policy (2017) proposed several measures to reform the gas industry including the encouragement of exploration of new gas supply sources from offshore and inland basins, liberalisation of access to gas transmission and processing infrastructure, and the development of domestic gas markets.66 However, quantifiable targets or a timeline were not included. The Petroleum Industry Bill (2020) which is still being debated in parliament will allow for the NG price cap to rise by $4 per MMBtu by 2037. To deliver energy access and the NDC at low-cost, the success of these domestic NG market reforms must be prioritised. Additionally, the pipeline network must be expanded alongside production to allow for greater volumes to be transported to power plants near demand centres, particularly in the South-West.
000 MW h for overshoot (see Methods).
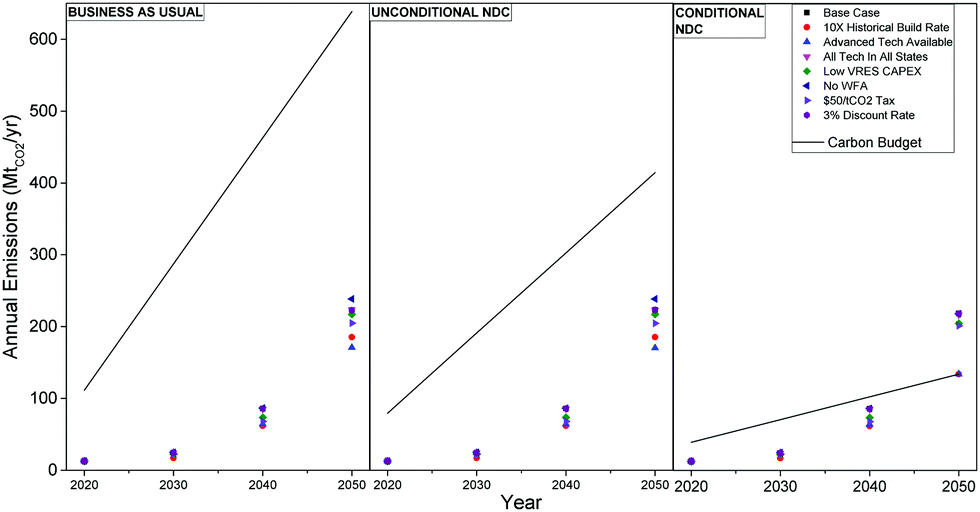 | ||
| Fig. 11 Projected annual CO2 emissions from power generation from 2020 to 2050 under different emissions targets and modelling assumptions. The black lines illustrate the annual carbon budget for the power sector as a reference. | ||
The ‘surplus carbon budget’—the difference between the actual annual system emissions and the maximum allowed—in the unconditional NDC scenarios peaks at 244 MtCO2 per year in 2050. In the conditional NDC scenarios, the surplus peaks in 2030 at 54 MtCO2 per year. This surplus carbon allowance presents two opportunities. First, that Nigeria can pursue a more aggressive GHG emissions reductions target in their revised unconditional NDC with no added cost implications. Secondly, the power sector could offset emissions from other sectors of the economy thereby alleviating some of their decarbonisation burden, or trade offsets internationally. The latter requires the establishment of an international emissions trading scheme that Nigeria is a part of.
Carbon offsets are measurable and verifiable emissions reductions activities that can be traded in voluntary or compliance markets (where government regulation mandates emissions reductions or the purchase of offsets).71 Increasingly, organisations are purchasing offsets to minimise the carbon footprint of their operations.72 Between 2005 and 2018, 435.4 MtCO2 of voluntary offsets were issued, with 13% of the projects located in Africa (23 countries, including Nigeria).73 Nigeria is also committed to the Carbon Offsetting and Reduction Scheme for International Aviation (CORSIA) which seeks to limit the industry's emissions through offsets. In 2018, 98.4 MtCO2 per year of voluntary carbon offsets were transacted at an average price of $3.01 per tCO2 (Africa average = $4.2 per tCO2).74 Although the prices are currently low, increasingly stringent emissions reduction targets and carbon pricing mechanisms could drive up demand, and thus prices. Assuming current prices, the Nigerian power sector could generate up to $734 million in revenues annually if its surplus carbon budget is traded. This could be a source of much-needed financing into the sector, particularly for smaller-scale renewable energy, energy efficiency and fuel switching projects that avoid GHG emissions.
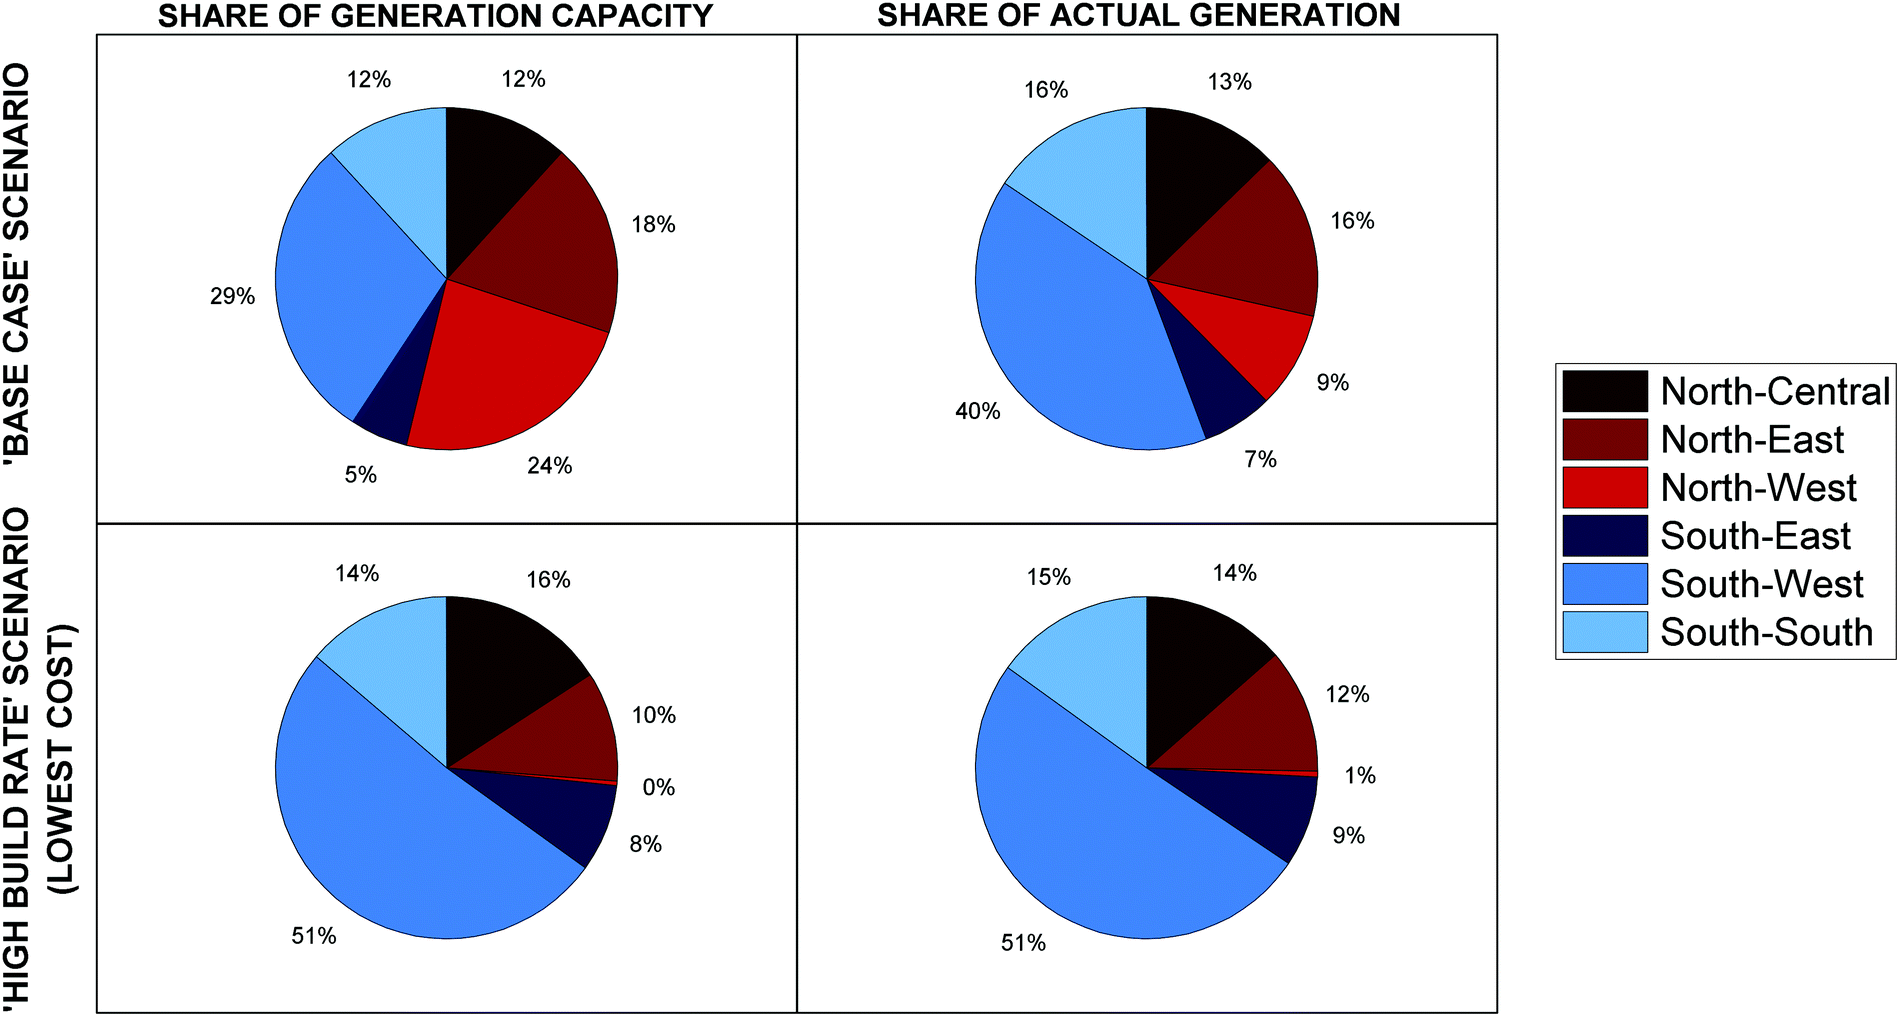 | ||
| Fig. 12 Regional share of power generation capacity and actual generation under base case and lowest-cost NDC scenarios. | ||
The proportionate sharing of political and economic resources between Nigeria's geopolitical zones has been institutionalised to minimise ethnic polarisation.75 Additionally, oil and gas infrastructure, particularly pipelines, have historically been targets for attacks by militants. Consequently, they are viewed as a security risk in a fragile geopolitical landscape.75 Accordingly, a diversified energy system, both geographically and technologically, is more politically-expedient because of the increased (energy) security and better distribution of jobs and investment across the country. Owing to its relative lack of fossil fuel resources, the utilisation of the vast renewable energy resources of the north is the only way to ensure that equitable distribution of investment in the power sector is achieved. Increased energy available could potentially spur economic activity in this region which has the highest poverty levels and lowest internally generated revenue metrics.76
4. Conclusions
Our findings challenge several prevalent views on delivering sustainable energy transitions in sub-Saharan Africa (SSA).First is the widespread notion that climate change mitigation is too costly to pursue in SSA. We find that delivering Nigeria's NDC in the electricity system—both unconditional and conditional—has no discernible effect on the least-cost power system design and electricity dispatch profiles. That is, the cost-optimal system that delivers the Paris Agreement commitment for the power sector is the same as the business-as-usual (BAU) forecast. Therefore, no trade-off exists between climate change mitigation and development (driven by greater energy access and availability) efforts. Additionally, our results highlight that GHG emissions projections for the BAU scenario are well-below the levels required by the unconditional NDC. Thus, Nigeria can pursue even deeper emissions reductions targets in its revised NDCs at no additional cost.
Second is the suggestion that falling costs of intermittent renewable energy technologies (IRES) will allow SSA countries to leapfrog fossil-fuelled development through the deployment of largely decentralised renewable energy systems, and that such systems are the cheapest means of delivering universal energy access in a carbon-constrained world.48,77 In the case of Nigeria, we find that conventional fossil fuel generation is critical to meeting future demand at lowest cost. Furthermore, the deployment of IRES has negligible impact on the amount of fossil generation capacity in the system. The need to rapidly reduce the energy deficit and scale-up electricity supply to drive economic development requires high dispatchability and availability generators in the short-term—currently, fossil fuels, and particularly natural gas, are the least-expensive means to deliver this. Fossil fuel generation requires large, centralised power plants and thus investment in significant transmission infrastructure to balance supply and demand across the country. This suggests that the utilisation of IRES primarily through decentralised energy systems will pose additional costs to the sustainable energy transition in SSA.
Third is the view that IRES are essential to delivering SSA's nationally determined contribution (NDC) to the Paris Agreement.43 In contrast, we find that, for Nigeria, it is possible to deliver the unconditional NDC (20% reduction in GHG emissions relative to BAU) without the deployment of any IRES if power plants can be built twice as fast as has been done historically (1.2 GW per year). Such a system utilises only natural gas, coal and hydro resources to meet all demand in 2050, and costs 9% less than a more diversified NDC-compliant power system which has IRES deployed (despite aggressive cost reduction assumptions). The insight here is not that IRES need not be developed in Nigeria or SSA in the short-term. Rather, it highlights the opportunity for the region's countries to pursue more stringent GHG emissions reduction targets in their revised NDCs which are expected at the next conference of parties to the United Nations Framework Convention on Climate Change (COP26).
It is often thought that IRES add value to a decarbonised electricity system owing to their low (and falling) costs. However, this study finds that, in the case of Nigeria, IRES instead derive their value from their distributed nature. Energy resources in the country are well-distributed with oil and gas fields in the space-constrained south, and majority of renewable energy resources distributed in the larger northern states. We find that the development of diverse energy mix with IRES—albeit more expensive than a system with only fossil fuels and hydro power—will lead to more distributed power system. This finding highlights that, in SSA countries, IRES (particularly solar and wind power) have not experienced cost reductions to the extents seen elsewhere—they remain significantly more expensive than conventional fossil fuel generation, and thus more policy support is required for them to achieve grid parity,‡‡ after which investment and scale-up will be facilitated. Without IRES, our results show that natural gas will have to be relied on to meet majority of electricity supply. Given the concentration of natural gas production, transport and import infrastructure in one region of the country, power plants are also geographically concentrated which raises issues of pollution and equity, as investments and jobs are not distributed nationwide. In a fragile political landscape such as Nigeria's which has institutionalised the equitable sharing of economic resources across regions to prevent conflict, the development and deployment of IRES are the only means to achieve this in the energy sector.
Finally, the core of power sector reform proposals is the liberalisation of the entire power value chain (generation, transmission and distribution) so that private capital can drive sectoral development. This study finds that the development of a cost-optimal power system in Nigeria will require the deployment of power transmission infrastructure that will be underutilised in the short-term. Additionally, the marginal cost of electricity in a system that guarantees universal energy access is significantly higher than the electricity tariffs currently set by the sector's regulator. These issues are likely to continue to discourage investment in generation and transmission infrastructure. The realisation of a cost-reflective tariff regime presents challenges because of dire economic situation in the country which contributes to fuel poverty and the non-payment of electricity bills. Thus, government intervention may remain necessary to maintain liquidity and operation in the sector, and reforms should accommodate such a scenario. Rather than being reactionary—that is, used to bailout cash-strapped DisCos or to cover payment arrears to GenCos—government subsidies and international development assistance (grants, concessionary loans, etc.) can be made proactive by channelling them into the development of infrastructure critical for a cleaner power system. Many countries have implemented policies that incentivise investment low-carbon technologies (subsidies, investment grants, tax breaks) and disincentivise fossil fuel use (carbon taxes, improved energy efficiency standards). We find that subsidising low-carbon electricity generation (to reduce capital costs) encourages the deployment of IRES. Penalising GHG emissions however does not reduce fossil fuel use in the sector, instead it only increases system costs. Additionally, the expansion of transmission network which may not be commercially viable in the short-term but critical in the longer-term appears to offer better value for money. This is an important consideration in the design of policies to advance the sustainable energy transition in SSA.
We conclude by proposing directions for future research. This study has only considered the costs of power generation and transmission. Consideration of the social costs and benefits of technologies including air pollution, health costs and employment opportunities, will better reflect their potential value to the sustainable energy transition and economic development. A multi-objective optimisation that does not solely prioritise investment costs is important to how the trade-offs between different objectives (economic costs, job creation and distribution, pollution control). These insights can be investigated by coupling the energy systems planning tools with economic impact models such as the NREL Jobs and Economic Development Impact (JEDI) model.79,80 This analysis is beyond the scope of this paper and the power systems planning tool employed, but further research is necessary to develop valuable insights for policymakers in sub-Saharan Africa.
Author contributions
H. A. D. and N. M. conceptualised the presented idea and developed the methodology for the analysis conducted. H. A. D. carried out the data curation, formal analysis, validation, writing (original draft), and writing (review and editing) of the work. N. M. D. supervised the analysis.Conflicts of interest
There are no conflicts to declare.Acknowledgements
We thank the Natural Environment Research Council Science and Solutions for a Changing Planet Doctoral Training Programme (SSCP DTP) for the funding of a PhD scholarship.Notes and references
- IPCC, Climate Change 2014, Mitigation of Climate Change. Contribution of Working Group III to the Fifth Assessment Report of the Intergovernmental Panel on Climate Change, Cambridge University Press, Cambridge, UK and New York, NY, USA, 2014.
- IPCC, Climate Change 2014, Impacts, Adaptation, and Vulnerability. Part A: Global and Sectoral Aspects. Contribution of Working Group II to the Fifth Assessment Report of the Intergovernmental Panel on Climate Change, Cambridge University Press, Cambridge, UK and New York, NY, USA, 2014.
- A. Dalfelt, Climate change and Sub-Saharan Africa: Issues and opportunities, Africa Region Findings & Good Practice Info-briefs; No. 120. World Bank, Washington, DC©World Bank, 1998, Available at: http://hdl.handle.net/10986/9882.
- L. Connolly-Boutin and B. Smit, Reg. Environ. Change, 2015, 16, 385–399 Search PubMed.
- A. Kumssa, A. C. Mosha, I. M. Mbeche and E. H. N. Njeru, Handbook of Climate Change Adaptation, Springer, Berlin, Heidelberg, 2015, pp. 215–226 Search PubMed.
- World Bank, World Bank Open Data: Free and open access to global development data, 2019, Available at: https://data.worldbank.org/. Accessed on 26/09/2019.
- United Nations, Department of Economic and Social Affairs, Population Division, World Population Prospects 2019, Volume II: Demographic Profiles (ST/ESA/SER.A/427), 2019, Available at: https://tinyurl.com/uxul8hc.
- A. R. Mustapha, Ethnic Structure, Inequality and Governance of the Public Sector in Nigeria, Centre for Research on Inequality, Human Security and Ethnicity, Working Paper No. 18, 2005, Available at: https://tinyurl.com/r6zhw82.
- A. Sayne, Climate Change Adaptation and Conflict in Nigeria, Washington DC, USA: United States institute of Peace, 2011, Available at: https://tinyurl.com/ybkls2ew.
- International Crisis Group, Herders Against Farmers: Nigeria's Expanding Deadly Conflict, Africa Report No. 252. Brussels, Belgium, 2017, Available at: https://tinyurl.com/ychwqgl4.
- C. S. Hendrix and S. M. Glaser, Political Geogr., 2007, 26, 695–715 Search PubMed.
- C. Devitt and R. S. Tol, J. Peace Res., 2012, 49, 129–145 Search PubMed.
- O. Serdeczny, S. Adams, F. Baarsch, D. Coumou, A. Robinson, W. Hare, M. Schaeffer, M. Perrette and J. Reinhardt, Reg. Environ. Change, 2016, 17, 1585–1600 Search PubMed.
- United Nations, Status of Treaties: Chapter XXVII: Paris Agreement, United Nations Treaty Collection, 2021, Available at: https://tinyurl.com/xdesadf2.
- UNDP Regional Bureau for Africa, Primary Commodity Booms and Busts: Emerging Lessons from sub-Saharan Africa, United Nations Development Programme. New York, USA, 2016, Available at: https://tinyurl.com/4v6rfee5.
- African Development Bank, Gap Analysis Report: African Nationally Determined Contributions (NDCs), 2018, Available at: https://tinyurl.com/923bcmrf.
- African Development Bank, Roadmap and Work Program: African Nationally Determined Contributions (NDCs) Hub, 2018, Available at: https://tinyurl.com/3ftp983k.
- United Nations Framework Convention on Climate Change, NDC Registry (interim), 2021, Available at: https://tinyurl.com/fkh7ysmn.
- A. N. R. Sy, W. Simbanegavi and N. Ndung’u, J. Afr. Econ., 2019, 28, i4–i15 Search PubMed.
- H. Gujba, S. Thorne, Y. Mulugetta, K. Rai and Y. Sokona, Energy Policy, 2012, 47, 71–78 Search PubMed.
- P. Collier and A. J. Venables, Energy Econ., 2012, 34, S75–S84 Search PubMed.
- C. Breyer, D. Bogdanov, A. Aghahosseini, A. Gulagi, M. Child, A. S. Oyewo, J. Farfan, K. Sadovskaia and P. Vainikka, Prog. Photovoltaics, 2017, 26, 505–523 Search PubMed.
- M. Leimbach, N. Roming, A. Schultes and G. Schwerhoff, Ecol. Econ., 2018, 144, 148–159 Search PubMed.
- C. F. Heuberger, P. K. Bains and N. Mac Dowell, Appl. Energy, 2020, 257, 113715 Search PubMed.
- K. Ley, J. Gaines and A. Ghatikar, The Nigerian Energy Sector: An Overview with a Special Emphasis on Renewable Energy, Energy Efficiency and Rural Electrification (2nd edition), Published by: Deutsche Gesellschaft für Internationale Zusammenarbeit (GIZ) GmbH, 2015, Available at: https://tinyurl.com/ds6wj4m7. Accessed on 24/12/2019.
- S. Burns and O. Owen, Nigeria: No longer an oil state? 2019, Available at: https://tinyurl.com/ua6ouy9. Accessed on 21/01/2020.
- A. Bhattacharya, R. Calland, A. Averchenkova, L. González, L. Martinez-Diaz and J. van Rooij, Delivering on the $100 Billion Climate Finance Commitment and Transforming Climate Finance, Independent Expert Group on Climate Finance. United Nations. New York, USA, 2020, Available at: https://tinyurl.com/jdad3nmk.
- Federal Government of Nigeria, Federal Republic of Nigeria Power Sector Recovery Program: 2017–2021, 2017, Available at: https://tinyurl.com/uotwmdo.
- N. V. Emodi and N. E. Ebele, Sustainable Energy, 2016, 4, 7–16 Search PubMed.
- D. Kukoyi, 2015 Africa Energy Yearbook, 2015, 75–79.
- Fichtner Consulting Engineers Ltd, Transmission Expansion Plan: Development of Power System Master Plan for the Transmission Company of Nigeria, Nigeria Electricity and Gas Improvement Project. Report No. 8328P01/FICHT-19809639-v1, 2017, Available at: https://tinyurl.com/wheg5k6.
- Advisory Power Team and Power Africa, Nigeria Power Baseline Report, Office of the Vice President, Federal Government of Nigeria, 2015, Available at: https://tinyurl.com/toovdvm.
- Federal Republic of Nigeria, Roadmap for Power Sector Reform: Revision I, 2013, Available at: https://tinyurl.com/y4zojywe.
- Transmission Company of Nigeria, Grid Map for Existing Transmission and Generation Network, 2016, Available at: https://tinyurl.com/t8u5d7z. Accessed on 27/01/2020.
- A. O. Ibe and E. K. Okedu, Asia Pac. J. Sci. Technol., 2009, 10, 486–490 Search PubMed.
- A. S. Aliyu, A. T. Ramli and M. A. Saleh, Energy, 2013, 61, 354–367 Search PubMed.
- F. Adeniyi, Overcoming the Market Constraints to On-Grid Renewable Energy Investments in Nigeria, Oxford Institute of Energy Studies Paper: EL 37, 2019, Available at: https://tinyurl.com/y9se4oxe.
- C. Okafor, Nigeria: Senate, NERC Differ on Electricity Tariff Hike, Bailout for Operators, This Day, 2017, Available at: https://tinyurl.com/tjdvejh.
- PwC Nigeria, Nigeria Economic Outlook: Top 10 themes for 2019, 2019, Available at: https://tinyurl.com/y6lcg7zw.
- V. N. Emodi, S. D. Yusuf and K.-J. Boo, Smart Grid Renewable Energy, 2014, 05, 259–274 Search PubMed.
- A. Abuh, Reps order suspension of increase in electricity tariff, The Guardian, 2020, Available at: https://tinyurl.com/u5wh54h. Accessed on 30/01/2020.
- C. G. Heaps, LEAP: The Low Emissions Analysis Platform. [Software version: 2020.1.11], Stockholm Environment Institute, Somerville, MA, USA, 2020, Available at: https://leap.sei.org Search PubMed.
- Federal Republic of Nigeria, Nigeria's Intended Nationally Determined Contribution, 2017, Available at: https://tinyurl.com/v2nktlo. Accessed on 24/12/2019.
- Ministry of Power, Federal Republic of Nigeria, National Renewable Energy and Energy Efficiency Policy (NREEEP), 2015, Available at: https://tinyurl.com/tydrlob.
- Climate Watch, Historical GHG Emissions, 2018, Washington, DC: World Resources Institute. Available at: https://www.climatewatchdata.org.
- O. I. Ogunsola, Fuel Sci. Technol. Int., 1991, 9, 1211–1222 Search PubMed.
- K. Manohar and A. A. Adeyanju, J. Eng. Appl. Sci., 2009, 4, 68–73 Search PubMed.
- IRENA, Planning and prospects for renewable power: West Africa, 2018, International Renewable Energy Agency, Abu Dhabi. Available at: https://tinyurl.com/w5q536y/.
- British Petroleum Company, BP Statistical Review of World Energy: 68th edition, British Petroleum Co., London, 2019. Available at: http://www.bp.com/statisticalreview.
- C. F. Heuberger, I. Staffell, N. Shah and N. Mac Dowell, Comput. Chem. Eng., 2017, 107, 247–256 Search PubMed.
- M. M. Rienecker, M. J. Suarez, R. Gelaro, R. Todling, J. Bacmeister, E. Liu, M. G. Bosilovich, S. D. Schubert, L. Takacs, G.-K. Kim, S. Bloom, J. Chen, D. Collins, A. Conaty, A. da Silva, W. Gu, J. Joiner, R. D. Koster, R. Lucchesi, A. Molod, T. Owens, S. Pawson, P. Pegion, C. R. Redder, R. Re-ichle, F. R. Robertson, A. G. Ruddick, M. Sienkiewicz and J. Woollen, J. Clim., 2011, 24, 3624–3648 Search PubMed.
- R. Müller, U. Pfeifroth, C. Träger-Chatterjee, J. Trentmannand and R. Cremer, Remote Sens., 2015, 7, 8067–8101 Search PubMed.
- R. Müller, U. Pfeifroth, C. Träger-Chatterjee, R. Cremer, J. Trentmann and R. Hollmann, Surface Solar Radiation Data Set – Heliosat (SARAH) – Edition 1, EUMETSAT Satellite Application Facility on Climate Monitoring (CM SAF), 2015.
- S. Pfenninger and I. Staffell, Renewables ninja, 2016, https://www.renewables.ninja/.
- I. Staffell and S. Pfenninger, Energy, 2016, 114, 1224–1239 Search PubMed.
- International Energy Agency, World Energy Outlook 2018, 2018, Available at: https://tinyurl.com/yaexrzp3.
- C. Pozo, Á. Galán-Martín, D. M. Reiner, N. M. Dowell and G. Guillén-Gosálbez, Nat. Clim. Change, 2020, 10, 640–646 Search PubMed.
- Federal Ministry of Power, Works and Housing, Federal Republic of Nigeria, Rural Electrification Strategy and Implementation Plan (RESIP), 2016, Available at: https://tinyurl.com/tdtyj6t.
- BloombergNEF, Climatescope 2019: Policies, 2019, Available at: https://tinyurl.com/tv6ctqp. Accessed on 12/04/2020.
- P. C. Akanonu, Climate Policy and Finance: Designing an Effective Carbon Pricing System for Nigeria's Oil and Gas Sector, 2017, CSEA Working Paper DPS/17/02. Available at: https://tinyurl.com/yxyzd6l2.
- K. Ricke, L. Drouet, K. Caldeira and M. Tavoni, Nat. Clim. Change, 2018, 8, 895–900 Search PubMed.
- F. Asu, Tackle subsidies, privatise power transmission, NESG tells FG, 2020, Available at: https://tinyurl.com/qsprd8v. Accessed on 14/04/2020.
- Central Bank of Nigeria, The Nigeria Single Window Trade Portal: Search for Rates, 2020, Available at: https://tinyurl.com/vvwa7uh. Accessed on 09/04/2020.
- PwC Nigeria, Solving the Liquidity Crunch in the Nigerian Power Sector. White Paper presented at Power Sector Roundtable Conference hosted by Mainstream Energy Solutions Limited on September 24, 2019 at Kainji Dam Hydropower Plant, Niger State, 2019, Available at: https://tinyurl.com/ua3pf65.
- Nigerian Electricity Regulatory Commission, MYTO-2015 Distribution Tariffs (2015–2024). Effective 1st February 2016, 2015, Available at: https://tinyurl.com/rbo4znj.
- Ministry of Petroleum Resources, Federal Republic of Nigeria, National Gas Policy, 2017, Available at: https://tinyurl.com/s73z84q.
- J. Ehanmo and E. Onwuegbule, Bridging the Metering Gap- Strategies for Success (Part 1), Pricewaterhouse Coopers Limited, 2018. Available at: https://tinyurl.com/y5h8cvey.
- R. Abajuo, SSRN Electron. J., 2018, 1–8 Search PubMed.
- Organisation of Petroleum Exporting Countries, Nigeria facts and figures, 2018, Available at: https://tinyurl.com/yxsax3tv. Accessed on 14/04/2020.
- D. Santley, R. Schlotterer and A. Eberhard, Harnessing African Natural Gas: A New Opportunity for Africa's Energy Agenda?, World Bank, Washington, DC, 2014, Available at: https://tinyurl.com/y52n38mp Search PubMed.
- K. Hamrick and M. Gallant, Unlocking Potential: State of the Voluntary Carbon Markets 2017, 2017, Available at: https://tinyurl.com/y7odpd4b.
- Google Inc, Google's Carbon Offsets: Collaboration and Due Diligence, 2011, White Paper. Available at: https://tinyurl.com/v52gg6z.
- K. Hamrick and M. Gallant, Voluntary Carbon Markets Out- looks and Trends: January to March 2018, 2018, Available at: https://tinyurl.com/sf678yt.
- S. Donofrio, P. Maguire, W. Merry and S. Zwick, Financing Emissions Reductions for the Future: State of the Voluntary Carbon Markets 2019, Ecosystem Marketplace: A Forest Trends Initiative, 2019, Available at: https://tinyurl.com/v7mz7nz.
- N. Cheeseman, E. Bertrand and S. Husaini, A Dictionary of African Politics, Oxford University Press, 1st edn, 2019 Search PubMed.
- BudgIT, State of States: The 2019 Edition, 2019, Available at: https://tinyurl.com/yahj7e2r.
- IRENA, Global energy transformation: A roadmap to 2050 (2019 edition), 2019, International Renewable Energy Agency, Abu Dhabi. Available at: https://tinyurl.com/y2edlss7.
- A. Olson and R. Jones, Electr. J., 2012, 25, 17–27 Search PubMed.
- National Renewable Energy Laboratory (NREL), JEDI: Jobs & Economic Development Impact Models, 2020, Golden, CO (US). Available at: https://tinyurl.com/yauqeod8.
- P. Patrizio, Y. W. Pratama and N. M. Dowell, Joule, 2020, 4, 1700–1713 Search PubMed.
Footnotes |
| † Electronic supplementary information (ESI) available. See DOI: 10.1039/d1ee00746g |
| ‡ Sub-Saharan Africa consists of 48 countries: Angola, Benin, Botswana, Burkina Faso, Burundi, Cabo Verde, Cameroon, Central African Republic, Chad, Comoros, Côte d'Ivoire, Democratic Republic of the Congo, Equatorial Guinea, Eritrea, Eswatini, Ethiopia, Gabon, the Gambia, Ghana, Guinea, Guinea-Bissau, Kenya, Lesotho, Liberia, Madagascar, Malawi, Mali, Mauritania, Mauritius, Mozambique, Namibia, Niger, Nigeria, Republic of Congo, Rwanda, Sao Tome and Principe, Senegal, Seychelles, Sierra Leone, Somalia, South Africa, South Sudan, Sudan, Tanzania, Togo, Uganda, Zambia, and Zimbabwe. |
| § Gross domestic product is the total monetary or market value of all the finished goods and services produced within a country's borders in a year. |
| ¶ Typically, a lower discount rate (1–3%) is used for developed countries. However, higher discount rates are used when there is a greater level of risk/uncertainty associated with an investment and its future cash flows, such as in Nigeria. |
| || The inability of DisCos to receive complete payments from consumers for the electricity service they provide means that they cannot pay GenCos for the electricity generated. Similarly, GenCos (principally gas-fired power plants) cannot pay gas suppliers, thereby creating a liquidity crisis across the power value chain. |
| ** Customers had previously paid for meters through the fixed charge component of their energy bills. |
| †† The LNG netback price is the delivered liquefied natural gas (LNG) price in the destination market less the costs of liquefaction and shipping.70 |
| ‡‡ Grid parity occurs when the levelised cost of electricity (LCOE) from IRES is less than or equal to the LCOE from conventional fossil fuel generators.78 |
| This journal is © The Royal Society of Chemistry 2021 |