Foldable potassium-ion batteries enabled by free-standing and flexible SnS2@C nanofibers†
Deping
Li‡
 *a,
Linna
Dai‡
b,
Xiaohua
Ren
c,
Fengjun
Ji
a,
Qing
Sun
b,
Yamin
Zhang
b and
Lijie
Ci
 *ab
*ab
aState Key Laboratory of Advanced Welding and Joining, School of Materials Science and Engineering, Harbin Institute of Technology, Shenzhen, 518055, China. E-mail: lideping@hit.edu.cn; cilijie@hit.edu.cn
bResearch Center for Carbon Nanomaterials, Key Laboratory for Liquid–Solid Structural Evolution & Processing of Materials (Ministry of Education), School of Materials Science and Engineering, Shandong University, Jinan, 250061, China
cSchool of Water Conservancy and Environment, University of Jinan, Jinan 250022, China
First published on 23rd November 2020
Abstract
Potassium-ion batteries (PIBs) have been regarded as promising alternatives to lithium-ion batteries in large-scale energy storage systems owing to the high abundance and low cost of potassium. However, the large radius of the K-ion hinders the development of suitable electrode materials. In this work, we confine SnS2 in N,S co-doped carbon nanofibers as anode materials for PIBs with high reversible capacity (457.4 mA h g−1@0.05 A g−1), remarkable cycling stability (1000 cycles@2.0 A g−1), and superior rate capability (219.4 mA h g−1@5.0 A g−1), overmatching most of the reported studies. The origin of the high reversible capacity is revealed by in situ XRD techniques. The combined capacitive and diffusion-controlled behaviors are disentangled through consecutive CV measurements. Combining the Randles–Sevcik equation and dQ/dV plots, correlations between the K-ion storage behaviors and diffusion kinetics at various potassiation depths are constructed. Theoretical calculations on K adsorption affinities at various N,S co-doped sites illuminate the synergistic effects of the N,S co-doping strategy in boosting the K-ion transport kinetics. Moreover, foldable potassium-ion full cells are successfully assembled with stable cycling performance, showing application potential in flexible electronic devices. These findings will boost the rational design and mechanistic understanding of anode materials in PIBs and related energy storage devices.
Broader contextPotassium ion batteries (PIBs), with merits like high earth abundance of potassium resources and low cost, are emerging as promising alternatives to state-of-the-art lithium ion batteries. However, the large radius of K ions draws concerns over the structural stability and electrochemical kinetics, thus hindering the development of suitable electrode materials. In this respect, we report free-standing and binder-free SnS2@C-x nanofibers combining the high theoretical capacity virtue of SnS2 and the intrinsically high electronic conductivity of the hierarchically porous carbon matrix. Experimentally, the as-prepared SnS2@C-x electrode delivers high reversible capacity, superior rate capability and remarkable cycling stability. Theoretically, the origin of the enhanced kinetics and structural stability is insightfully demonstrated. With an eye to the practical prospects, foldable potassium-ion full cells are successfully assembled which can work in various deformed states, showing application potential in flexible electronic devices. These findings will boost the rational design and mechanistic understanding of electrode materials in PIBs and related energy storage devices. |
1. Introduction
In the past three decades, lithium-ion batteries (LIBs) have been widely applied in portable electronics.1 However, limited by the low crustal abundance (∼20 ppm), uneven distribution (70% in South America) and high price of lithium, LIBs cannot meet the ever-increasing demands in large-scale energy storage devices like electric vehicles and smart grids.2–5 Recently, potassium-ion batteries (PIBs) are emerging as promising alternatives to LIBs owing to the high earth abundance (∼15![[thin space (1/6-em)]](https://www.rsc.org/images/entities/char_2009.gif) 000 ppm), high availability, low price, and similar “rocking chair” working mechanism. Besides, the redox potential of K/K+ (vs. SHE) is −2.93 V, higher than that of Na/Na+ (−2.71 V) and close to Li/Li+ (−3.04 V), ensuring a high theoretical energy density of PIBs.5–9 Moreover, the weaker Lewis acidity of K ions (vs. Li-ions) correlated with the smaller Stokes radius can enable a faster K-ion diffusion rate in the electrolyte and consume less energy during the desolvation process at the electrolyte/electrode interface.10
000 ppm), high availability, low price, and similar “rocking chair” working mechanism. Besides, the redox potential of K/K+ (vs. SHE) is −2.93 V, higher than that of Na/Na+ (−2.71 V) and close to Li/Li+ (−3.04 V), ensuring a high theoretical energy density of PIBs.5–9 Moreover, the weaker Lewis acidity of K ions (vs. Li-ions) correlated with the smaller Stokes radius can enable a faster K-ion diffusion rate in the electrolyte and consume less energy during the desolvation process at the electrolyte/electrode interface.10
Despite the high K-ion mobility in the electrolyte, the larger radius of K ions (1.38 Å, 81% higher than Li-ions) hinders their further diffusion in solids, which therefore leads to poor rate performance and low reversibility.11,12 Besides, during cycling, the repeat insertion/extraction of large radius K ions will induce severe volume changes. Taking graphite as an example, the volume expansion in LIBs is merely ∼10%, while it suffers a ∼61% volume change after potassiation.7 The volume variation in alloying-type electrodes is even worse, such as antimony (Sb) undergoes a ∼407% volume change by forming potassiated K3Sb alloy.13 Such huge volume variation causes fast capacity fading, structural deformation, and poor rate capability. Hence, it's crucial to explore suitable electrode materials or conceive effective nanostructures.
Since graphite was first reported as a feasible anode of PIBs,14 researchers have made great efforts in designing better electrode materials.7,15–17 Among the reported carbon-based (graphite/graphitic carbon,14,18–21 hard carbon22–26 and soft carbon27,28), intercalation-type (MoS2,29,30 MoSSe,31 MoSe2,32–34 and KTiOPO435–37), conversion-type (FeS2,38,39 V3S4,40,41 V5S8,42 and Co9S843), alloying-type (Sb,44,45 P,46–48 Sb2Se3,49,50 SnS2,51,52 and Sn4P353–55), and organic (PyBT,56 ADAPTS,57 and Vitamin K58) electrode materials of PIBs, conversion and alloying-type materials are attracting enormous attention owing to their high theoretical capacities.59–61 Typically, SnS2 with a layered structure and a large interlayer spacing (0.59 nm, 76% larger than graphite), possessing broad pathways for fast K-ion diffusion, is a promising candidate for PIBs.51,52 Besides, SnS2 can deliver a high theoretical capacity of 1311 mA h g−1 in LIBs by sequential conversion and alloying reactions, exhibiting high-energy-density potential in PIBs.62 Moreover, compared with metal oxides like SnO2,63 the relatively weaker Sn–S bonding will further boost the kinetics of the conversion process.64
Unfortunately, owing to the large radius of K ions and inherently low electronic conductivity, the bare SnS2 material cannot fully release its high capacity.65 Confronted with the above issues, some researchers introduced graphene to promote the electronic conductivity and moderate the volume change, and enhanced K-ion storage performances are achieved in SnS2–graphene composite electrodes.51,52,66–68 However, the development of SnS2-based electrodes of PIBs is still in the preliminary stage and there still exist many unsolved key issues: (i) The electrochemical performance was still unsatisfactory, especially the limited cycling performance (less than 500 cycles) and moderate rate capability (<1.0 A g−1). (ii) The phase evolution of SnS2, K-ion diffusion kinetics and K-ion storage behaviors at various potassiation depths are still relatively ambiguous. (iii) Carbonaceous materials are widely applied to stabilize the SnS2 electrode; however, during the sulfuration process, the S element can be simultaneously incorporated into the carbon matrix as dopants. S-doping has a significant effect on the K affinity on the carbon surface with varied diffusion kinetics, which has been neglected in previous studies. (iv) The reported SnS2-based electrodes are mostly prepared through the conventional slurry-coating method with an insulative binder as an additive, which deteriorates the electronic conductivity and K-ion diffusion kinetics. Therefore, to excavate the full potential and grasp deep understanding of SnS2-based electrodes, designing a more effective structure and employing advanced/novel techniques are quite necessary.
Herein, we fabricated the first foldable PIBs with flexible and binder-free SnS2@C-2 nanofibers by the electrospinning process. By adjusting the ratio of SnS2, we realized a uniform distribution of SnS2 and nanosized thickness control of the SnS2@C-x nanofibers (280–1470 nm). The as-spun SnS2@C-2 nanofibers exhibit high reversible capacity (457.4 mA h g−1@0.05 A g−1), remarkable cycling stability (∼1000 cycles@2.0 A g−1), and superior rate capability (219.4 mA h g−1@5.0 A g−1). Intrigued by the excellent K-ion storage capability, in situ XRD techniques were applied and the origin of the high reversible capacity was illuminated. Consecutive CV measurements were also conducted to decipher the combined K-ion storage behaviors at various states of charge (SOCs). Combining the Randles–Sevcik equation and dQ/dV plots, we establish the correlation between the K-ion storage behaviors and diffusion kinetics at various potassiation depths. Moreover, we performed theoretical calculations of the K adsorption affinities on various N doped and N,S co-doped sites, which sheds more light on the intrinsic mechanism of the boosted K-ion diffusion rate and K-ion adsorption behavior. Therefore, this work provides not merely an effective strategy for designing conversion/alloying-type electrode materials, but also insightful understanding of the correlations between the K-ion storage behaviors and kinetics.
2. Results and discussion
2.1 Morphological and structural characterization
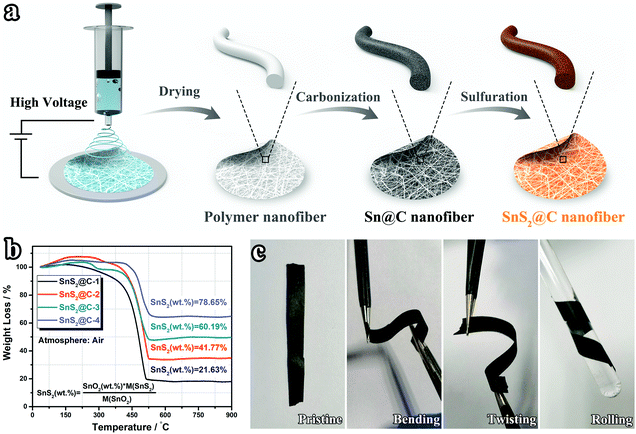
Fig. 1a illustrates the synthetic process of SnS2@C-x nanofibers. After the electrospinning process, a white Sn-containing polymer membrane is obtained (Fig. S1a, ESI†). Following sequential pre-oxidation, carbonization, and sulfuration treatments, the binder-free and flexible SnS2@C-x nanofibers can be obtained (Fig. S1b, ESI†). By adjusting the amount of SnCl2·2H2O, the mass ratio of SnS2 is precisely tuned from 21.63 wt% to 78.65 wt% (Fig. 1b). As expected, the binder-free SnS2@C-2 nanofibers exhibit excellent flexibility in deformation tests like bending, twisting, and rolling (Fig. 1c).The morphological evolution of the SnS2@C-x nanofibers was tracked by SEM characterization. As depicted in Fig. S2 (ESI†), with an increasing amount of tin salt, the Sn@C-x nanofibers tend to be thicker and rougher. Especially, there exist swelling humps on the surface of the Sn@C-4 nanofiber, indicating the aggregation of Sn particles. After the sulfuration treatment, the SnS2@C-1 and SnS2@C-2 nanofibers can still maintain relatively smooth surfaces, while aggregated SnS2 particles exist in the SnS2@C-3 and SnS2@C-4 nanofibers (Fig. 2a–l). To gain a statistical understanding of the morphological evolution, the diameters of the SnS2@C-x nanofibers are also calculated by averaging 50 counts. As exhibited in Fig. 2m–p, the SnS2@C-1 and SnS2@C-2 nanofibers show similar diameters of 280 nm and 330 nm, while the diameters of the SnS2@C-3 and SnS2@C-4 nanofibers are calculated to be 500 nm and 1470 nm, which are 1.8 and 5.3 times that of SnS2@C-1, respectively. Theoretically speaking, a thicker diameter indicates a longer diffusion distance for K ions, which will decelerate the K-ion transport, resulting in low specific capacity and poor rate capability. Simultaneously, K ions can also be trapped in the deep interior of a thick nanofiber, leading to relatively low coulombic efficiencies and poor reversibility.
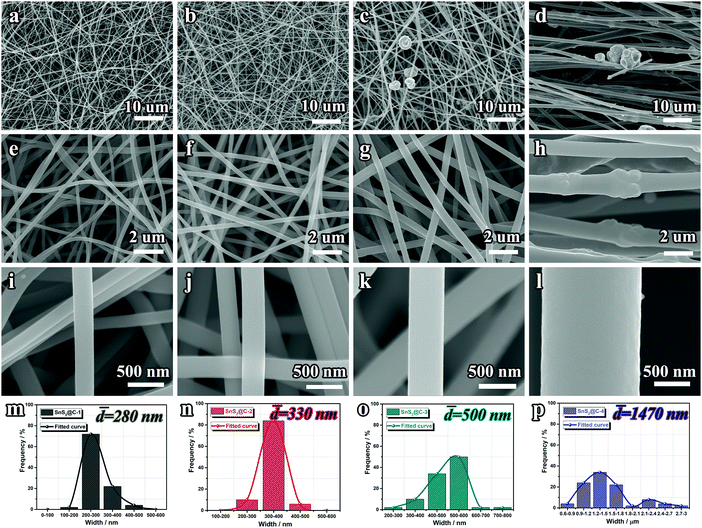 | ||
| Fig. 2 SEM images and fiber width distributions of SnS2@C-x nanofibers. (a, e, i and m) SnS2@C-1, (b, f, j and n) SnS2@C-2, (c, g, k and o) SnS2@C-3 and (d, h, l and p) SnS2@C-4. | ||
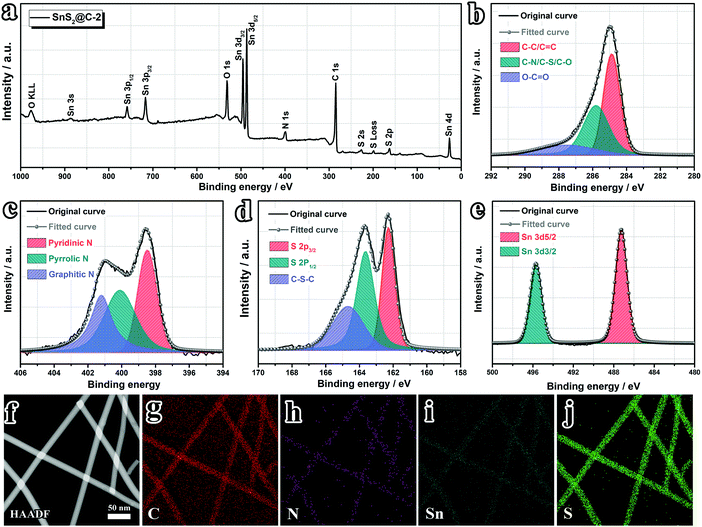
The elemental uniformity of the SnS2@C-x nanofibers is also evaluated. As shown in Fig. S3 (ESI†), all SnS2@C-x nanofibers exhibit homogeneous distributions of C, N, Sn and S elements, indicating successful and uniform incorporation of SnS2 into N,S co-doped carbon nanofibers. Furthermore, the valence states and electronic structure of the evenly distributed elements are revealed by XPS spectra. As displayed in Fig. 3a, the survey spectrum confirms the co-existence of C, N, O, Sn, and S elements. The oxygen should originate from the pre-oxidation process, which is a vital step for strengthening the nanofiber and promoting its flexibility. High-resolution spectra further illuminate the binding states of C, N, S and Sn elements. As shown in Fig. 3b, the C 1s spectrum can be deconvoluted into three peaks centered at 284.9 eV, 285.8 eV and 287.5 eV, corresponding to C–C/C![[double bond, length as m-dash]](https://www.rsc.org/images/entities/char_e001.gif) C, C–N/C–S/C–O, and O–C
C, C–N/C–S/C–O, and O–C![[double bond, length as m-dash]](https://www.rsc.org/images/entities/char_e001.gif) O bonds, respectively, which demonstrates the existence of N and S doped sites on the carbon substrates. The high-resolution N 1s spectrum (Fig. 3c) sheds more light on the binding states of N dopants, which clarifies the co-existence of N-6 (pyridinic-N, 398.5 eV), N-5 (pyrrolic-N, 400.1 eV) and N-Q (graphitic-N, 401.2 eV) configurations. The high-resolution S 2p spectrum (Fig. 3d) confirms the existence of S doped sites (C–S–C, 164.7 eV) and S2− (162.3 eV for S 2p3/2 and 163.6 eV for S 2p1/2). Furthermore, the existence of Sn4+ (487.2 eV for Sn 3d5/2 and 495.7 eV for Sn 3d3/2) is also verified (Fig. 3e).52,53,55,69 To gain a deep understanding of the heteroatom doping structure in the carbon matrix, the HAADF-STEM image is also acquired. As depicted in Fig. 3f–j, apart from the uniform distribution of all elements, we can also discern signal distinctions of Sn and S elements. The relatively weaker Sn signal indicates well confined SnS2 inside the carbon nanofibers, while the S dopants on the surface (C–S–C bonding) can still deliver strong signals.
O bonds, respectively, which demonstrates the existence of N and S doped sites on the carbon substrates. The high-resolution N 1s spectrum (Fig. 3c) sheds more light on the binding states of N dopants, which clarifies the co-existence of N-6 (pyridinic-N, 398.5 eV), N-5 (pyrrolic-N, 400.1 eV) and N-Q (graphitic-N, 401.2 eV) configurations. The high-resolution S 2p spectrum (Fig. 3d) confirms the existence of S doped sites (C–S–C, 164.7 eV) and S2− (162.3 eV for S 2p3/2 and 163.6 eV for S 2p1/2). Furthermore, the existence of Sn4+ (487.2 eV for Sn 3d5/2 and 495.7 eV for Sn 3d3/2) is also verified (Fig. 3e).52,53,55,69 To gain a deep understanding of the heteroatom doping structure in the carbon matrix, the HAADF-STEM image is also acquired. As depicted in Fig. 3f–j, apart from the uniform distribution of all elements, we can also discern signal distinctions of Sn and S elements. The relatively weaker Sn signal indicates well confined SnS2 inside the carbon nanofibers, while the S dopants on the surface (C–S–C bonding) can still deliver strong signals.
The phase evolution of the SnS2@C-x nanofibers is also clarified. As shown in Fig. S4a (ESI†), after the carbonization process, characteristic Sn peaks can be observed (PDF#04-0673). Subsequently, the obtained SnS2@C-x nanofibers show peaks indexed as the berndtite-2T SnS2 phase (PDF#83-1705, Fig. S4b, ESI†). Besides, the broad peak at ∼23° should be ascribed to the (002) peak of carbon, which corresponds to an enlarged interlayer (∼3.86 Å, higher than 3.34 Å of graphite) according to the Bragg equation (2d![[thin space (1/6-em)]](https://www.rsc.org/images/entities/char_2009.gif) sin
sin![[thin space (1/6-em)]](https://www.rsc.org/images/entities/char_2009.gif) θ = nλ). Raman spectra further verify the low graphitization degree (broad peak feature) with ID/IG ratios higher than 1.0, indicating a relatively amorphous structure with abundant accessible pathways for K-ion transport. Specifically, with an increasing amount of SnS2, the signal of the SnS2 A1g vibration is enhanced significantly, which is in accordance with the agglomeration phenomenon described in SnS2@C-3 and SnS2@C-4 nanofibers.52
θ = nλ). Raman spectra further verify the low graphitization degree (broad peak feature) with ID/IG ratios higher than 1.0, indicating a relatively amorphous structure with abundant accessible pathways for K-ion transport. Specifically, with an increasing amount of SnS2, the signal of the SnS2 A1g vibration is enhanced significantly, which is in accordance with the agglomeration phenomenon described in SnS2@C-3 and SnS2@C-4 nanofibers.52
2.2 Electrochemical performance
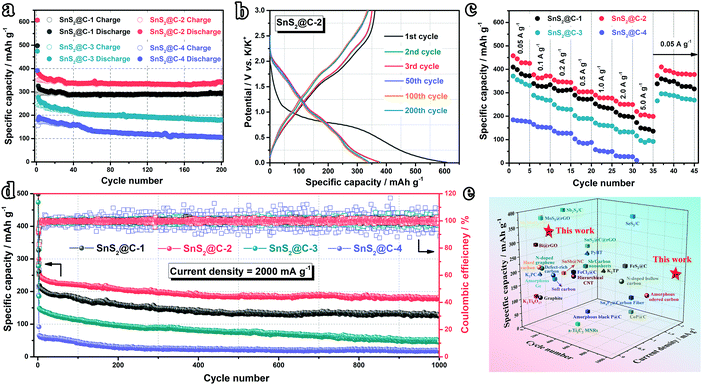
Inspired by the structural uniformity of the SnS2@C-x nanofibers, the K-ion storage performance is firstly evaluated in half cells. As shown in Fig. 4a, after 200 cycles at 100 mA g−1, the SnS2@C-2 electrode maintains the highest reversible capacity of 342.8 mA h g−1, corresponding to a high capacity retention ratio of 96.62% (compared with the 11th cycle). In the meantime, the SnS2@C-1 electrode shows a similar capacity retention ratio of 96.56%, while the reversible capacity is relatively low (292.1 mA h g−1) owing to its lower mass ratio of SnS2. However, the SnS2@C-3 and SnS2@C-4 electrodes can only deliver reversible capacities of 179.9 mA h g−1 and 105.1 mA h g−1, corresponding to low capacity retention ratios of 74.06% and 58.68%, respectively. The cycling stability is further illuminated by the GCD profiles. As plotted in Fig. 4b and Fig. S5 (ESI†), the curves of the SnS2@C-1 and SnS2@C-2 electrodes overlap well from the 2nd cycle, while the curves of the SnS2@C-3 and SnS2@C-4 electrodes are relatively discrete, indicating continuously decreasing capacities. Besides, the initial coulombic efficiency (ICE) can also be extracted from the GCD profiles. The SnS2@C-2 electrode delivers the highest discharge capacity (607.3 mA h g−1) and charge capacity (361.2 mA h g−1) in the initial cycle, corresponding to a relatively high ICE of 59.5%. The SnS2@C-1 electrode shows a similar ICE of 58.0% (289.0/497.9 mA h g−1), while the SnS2@C-3 and SnS2@C-4 electrodes deliver lower ICEs of 52.3% (248.1/473.9 mA h g−1) and 43.1% (168.5/391.3 mA h g−1), respectively. The relative lower ICEs and poorer cycling performance of the SnS2@C-3 and SnS2@C-4 electrodes should be ascribed to the following reasons: (i) The thicker diameter hinders the potassiation process in the interior area, which cannot exert the full potential of the electrode (low reversible capacity). (ii) K ions may be trapped in the deep interior of the electrode materials, leading to the low ICE and poor reversibility. (iii) K-Ion diffusion channels in the porous carbon matrix are blocked by exorbitant loading of SnS2, deteriorating the K-ion transport kinetics.The rate capability is subsequently tested for evaluating the K-ion storage kinetics. As plotted in Fig. 4c and Fig. S6 (ESI†), the SnS2@C-2 electrode exhibits the highest reversible capacities of 457.4, 376.5, 354.2, 319.1, 289.7 and 264.3 mA h g−1 at 50, 100, 200, 500, 1000 and 2000 mA g−1, respectively. Even at a high current density of 5000 mA g−1, a high reversible capacity of 219.4 mA h g−1 can still be maintained (48.0% capacity retention), while the SnS2@C-4 electrode cannot even survive such a high current density. Moreover, when the current density is set back to 50 mA g−1, the SnS2@C-2 electrode can still deliver 409.6 mA h g−1, corresponding to a high capacity retention ratio of 89.5%, which illuminates the superior structural stability of the SnS2@C-2 nanofiber.
Intrigued by the excellent rate capability, the high-rate cycling stability is further evaluated at 2000 mA g−1. As plotted in Fig. 4d, the SnS2@C-2 electrode can still deliver a high capacity of 183.1 mA h g−1 after 1000 cycles, corresponding to a capacity retention ratio of 75.8% (compared with the 11th cycle, merely 0.024% capacity loss per cycle), while the SnS2@C-1, SnS2@C-3 and SnS2@C-4 electrodes can only retain relatively low capacities of 127.1 (61.7%), 47.3 (33.5%) and 17.8 mA h g−1 (29.7%), respectively. Besides, the coulombic efficiencies (CEs) of the SnS2@C-3 and SnS2@C-4 electrodes fluctuate obviously, while the CEs of the SnS2@C-2 electrode remain stable, demonstrating its good electrochemical stability (Fig. S7, ESI†). Moreover, to evaluate the superior K-ion storage capability of our carefully designed SnS2@C-2 electrode, recently reported electrodes of PIBs are summarized in Fig. 4e and Table S1 (ESI†). Our SnS2@C-2 electrode exhibits the best overall electrochemical performance, especially the high reversible capacity and long-term cycling stability.
2.3 Ex situ electrochemical investigations
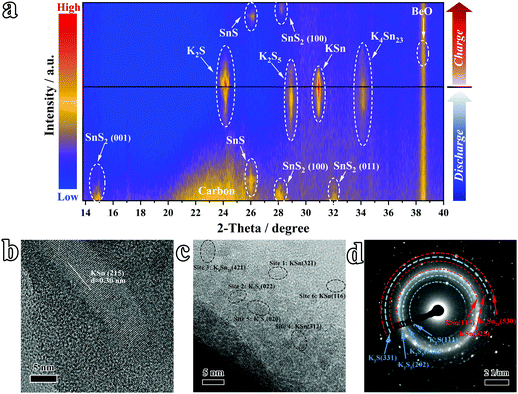
To track the origin of the high reversible capacity of the SnS2@C-2 electrode and illuminate the phase evolution during the potassiation/de-potassiation process, the in situ XRD technique was employed. As plotted in Fig. 5a and Fig. S8 (ESI†), the diffraction peaks of the (001), (100), and (011) planes at 15°, 32.1°, and 41.8° appeared at the initial stage (SnS2 PDF#23-0677). With the insertion of K ions, the peaks of SnS2 get weaker and the SnS phase appears (PDF#39-0354). Subsequently, the K4Sn23 (PDF#04-004-8647) and K2S5 (PDF#89-3999) phases show peaks at ∼28.9° and 34.1°, respectively. As the depossiation process evolves, the peak intensity of the K4Sn23 and K2S5 phases increases obviously, while the KSn phase (PDF#97-010-4614) appears simultaneously. Following K-ion extraction, the signals of KSn alloy including KSn and K4Sn23 become weaker and finally disappear. Simultaneously, K–S compounds including K2S and K2S5 exhibit the same trend. At the fully charged state, peaks of SnS and SnS2 appear again, indicating good reversibility. The HRTEM image (Fig. 5b and c and corresponding magnified pictures in Fig. S9 and S10, ESI†) and SAED (Fig. 5d and Fig. S11, ESI†) further confirm the existence of K–Sn alloy and K–S compounds in the fully potassiated electrode. Therefore, the final product of the potassiation process should be KSn alloy and K2S, based on which the theoretical capacity of SnS2 can be calculated to be ∼733 mA h g−1, which also sheds light on the origin of the high reversible capacity of the SnS2@C-2 electrode.2.4 Kinetic evaluations and theoretical simulations
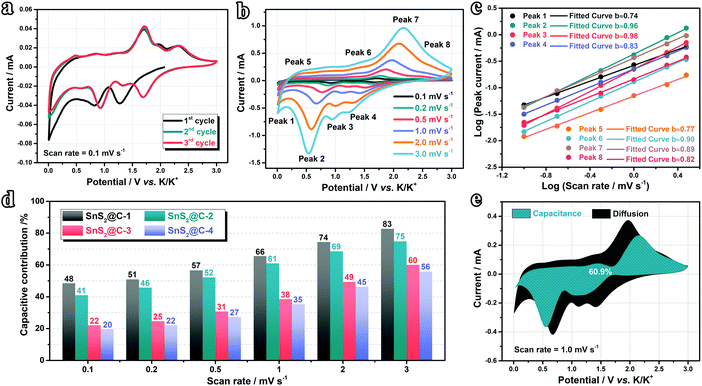
To further elucidate the origin of the excellent rate performance, we designed consecutive CV measurements to evaluate the K-ion storage behaviors and kinetics. As shown in Fig. 6a and Fig. S12a–c (ESI†), the CV curves of all samples overlap well, indicating good stability in the initial cycles. The cathodic peak appears in the initial cycle and disappears subsequently, which should be ascribed to the decomposition of the electrolyte and formation of an SEI (solid electrolyte interface) film. The CV curves at various scan rates are plotted in Fig. 6b and Fig. S12d–f (ESI†). With increasing scan rate, the cathodic peaks shift to a lower potential range while the anodic peaks shift to higher, indicating the existence of combined diffusion-controlled and capacitive behaviors. To disentangle the K-ion storage behaviors, we introduced the following eqn (1) and (2) proposed by Dunn's group:70–72| i = avb | (1) |
log(i) = b![[thin space (1/6-em)]](https://www.rsc.org/images/entities/char_2009.gif) log(v) + log(a) log(v) + log(a) | (2) |
| i = k1v1/2 + k2v | (3) |
 | (4) |
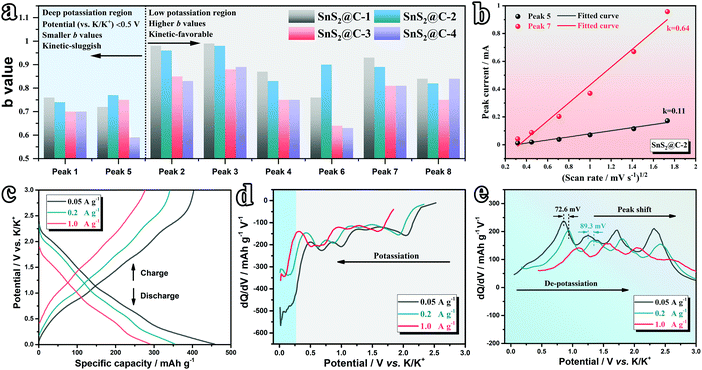
The inherent correlations between the K-ion storage behaviors and kinetics at various potassiation depths are further preliminarily disentangled. As concluded in Fig. 7a, all electrodes exhibit relatively lower b values at potentials below 0.5 V, corresponding to a predominant diffusion-controlled behavior, which is a kinetic-sluggish process, while the higher b values at high potentials indicate faster K-ion transport kinetics. To shed more light on this phenomenon, the solid-state diffusion kinetics of K ions are evaluated by plotting the peak current (Ip) and scan rate (v) according to the following Randles–Sevcik equation:75
| Ip = 2.69 × 10⁵n3/2AD1/2v1/2C0 | (5) |
To have a better understanding of the electrochemical stability of the electrode, dQ/dV curves are plotted at various current densities. The pristine GCD curves are displayed in Fig. 7c and Fig. S14a (ESI†). Apparently, at a relatively high current density (1.0 A g−1), the SnS2@C-4 electrode exhibits severe polarization in view of its deformed GCD curve. The corresponding dQ/dV curves of the discharge process are then plotted in Fig. 7d and Fig. S14b (ESI†). Interestingly, at a relatively low potential (<0.3 V), the curve of the SnS2@C-2 electrode shows slight vibration, while the curve of the SnS2@C-4 electrode fluctuates obviously, which should be attributed to the above-proved sluggish kinetics at low potentials. The above results also demonstrate the better stability of the SnS2@C-2 electrode. As for the dQ/dV curves of the de-potassiation process, we evaluated the potential gap (representing polarization) of the peak shift at various current densities. As depicted in Fig. 7e and Fig. S14c (ESI†), the SnS2@C-2 electrode exhibits obviously smaller potential gaps of ∼72.6 mV and ∼89.3 mV for the selected peaks, while the values for the SnS2@C-4 electrode are measured to be ∼146.6 mV (2.02 times) and 241.5 mV (2.70 times), respectively, which further illuminates the fast and stable K-ion transport in the SnS2@C-2 electrode. Brunauer–Emmett–Teller (BET) measurements are also introduced to support the structural superiority of the SnS2@C-2 electrode. As plotted in Fig. S15a (ESI†), the N2 adsorption–desorption isotherm of SnS2@C-2 nanofibers exhibits a more obvious hysteresis loop, indicating the existence of abundant mesopores. The pore size distribution (PSD) plot further confirms the hierarchically porous structure of SnS2@C-2 nanofibers and more abundant micropores/mesopores than SnS2@C-4 nanofibers (Fig. S15b, ESI†). Furthermore, the pore volumes of micro-, meso- and macro-pores are summarized in Fig. S15c (ESI†). The micropore volume of SnS2@C-2 is 29.4%, higher than that of SnS2@C-4 nanofibers, which contributes to its higher capacitive behavior ratio, while the higher mesopore volume of SnS2@C-2 provides broad and abundant pathways for fast and smooth K-ion transport.
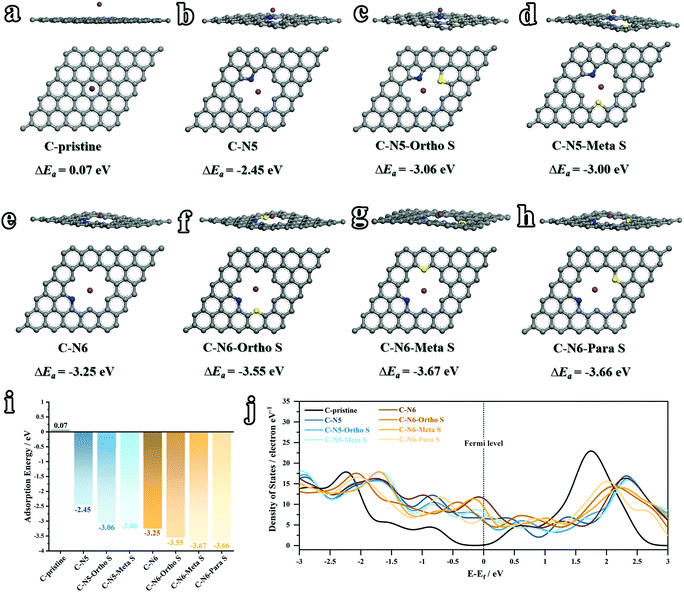
Despite the size effect including the interlayer distance and pore structure, the electronic structure also plays a key role in tuning the K-ion diffusion kinetics. Considering the various nitrogen and sulfur doped sites (Fig. 3), theoretical calculations based on density functional theory (DFT) were conducted to illustrate the correlations between the heteroatom doped sites and K-ion storage capabilities. In this work, the adsorption energies (ΔEa) between K atoms and various doped carbon configurations are simulated. Generally speaking, a higher value of ΔEa indicates a higher K-adsorption affinity. As depicted in Fig. 8a, b and e, three configurations of C-pristine, C–N5 and C–N6 are firstly calculated, among which C–N6 shows the highest ΔEa of −3.25 eV (0.07 eV for C-pristine, and −2.45 eV for C–N5), illuminating boosted K-ion transport kinetics in N-doped sites. The above results are also in the same trend as a previous report.22 As mentioned above, the sulfuration process induces the formation of C–S–C bonding on the surface of the carbon matrix, the effect of which cannot be neglected. Therefore, for the first time, the K-ion adsorption affinities at various N and S co-doped sites (ortho-, meta- and para-position) are carefully investigated. As depicted in Fig. 8c and d, the C–N5–ortho S and C–N5–meta S sites show higher ΔEa (−3.06 eV and −3.00 eV, respectively) than the sole N doped site, demonstrating the superiority of N,S co-doped configurations. Among the three different S positions based on C–N6 (Fig. 8f, g and h), the highest K-adsorption affinity is achieved on the C–N6–meta S (−3.67 eV) site, which further sheds light on the synergistic effect of the N,S co-doping strategy. As concluded in Fig. 8i, the values of ΔEa at various sites can be interpreted as follows: (i) sole N doping can significantly improve the K affinity, and the N-6 site shows a relatively higher K adsorption affinity than the N-5 site; (ii) N,S co-doped sites exhibit a synergistic effect with higher K affinities than the sole N doped site; and (iii) the value of ΔEa varies at various N,S co-doped configurations, which indicates that the relative positions between N and S have a certain effect on the K adsorption affinity. Moreover, the density of states (DOS) of various sites was calculated and summarized in Fig. 8j. Compared with undoped carbons, the heteroatom doped carbons exhibit an increased DOS around the Fermi level, indicating higher electronic conductivity, thus leading to higher K affinity. Therefore, the N,S co-doping strategy can effectively boost the transport kinetics and adsorption of K ions, theoretically demonstrating enhanced K-ion storage capabilities like superior rate capability and predominantly capacitive behavior.
2.5 Evaluation of the practical prospects
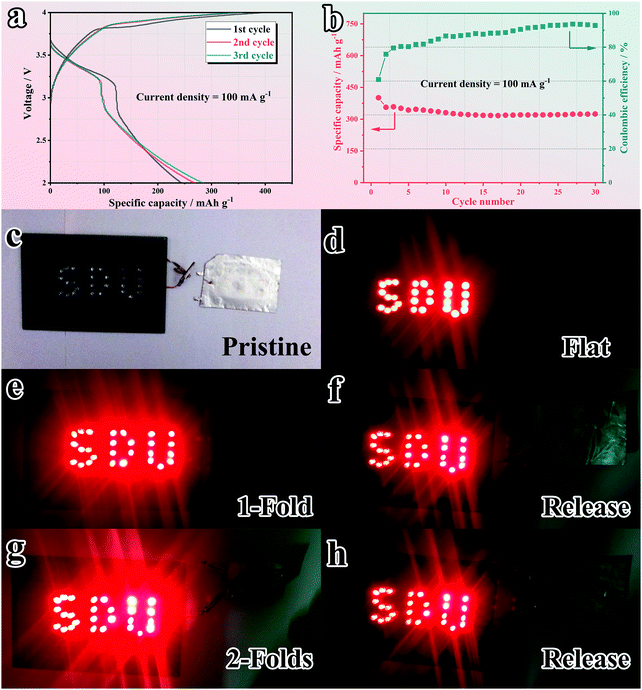
Inspired by the remarkable electrochemical performance of the SnS2@C-2 electrode, full cells were further assembled with Prussian blue (KPB) as the cathode to evaluate the practical prospects. KPB was synthesized according to previously reported work.74 As shown in Fig. S16a–c (ESI†), the XRD pattern and morphology of the as-synthesized KPB are in accordance with reported work.76 When applied in the half cell (Fig. S16d and e, ESI†), the as-synthesized KPB cathode exhibits obvious K-ion insertion/extraction peaks and a relatively high capacity of 82.5 mA h g−1 after 30 cycles at 0.1 A g−1 (88.7% capacity retention ratio compared with the 2nd cycle). However, as plotted in Fig. S16f (ESI†), the ICE is relatively low (51.6%). Therefore, before the assembly of full cells, both the cathode and anode are pre-cycled at 100 mA g−1 for 1 cycle to compensate the initial capacity loss.24,77 The capacity matching is based on the GCD plot with a cathode/anode capacity ratio of 1.2![[thin space (1/6-em)]](https://www.rsc.org/images/entities/char_2009.gif) :
:![[thin space (1/6-em)]](https://www.rsc.org/images/entities/char_2009.gif) 1 (Fig. S17, ESI†). The GCD curve of the matched full cell (Fig. 9a) delivers an obvious plateau and overlaps well from the 2nd cycle, indicating good stability. As illuminated in Fig. 9b, the full cell maintains a reversible capacity of 323.9 mA h g−1 (based on the anode) after 30 cycles, corresponding to a high capacity retention ratio of 80.8%, which illuminates promising practical prospects. Intrigued by the good flexibility of the SnS2@C-2 nanofiber, the deformation resistance of the pouch-packed full cell is further evaluated. As depicted in Fig. 9c and d, the as-assembled pouch cell can easily light 27 light-emitting diodes (LEDs). Besides, the pouch cell keeps working in 1-fold (180° deformation) and subsequent released states (Fig. 9e and f), which is the first reported foldable potassium-ion battery. Surprisingly, under 2-fold (180° × 2 deformation) conditions, the pouch cell still works well, which demonstrates the superior flexibility and mechanical stability of the SnS2@C-2 nanofibers (Fig. 9g and h). Moreover, the GCD profiles in the 1-fold (Fig. S18a, ESI†), 2-fold (Fig. S18b, ESI†) and released states (Fig. S18c, ESI†) are in good agreement with the pristine cell and the capacity loss is faint, showing great potential for powering flexible electronic devices.
1 (Fig. S17, ESI†). The GCD curve of the matched full cell (Fig. 9a) delivers an obvious plateau and overlaps well from the 2nd cycle, indicating good stability. As illuminated in Fig. 9b, the full cell maintains a reversible capacity of 323.9 mA h g−1 (based on the anode) after 30 cycles, corresponding to a high capacity retention ratio of 80.8%, which illuminates promising practical prospects. Intrigued by the good flexibility of the SnS2@C-2 nanofiber, the deformation resistance of the pouch-packed full cell is further evaluated. As depicted in Fig. 9c and d, the as-assembled pouch cell can easily light 27 light-emitting diodes (LEDs). Besides, the pouch cell keeps working in 1-fold (180° deformation) and subsequent released states (Fig. 9e and f), which is the first reported foldable potassium-ion battery. Surprisingly, under 2-fold (180° × 2 deformation) conditions, the pouch cell still works well, which demonstrates the superior flexibility and mechanical stability of the SnS2@C-2 nanofibers (Fig. 9g and h). Moreover, the GCD profiles in the 1-fold (Fig. S18a, ESI†), 2-fold (Fig. S18b, ESI†) and released states (Fig. S18c, ESI†) are in good agreement with the pristine cell and the capacity loss is faint, showing great potential for powering flexible electronic devices.
3. Conclusions
In summary, we report the first foldable potassium-ion battery with flexible and binder-free SnS2@C-2 nanofibers. The SnS2@C-2 electrode with tuned thickness, well-developed pore structure and N,S co-doping configurations exhibits superior K-ion storage capability including high reversible capacity, excellent rate capability and ultralong cycling stability, overmatching most of the reported PIB anode materials. Specifically, the consecutive conversion–alloying reaction and enhanced capacitive behavior contribute to the high reversible capacity. The enlarged carbon interspace, abundant mesopores and synergistic N,S co-doping lead to the boosted high-rate stability. Besides, the correlations between the K-ion storage behaviors and K-ion diffusion kinetics at various potassiation depths are preliminarily illuminated in this work. Briefly speaking, K ions transport quickly and smoothly in the capacitive-behavior dominated high potential region, and diffuse relatively sluggishly in the diffusion-behavior controlled deep potassiated states. Moreover, it is theoretically elucidated that the N,S co-doping strategy is highly efficient for promoting the K-ion adsorption affinity compared to sole N doping and pristine carbon, which sheds more light on the predominantly capacitive behavior. Therefore, this work not only provides guidance for rational design of high performance PIB electrode materials, but also offers in-depth understanding of the inherent correlations between the K-ion storage kinetics and their behaviors. Moreover, this work may also broaden the pathways for designing better electrode materials for other battery systems.4. Experimental section
4.1 Preparation of SnS2@C-x nanofibers
PAN (polyacrylonitrile, Mw 150![[thin space (1/6-em)]](https://www.rsc.org/images/entities/char_2009.gif) 000) was firstly dissolved in DMF (N,N-dimethylformamide, 5 mL) to obtain a 11 wt% PAN solution, and a certain amount of SnCl2·2H2O (0.1 g, 0.2 g, 0.4 g, and 0.8 g for x = 1, 2, 3 and 4, respectively) was then added into the PAN solution and it was retained at 60 °C for 2 h under magnetic stirring. The resulting mixture was used as the precursor solution for electrospinning, loaded into a 10 mL plastic syringe with a 22-gauge stainless steel needle. The applied voltage was maintained at 14 kV, the feeding rate was kept at 20 μL min−1 and the distance between the needle and the collector was maintained as 15 cm. After the electrospinning process, the as-obtained nanofibers (white color) were firstly vacuum-dried at 60 °C for 8 h to remove the residual DMF solvent. Subsequently, the as-obtained nanofibers were transferred to a tube furnace and stabilized at 250 °C for 3 h with a temperature ramp rate of 5 °C min−1 (air atmosphere). Then the nanofibers were pyrolyzed at 800 °C for 1 h (Ar atmosphere, 5 °C min−1) to obtain Sn@C-x nanofibers. After a sulfidation process at 400 °C for 3 h with sublimed sulfur in the upstream and Sn@C-x in the downstream (sublimed sulfur/Sn@C-x = 5
000) was firstly dissolved in DMF (N,N-dimethylformamide, 5 mL) to obtain a 11 wt% PAN solution, and a certain amount of SnCl2·2H2O (0.1 g, 0.2 g, 0.4 g, and 0.8 g for x = 1, 2, 3 and 4, respectively) was then added into the PAN solution and it was retained at 60 °C for 2 h under magnetic stirring. The resulting mixture was used as the precursor solution for electrospinning, loaded into a 10 mL plastic syringe with a 22-gauge stainless steel needle. The applied voltage was maintained at 14 kV, the feeding rate was kept at 20 μL min−1 and the distance between the needle and the collector was maintained as 15 cm. After the electrospinning process, the as-obtained nanofibers (white color) were firstly vacuum-dried at 60 °C for 8 h to remove the residual DMF solvent. Subsequently, the as-obtained nanofibers were transferred to a tube furnace and stabilized at 250 °C for 3 h with a temperature ramp rate of 5 °C min−1 (air atmosphere). Then the nanofibers were pyrolyzed at 800 °C for 1 h (Ar atmosphere, 5 °C min−1) to obtain Sn@C-x nanofibers. After a sulfidation process at 400 °C for 3 h with sublimed sulfur in the upstream and Sn@C-x in the downstream (sublimed sulfur/Sn@C-x = 5![[thin space (1/6-em)]](https://www.rsc.org/images/entities/char_2009.gif) :
:![[thin space (1/6-em)]](https://www.rsc.org/images/entities/char_2009.gif) 1 by weight), SnS2@C-x nanofibers were obtained.
1 by weight), SnS2@C-x nanofibers were obtained.
4.2 Material characterization
The morphology and microstructure of the as-synthesized materials were characterized by FESEM (JEOL JSM-7800F) and TEM (JEOL JEM-2100). The phase structure was determined by XRD on a Rigaku Miniflex 600 X-ray diffractometer operated at 40 kV (current: 15 mA, power: 600 W) with Cu Kα radiation (λ = 1.5406 Å) at a scan rate of 5° min−1 (step length = 0.01°). In situ XRD data were collected on a Bruker D8 Advance operated at 40 kV (current: 40 mA, power: 1600 W). Raman spectra were collected on a Renishaw inVia confocal Raman microscope using a 633 nm laser (power: 17 mW) as the excitation source. The SSA (Specific Surface Area) and PSDs (Pore Size Distributions) were determined using the N2 adsorption isotherm at −196 °C on a Micromeritics ASAP 2020 analyzer; the samples were outgassed at 150 °C for 8 h before the analysis procedure.4.3 Electrochemical measurements
The as-synthesized SnS2@C-x nanofibers can be directly applied as the electrode without a binder and conductive additive. Before the assembly of coin cells, the SnS2@C-x nanofibers were punched into circular electrodes and the average mass loading of each electrode was 1.0–1.2 mg. The coin cells (type: CR-2032) were assembled in an Ar-filled glove box (H2O < 1.0 ppm and O2 < 1.0 ppm) with a metallic potassium plate as the counter electrode. A Whatman GF/C glass fiber was applied as the separator. The electrolyte was 0.8 M KPF6 solution with a mixed solvent of ethylene carbonate and diethyl carbonate (1![[thin space (1/6-em)]](https://www.rsc.org/images/entities/char_2009.gif) :
:![[thin space (1/6-em)]](https://www.rsc.org/images/entities/char_2009.gif) 1 by volume). The volume of electrolyte for each coin cell is ∼150 μL. Galvanostatic charge/discharge tests were conducted within a voltage window of 0.01–3.0 V using a LAND-CT2001A multichannel galvanostat (Wuhan, China) at room temperature (25 °C). The CV profiles were obtained within the same voltage range at various scan rates on an electrochemical workstation (Autolab, Metrohm). For full-cell assembly, K metal foil was replaced with Prussian blue analogues (KFeII[FeIII(CN)6]) synthesized following a reported method.76 The capacity ratio of the cathode/anode is around 1.2
1 by volume). The volume of electrolyte for each coin cell is ∼150 μL. Galvanostatic charge/discharge tests were conducted within a voltage window of 0.01–3.0 V using a LAND-CT2001A multichannel galvanostat (Wuhan, China) at room temperature (25 °C). The CV profiles were obtained within the same voltage range at various scan rates on an electrochemical workstation (Autolab, Metrohm). For full-cell assembly, K metal foil was replaced with Prussian blue analogues (KFeII[FeIII(CN)6]) synthesized following a reported method.76 The capacity ratio of the cathode/anode is around 1.2![[thin space (1/6-em)]](https://www.rsc.org/images/entities/char_2009.gif) :
:![[thin space (1/6-em)]](https://www.rsc.org/images/entities/char_2009.gif) 1 to ensure that the anode is the capacity-limiting electrode. The specific capacities are calculated based on the mass of anode materials. CV measurements and galvanostatic charge/discharge tests of full-cells were all conducted within a potential range of 2.0–4.2 V.
1 to ensure that the anode is the capacity-limiting electrode. The specific capacities are calculated based on the mass of anode materials. CV measurements and galvanostatic charge/discharge tests of full-cells were all conducted within a potential range of 2.0–4.2 V.
4.4 Theoretical calculations
All calculations were based on density functional theory (DFT) implemented in the DMOL3 module of Materials Studio. The generalized gradient approximation (GGA) with the functional of Perdew–Burke–Ernzerhof (PBE) was employed to describe the electron interaction energy of exchange correlation. In all the calculations, a 6 × 6 × 1 graphite-like carbon supercell with defects was constructed. The parameters of convergence tolerance were set as energy 2.0 × 10⁻⁵ Ha, max. force 0.004 Ha Å−1, max. displacement 0.005 Å and max. step size 0.3 Å. The SCF tolerance was set as 1.0 × 10⁻⁵ eV per atom.Conflicts of interest
There are no conflicts of interest to declare.Acknowledgements
We thank Prof. Yongxin Qi and Ms Ying Qiao (Shandong University) for their help in conducting in situ XRD measurements. This work was supported by School Research Startup Expenses of Harbin Institute of Technology (Shenzhen) (Grant No. DD29100027), China Postdoctoral Science Foundation (Grant No. 2019M661276), Guangdong Basic and Applied Basic Research Foundation (Grant No. 2019A1515110756), National Natural Science Foundation of China (Grant No. 51908242 and 52002094), and High-level Talents' Discipline Construction Fund of Shandong University (Grant No. 31370089963078).References
- M. Li, J. Lu, Z. Chen and K. Amine, Adv. Mater., 2018, 30, 1800561 CrossRef.
- J. W. Choi and D. Aurbach, Nat. Rev. Mater., 2016, 1, 16013 CrossRef CAS.
- M. Winter, B. Barnett and K. Xu, Chem. Rev., 2018, 118, 11433–11456 CrossRef CAS.
- J.-Y. Hwang, S.-T. Myung and Y.-K. Sun, Chem. Soc. Rev., 2017, 46, 3529–3614 RSC.
- T. Hosaka, K. Kubota, A. S. Hameed and S. Komaba, Chem. Rev., 2020, 120, 6358–6466 CrossRef CAS.
- W. Zhang, Y. Liu and Z. Guo, Sci. Adv., 2019, 5, eaav7412 CrossRef CAS.
- X. Wu, Y. Chen, Z. Xing, C. W. K. Lam, S.-S. Pang, W. Zhang and Z. Ju, Adv. Energy Mater., 2019, 9, 1900343 CrossRef.
- G. Li, B. Huang, Z. Pan, X. Su, Z. Shao and L. An, Energy Environ. Sci., 2019, 12, 2030–2053 RSC.
- G. Fang, Q. Wang, J. Zhou, Y. Lei, Z. Chen, Z. Wang, A. Pan and S. Liang, ACS Nano, 2019, 13, 5635–5645 CrossRef CAS.
- M. Okoshi, Y. Yamada, S. Komaba, A. Yamada and H. Nakai, J. Electrochem. Soc., 2016, 164, A54–A60 CrossRef.
- J. C. Pramudita, D. Sehrawat, D. Goonetilleke and N. Sharma, Adv. Energy Mater., 2017, 7, 1602911 CrossRef.
- D. Li, M. Zhu, L. Chen, L. Chen, W. Zhai, Q. Ai, G. Hou, Q. Sun, Y. Liu, Z. Liang, S. Guo, J. Lou, P. Si, J. Feng, L. Zhang and L. Ci, Adv. Mater. Interfaces, 2018, 5, 1800606 CrossRef.
- V. Gabaudan, R. Berthelot, L. Stievano and L. Monconduit, J. Phys. Chem. C, 2018, 122, 18266–18273 CrossRef CAS.
- Z. Jian, W. Luo and X. Ji, J. Am. Chem. Soc., 2015, 137, 11566–11569 CrossRef CAS.
- J.-Y. Hwang, S.-T. Myung and Y.-K. Sun, Adv. Funct. Mater., 2018, 28, 1802938 CrossRef.
- Y.-S. Xu, S.-Y. Duan, Y.-G. Sun, D.-S. Bin, X.-S. Tao, D. Zhang, Y. Liu, A.-M. Cao and L.-J. Wan, J. Mater. Chem. A, 2019, 7, 4334–4352 RSC.
- Y. Wu, H.-B. Huang, Y. Feng, Z.-S. Wu and Y. Yu, Adv. Mater., 2019, 31, 1901414 CrossRef CAS.
- L. Fan, R. Ma, Q. Zhang, X. Jia and B. Lu, Angew. Chem., Int. Ed., 2019, 58, 10500–10505 CrossRef CAS.
- Y. Qian, S. Jiang, Y. Li, Z. Yi, J. Zhou, J. Tian, N. Lin and Y. Qian, Angew. Chem., Int. Ed., 2019, 58, 18108–18115 CrossRef CAS.
- W. Luo, J. Wan, B. Ozdemir, W. Bao, Y. Chen, J. Dai, H. Lin, Y. Xu, F. Gu, V. Barone and L. Hu, Nano Lett., 2015, 15, 7671–7677 CrossRef CAS.
- B. Cao, Q. Zhang, H. Liu, B. Xu, S. Zhang, T. Zhou, J. Mao, W. K. Pang, Z. Guo, A. Li, J. Zhou, X. Chen and H. Song, Adv. Energy Mater., 2018, 8, 1801149 CrossRef.
- D. Li, X. Ren, Q. Ai, Q. Sun, L. Zhu, Y. Liu, Z. Liang, R. Peng, P. Si, J. Lou, J. Feng and L. Ci, Adv. Energy Mater., 2018, 8, 1802386 CrossRef.
- W. Yang, J. Zhou, S. Wang, W. Zhang, Z. Wang, F. Lv, K. Wang, Q. Sun and S. Guo, Energy Environ. Sci., 2019, 12, 1605–1612 RSC.
- Q. Sun, D. Li, J. Cheng, L. Dai, J. Guo, Z. Liang and L. Ci, Carbon, 2019, 155, 601–610 CrossRef CAS.
- Y. Xu, C. Zhang, M. Zhou, Q. Fu, C. Zhao, M. Wu and Y. Lei, Nat. Commun., 2018, 9, 1720 CrossRef.
- Z. Jian, Z. Xing, C. Bommier, Z. Li and X. Ji, Adv. Energy Mater., 2016, 6, 1501874 CrossRef.
- Z. Jian, S. Hwang, Z. Li, A. S. Hernandez, X. Wang, Z. Xing, D. Su and X. Ji, Adv. Funct. Mater., 2017, 27, 1700324 CrossRef.
- Y. Liu, Y.-X. Lu, Y.-S. Xu, Q.-S. Meng, J.-C. Gao, Y.-G. Sun, Y.-S. Hu, B.-B. Chang, C.-T. Liu and A.-M. Cao, Adv. Mater., 2020, 32, 2000505 CrossRef CAS.
- B. Jia, Q. Yu, Y. Zhao, M. Qin, W. Wang, Z. Liu, C.-Y. Lao, Y. Liu, H. Wu, Z. Zhang and X. Qu, Adv. Funct. Mater., 2018, 28, 1803409 CrossRef.
- S. Chong, L. Sun, C. Shu, S. Guo, Y. Liu, W. Wang and H. K. Liu, Nano Energy, 2019, 63, 103868 CrossRef CAS.
- H. He, D. Huang, Q. Gan, J. Hao, S. Liu, Z. Wu, W. K. Pang, B. Johannessen, Y. Tang, J.-L. Luo, H. Wang and Z. Guo, ACS Nano, 2019, 13, 11843–11852 CrossRef CAS.
- W. Wang, B. Jiang, C. Qian, F. Lv, J. Feng, J. Zhou, K. Wang, C. Yang, Y. Yang and S. Guo, Adv. Mater., 2018, 30, 1801812 CrossRef.
- J. Ge, L. Fan, J. Wang, Q. Zhang, Z. Liu, E. Zhang, Q. Liu, X. Yu and B. Lu, Adv. Energy Mater., 2018, 8, 1801477 CrossRef.
- Y. Yi, Z. Sun, C. Li, Z. Tian, C. Lu, Y. Shao, J. Li, J. Sun and Z. Liu, Adv. Funct. Mater., 2020, 30, 1903878 CrossRef CAS.
- S. S. Fedotov, N. D. Luchinin, D. A. Aksyonov, A. V. Morozov, S. V. Ryazantsev, M. Gaboardi, J. R. Plaisier, K. J. Stevenson, A. M. Abakumov and E. V. Antipov, Nat. Commun., 2020, 11, 1484 CrossRef CAS.
- S. S. Fedotov, A. S. Samarin, V. A. Nikitina, D. A. Aksyonov, S. A. Sokolov, A. Zhugayevych, K. J. Stevenson, N. R. Khasanova, A. M. Abakumov and E. V. Antipov, J. Mater. Chem. A, 2018, 6, 14420–14430 RSC.
- R. Zhang, J. Huang, W. Deng, J. Bao, Y. Pan, S. Huang and C.-F. Sun, Angew. Chem., Int. Ed., 2019, 58, 16474–16479 CrossRef CAS.
- M. G. Boebinger, D. Yeh, M. Xu, B. C. Miles, B. Wang, M. Papakyriakou, J. A. Lewis, N. P. Kondekar, F. J. Q. Cortes, S. Hwang, X. Sang, D. Su, R. R. Unocic, S. Xia, T. Zhu and M. T. McDowell, Joule, 2018, 2, 1783–1799 CrossRef CAS.
- Y. Zhao, J. Zhu, S. J. H. Ong, Q. Yao, X. Shi, K. Hou, Z. J. Xu and L. Guan, Adv. Energy Mater., 2018, 8, 1802565 CrossRef.
- Y. Liu, Z. Sun, X. Sun, Y. Lin, K. Tan, J. Sun, L. Liang, L. Hou and C. Yuan, Angew. Chem., Int. Ed., 2020, 59, 2473–2482 CrossRef CAS.
- D. Wu, W. Zhang, Y. Feng and J. Ma, J. Mater. Chem. A, 2020, 8, 2618–2626 RSC.
- L. Li, W. Zhang, X. Wang, S. Zhang, Y. Liu, M. Li, G. Zhu, Y. Zheng, Q. Zhang, T. Zhou, W. K. Pang, W. Luo, Z. Guo and J. Yang, ACS Nano, 2019, 13, 7939–7948 CrossRef CAS.
- G. Ma, X. Xu, Z. Feng, C. Hu, Y. Zhu, X. Yang, J. Yang and Y. Qian, Nano Res., 2020, 13, 802–809 CrossRef CAS.
- J. Zheng, Y. Yang, X. Fan, G. Ji, X. Ji, H. Wang, S. Hou, M. R. Zachariah and C. Wang, Energy Environ. Sci., 2019, 12, 615–623 RSC.
- D. Liu, L. Yang, Z. Chen, G. Zou, H. Hou, J. Hu and X. Ji, Sci. Bull., 2020, 65, 1003–1012 CrossRef CAS.
- Y. Wu, S. Hu, R. Xu, J. Wang, Z. Peng, Q. Zhang and Y. Yu, Nano Lett., 2019, 19, 1351–1358 CrossRef.
- P. Xiong, P. Bai, S. Tu, M. Cheng, J. Zhang, J. Sun and Y. Xu, Small, 2018, 14, 1802140 CrossRef.
- D. Liu, X. Huang, D. Qu, D. Zheng, G. Wang, J. Harris, J. Si, T. Ding, J. Chen and D. Qu, Nano Energy, 2018, 52, 1–10 CrossRef CAS.
- S. Wang, P. Xiong, X. Guo, J. Zhang, X. Gao, F. Zhang, X. Tang, P. H. L. Notten and G. Wang, Adv. Funct. Mater., 2020, 30, 2001588 CrossRef CAS.
- V. Lakshmi, A. A. Mikhaylov, A. G. Medvedev, C. Zhang, T. Ramireddy, M. M. Rahman, P. Cizek, D. Golberg, Y. Chen, O. Lev, P. V. Prikhodchenko and A. M. Glushenkov, J. Mater. Chem. A, 2020, 8, 11424–11434 RSC.
- L. Fang, J. Xu, S. Sun, B. Lin, Q. Guo, D. Luo and H. Xia, Small, 2019, 15, 1804806 CrossRef.
- D. Li, Q. Sun, Y. Zhang, L. Chen, Z. Wang, Z. Liang, P. Si and L. Ci, ChemSusChem, 2019, 12, 2689–2700 CrossRef CAS.
- D. Li, Y. Zhang, Q. Sun, S. Zhang, Z. Wang, Z. Liang, P. Si and L. Ci, Energy Storage Mater., 2019, 23, 367–374 CrossRef.
- W. Zhang, J. Mao, S. Li, Z. Chen and Z. Guo, J. Am. Chem. Soc., 2017, 139, 3316–3319 CrossRef CAS.
- W. Zhang, W. K. Pang, V. Sencadas and Z. Guo, Joule, 2018, 2, 1534–1547 CrossRef CAS.
- C. Zhang, Y. Qiao, P. Xiong, W. Ma, P. Bai, X. Wang, Q. Li, J. Zhao, Y. Xu, Y. Chen, J. H. Zeng, F. Wang, Y. Xu and J.-X. Jiang, ACS Nano, 2019, 13, 745–754 CrossRef CAS.
- Y. Liang, C. Luo, F. Wang, S. Hou, S.-C. Liou, T. Qing, Q. Li, J. Zheng, C. Cui and C. Wang, Adv. Energy Mater., 2019, 9, 1802986 CrossRef.
- Q. Xue, D. Li, Y. Huang, X. Zhang, Y. Ye, E. Fan, L. Li, F. Wu and R. Chen, J. Mater. Chem. A, 2018, 6, 12559–12564 RSC.
- R. Rajagopalan, Y. Tang, X. Ji, C. Jia and H. Wang, Adv. Funct. Mater., 2020, 30, 1909486 CrossRef CAS.
- I. Sultana, M. M. Rahman, Y. Chen and A. M. Glushenkov, Adv. Funct. Mater., 2018, 28, 1703857 CrossRef.
- K. Song, C. Liu, L. Mi, S. Chou, W. Chen and C. Shen, Small, 2019, 1903194, DOI:10.1002/smll.201903194.
- J.-w. Seo, J.-t. Jang, S.-w. Park, C. Kim, B. Park and J. Cheon, Adv. Mater., 2008, 20, 4269–4273 CrossRef CAS.
- H. Qiu, L. Zhao, M. Asif, X. Huang, T. Tang, W. Li, T. Zhang, T. Shen and Y. Hou, Energy Environ. Sci., 2020, 13, 571–578 RSC.
- L. Wu, H. Lu, L. Xiao, X. Ai, H. Yang and Y. Cao, J. Power Sources, 2015, 293, 784–789 CrossRef CAS.
- V. Lakshmi, Y. Chen, A. A. Mikhaylov, A. G. Medvedev, I. Sultana, M. M. Rahman, O. Lev, P. V. Prikhodchenko and A. M. Glushenkov, Chem. Commun., 2017, 53, 8272–8275 RSC.
- J. Xie, Y. Zhu, N. Zhuang, X. Li, X. Yuan, J. Li, G. Hong and W. Mai, J. Mater. Chem. A, 2019, 7, 19332–19341 RSC.
- D.-S. Bin, S.-Y. Duan, X.-J. Lin, L. Liu, Y. Liu, Y.-S. Xu, Y.-G. Sun, X.-S. Tao, A.-M. Cao and L.-J. Wan, Nano Energy, 2019, 60, 912–918 CrossRef CAS.
- L. Cao, B. Zhang, X. Ou, C. Wang, C. Peng and J. Zhang, ChemElectroChem, 2019, 6, 2254–2263 CrossRef CAS.
- Y. Liu, X.-Y. Yu, Y. Fang, X. Zhu, J. Bao, X. Zhou and X. W. Lou, Joule, 2018, 2, 725–735 CrossRef CAS.
- H.-S. Kim, J. B. Cook, H. Lin, J. S. Ko, S. H. Tolbert, V. Ozolins and B. Dunn, Nat. Mater., 2017, 16, 454–460 CrossRef CAS.
- V. Augustyn, J. Come, M. A. Lowe, J. W. Kim, P.-L. Taberna, S. H. Tolbert, H. D. Abruña, P. Simon and B. Dunn, Nat. Mater., 2013, 12, 518–522 CrossRef CAS.
- T. Brezesinski, J. Wang, S. H. Tolbert and B. Dunn, Nat. Mater., 2010, 9, 146–151 CrossRef CAS.
- D. Li, L. Chen, L. Chen, Q. Sun, M. Zhu, Y. Zhang, Y. Liu, Z. Liang, P. Si, J. Lou, J. Feng and L. Ci, J. Power Sources, 2019, 414, 308–316 CrossRef CAS.
- G. Fang, Z. Wu, J. Zhou, C. Zhu, X. Cao, T. Lin, Y. Chen, C. Wang, A. Pan and S. Liang, Adv. Energy Mater., 2018, 8, 1703155 CrossRef.
- H. Gao, T. Zhou, Y. Zheng, Q. Zhang, Y. Liu, J. Chen, H. Liu and Z. Guo, Adv. Funct. Mater., 2017, 27, 1702634 CrossRef.
- S. Chong, Y. Chen, Y. Zheng, Q. Tan, C. Shu, Y. Liu and Z. Guo, J. Mater. Chem. A, 2017, 5, 22465–22471 RSC.
- Y. Liu, Y. Fang, Z. Zhao, C. Yuan and X. W. Lou, Adv. Energy Mater., 2019, 9, 1803052 CrossRef.
Footnotes |
| † Electronic supplementary information (ESI) available. See DOI: 10.1039/d0ee02919j |
| ‡ Deping Li and Linna Dai contributed equally to this work. |
| This journal is © The Royal Society of Chemistry 2021 |

