 Open Access Article
Single source precursor route to nanometric tin chalcogenides†
Veronika
Brune
 *a,
Nidal
Raydan
b,
Anja
Sutorius
a,
Fabian
Hartl
a,
Bhagyesh
Purohit
b,
Sweta
Gahlot
b,
Pascal
Bargiela
b,
Laurence
Burel
b,
Michael
Wilhelm
a,
Corinna
Hegemann
a,
Ufuk
Atamtürk
a,
Sanjay
Mathur
 a and
Shashank
Mishra
 *b
*b
aUniversity of Cologne, Institute of Inorganic Chemisty, Greinstraße 6, 50939 Cologne, Germany. E-mail: veronika.brune@uni-koeln.de
bUniversité Lyon 1, IRCELYON, CNRS-UMR 5256, 2 Avenue A. Einstein, 69626 Villeurbanne, France. E-mail: shashank.mishra@ircelyon.univ-lyon1.fr
First published on 17th November 2021
Abstract
Low-temperature solution phase synthesis of nanomaterials using designed molecular precursors enjoys tremendous advantages over traditional high-temperature solid-state synthesis. These include atomic-level control over stoichiometry, homogeneous elemental dispersion and uniformly distributed nanoparticles. For exploiting these advantages, however, rationally designed molecular complexes having certain properties are usually required. We report here the synthesis and complete characterization of new molecular precursors containing direct Sn–E bonds (E = S or Se), which undergo facile decomposition under different conditions (solid/solution phase, thermal/microwave heating, single/mixed solvents, varying temperatures, etc.) to afford phase-pure or mixed-phase tin chalcogenide nanoflakes with defined ratios.
1. Introduction
Two-dimensional atomically thin semiconductor nanostructures, like tin monochalcogenides SnE (E = S, Sn) and tin dichalogenides SnE2 (E = S, Se), have been attracting worldwide attention due to their exceptional electrical and optical properties, and their potential applications in nanoscale electronics, photonics and functional materials as well as semiconducting and optical devices.1–5 Mono or few layered 2D van der Waals (vdW) tin-based chalcogenide materials are distinguished in their chemical and physical properties6,7 as compared to their bulk counterparts. Additionally, these layered vdW materials have the advantage of their constituent elements being abundant in nature and not posing any health and environmental hazards.8–10 The versatile coordinating characteristics of tin and the chalcogenides sulfur and selenium permit tin sulfide/selenide to adopt a variety of phases (SnE, Sn2E3, and SnE2; E = S, Se).9,11 On the other hand, this variety of stable crystal phases presents a challenge to the targeted material preparation, meaning that the composition or phase purity is compromised by the coexistence of different phases encountered frequently during their synthesis.9 SnE, where tin has the +II oxidation state, has an orthorhombic crystal structure, built out of wrinkled honeycomb layers of Sn and S/Se having covalent interlayer bonds and weak vdW forces between single layers.7 SnE, which has its bandgap located between those of Si and GaAs, exhibits both the p- and n-type conduction depending on the concentration of tin.12–14 Therefore, SnE can be potentially used as a solar absorber in thin film solar cells and near-infrared detectors3,15,16 and as a photovoltaic material.2,17 On the other hand, tin dichalcogenides SnE2 (SnS2/SnSe2) are n-type semiconductors with an indirect band gap of 2.1 eV/1.1 eV and a direct band gap of 2.8 eV/1.8 eV.7,9,18 They have a hexagonal CdI2-type crystal structure consisting of an E–Sn–E triple layers, where the atomic layers are held together by weak van der Waals forces of attraction and have been extensively studied in their bulk form in the past.19 Recently, single and few-layered SnE2 have been employed in several applications including water splitting,20–22 field-effect transistors23,24 and gas sensing.25,26The chemical, physical and electronic properties of these materials are often governed by the synthetic methods employed to prepare them. In general, the soft chemical routes using well-characterized single source precursors (SSPs) for the synthesis of nanomaterials have numerous advantages, like tight control over the phase, morphology and stoichiometry.27–29 Among these routes, the chemical solution deposition methods are attractive because they offer high-yield and substrate-free synthesis of nanomaterials with tunable nanostructures at much lower temperatures.30,31 Although a huge range of different SnE and SnE2 nanostructures have been synthesized in the solution phase,32,33 very few 2D tin chalcogenide nanostructures have been prepared from SSPs. Different nanostructured SnE and SnE2 materials have been synthesized using solution based SSP approaches, like SnSe nanorods,28 SnSe nanowires,34,35 SnSe needles,36 SnS/Se nanoparticles37 and few-layer SnSe/SnSe2 nanosheets.28,36 Despite these successes, the phase-controlled synthesis of 2D tin sulfide and selenide nanostructures remains a challenge. Based on the excellent properties of 2D layered crystal structures and their unique mechanical flexibility, synthesizing 2D tin chalcogenide nanostructures is of great importance.
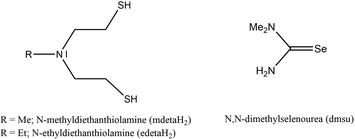
The above literature survey indicates that the chemical routes to 2D SnE and SnE2 from a single source remain underdeveloped and there is a scope for the development of well-characterized molecular precursors for these materials.38 In this study, we report a ‘bottom-up’ approach for the synthesis of SnE and SnE2 nanostructures using different tin-based sulfur and selenide precursors. We employed N-alkyl-diethanethiolamine and N,N-dimethylselenourea ligands (Scheme 1) because of their versatile coordination behavior and ability to transfer chalcogenide atoms easily to metal centers to obtain metal chalcogenide nanomaterials.39,40
2. Results and discussion
2.1. Synthesis and characterization of Sn(II) and Sn(IV) complexes with N-alkyl-diethanethiolamine ligands as precursors to tin sulfide nanoaprticles
Tridentate chelating dithiol ligands N-alkyl-diethanethiolamine RN(C2H4SH)2 were used in the synthesis of stable metal complexes enabling the control of the coordination sphere of the coordinated metal center.39,41 The limited commercial availability and high price of these ligand types triggered us to the synthetic pathways of SNS type ligands starting from their dialcohol-derivatives with thiourea as a sulfur-source.39,41,42The tin reagents [Sn(N(SiMe3)2)2]43 and [Sn(OtBu)4],44 pre-synthesized as described in the literature, reacted with the dithiol-ligands RN(C2H4SH)2 (R = Me, Et) in toluene to form Sn(II) and Sn(IV) complexes [Sn{(SC2H4)2NMe}] (1), [Sn{(SC2H4)2NEt}] (2), [Sn{(SC2H4)2NMe}2] (3) and [Sn{(SC2H4)2NEt}2] (4) (Scheme 2). In these complexes, the dianionic chelating ligand RN(C2H4S)22− (R = Me, Et) coordinates to the tin center in a tridentate fashion, yielding air-stable complexes. The dark orange solution of [Sn(N(SiMe3)2)2] in toluene instantaneously discolored on adding one equivalent of the mdetaH2 or edetaH2 ligand, leading to precipitation of colorless and pale yellow colored solids, later identified as [Sn{(SC2H4)2NMe}] (1) and [Sn{(SC2H4)2NEt}] (2), respectively. Mass analysis confirmed the successful synthesis of tin(II) complexes 1 and 2 with observed molecular peaks of 269 m/z and 283 m/z, respectively. Additional NMR analysis of both complexes showed highly solvent-dependent signal splitting with a total of 11 proton signals for 1 and 13 protons signals for 2 in less polar solvents. Proton NMR measurements of 1 in C6D6 showed five inequivalent proton signals with an integral ratio of 3![[thin space (1/6-em)]](https://www.rsc.org/images/entities/char_2009.gif) :
:![[thin space (1/6-em)]](https://www.rsc.org/images/entities/char_2009.gif) 2
2![[thin space (1/6-em)]](https://www.rsc.org/images/entities/char_2009.gif) :
:![[thin space (1/6-em)]](https://www.rsc.org/images/entities/char_2009.gif) 2
2![[thin space (1/6-em)]](https://www.rsc.org/images/entities/char_2009.gif) :
:![[thin space (1/6-em)]](https://www.rsc.org/images/entities/char_2009.gif) 2
2![[thin space (1/6-em)]](https://www.rsc.org/images/entities/char_2009.gif) :
:![[thin space (1/6-em)]](https://www.rsc.org/images/entities/char_2009.gif) 2, displaying each ethanethiol CH2-protons in an integrative reaction of 2. The two high-field shifted proton signals belong to the CH2 group next to the sulfur and the two low-field shifted protons were identified as CH2 protons located next to the bridging nitrogen. The methyl group located at the nitrogen was appeared with an integral ratio of 3. This signal splitting reveals a relatively rigid structure in C6D6, whereas three non-equivalent proton signals with an integral ratio of 3
2, displaying each ethanethiol CH2-protons in an integrative reaction of 2. The two high-field shifted proton signals belong to the CH2 group next to the sulfur and the two low-field shifted protons were identified as CH2 protons located next to the bridging nitrogen. The methyl group located at the nitrogen was appeared with an integral ratio of 3. This signal splitting reveals a relatively rigid structure in C6D6, whereas three non-equivalent proton signals with an integral ratio of 3![[thin space (1/6-em)]](https://www.rsc.org/images/entities/char_2009.gif) :
:![[thin space (1/6-em)]](https://www.rsc.org/images/entities/char_2009.gif) 4
4![[thin space (1/6-em)]](https://www.rsc.org/images/entities/char_2009.gif) :
:![[thin space (1/6-em)]](https://www.rsc.org/images/entities/char_2009.gif) 4 were detected in DMSO-d6. Separation of single CH2 signals for each ethanethiol chain was not possible. The proton signals at the lower field were identified as CH2 protons next to the sulfur of both ethanethiol chains and the highfield shifted signals belong to CH2 protons located at the bridging nitrogen. For both measurements, three inequivalent carbon signals correlating with the expected CH2 and CH3 protons were observed. Two carbon peaks with different chemical shifts but the same signal orientation in the 13C APT spectrum correlate with the ethanethiol chains. The highfield shifted signal correlates with the protons next to the sulfur, whereas the lowfield shifted signals belong to the CH2 protons located next to the nitrogen. The carbon signal with a different orientation was clearly identified as the CH3 signal. Proton NMR analysis of 2 displays four non-equivalent signals with an integral ratio of 2
4 were detected in DMSO-d6. Separation of single CH2 signals for each ethanethiol chain was not possible. The proton signals at the lower field were identified as CH2 protons next to the sulfur of both ethanethiol chains and the highfield shifted signals belong to CH2 protons located at the bridging nitrogen. For both measurements, three inequivalent carbon signals correlating with the expected CH2 and CH3 protons were observed. Two carbon peaks with different chemical shifts but the same signal orientation in the 13C APT spectrum correlate with the ethanethiol chains. The highfield shifted signal correlates with the protons next to the sulfur, whereas the lowfield shifted signals belong to the CH2 protons located next to the nitrogen. The carbon signal with a different orientation was clearly identified as the CH3 signal. Proton NMR analysis of 2 displays four non-equivalent signals with an integral ratio of 2![[thin space (1/6-em)]](https://www.rsc.org/images/entities/char_2009.gif) :
:![[thin space (1/6-em)]](https://www.rsc.org/images/entities/char_2009.gif) 4
4![[thin space (1/6-em)]](https://www.rsc.org/images/entities/char_2009.gif) :
:![[thin space (1/6-em)]](https://www.rsc.org/images/entities/char_2009.gif) 4
4![[thin space (1/6-em)]](https://www.rsc.org/images/entities/char_2009.gif) :
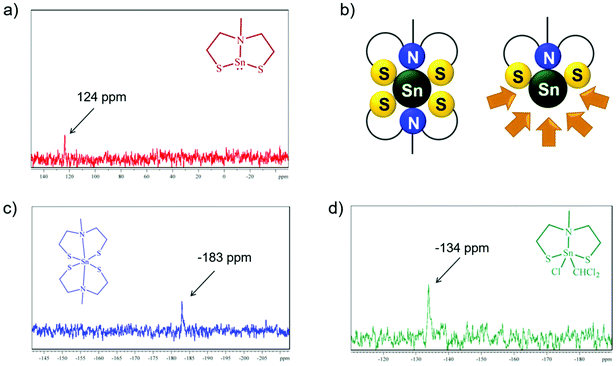
:![[thin space (1/6-em)]](https://www.rsc.org/images/entities/char_2009.gif) 3 in DMSO-d6. Four different carbon signals detected in the 13C APT spectrum correlated with the expected CH2 and CH3 protons. Three C peaks with equal signal orientation were detected as CH2 signals, whereas one opposite orientated C signal displayed the CH3 function of the ethyl group at the bridging nitrogen, confirming the tridentate coordination of the edeta ligand. The 119Sn NMR spectrum of 1, recorded in DMSO-d6, showed a peak at δ 124 ppm, which is typical of a 3-coordinated tin(II) center.45 These observed NMR analytics are in good agreement with the reported data of Tzschach et al.46 Both synthesized compounds show long term stability only in the solid state.
3 in DMSO-d6. Four different carbon signals detected in the 13C APT spectrum correlated with the expected CH2 and CH3 protons. Three C peaks with equal signal orientation were detected as CH2 signals, whereas one opposite orientated C signal displayed the CH3 function of the ethyl group at the bridging nitrogen, confirming the tridentate coordination of the edeta ligand. The 119Sn NMR spectrum of 1, recorded in DMSO-d6, showed a peak at δ 124 ppm, which is typical of a 3-coordinated tin(II) center.45 These observed NMR analytics are in good agreement with the reported data of Tzschach et al.46 Both synthesized compounds show long term stability only in the solid state.
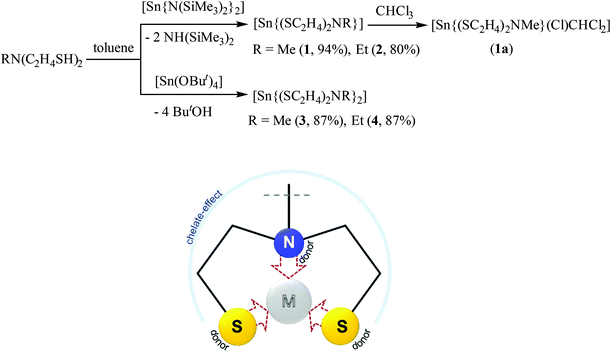 | ||
| Scheme 2 Synthesis of Sn(II) and Sn(IV) complexes 1–4 (above) and the coordination mode of the ligand N-alkyl-diethanethiolamine RN(C2H4SH)2 in these complexes (below). | ||
Crystallization of 1 in solvents like chloroform or pyridine afforded in oxidative addition products, [Sn{(SC2H4)2NMe}(Cl)CHCl2] (1a) and [Sn{(SC2H4)2NMe}2] (3), respectively, resulting from the coordination of a CHCl2− unit and a single chloride Cl− coming from the solvent in 1a or the coordination of a second tridentate mdeta ligand to the tin center in 3. The 1H NMR analysis of 1a in CDCl3 showed a total of 12 protons in an integral ratio of 1![[thin space (1/6-em)]](https://www.rsc.org/images/entities/char_2009.gif) :
:![[thin space (1/6-em)]](https://www.rsc.org/images/entities/char_2009.gif) 3
3![[thin space (1/6-em)]](https://www.rsc.org/images/entities/char_2009.gif) :
:![[thin space (1/6-em)]](https://www.rsc.org/images/entities/char_2009.gif) 2
2![[thin space (1/6-em)]](https://www.rsc.org/images/entities/char_2009.gif) :
:![[thin space (1/6-em)]](https://www.rsc.org/images/entities/char_2009.gif) 2
2![[thin space (1/6-em)]](https://www.rsc.org/images/entities/char_2009.gif) :
:![[thin space (1/6-em)]](https://www.rsc.org/images/entities/char_2009.gif) 4 as compared to 11 protons observed in 1. Clearly, the additional proton in 1a belongs to the CHCl2− unit. The oxidation state as well as the coordination number of the tin center in synthesized complexes can be easily identified from the 119Sn NMR spectrum as shown in Fig. 1a, c and d. While the tridentate coordination of one chelating mdeta ligand to the tin(II) center ensures that one coordination half-sphere of the formed complex is shielded, the other coordination half-sphere is more deshielded, leaving the tin(II) center susceptible to oxidative addition (Fig. 1b). The 119Sn NMR spectrum of 1a displayed a signal at δ −134 ppm, which is consistent with a tin(IV) center in a pentagonal coordination47 (Fig. 1d). On the other hand, the 119Sn NMR spectrum of [Sn{(SC2H4)2NMe}2] (3) showed a peak at δ −183 ppm, which corresponds well to a six-coordinated tin(IV) center (Fig. 1c). Compound 3 has been directly synthesized following a different synthetic route, and will be discussed later. Comparable oxidation reactions have been observed in coordination solvents for compound 2. Therefore, the main characterisation in solution has been performed in C6D6 or DMSO-d6.
4 as compared to 11 protons observed in 1. Clearly, the additional proton in 1a belongs to the CHCl2− unit. The oxidation state as well as the coordination number of the tin center in synthesized complexes can be easily identified from the 119Sn NMR spectrum as shown in Fig. 1a, c and d. While the tridentate coordination of one chelating mdeta ligand to the tin(II) center ensures that one coordination half-sphere of the formed complex is shielded, the other coordination half-sphere is more deshielded, leaving the tin(II) center susceptible to oxidative addition (Fig. 1b). The 119Sn NMR spectrum of 1a displayed a signal at δ −134 ppm, which is consistent with a tin(IV) center in a pentagonal coordination47 (Fig. 1d). On the other hand, the 119Sn NMR spectrum of [Sn{(SC2H4)2NMe}2] (3) showed a peak at δ −183 ppm, which corresponds well to a six-coordinated tin(IV) center (Fig. 1c). Compound 3 has been directly synthesized following a different synthetic route, and will be discussed later. Comparable oxidation reactions have been observed in coordination solvents for compound 2. Therefore, the main characterisation in solution has been performed in C6D6 or DMSO-d6.
The structure of [Sn{(SC2H4)2NMe}(Cl)CHCl2] 1a was solved by single crystal X-ray studies, which showed a five-fold coordination of the tin center in a distorted trigonal bipyramidal environment (Fig. 2). The oxidative addition of chloroform to complex 1 resulting in complex 1a has been reported before, but no crystal structure was described.45,48 A triangular plane is formed by both sulfur atoms from the tridentate mdeta ligand and the carbon atom from the CHCl2− unit. The axial positions of the bipyramid are occupied by the bridging nitrogen and the coordinated chloride. The C6–Sn1–Cl3 angle of around 92° is close to the ideal trigonal bipyramidal angle of 90°. Due to the repulsing effect, both chlorides from the CHCl2− unit are orientated away from the metal center. Therefore, the N1–Sn1–C6 angle (∼96°) is slightly more distorted. Angles of S1–Sn1–Cl3 and S2–Sn1–Cl3, around 92° and 94°, respectively, are slightly smaller than the literature values in the related complexes (98–121°).49 The tridentate coordination of the ligand is comparable to the previously reported coordination motive of MeN(C2H4SH)2.39 The S1–Sn–S2 angle in the equatorial plane is around 121°, which is in good agreement with the literature data.50 The Sn1–S1/2 (2.37–2.38 Å) and Sn1–Cl3 (2.40 Å) bond distances also compare well with the literature.50,51
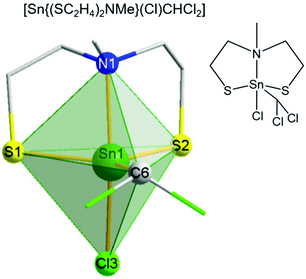 | ||
| Fig. 2 Molecular structure of [Sn{(SC2H4)2NMe}(Cl)CHCl2] 1a. A distorted trigonal–bipyramidal geometry is confirmed by a factor τ of 0.79.51b | ||
The reaction of [Sn(OtBu)4] with two equivalents of each ligand mdetaH2 and edetaH2 resulted in the formation of colorless precipitates. Bis((2,2′-(methylazanediyl)bis(ethane-1-thiolate)) tin(IV) [Sn{(SC2H4)2NMe}2] 3 and bis((2,2′-(ethylazanediyl)bis(ethane-1-thiolate)) tin(IV) [Sn{(SC2H4)2NEt}2] 4 were isolated as colorless crystals from the reaction media and washed several times with n-heptane and toluene, followed by drying under reduced pressure. The NMR spectra in solution showed a total of 22 protons for 3 with three non-equivalent signals in an integral ratio of 6![[thin space (1/6-em)]](https://www.rsc.org/images/entities/char_2009.gif) :
:![[thin space (1/6-em)]](https://www.rsc.org/images/entities/char_2009.gif) 8
8![[thin space (1/6-em)]](https://www.rsc.org/images/entities/char_2009.gif) :
:![[thin space (1/6-em)]](https://www.rsc.org/images/entities/char_2009.gif) 8 and 26 protons for 4 with four inequivalent signals in an integral ratio of 6
8 and 26 protons for 4 with four inequivalent signals in an integral ratio of 6![[thin space (1/6-em)]](https://www.rsc.org/images/entities/char_2009.gif) :
:![[thin space (1/6-em)]](https://www.rsc.org/images/entities/char_2009.gif) 8
8![[thin space (1/6-em)]](https://www.rsc.org/images/entities/char_2009.gif) :
:![[thin space (1/6-em)]](https://www.rsc.org/images/entities/char_2009.gif) 8
8![[thin space (1/6-em)]](https://www.rsc.org/images/entities/char_2009.gif) :
:![[thin space (1/6-em)]](https://www.rsc.org/images/entities/char_2009.gif) 4. For both complexes, the two broad low-field shifted signals referred to the CH2 protons, which was confirmed by 2D H,C NMR measurements. These signals result from the fluctuation of the ligands in solution, indicating that the structure in solution is not rigid and therefore no distinction between each coordinated ligand was observable. Therefore, only two chemically non-equivalent carbon signals correlating with the CH2 proton signals were detected. The sharp singlet at the higher field (δ 2.5 ppm) corresponds to both the methyl functions at each bridging nitrogen for compound 3, confirmed by 2D H,C correlation NMR spectra. The clear triplet at high field (δ 1.1 ppm) was clearly identified as CH3 protons from the ethyl-group located at the bridging nitrogen of complex 4 by 2D H,C correlation spectra. These NMR data are in good agreement with the structural investigations in solution performed by Tzschach et al.46 To the best of our knowledge, to date no crystal structure has been reported for compounds 3 and 4. Therefore, attempts were made to grow suitable crystals of 3 and 4 for single crystal X-ray diffraction studies. The molecular structures of both tin(IV) complexes [Sn{(SC2H4)2NR}2] (R = Me (3), Et (4)) present the tin center in a distorted octahedral environment (Fig. 3a and b). Two of each dianionic ligands (mdeta and edeta) coordinate the metal center in a tridentate fashion, which consequently resulted in an oxidation state of +IV of the tin centers. Complex 3 is an isotype to the already reported molecular structures of [M{(SC2H4)2NMe}2] (M = MoIV, WIV) and crystallizes in the triclinic space group P
4. For both complexes, the two broad low-field shifted signals referred to the CH2 protons, which was confirmed by 2D H,C NMR measurements. These signals result from the fluctuation of the ligands in solution, indicating that the structure in solution is not rigid and therefore no distinction between each coordinated ligand was observable. Therefore, only two chemically non-equivalent carbon signals correlating with the CH2 proton signals were detected. The sharp singlet at the higher field (δ 2.5 ppm) corresponds to both the methyl functions at each bridging nitrogen for compound 3, confirmed by 2D H,C correlation NMR spectra. The clear triplet at high field (δ 1.1 ppm) was clearly identified as CH3 protons from the ethyl-group located at the bridging nitrogen of complex 4 by 2D H,C correlation spectra. These NMR data are in good agreement with the structural investigations in solution performed by Tzschach et al.46 To the best of our knowledge, to date no crystal structure has been reported for compounds 3 and 4. Therefore, attempts were made to grow suitable crystals of 3 and 4 for single crystal X-ray diffraction studies. The molecular structures of both tin(IV) complexes [Sn{(SC2H4)2NR}2] (R = Me (3), Et (4)) present the tin center in a distorted octahedral environment (Fig. 3a and b). Two of each dianionic ligands (mdeta and edeta) coordinate the metal center in a tridentate fashion, which consequently resulted in an oxidation state of +IV of the tin centers. Complex 3 is an isotype to the already reported molecular structures of [M{(SC2H4)2NMe}2] (M = MoIV, WIV) and crystallizes in the triclinic space group P![[1 with combining macron]](https://www.rsc.org/images/entities/char_0031_0304.gif) ,39 whereas complex 4 crystalizes in the monoclinic space group P21/n. The coordination sphere around both Sn centers is completed by the tridentate coordination of two 2,2′-(alkylazanediyl)bis(ethane-1-thiolate) ligands (mdeta and edeta), forming two triangular planes above and underneath the metal center. Each of these triangular planes is built out of two sulfur atoms and the bridging nitrogen atom (plane A, S1–N1–S2; plane B, S3–N2–S4 for 3 and 4, Fig. 3c) from each coordinated ligand. Planes A and B were twisted against each other by an angle of ca. 65° for 3 and 67° for 4, possibly due to the repulsive effect of the alkyl groups at each nitrogen atom and the spatial requirements of the lone pairs present on the sulfur atoms in the ligand backbone. In the molecular structure of both distorted octahedral tin complexes 3 and 4, the sulfur–metal bonds varied over the range of 2.43–2.47 Å, which are consistent with the values reported for other chelating dithiol and nitrogen–dithiol metal complexes (2.39–2.56 Å). The Sn–N bond lengths (2.52–2.57 Å) are a little elongated as compared to literature data (2.37–2.42 Å).49,52,53 The S–Sn–S angles in each coordinated ligand were 110° and 112° for 3 and 4, respectively, which is in agreement with the reported values.49,52 As found for the isotype structures of tungsten and molybdenum,39 each tridentate coordinated ligand formed two five-membered rings with the tin center in 3 and 4 [(1) Sn1–S1–C1–C2–N1), (2) Sn1–S2–C3–C4–N1, Fig. 3d].
,39 whereas complex 4 crystalizes in the monoclinic space group P21/n. The coordination sphere around both Sn centers is completed by the tridentate coordination of two 2,2′-(alkylazanediyl)bis(ethane-1-thiolate) ligands (mdeta and edeta), forming two triangular planes above and underneath the metal center. Each of these triangular planes is built out of two sulfur atoms and the bridging nitrogen atom (plane A, S1–N1–S2; plane B, S3–N2–S4 for 3 and 4, Fig. 3c) from each coordinated ligand. Planes A and B were twisted against each other by an angle of ca. 65° for 3 and 67° for 4, possibly due to the repulsive effect of the alkyl groups at each nitrogen atom and the spatial requirements of the lone pairs present on the sulfur atoms in the ligand backbone. In the molecular structure of both distorted octahedral tin complexes 3 and 4, the sulfur–metal bonds varied over the range of 2.43–2.47 Å, which are consistent with the values reported for other chelating dithiol and nitrogen–dithiol metal complexes (2.39–2.56 Å). The Sn–N bond lengths (2.52–2.57 Å) are a little elongated as compared to literature data (2.37–2.42 Å).49,52,53 The S–Sn–S angles in each coordinated ligand were 110° and 112° for 3 and 4, respectively, which is in agreement with the reported values.49,52 As found for the isotype structures of tungsten and molybdenum,39 each tridentate coordinated ligand formed two five-membered rings with the tin center in 3 and 4 [(1) Sn1–S1–C1–C2–N1), (2) Sn1–S2–C3–C4–N1, Fig. 3d].
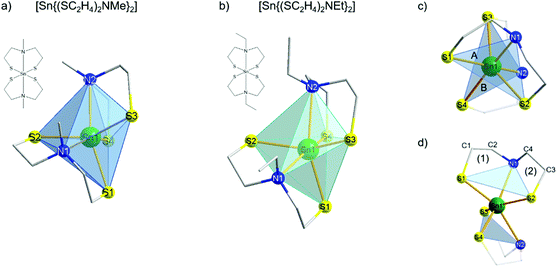 | ||
| Fig. 3 Molecular structures of [Sn{(SC2H4)2NMe}2] 3 (a) and [Sn{(SC2H4)2NEt}2] 4 (b). Polyhedral structures showing two twisted trigonal planes (A and B) above and underneath the tin center (c). Each plane was formed by a tridentate coordinated ligand (d). Selected cell parameters as well as selected bond lengths and angles for 3, 4 and 1a are presented in the ESI (Tables S1 and S2†). | ||
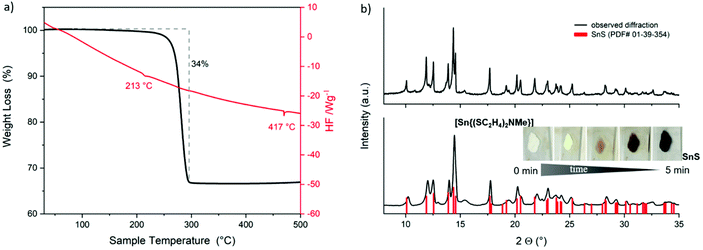
The decomposition behavior of complexes 1 and 3 was investigated by thermogravimetric measurements and simple thermal decomposition experiments under ambient conditions and lower temperatures, meaning controlled decomposition on a heating plate at a maximum of 500 °C. The TG-DSC measurements of 1 up to 500 °C show a one-step decomposition (Fig. 4a). The decomposition process starts at around 210 °C and lasts until 300 °C. The total mass loss of around 33% did not fit completely to the expected mass of SnS (150.8 g mol−1). However, XRD analysis of the nearly black colored residue confirmed the formation of crystalline SnS (Fig. 4b, top, PDF# 01-39-354). Fast thermal decomposition under ambient conditions on a heating plate was indicated by the fast color change of 1 (Fig. 4b, bottom (inset)). The remaining black product was analyzed by XRD measurements, which confirmed the formation of the desired SnS crystal phase (Fig. 4b, bottom). Investigations in solution and in the solid state of 1 as well as the suitable thermal stability and clean decomposition to the target material clearly show the potential application of this molecular compound as a suitable SSP for SnS material preparation. Moreover, the stability of 1 in solution offers a potential application for the target catalytic oxidative addition reactions.54–56
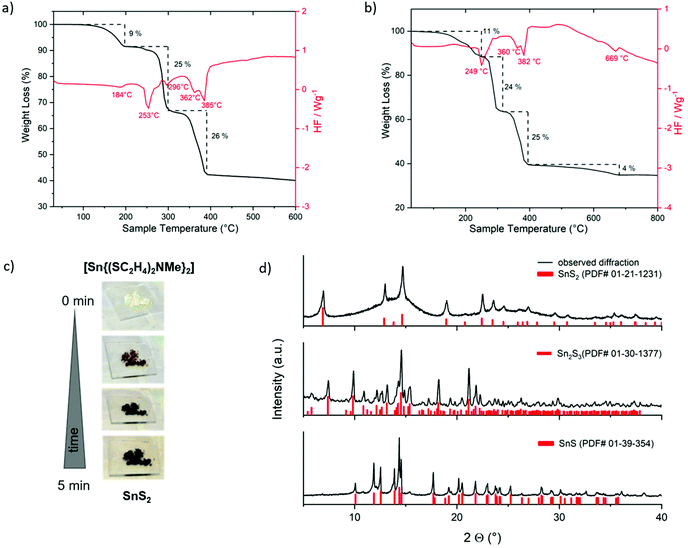
In contrast to the single-step thermal decomposition of Sn(II) compound 1, TG-DSC investigations of the Sn(IV) compound 3 up to 800 °C showed a multistep decomposition with a mass loss of 64%, which corresponds to the mass of SnS (150.8 g mol−1) (Fig. 5b) and have been confirmed by XRD (Fig. 5d, bottom, PDF# 01-39-354). Repeated TG-DSC measurements at lower temperatures up to 600 °C (Fig. 5a) showed again a multistep decomposition with a total mass loss of 60% corresponding to the mass of Sn2S3 (166.8 g mol−1), a mixed Sn(II)–Sn(IV) sulfide crystal phase, as confirmed by XRD measurements (Fig. 5c, middle, PDF# 01-30-1377). Further reduction of decomposition temperatures to 500 °C provided the target SnS2 phase. Fast thermal decomposition of 3 under ambient conditions at around 500 °C led to an immediate color change (Fig. 5c). The obtained nearly black residue was analyzed by XRD measurement to confirm the formation of crystalline SnS2 (PDF# 01-21-1231, Fig. 5d, top) with an estimation of around 75% of amorphous phase formation.
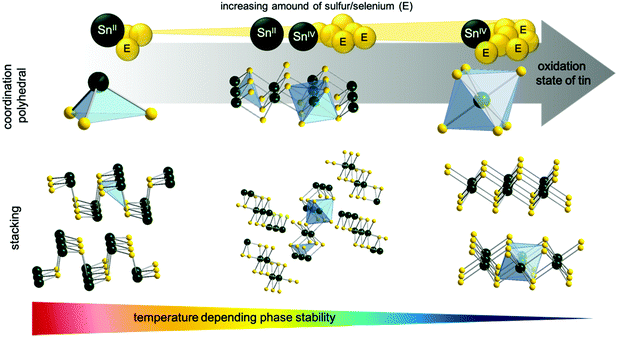
It is remarkable that the synthesized molecular tin precursors 1 and 3 decompose neatly under ambient conditions to the corresponding pure sulfide materials (instead of giving oxidized products). These outstanding properties and behavior of 1 and 3 originate from the extraordinary control of the coordination sphere by using tridentate chelating dithiol ligands. Furthermore, investigations of the isolated different crystal phases (SnS2, Sn2S3, SnS) have been performed by the thermal decomposition of 3. The results regarding their physical properties, special coordination polyhedra and thermal behavior have been compared with the literature. Fig. 6 shows the three stable tin sulfide crystal phases SnE, Sn2E3 and SnE2, their elemental composition as well as their stacking of single tin chalcogenide phases.
Tin has two stable oxidation states Sn(II) and Sn(IV), where their transition is subtle. While SnE2 and SnE have one single oxidation state for tin, Sn2E3 is a multivalent compound containing tin in both stable oxidation states, Sn(II) and Sn(IV). Resulting from the lone pair located at the tin(II) center, SnE forms trigonal pyramids, whereas tin(IV) forms edge-linked octahedra, forming 2D structures for both cases. The Sn2E3 phase containing equal amounts of Sn(II) and Sn(IV) forms chains of alternating Sn(II)-tetrahedron and Sn(IV)-octahedron.9,57 The formation of a specific tin sulfide/selenide phase is temperature-dependent, as clearly demonstrated by the thermal decomposition of the molecular compound 3. Thermodynamically, the most stable phase is SnS, followed by Sn2E3, whereas SnE2 represents the most delicate crystal phase. The formation of the desired tin sulfide phases out of molecular precursor 3 can be set by careful thermal treatment.
Microwave-assisted solvothermal decomposition of 1 for 5 min at 200 W in NMP (N-methyl-2-pyrrolidone) resulted in a flake-like structured material (Fig. S1†), whereas similar decomposition of 3 for 7 min afforded spherical tin sulfide particles (Fig. 7b). The formed nanostructured materials were washed several times with ethanol using the centrifugation method and were further characterized using SEM, TEM (Fig. 7) and XPS analyses (Fig. S2†).
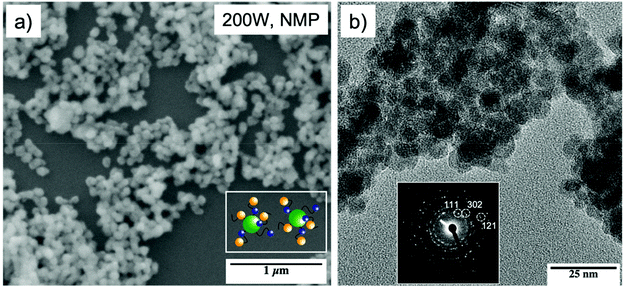 | ||
| Fig. 7 SEM image of tin sulfide particles obtained by the microwave-assisted decomposition of [Sn{(SC2H4)2NMe}2] 3 (inset: scheme of particles with capping ligands) (a), TEM images of 3 and the associated FFT (shown as inset) (b) constant with orthorhombic Sn2S3 (PDF # 01-072-). XPS measurements of the microwave assisted decomposition of 3 (Fig. S2†) showed the partial reduction of the Sn(IV) center, resulting in a mixed product formation of SnS2 and Sn2S3. This was reinforced by measuring the interlayer distance calculated from FFT measurement of TEM analysis amounted to 2.7 Å for (302), 3.4 Å for (111) and 1.8 Å for (121) (b), which is in good agreement with the literature reported d–d spacing of Sn2S3.58–60 In conclusion, the chosen decomposition parameters showed the partial reduction of the Sn(IV) center to Sn(II), resulting in mixed tin sulfide phases. Additionally, XPS analysis indicates that the remaining ligand fragments on the surface of the formed particles act as capping ligands to prevent the particle agglomeration (a inset; Fig. S3†). | ||
2.2. Synthesis and characterization of Sn(II) and Sn(IV) complexes with a N,N-dimethylselenourea ligand and their conversion to nanometric tin selenides
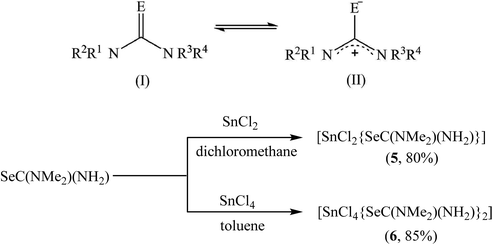
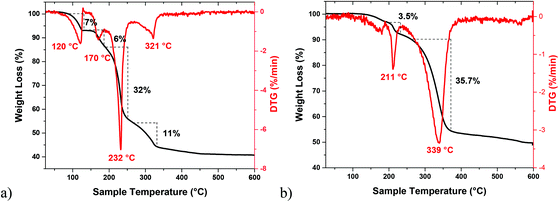
As compared to nanometric metal-sulfides, the precursor chemistry of metal selenide nanomaterials remain less developed, mainly because of the limited commercial availability of selenide ligands.61 We have used previously dialkylselenides R2Se as versatile ligands that afford metal selenide nanoparticles under mild conditions and in high yield.31 However, the limited commercial availability and very high price of these ligands, particularly of tBu2Se which is the most reactive reagent in this series, are the major constraints. Very recently, chalcogenoureas have been shown as economically viable ligands for metal chalcogenide nanomaterials where their reactivity could easily be tailored via substitution on the nitrogen atoms.40,62 As compared to the chalcogenoethers R2E, which almost always behave as neutral chalcogen donor ligands, the chemistry of the chalcogenourea ligand is more versatile because of its ability to display following -one/-ate resonance forms (Scheme 3). For selenourea, the selone tautomeric form (I) has been shown to be the more stable and majority form. Unlike the extensively studied thiourea, the research on selenourea remains underdeveloped. In particular, the precursor chemistry of selenourea is scarce.40 Here, we have explored N,N-dimethylselenourea Me2NC(Se)NH2 (dmsu), which is a commercially available, relatively less expensive and unsymmetrically substituted ligand to provide a desirable reactivity as a reagent for the economical synthesis of 2D metal chalcogenides. The reactions of SnCl2 with 1 equivalent of N,N-dimethyl selenourea (dmsu) in dichloromethane at room temperature produced a colorless precipitate of the composition [SnCl2(dmsu)] (5), as established by the elemental analysis of the powder washed twice with hexane (see the Experimental section). In a similar fashion, the reaction of SnCl4 with 2 equivalents of dmsu in toluene at room temperature proceeded with a change in the solution's color from colorless to yellow and after one hour of stirring, a yellow precipitate was isolated, which was washed twice with hexane and characterized as [SnCl4(dmsu)2] (6) by elemental analysis. The FT-IR spectra of 5 and 6 (Fig. S4†) compare well with the literature data on selenourea complexes,63 which confirm the coordination of the dmsu ligand to the tin center through the selenium atom. Unfortunately, the poor solubility of these complexes in common organic solvents hampered our efforts to grow single crystals for X-ray structure determination as well as prevented in-depth spectroscopy characterization in the solution phase.The suitability of 5 and 6 as precursors to tin selenide materials was determined by thermogravimetric studies performed under an argon atmosphere. Their TG-DTG curves show a multi- or bi-step decomposition behavior lasting up to 350 °C and forming SnSe or SnSe2 as the major end products. The Sn(II) precursor 5 decomposes in several steps, as evident from the four endothermic peaks at 120, 170, 232 and 321 °C in its DTG curve (Fig. 8a). A residual mass of ∼43% at 350 °C is much lower than the expected weight of SnSe as the end product (calculated value ∼58%), indicating that a part of the material is volatalized during the TGA experiment. On the other hand, the Sn(IV) precursor 6 exhibits two distinct steps during decomposition (Fig. 8b), as indicated by the two endothermic peaks at 211 and 339 °C in its DTG curve. The remaining weight of the residue (∼52%) at 400 °C indicates the formation of SnSe2 as the end product (calculated value 51%). Following these TGA studies, a decomposition temperature of 350 °C and oleylamine (b.p. 364 °C) and/or oleic acid (b.p. 360 °C) as solvents were chosen for the decomposition of 5 and 6via the hot-injection method to obtain tin selenide nanoparticles. Besides their high boiling points, the selection of oleylamine and oleic acid as solvents were based on the fact that the affinity of the –NH2/–COOH groups towards the metal center would not only help them to act as coordinating ligands but also the long chain would prevent the growth and agglomeration of the nanostructures due to steric hindrance.64,65
The powder XRD pattern of the black precipitate, obtained after the decomposition of tin(II) complex 5 in a 1![[thin space (1/6-em)]](https://www.rsc.org/images/entities/char_2009.gif) :
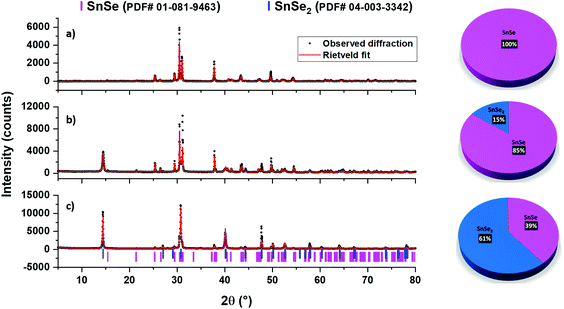
:![[thin space (1/6-em)]](https://www.rsc.org/images/entities/char_2009.gif) 1 mixture of oleic acid (OA) and oleylamine (OLA) and followed by the usual work-up, shows all the peaks indexing well with the file PDF# 01-081-9463 of the SnSe phase (Fig. 9a). No other phase was observed. Achieving phase-pure SnSe selectively is significantly important here because previously using similar reagents i.e. SnCl2·H2O and the dmsu ligand in the spray pyrolysis technique, formation of mixed SnSe/SnSe2 was observed.66 In fact, tin selenide materials are quite sensitive to the reaction conditions and phase problems have often been observed. For example, SnSe2 materials have been exclusively obtained even when using Sn(II) precursors.67
1 mixture of oleic acid (OA) and oleylamine (OLA) and followed by the usual work-up, shows all the peaks indexing well with the file PDF# 01-081-9463 of the SnSe phase (Fig. 9a). No other phase was observed. Achieving phase-pure SnSe selectively is significantly important here because previously using similar reagents i.e. SnCl2·H2O and the dmsu ligand in the spray pyrolysis technique, formation of mixed SnSe/SnSe2 was observed.66 In fact, tin selenide materials are quite sensitive to the reaction conditions and phase problems have often been observed. For example, SnSe2 materials have been exclusively obtained even when using Sn(II) precursors.67
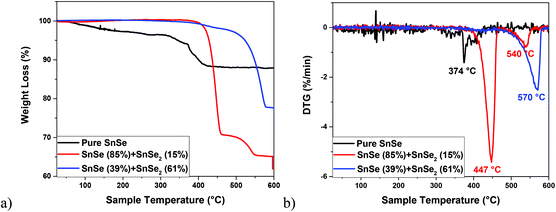
On the other hand, the decomposition of the Sn(IV) complex 6 under similar conditions (i.e., in oleic acid and oleylamine at 350 °C) led to the formation of a black precipitate, the powder XRD pattern of which indicated the presence of a mixture of two phases i.e., SnSe (PDF# 01-081-9463) and SnSe2 (PDF# 04-003-3342) (Fig. 9b). The Rietveld refinement of this XRD pattern indicated the presence of 85% and 15% for the SnSe and SnSe2 phases, respectively. As observed for pure SnSe NPs obtained from 5, the EDX results of the mixed-phase SnSe + SnSe2 NPs also show the presence of Sn, Se, C and N elements, therefore indicating the presence of oleylamine as a capping ligand around tin selenide particles. This observation is further confirmed by FT-IR spectra and TGA studies (Fig. 10 and S5†). The formation of a mix of Sn(II) and Sn(IV) selenides can be attributed to the reducing ability of the oleylamine.68 When 6 was decomposed in oleic acid only, it still produced a mixture of SnSe (PDF# 01-081-9463) and SnSe2 (PDF# 04-003-3342) phases, although the ratio of the SnSe2 phase increased to 61% (Fig. 9c). These results show that even though getting phase selective tin selenide is a delicate act, a thoughtful selection of an appropriate precursor and careful control of the reaction conditions can help in achieving target materials in a reproducible manner. The presence of significant but varying amounts of the capping ligands (oleylamine or oleic acid) around these NPs is confirmed by their TGA–DTG curves, which show a weight loss of 12–35% in the temperature range 370–570 °C (Fig. 10). The higher weight loss in the cases of mixed-phase NPs can partially be attributed to the loss of Se in SnSe2 to convert into the SnSe phase. This is confirmed by the powder XRD studies on the residue left at the end of TGA of the SnSe (39%) + SnSe2 (61%) sample, which shows the presence of 81% SnSe and 19% SnSe2 (Fig. S5†).
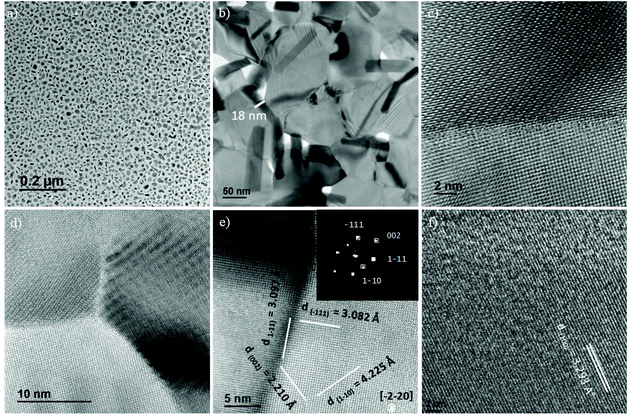
The presence of capping ligands around NPs prevents their agglomeration, as manifested by the TEM images (Fig. 11a). These images displayed the presence of smooth edged hexagonal and rectangular (or irregular) nanoflakes for the sample obtained from the decomposition of 6 in an OA![[thin space (1/6-em)]](https://www.rsc.org/images/entities/char_2009.gif) :
:![[thin space (1/6-em)]](https://www.rsc.org/images/entities/char_2009.gif) OLA (1
OLA (1![[thin space (1/6-em)]](https://www.rsc.org/images/entities/char_2009.gif) :
:![[thin space (1/6-em)]](https://www.rsc.org/images/entities/char_2009.gif) 1 v/v) solvent mixture. The thickness of nanoflakes obtained was about 18 nm (Fig. 11b). The high resolution TEM images show clear lattice fringes, thereby confirming the well-crystalline nature of these nanoflakes (Fig. 11c and d). The FFT analysis of some selected particles revealed them to be the orthorhombic SnSe, which is consistent with the XRD results, showing that this phase is in the vast majority (85%). For instance, the interplanar distances of 2.210, 3.082, 3.097 and 4.225 Å for the particles shown in Fig. 11e, and the associated FFT analysis (inset), were consistent with the (002), (1−11) and (1−10) crystal planes of the orthogonal SnSe (PDF# 04-89-0253) (Fig. 11e). The morphology of the nanoflakes obtained from the decomposition of 6 in OA alone was quite similar to those obtained in the OA
1 v/v) solvent mixture. The thickness of nanoflakes obtained was about 18 nm (Fig. 11b). The high resolution TEM images show clear lattice fringes, thereby confirming the well-crystalline nature of these nanoflakes (Fig. 11c and d). The FFT analysis of some selected particles revealed them to be the orthorhombic SnSe, which is consistent with the XRD results, showing that this phase is in the vast majority (85%). For instance, the interplanar distances of 2.210, 3.082, 3.097 and 4.225 Å for the particles shown in Fig. 11e, and the associated FFT analysis (inset), were consistent with the (002), (1−11) and (1−10) crystal planes of the orthogonal SnSe (PDF# 04-89-0253) (Fig. 11e). The morphology of the nanoflakes obtained from the decomposition of 6 in OA alone was quite similar to those obtained in the OA![[thin space (1/6-em)]](https://www.rsc.org/images/entities/char_2009.gif) :
:![[thin space (1/6-em)]](https://www.rsc.org/images/entities/char_2009.gif) OLA solvent mixture. However, in agreement with the XRD results, the majority of the particles was of the SnSe2 phase. The HR-TEM image of a representative particle shows an interplanar distance of 3.293 Å (Fig. 11f), which is consistent with the (100) crystal plane of SnSe2 (PDF# 04-89-2939; d(100) theor. value = 3.300 Å).
OLA solvent mixture. However, in agreement with the XRD results, the majority of the particles was of the SnSe2 phase. The HR-TEM image of a representative particle shows an interplanar distance of 3.293 Å (Fig. 11f), which is consistent with the (100) crystal plane of SnSe2 (PDF# 04-89-2939; d(100) theor. value = 3.300 Å).
Two representative samples, i.e. single phase (100% SnSe) and mixed-phase (39% SnSe + 61% SnSe2) tin selenide NPs, were further studied by XPS spectroscopy. The survey spectra reveal that in addition to tin and selenium, these NPs also contain a high carbon content due to the presence of capping ligands. In the core level XPS spectra of these two samples (Fig. 12), the 3d5/2 and 3d3/2 peaks for Sn appear at binding energies of 486.8 ± 0.1 and 495.2 ± 0.1 eV, respectively, whereas the corresponding peaks for Se appear at 53.3–54.2 and 54.3–55.1 eV. While the chemical state differentiation between Sn(II) and Sn(IV) is difficult due to overlapping Sn 3d values for these two oxidation states,69 the Se 3d binding energies unequivocally correspond to Se2−.31 No obvious peaks for elemental tin or selenium were observed indicating good purity of the as-synthesized NPs.
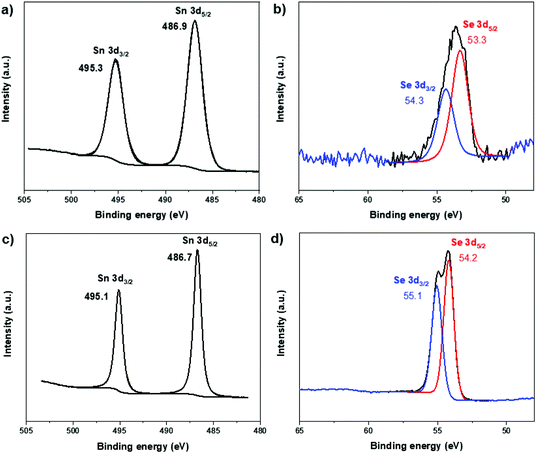 | ||
| Fig. 12 XPS spectra of single phase (100% SnSe) (a and b) and mixed-phase (39% SnSe + 61% SnSe2) (c and d) tin selenide NPs showing binding energies of Sn 3d and Se 3d. | ||
3. Conclusion
Phase selective synthesis of tin chalcogenides, which exhibit a variety of phases (SnE, Sn2E3, and SnE2; E = S, Se) is a delicate task. We exploit here the versatile coordination behavior and facile chalcogenide atom transfer ability of the ligands N-alkyl diethanethiolamine and N,N-dimethyl selenourea to obtain new Sn(II) and Sn(IV) molecular precursors containing direct Sn–E bonds (E = S or Se). These undergo facile decomposition under different conditions (solid/solution phase, thermal/microwave heating, single/mixed solvents, varying temperature, etc.) to afford phase-pure or mixed-phase tin chalcogenide nanostructures with defined ratios. These results show that a thoughtful selection of appropriate precursors and careful control of the reaction conditions can help in achieving target materials in a reproducible manner.Having established molecular routes to tin sulfide and selenide nanoparticles, we are currently working to combine these routes to obtain mixed-anion compounds SnSxSey (where x + y = 1) and SnSSe, which are expected to have novel and exciting properties due to the introduced asymmetry in their structures. Indeed, Guo et al. predicted very recently by means of first-principles calculations high carrier mobility and large absorption coefficients in the visible light region in Janus-like SnSSe materials, which show greater potential for electronic and thermoelectric applications.70
4. Experimental section
All the experiments were performed under an argon or nitrogen atmosphere using standard Schlenk, Stock-type and glovebox techniques. Tin(II) and tin(IV) chloride and 1,1-dimethyl-2-selenourea were procured from Aldrich and used without further purification. Toluene, n-heptane, dichloromethane and tetrahydrofuran (THF) used for the synthesis of metal complexes were dried using MB SPS-800 or standard methods with appropriate desiccating reagents and distilled prior to their use.71Powder X-ray diffraction (XRD) patterns were measured using a Bruker D8 Advance A25 system with Cu Kα1 + 2 (λ = 0.154184 nm) radiation at 50 kV and 35 mA or a STOE-STADI MP diffractometer operating in reflection mode using Mo Kα (λ = 0.71073 Å) radiation. Measured peak patterns were compared to reference powder diffraction files (PDFs). The infrared spectra were recorded either as Nujol mulls on a Bruker Vector 22 FT-IR spectrometer or as dry powders/oils on a PerkinElmer FT-IR spectrometer at room temperature and registered from 4000 to 400 cm−1. NMR spectra were recorded on a Bruker Avance II 300 or Bruker AC-300 spectrometer; chemical shifts are quoted in parts per million relative to external TMS (1H, 13C and 119Sn) recorded in CDCl3 and C6D6. TEM experiments were performed using a JEM-2100F system with 200 kV field emission (FE), a JEOL 2010 LaB6 system and a JEOL JEM-2200FS with 200 kV FE. The tin, sulfur, and selenium contents were determined by inductively coupled plasma optical emission spectroscopy (ICP-OES). Thermogravimetric analyses (TGA) were performed with a TGA/differential scanning calorimetry 1 STARe system from Mettler Toledo under a nitrogen atmosphere (25 mL min−1) at a rate of 5–10 °C min−1 from 30 to 800 °C. Therefore, around 8 mg of the sample was sealed in a 100 μL aluminum crucible in a glovebox or under ambient conditions. Mass spectra were recorded on a Thermo Quest Finnigan MAT 95 (EI, Electron ionization) and conducted with an electron energy of 20 eV or 70 eV at 10−6 mbar. CHN(S) combustion analysis (elemental analysis) were determined with a device by the company HEKAtech of the type CHNS EuroEA 3000 Analyzer or Vario Micro Cube from the company Elementar. An electron spectrometer (Kratos Axis Ultra DLD) with an Al Kα (1486.6 eV) radiation source was used to perform the X-ray photoelectron spectroscopy (XPS) analysis of the samples. Corrections on the constant charging of the XPS spectra were made by C 1s of adventitious carbon (binding energy of 284.6 eV). Data collection for single-crystal X-ray structure elucidation was performed on a STOE IPDS 2T/D8 diffractometer using graphite-monochromated Mo Kα radiation (0.71073 Å). The data were corrected for Lorentz and polarization effects. A numerical absorption correction based on crystal-shape optimization was applied for all data. The programs used in this work are STOE's X-Area, including X-RED72 and X-Shape73 for data reduction and absorption correction, SIR-92 and SHELXL-2014 for structure solution,74,75 and SHELXL74 for structure refinement. CCDC 2104958–2104960† contain the supplementary crystallographic data for this article. Microwave assisted thermal decomposition experiments have been performed with a Discover microwave system from CEM using a fixed power program. The size and morphology of the deposited nanostructures were analyzed using a Nova Nano SEM 430 system, a field-emission scanning electron microscope (SEM).
Complexes 1–6 were synthesized under a nitrogen/argon atmosphere using Schlenk line techniques. Working under reduced pressure means always 1 × 10⁻³ mbar. The ligands N-methyldiethanthiolamine (mdetaH2)38 and N-ethyldiethanthiolamine (edetaH2)76 have been synthesized according to the optimized synthesis routes described elsewhere.
4.1. Synthesis of [Sn{(SC2H4)2NMe}] (1)
To a solution of [Sn(N(SiMe3)2)2] (0.34 g, 0.64 mmol) in 10 mL of toluene 0.10 g of (0.64 mmol) N-methyldiethanthiolamine were added. Upon addition of the ligand to the orange solution a color change was observed immediately, and a slightly yellow precipitate was formed. The reaction mixture was stirred for 30 min at room temperature. Afterwards, the solvent was removed under reduced pressure and the slightly yellow solid was washed several times with n-heptane. After drying under reduced pressure, the product was isolated as a pale yellow solid in a yield of 94% (0.16 g, 0.60 mmol). Calc. for 1 (M. wt 269.0): C, 22.4, H, 4.1, N, 5.2. Found: C, 23.3, H, 4.4, N, 5.2.1H-NMR (DMSOd-6, 300 MHz, RT, ppm): 2.48 (s, 3H, –NCH3), 2.60–2.82 (m, 4H, –SCH2CH2N–), 2.83–2.95 (m, 4H, –SCH2CH2N–).
13C-NMR (DMSO d-6, 75 MHz, RT, ppm): 62.3 (–NCH2CH2S–), 42.7 (–NCH3), 26.8 (–SCH2–CH2N–).
119Sn-NMR (DMSO d-6, 111.9 MHz, RT, ppm): 123.8.
EI-MS (70 eV, 170 °C): m/z (%, fragment) = 269 (78, [SnS2C5H11N]+), 267 (58, [SnS2C5H11N]+), 209 (12, [SnSC3H7N]+), 117 (52, [SC5H11N]+), 116 (24, [SC5H10N]+), 91 (40, [SC3H9N]+), 71 (64, [C4H9N]+), 58 (13, [C3H8N]+), 43 (44, [C2H5N]+).
4.2. Synthesis of [Sn{(SC2H4)2NEt}] (2)
0.56 g (1.27 mmol) of [Sn(N(SiMe3)2)2] was dissolved in 25 mL of dry toluene and 0.24 g (1.46 mmol) of N-ethyldiethanthiolamine was added slowly to it under constant stirring. The orange solution turned directly pale yellow by adding the ligand and a colourless solid was formed. The reaction mixture was stirred for 30 min and the solvent was removed under reduced pressure. The colorless precipitate was washed several times with n-heptane and the product was isolated as a slightly yellow solid in a yield of 80% (0.29 g, 1.02 mmol). Calc. for 4 (M. wt 283.0): C, 25.6, H, 4.7, N, 5.0, S, 22.7. Found: C, 26.4, H, 5.0, N, 4.7, S, 23.9. FT-IR (cm−1): 2911w, 2835s.1H-NMR (CDCl3, 300 MHz, RT, ppm): (300 MHz, DMSO-d6): δ [ppm] = 2.91 (m, 2H, –N–CH2CH3), 2.82 (m, 4H, –S–CH2–CH2–NR2), 2.68 (m, 4H, –S–CH2–CH2–NR2), 1.00 (t, 3H, N–CH2CH3).
13C-NMR (CDCl3, 75 MHz, RT, ppm): (75 MHz, DMSO-d6): δ [ppm] = 51.2 (–S–CH2–CH2–NR2), 47.1 (–N–CH2CH3), 25.3 (–S–CH2–CH2–NR2), 8.3 (N–CH2CH3).
EI-MS: (70 eV, 184 °C): m/z (%, fragment) = 283 (31, [SnS2C6H13N]+), 281 (25, [SnS2C6H13N]+), 223 (8, [SnSC4H9N]+), 163 (69, [SnC2H5N]+), 130 (65, SC6H12N]+), 116 (54, [SC5H9N]+), 102 (100, [SC4H8N]+), 84 (21, [C5H10N]+), 71 (41, [C4H9N]+), 56 (35, [C3H6N]+), 42 (37, [C2H8]+), 28 (26, [C2H4]+), 18 (77, [H2O]+).
4.3. Synthesis of [Sn{(SC2H4)2NMe}2] (3)
To a solution of [Sn(OtBu)4] (0.13 g, 0.30 mmol) in 10 mL of toluene 0.09 g (0.6 mmol) of N-methyldiethanthiolamine were added, while a colorless precipitate was immediately formed. The reaction mixture was stirred for 30 min at room temperature before the solvent was removed under reduced pressure. The colorless crystalline product was washed several times with n-heptane and dried under reduced pressure. The crystalline product was isolated in a yield of 87% (0.11 g, 0.26 mmol). Calc. for 3 (M. wt 418.0): C, 28.8, H, 5.3, N, 6.7. Found: C, 29.2, H, 5.2, N, 6.2. FT-IR (cm−1): 2967w, 2836w.1H-NMR (CDCl3, 300 MHz, RT, ppm): 2.43 (s, 6H, –NCH3), 2.71 (m, 4H, –NCH2CH2S–), 2.87 (m, 4H, –NCH2CH2S–).
13C-NMR (CDCl3, 75 MHz, RT, ppm): 25.4 (–SCH2CH2N–), 43.9 (–NCH3), 57.6 (–SCH2CH2N).
119Sn-NMR (CDCl3, 111.9 MHz, RT, ppm): −182.5.
4.4. Synthesis of [Sn{(SC2H4)2NEt}2] (4)
0.51 g (1.2 mmol) of tin tert-butoxide and 10 ml of toluene were filled in a round flask. 0.40 g (2.4 mmol) of N-ethyl-diethanolthioamine were added under stirring and the solution turned directly colourless. The mixture was stirred for 15 min. The solvent was removed under reduced pressure and the colourless product was isolated with a yield of 87% (0.45 g, 1.0 mmol calc. for 2 (M. wt 446.0): C, 32.4, H, 5.9, N, 6.3. Found: C, 32.5, H, 5.8, N, 6.0. FT-IR (cm−1): 2979–2886s, 2846w.1H-NMR (CDCl3, 300 MHz, RT, ppm): 3.10–2.86 (m, 12H, CH3–CH2–N–(CH2–CH2–S–)2), 2.75–2.72 (m, 8H, –N–(CH2–CH2–S–)2), 1.06 (t, 6H, CH3–CH2–N–).
13C-NMR (CDCl3, 75 MHz, RT, ppm): 53.69 (–N–CH2–CH2–S–), 48.74 (CH3–CH2–N–), 26.26 (–N–CH2–CH2–S–), 8.42 (CH3–CH2–N–).
4.5. Synthesis of [SnCl2(dmsu)] (5)
The addition of dmsu (0.14 g, 0.96 mmol) to SnCl2·H2O (0.22 g, 0.96 mmol) solution in CH2Cl2 led to the formation of an off-white colored precipitate. The solution was stirred for two hours under an Ar atmosphere at room temperature to ensure the completion of the reaction. The off-white powder obtained was washed twice with hexane. Yield, 0.2 g (80%). Calc. for 5 (M. wt 339.7): C, 10.59, H, 2.35, N, 8.24, Sn, 35.03; Se, 23.25. Found: C, 10.53, H, 2.39, N, 8.20, Sn, 34.35%; Se, 23.11%. FT-IR (Nujol, cm−1): 3428 m, 3380w, 3168w, 2925s, 2723w, 1714s, 1640 m, 1456 m, 1376 m, 1157w, 1040w, 722 m.1H-NMR (CDCl3, 300 MHz, RT, ppm): 3.37 (s, 6H, Me), 6.20 (s, 2H, NCH2).
4.6. Synthesis of [SnCl4(dmsu)2] (6)
The addition of dmsu (0.36 g, 2.35 mmol) to SnCl4 (0.30 g, 1.17 mmol) solution in toluene led to an instant precipitation and change in the color, first to green and then to milky yellow. The solution was stirred for two hours under an Ar atmosphere at room temperature and the yellow powder was separated by filtration. Yield, 0.56 g (85%). Calc. for 6 (M. wt 560.7): C, 12.84, H, 2.85, N, 9.99, Sn, 21.22%; Se, 31.74%. Found: C, 10.79, H, 2.80, N, 9.87, Sn, 21.10%; Se, 31.07%. FT-IR (Nujol, cm−1): 2927s, 1715 m, 1623 m, 1464s, 1384s, 1162w, 1045w, 719w.1H-NMR (CDCl3, 300 MHz, RT, ppm): 3.39 (s, 12H, Me), 6.23 (s, 4H, NCH2).
4.7. Decomposition of 5
Solution (A) consisting of 2 mL each of oleic acid and oleylamine was taken in a 3-neck flask connected to a condenser, stirred and heated to 350 °C. Separately, another solution (B) was prepared by dissolving 5 (0.15 g, 1.29 mmol) in 2 mL of each oleic acid and oleylamine, and injected at once into the preheated solution (A). The resulting reaction mixture was refluxed for one hour and the black precipitate obtained was washed 3 times with ethanol and pentane, and dried at room temperature. Yield, 0.12 g. FT-IR (Nujol, cm−1): 2920 m, 2847w, 2361 m, 2337w, 928w.4.8. Decomposition of 6
Using the above method, decomposition of 6 (0.20 g, 0.35 mmol) in a 1![[thin space (1/6-em)]](https://www.rsc.org/images/entities/char_2009.gif) :
:![[thin space (1/6-em)]](https://www.rsc.org/images/entities/char_2009.gif) 1 solution of oleic acid and oleyl amine at 350 °C gave a black precipitate (0.04 g) which was washed 3 times with ethanol and pentane, and then dried at room temperature. FT-IR (Nujol, cm−1): 3308 m, 2920s, 2847s, 1641s, 1556 m, 1470 m, 959 m, 719w.
1 solution of oleic acid and oleyl amine at 350 °C gave a black precipitate (0.04 g) which was washed 3 times with ethanol and pentane, and then dried at room temperature. FT-IR (Nujol, cm−1): 3308 m, 2920s, 2847s, 1641s, 1556 m, 1470 m, 959 m, 719w.
Author contributions
The conceptualization, formal analysis and synthetic work, investigation, visualization, and writing have been carried out by V. Brune; A. Sutorius contribute with synthetic work and formal analysis of complex 4; M. Wilhelm performed the XPS analysis for the tin sulfide part; C. Hegemann provided the molecular structures of compounds 1a, 3 and 4; F. Hartl contributed to writing and editing the introduction part concerning the tin sulfides; resources have been provided by the University of Cologne. For review of the writing and editing U. Atatmürk was responsible. S. Mathur accomplished the scientific supervision, editing of the text and project administration. S. Mishra conceived and supervised the work on the tin selenide part, did some patch-up experimental work, and wrote the manuscript. N. Raydan, B. Purohit and S. Gahlot synthesized and characterized the precursors and the NPs. P. Bargirla and L. Burel performed the XPS and TEM measurements, respectively. All authors discussed the results and commented on the final manuscript.Both 1st authors (V. Brune and N. Rayan) agree to the shared authorship. Both have contributed equally on this manuscript.
Conflicts of interest
There are no conflicts of interest to declare.Acknowledgements
The authors kindly acknowledge the financial support obtained in the framework of a DFG project, “Development of new precursors for chemical vapor deposition” (MA 2359/43-1). The authors thank for the financial and infrastructural support provided by the University of Cologne (UoC) and Université Claude Bernard Lyon 1, CNRS and the Auvergne-Rhone-Alpes Region (SCUSI 2017 009361 01) for partial financial support to N. R. We also thank Y. Aizac (XRD) and P. Mascunan (elemental analyses) of IRCELYON, as well as N. Tosun (TEM), Chr. Schmitz and D. Pullem (elemental analysis) from UoC for providing timely analysis.References
- M. Kumar, S. Rani, Y. Singh, K. S. Gour and V. N. Singh, RSC Adv., 2021, 11, 6477–6503 RSC.
- M. Guc, J. Andrade-Arvizu, I. Y. Ahmet, F. Oliva, M. Placidi, X. Alcobé, E. Saucedo, A. Pérez-Rodríguez, A. L. Johnson and V. Izquierdo-Roca, Acta Mater., 2020, 183, 1–10 CrossRef CAS.
- V. R. Minnam Reddy, S. Gedi, B. Pejjai and C. Park, J. Mater. Sci.: Mater. Electron., 2016, 27, 5491–5508 CrossRef CAS.
- D. J. Lewis, P. Kevin, O. Bakr, C. A. Muryn, M. A. Malik and P. O'Brien, Inorg. Chem. Front., 2014, 1, 577–598 RSC.
- S. S. Hegde, A. G. Kunjomana, K. A. Chandrasekharan, K. Ramesh and M. Prashantha, Phys. B, 2011, 406, 1143–1148 CrossRef CAS.
- H. Kawamoto, N. Higashitarumizu, N. Nagamura, M. Nakamura, K. Shimamura, N. Ohashi and K. Nagashio, Nanoscale, 2020, 12, 23274–23281 RSC.
- J. M. Gonzalez and I. I. Oleynik, Phys. Rev. B, 2016, 94, 1–10 Search PubMed.
- J. M. Skelton, L. A. Burton, F. Oba and A. Walsh, J. Phys. Chem. C, 2017, 121, 6446–6454 CrossRef CAS PubMed.
- L. A. Burton, D. Colombara, R. D. Abellon, F. C. Grozema, L. M. Peter, T. J. Savenije, G. Dennler and A. Walsh, Chem. Mater., 2013, 25, 4908–4916 CrossRef CAS.
- L. A. Burton and A. Walsh, J. Phys. Chem. C, 2012, 116, 24262–24267 CrossRef CAS.
- J. Kim, J. Kim, S. Yoon, J. Kang, C. Jeon and W. Jo, J. Phys. Chem. C, 2018, 122, 3523–3532 CrossRef CAS.
- F. Y. Ran, Z. Xiao, Y. Toda, H. Hiramatsu, H. Hosono and T. Kamiya, Sci. Rep., 2015, 5, 10428 CrossRef PubMed.
- G. Duvjir, T. Min, T. Thi Ly, T. Kim, A. T. Duong, S. Cho, S. H. Rhim, J. Lee and J. Kim, Appl. Phys. Lett., 2017, 110, 262106 CrossRef.
- B. Qin, W. He and L. D. Zhao, J. Materiomics, 2020, 6, 671–676 CrossRef.
- N. E. Makori, I. A. Amatalo, P. M. Karimi and W. K. Njoroge, Am. J. Condens. Matter Phys., 2014, 4, 87–90 Search PubMed.
- U. Chalapathi, B. Poornaprakash and S. H. Park, Sol. Energy, 2016, 139, 238–248 CrossRef CAS.
- B. Ul Haq, S. AlFaify, R. Ahmed, F. K. Butt, A. Laref and M. Shkir, Phys. Rev. B, 2018, 97, 1–12 CrossRef.
- A. Sanchez-Juarez and A. Ortíz, Semicond. Sci. Technol., 2002, 17, 931–937 CrossRef CAS.
- (a) R. H. Williams, R. B. Murray, D. W. Govan, J. M. Thomas and E. L. Evans, J. Phys. C: Solid State Phys., 1973, 6, 3631 CrossRef CAS; (b) M. Schlüter and M. L. Cohen, Phys. Rev. B: Solid State, 1976, 14, 424–431 CrossRef.
- S. Pulipaka, A. K. S. Koushik, N. Boni, M. Deepa and P. Meduri, Int. J. Hydrogen Energy, 2019, 44, 11584–11592 CrossRef CAS.
- S. R. Damkale, S. S. Arbuj, G. G. Umarji, R. P. Panmand, S. K. Khore, R. S. Sonawane, S. B. Rane and B. B. Kale, Sustainable Energy Fuels, 2019, 3, 3406–3414 RSC.
- Y. Sun, H. Cheng, S. Gao, Z. Sun, Q. Liu, Q. Leu, F. Lei, T. Yao, J. He, S. Wei and Y. Xie, Angew. Chem., Int. Ed., 2012, 51, 8727–8731 CrossRef CAS PubMed.
- H. S. Song, S. L. Li, L. Gao, Y. Xu, K. Ueno, J. Tang, Y. B. Cheng and K. Tsukagoshi, Nanoscale, 2013, 5, 9666–9670 RSC.
- T. S. Pan, D. De, J. Manongdo, A. M. Guloy, V. G. Hadjiev, Y. Lin and H. B. Peng, Appl. Phys. Lett., 2013, 103 Search PubMed.
- J. Z. Ou, W. Ge, B. Carey, T. Daeneke, A. Rotbart, W. Shan, Y. Wang, Z. Fu, A. F. Chrimes, W. Wlodarski, S. P. Russo, Y. X. Li and K. Kalantar-zaden, ACS Nano, 2015, 9, 10313–10323 CrossRef CAS PubMed.
- Ó. L. C. Moreira, W. Y. Cheng, H. R. Fuh, W. C. Chien, W. Yan, H. Fei, H. Xu, D. Zhang, Y. Chen, Y. Zhao, Y. Lv, G. Wu, C. Lv, S. K. Arora, C. Ó. Coileáin, C. Heng, C.-R. Chang and H.-C. Wu, ACS Sens., 2019, 4, 2546–2552 CrossRef PubMed.
- M. A. Malik, M. Afzaal and P. O'Brien, Chem. Rev., 2010, 110, 4417–4446 CrossRef CAS PubMed (and references therein).
- M. D. Khan, M. Aamir, M. Sohail, M. Sher, N. Baig, J. Akhtar, M. A. Malik and N. Revaprasadu, Dalton Trans., 2018, 47, 5465–5473 RSC.
- S. C. Smith, W. Bryks and A. R. Tao, Langmuir, 2019, 35, 2887–2897 CrossRef CAS PubMed.
- (a) S. Mishra and S. Daniele, Chem. – Eur. J., 2020, 26, 9292–9303 CrossRef CAS PubMed; (b) I. Bretos, R. Jimenez, J. Ricote and M. L. Calzada, Chem. Soc. Rev., 2018, 47, 291–308 RSC; (c) C. Panda, P. W. Menezes and M. Driess, Angew. Chem., Int. Ed., 2018, 57, 11130–11139 CrossRef CAS PubMed; (d) S. Mishra and S. Daniele, Chem. Rev., 2015, 115, 8379–8448 CrossRef CAS PubMed.
- (a) S. Gahlot, B. Purohit, E. Jeanneau and S. Mishra, Chem. – Eur. J., 2021, 27, 10826–10832 CrossRef CAS PubMed; (b) S. Gahlot, E. Jeanneau, D. Singh, P. K. Panda, Y. K. Mishra, R. Ahuja, G. Ledoux and S. Mishra, Inorg. Chem., 2020, 59, 7727–7738 CrossRef CAS PubMed; (c) S. Gahlot, F. Dappozze, D. Singh, R. Ahuja, L. Cardenas, L. Burel, D. Amans, C. Guillard and S. Mishra, Dalton Trans., 2020, 49, 3580–3591 RSC; (d) S. Gahlot, E. Jeanneau, F. Dappozze, C. Guillard and S. Mishra, Dalton Trans., 2018, 47, 8897–8905 RSC; (e) S. Mishra, D. Du, E. Jeanneau, F. Dappozze, C. Guillard, J. Zhang and S. Daniele, Chem. – Asian J., 2016, 11, 1658–1663 CrossRef CAS PubMed.
- (a) Y. Li, H. Xie and J. Tu, Mater. Lett., 2009, 63, 1785–1787 CrossRef CAS; (b) D. Feng, Z.-H. Ge, Y.-X. Chen, J. Li and J. He, Nanotechnology, 2018, 28, 455707 CrossRef PubMed; (c) J. Sheng, X. Liu, C. Niu, Y. Sun, Y. Chen, H. Wang, B. Zhang, G. Wang, X. Zhou and G. Han, J. Mater. Chem. C, 2020, 8, 10333–10341 RSC; (d) B. Pejjai, V. R. Minnam Reddy, K. Seku, M. R. Pallavolu and C. Park, New J. Chem., 2018, 42, 4843–4853 RSC; (e) Y. Liu, D. Hou and G. Wang, Chem. Phys. Lett., 2003, 379, 67–73 CrossRef CAS; (f) P. Ramasamy, P. Manivasakan and J. Kim, CrystEngComm, 2015, 17, 807–813 RSC.
- (a) R. K. Mishra, G. W. Baek, K. Kim, H. I. Kwon and S. H. Jin, Appl. Surf. Sci., 2017, 425, 923–931 CrossRef CAS; (b) G. M. Kumar, F. Xiao, P. Ilanchezhiyan, S. Yuldashev and T. W. Kang, RSC Adv., 2016, 6, 99631–99637 RSC.
- F. Davitt, H. G. Manning, F. Robinson, S. L. Hawken, S. Biswas, N. Petkov, M. van Druenen, J. J. Boland, G. Reid and J. D. Holmes, Adv. Mater. Interfaces, 2020, 7, 1–10 CrossRef.
- L. Zhao, M. Yosef, M. Steinhart, P. Göring, H. Hofmeister, U. Gösele and S. Schlecht, Angew. Chem., Int. Ed., 2005, 45, 311–315 CrossRef PubMed.
- J. S. Narro-Rios, M. Ramachandran, D. Martínez-Escobar and A. Sánchez-Juárez, J. Semicond., 2013, 34, 2–6 Search PubMed.
- J. R. Thompson, I. Y. Ahmet, A. L. Johnson and G. Kociok-Köhn, Eur. J. Inorg. Chem., 2016, 2016, 4711–4720 CrossRef CAS.
- V. Brune, M. Grosch, R. Weißing, F. Hartl, M. Frank, S. Mishra and S. Mathur, Dalton Trans., 2021, 50, 12365–12385 RSC.
- V. Brune, C. Hegemann and S. Mathur, Inorg. Chem., 2019, 58, 9922–9934 CrossRef CAS PubMed.
- M. P. Campos, M. P. Hendricks, A. N. Beecher, W. Walravens, R. A. Swain, G. T. Cleveland, Z. Hens, M. Y. Sfeir and J. S. Owen, J. Am. Chem. Soc., 2017, 139, 2296–2305 CrossRef CAS PubMed.
- M. Friebe, A. Mahmood, H. Spies, R. Berger, B. Johannsen, A. Mohammed, M. Eisenhut, C. Bolzati, A. Davison and A. G. Jones, J. Med. Chem., 2000, 43, 2745–2752 CrossRef CAS PubMed.
- M. Sun, C.-Y. Hong and C.-Y. Pan, J. Am. Chem. Soc., 2012, 134, 20581–20584 CrossRef CAS PubMed.
- C. D. Chandler, G. D. Fallon, A. J. Koplick and B. O. West, Aust. J. Chem., 1987, 40, 1427–1439 CrossRef CAS.
- C. D. Schaeffer, L. K. Myers, S. M. Coley, J. C. Otter and C. H. Yoder, J. Chem. Educ., 1990, 67, 347–349 CrossRef CAS.
- A. Tzschach, M. Scheer and K. Jurkschat, Z. Anorg. Allg. Chem., 1984, 512, 177–180 CrossRef CAS.
- A. Tzschach, M. Scheer, K. Jurkschat and A. Zschunke, Z. Anorg. Allg. Chem., 1983, 502, 158–164 CrossRef CAS.
- A. Tzschach, M. Scheer and K. Jurkschat, Z. Anorg. Allg. Chem., 1984, 508, 73–78 CrossRef CAS.
- A. Abo-Amer, M. S. McCready, F. Zhang and R. J. Puddephatt, Can. J. Chem., 2012, 90, 46–54 CrossRef CAS.
- G. Bandoli, A. Dolmella, V. Peruzzo and G. Plazzogna, Inorg. Chim. Acta, 1992, 193, 185–190 CrossRef CAS.
- G. Bandoli, A. Dolmella, V. Peruzzo and G. Plazzogna, Inorg. Chim. Acta, 1993, 209, 231–234 CrossRef CAS.
- (a) A. A. Someşan, I. Barbul, S. M. Vieriu, R. A. Varga and C. Silvestru, Dalton Trans., 2019, 48, 6527–6538 RSC; (b) A. W. Addison, T. N. Rao, J. Reedijk, J. van Rijn and G. C. Verschoor, J. Chem. Soc., Dalton Trans., 1984, 7, 1349–1356 RSC.
- E. López-Torres, A. R. Cowley and J. R. Dilworth, Inorg. Chem. Commun., 2007, 10, 724–727 CrossRef.
- A. Verchère, S. Mishra, E. Jeanneau, H. Guillon, J. M. Decams and S. Daniele, Inorg. Chem., 2020, 59, 7167–7180 CrossRef PubMed.
- D. S. McGuinness, D. B. Brown, R. P. Tooze, F. M. Hess, J. T. Dixon and A. M. Z. Slawin, Organometallics, 2006, 25, 3605–3610 CrossRef CAS.
- A. Jabri, C. Temple, P. Crewdson, S. Gambarotta, I. Korobkov and R. Duchateau, J. Am. Chem. Soc., 2006, 128, 9238–9247 CrossRef CAS PubMed.
- D. S. McGuinness, P. Wasserscheid, W. Keim, D. Morgan, J. T. Dixon, A. Bollmann, H. Maumela, F. Hess and U. Englert, J. Am. Chem. Soc., 2003, 125, 5272–5273 CrossRef CAS PubMed.
- K. Chung, D. Wamwangi, M. Woda, M. Wuttig and W. Bensch, J. Appl. Phys., 2008, 103, 083523 CrossRef.
- M. Cruz, J. Morales, J. P. Espinos and J. Sanz, J. Solid State Chem., 2003, 175, 359–365 CrossRef CAS.
- H. Liu and L. Chang, J. Alloys Compd., 1992, 185, 183–190 CrossRef CAS.
- J. Ru, T. He, B. Chen, Y. Feng, L. Zu, Z. Wang, Q. Zhang, T. Hao, R. Meng, R. Che, Ch. Zhang and J. Yang, Angew. Chem., 2020, 132, 14729–14735 CrossRef.
- M. D. Khan, M. A. Malik and N. Revaprasadu, Coord. Chem. Rev., 2019, 388, 24–47 CrossRef CAS (and references therein).
- M. P. Hendricks, M. P. Campos, G. T. Cleveland, I. J.-L. Plante and J. S. Owen, Science, 2015, 348, 1226–1230 CrossRef CAS PubMed.
- D. Fregona, G. Fragalia and S. Sitran, Main Group Met. Chem., 1995, 18, 269–277 CAS.
- S. Mourdikoudis and L. M. Liz-Marzan, Chem. Mater., 2013, 25, 1465–1476 CrossRef CAS.
- R. Li, X. Fang, J. Ren, B. Chen, X. Yuan, X. Pan, P. Zhang, L. Zhang, D. Tu, Z. Fang, X. Chen and Q. Ju, Nanoscale, 2021, 13, 12494–12504 RSC.
- D. Martínez-Escobar, M. Ramachandran, A. Sánchez-Juárez and J. Sergio Narro Rios, Thin Solid Films, 2013, 535, 390–393 CrossRef.
- J. Choi, J. Jin, I. G. Jung, J. M. Kim, H. J. Kim and S. U. Son, Chem. Commun., 2011, 47, 5241 RSC.
- A. Tyagi, G. Karmakar, A. Wadawale, A. Y. Shah, G. Kedarnath, A. P. Srivastava, V. Singh and V. K. Jain, J. Organomet. Chem., 2018, 873, 15–21 CrossRef CAS.
- (a) D. Lu, C. Yue, S. Luo, Z. Li, W. Xue, X. Qi and J. Zhong, Appl. Surf. Sci., 2021, 541, 148615 CrossRef CAS; (b) L. Das, A. Guleria and S. Adhikari, RSC Adv., 2015, 5, 61390 RSC.
- S.-D. Guo, X.-S. Guo, R.-Y. Han and Y. Deng, Phys. Chem. Chem. Phys., 2019, 21, 24620–24628 RSC.
- S. Hünig, P. Kreitmeier, G. Märkl and J. Sauer, Arbeitsmethoden in Der Organischen Chemie, Verlag Lehmanns, Berlin, 2006.
- STOE X-RED32, 2002 Search PubMed.
- STOE X-SHAPE, 1999 Search PubMed.
- C. B. Hübschle, G. M. Sheldrick and B. Dittrich, J. Appl. Crystallogr., 2011, 44, 1281–1284 CrossRef PubMed.
- G. M. Sheldrick, Acta Crystallogr., Sect. C: Struct. Chem., 2015, 71, 3–8 Search PubMed.
- N. Salvarese, F. Refosco, R. Seraglia, M. Roverso, A. Dolmella and C. Bolzati, Dalton Trans., 2017, 46, 9180–9191 RSC.
Footnote |
| † Electronic supplementary information (ESI) available. CCDC 2104958–2104960. For ESI and crystallographic data in CIF or other electronic format see DOI: 10.1039/d1dt02964a |
| This journal is © The Royal Society of Chemistry 2021 |

