 Open Access Article
Creative Commons Attribution 3.0 Unported Licence
Thermodynamic properties of sodium aluminosilicate hydrate (N–A–S–H)†
Brant
Walkley‡
 ab,
Xinyuan
Ke‡
 ac,
Oday
Hussein
a and
John L.
Provis
 *a
*a
aDepartment of Materials Science and Engineering, The University of Sheffield, Sheffield S1 3JD, UK. E-mail: j.provis@sheffield.ac.uk
bDepartment of Chemical and Biological Engineering, The University of Sheffield, Sheffield S1 3JD, UK
cDepartment of Architecture and Civil Engineering, University of Bath, Bath BA2 7AY, UK
First published on 7th September 2021
Abstract
This study presents for the first time a systematic investigation of the thermodynamic properties of sodium aluminosilicate hydrate (N–A–S–H), through dissolution of pure synthetic N–A–S–H gels. Changes to the chemical composition and gel structure of N–A–S–H were determined via characterisation of the solid phase before and after dissolution by multinuclear solid state nuclear magnetic resonance spectroscopy, scanning electron microscopy coupled with energy dispersive X-ray spectroscopy, and X-ray diffraction measurements. The correlations between the bulk Si/Al ratio of the N–A–S–H phase and its thermodynamic properties were studied by characterisation of the aqueous phase and calculation of solubility constants. The solubility of synthetic N–A–S–H was compared with the solubility of metakaolin-based geopolymers with similar bulk Si/Al ratios. The solubility (log10![[thin space (1/6-em)]](https://www.rsc.org/images/entities/char_2009.gif) Ksp) of both the synthetic N–A–S–H gels and metakaolin-based geopolymers showed a close to linear correlation with the bulk Si/Al ratio of the phase. Lower solubility was observed for N–A–S–H gels and geopolymers with a higher bulk Si/Al ratio. This new insight is fundamental to understanding the physiochemical properties of geopolymers, and provides essential information for predicting their long-term stability and durability.
Ksp) of both the synthetic N–A–S–H gels and metakaolin-based geopolymers showed a close to linear correlation with the bulk Si/Al ratio of the phase. Lower solubility was observed for N–A–S–H gels and geopolymers with a higher bulk Si/Al ratio. This new insight is fundamental to understanding the physiochemical properties of geopolymers, and provides essential information for predicting their long-term stability and durability.
1. Introduction
Geopolymers consist primarily of an amorphous, three dimensional aluminosilicate gel framework, and have attracted increasing attention for industrial application due to their chemical and thermal resistance, ability to immobilise hazardous cations in cementitious wasteforms, and suitability as low-cost and sustainable materials for refractory, construction, biomaterials, zeolite synthesis, and fibre composite applications.1–5 Geopolymers are typically produced by reaction of aluminosilicate mineral precursors, such as metakaolin, fly ash, and rice husk ashes, with alkaline hydroxide or alkaline silicate solutions.1 The main reaction product in these systems is a sodium aluminosilicate hydrate (N–A–S–H) and/or potassium aluminosilicate hydrate (K–A–S–H) gel, where silicon and the majority of aluminium atoms are in tetrahedral coordination, and the negative charge due to tetrahedrally coordinated Al3+ is balanced by the monovalent alkali cations.1The chemical composition (primarily the bulk Si/Al ratio) and the structural ordering of the framework alkali aluminosilicate hydrates play important roles in determining the macro-scale physical and chemical properties. Higher mechanical strength was observed from metakaolin-based geopolymers with bulk Si/Al ratio between 1.5 to 2, likely due to formation of a dense microstructure.6,7 Geopolymer gels produced using sodium-based activators showed higher thermal conductivity than those produced using potassium-based activators, while changes in the bulk Si/Al ratio resulted in negligible influence.8 The fundamental explanation of these experimental observations is likely related to the thermodynamic properties of the N–A–S–H and/or K–A–S–H gels. Additionally, as promising materials for conditioning of radioactive waste,3,9,10 the mass transport processes (particularly in relation to incorporated heavy metals) within geopolymers and the solubility of the alkali aluminosilicate gel framework play crucial roles in determining the long-term chemical stability of the wasteform. However, there are few systematic studies regarding the solubility of alkali aluminosilicate gels in the literature. This study therefore investigates the thermodynamic properties (solubility) of N–A–S–H gels with different bulk Si/Al ratios.
Two methods have commonly been used to determine the solubility of solid mineral phases: co-precipitation from an over-saturated solution and dissolution of pre-synthesised pure phases.11 Wilkin et al. used high purity natural minerals to determine the solubility of analcime and clinoptilolite.12 Rozov et al. measured the solubility of hydrotalcite–pyroaurite solid solutions using a group of synthetic pure phases with varying Fe/Al ratios.13 Many more examples are found in the literature determining solubilities and related thermodynamic properties of phases (e.g. calcium silicate hydrate, calcium monocarboaluminate, magnesium silicate hydrate) that play critical roles in the chemistry of cement.14–16 However, solubility studies of amorphous alkaline aluminosilicate gels are extremely limited in the literature. Gomez-Zamorano et al. synthesized sodium aluminosilicate hydrate gels using co-precipitation methods, and then determined the solubility of these synthetic gels from dissolution experiments at 25 °C.17 Williamson et al. precipitated sodium aluminosilicate hydrate gels from super-saturated solution and determined the solubility of these precipitated gels using the aqueous solution at precipitation equilibrium.18 But since this study was carried out at 50 °C instead of 25 °C, direct comparison with the aforementioned study by Gomez-Zamorano et al. is challenging. Furthermore, these existing studies have omitted detailed characterisation of the structural ordering and bulk Si/Al ratios in the alkali aluminosilicate hydrate gel before and after the solubility tests, and the initial bulk solid compositions were used for calculating the solubilities. However, if preferential precipitation or incongruent dissolution occurred, the bulk chemical composition of the solid phase at dissolution equilibrium from either the co-precipitation or the dissolution process will differ from the initial bulk solids composition.
In addition to the possible changes of bulk chemical compositions during dissolution experiments, structural ordering of the solid phase can also change. This is of particular concern for metastable amorphous materials, such as the amorphous alkali aluminosilicate hydrate ((N,K)–A–S–H) phases, where the transition to more ordered or crystallised structure may occur under alkaline conditions.19,20 Detailed characterisation of the alkali aluminosilicate gel atomic structure before and after solubility tests has not been previously reported. For N–A–S–H gel, the use of solid state 27Al and 29Si magic angle spinning (MAS) and 1H–29Si cross polarisation (CP) MAS nuclear magnetic resonance spectroscopy (NMR) techniques can provide such quantitative information.5
In this study, the solubility of solid N–A–S–H gels with different bulk Si/Al compositions was determined by dissolution of these solid phases. Both synthetic N–A–S–H gels and metakaolin-based geopolymers (mainly comprising an amorphous N–A–S–H gel) were used as the solid phases. For each experiment, the aqueous solution after dissolution was characterised by inductively coupled plasma optical emission spectroscopy and pH measurements, and the solid phase before and after the dissolution tests were characterised using X-ray diffraction, solid state 27Al MAS and 1H–29Si CP MAS NMR and scanning electron microscopy coupled with energy dispersive X-ray spectroscopy (SEM-EDX). The potential changes in crystallinity or structural ordering of the framework aluminosilicate in these solid phases were assessed, and the solubility of both the synthetic N–A–S–H gels and the metakaolin-based geopolymers were calculated using the Gibbs energy minimisation software GEMS v3.3 (http://gems.web.psi.ch/GEMS3/) and the extended Debye–Hückel model.21
2. Experimental methods
2.1. Sample preparation
Synthetic alkali aluminosilicate gels were produced by alkali-activation of synthetic aluminosilicate precursor powders, which were synthesised using an organic steric entrapment solution–polymerisation method.22 This method uses polyvinyl alcohol to sterically inhibit movement of aqueous cations to produce a homogeneous, amorphous reactive aluminosilicate precursor. Detailed analysis of the physicochemical characteristics of the aluminosilicate precursors and phase evolution and nanostructural development of gels of similar composition synthesised using this method over the course of 224 days has been previously published.22–24The activating solution was prepared by dissolution of sodium silicate pentahydrate powder (Na2SiO3·5H2O, Sigma Aldrich) in distilled water. Stoichiometry was designed to obtain an activating solution modulus of SiO2/Na2O = 1, an activator dose such that Na2O/Al2O3 = 1 in the final reaction mixture and the nominal chemical composition and water/solids (w/s) ratios outlined in Table 1. The activating solution was mixed with the synthetic aluminosilicate precursor powders to form a homogeneous paste which was subsequently cast in sealed containers cured at 20 °C ± 2 °C for 28 days.
| Sample | Si/Al | Na/Al | H2O/Na2O | w/s |
|---|---|---|---|---|
| NASH-1 | 1.0 | 1.0 | 11 | 0.75 |
| NASH-1.5 | 1.5 | 1.0 | 14 | 0.75 |
| NASH-2 | 2.0 | 1.0 | 17 | 0.75 |
| GP-1 | 1.0 | 1.0 | 11 | 0.40 |
| GP-1.5 | 1.5 | 1.0 | 11 | 0.40 |
Alkali aluminosilicate hydrate gels were also produced by reaction of metakaolin (MetaStar 501, Imerys, composition as determined by X-ray fluorescence provided in Table 2) with a sodium silicate activating solution. The activating solution was prepared by dissolution of sodium hydroxide powder (AnalaR 99 wt%) in sodium silicate (PQ-NS, 44.1 wt%, PQ UK) and distilled water. Stoichiometry was designed to obtain an activating solution modulus of SiO2/Na2O = 1, an activator dose and water content such that Na2O/Al2O3 = 1 and Na2O/H2O = 11 in the final reaction mixture and the nominal chemical composition and w/s ratios outlined in Table 1. The activating solution was mixed with metakaolin to form a homogeneous paste which was subsequently cast in sealed containers cured at 20 °C ± 2 °C for 1 year.
| Na2O | Al2O3 | SiO2 | P2O5 | K2O | CaO | TiO2 | Fe2O3 | LOI |
|---|---|---|---|---|---|---|---|---|
| 0.3 | 44.4 | 52.6 | 0.1 | 0.2 | <0.05 | 1.0 | 0.61 | 0.8 |
2.2. Solubility measurements
Solubility data were obtained by dispersing the powdered alkali aluminosilicate hydrate gels in MilliQ water (EMD Millipore Corporation, [Na] = 0.034 mg L−1, [Al] = 0.001 mg L−1, [Si] ≤ 0.005 mg L−1 and [Ca] = 0.375 mg L−1) in airtight PTFE bottles at a liquid/solid ratio of 100. The alkali aluminosilicate hydrate gels were ground by hand in a mortar and pestle, washed in MilliQ water to remove any remnant activating solution, vacuum filtered and sieved to a particle size of 106–250 μm prior to dispersion in MilliQ water. The solutions were held at 25 °C (298 K) with bottles inverted and shaken once a day. The solid and liquid phases were separated after 1, 3, 7, 14, 28 and 90 days by filtration using a polymer vacuum filter (pore size 0.22 μm) followed by vacuum drying in a desiccator.2.3. Characterisation
![[thin space (1/6-em)]](https://www.rsc.org/images/entities/char_2009.gif) π/6 should be used. 29Si MAS NMR spectra were acquired using a 5.5 μs non-selective (π/2) excitation pulse, a measured 60 s relaxation delay, a total of 512 scans and spinning at 12.5 kHz. 29Si cross-polarisation (CP) MAS NMR experiments were performed using the same instrument with a spinning frequency of 12.5 kHz, a 29Si non-selective (π/2) pulse width of 5.5 μs, an initial 1H non-selective (π/2) pulse width of 2.5 μs, a recycle delay of 1.25 s and Hartmann-Hahn contact periods of 2.0 ms. A nominal 1H decoupling field strength of 80 kHz was employed during acquisition and 5120 scans were collected per experiment. All 29Si and 27Al spectra were referenced to pure tetramethylsilane (TMS) and 1.0 M aqueous Al(NO3)3, respectively, at 0 ppm.
π/6 should be used. 29Si MAS NMR spectra were acquired using a 5.5 μs non-selective (π/2) excitation pulse, a measured 60 s relaxation delay, a total of 512 scans and spinning at 12.5 kHz. 29Si cross-polarisation (CP) MAS NMR experiments were performed using the same instrument with a spinning frequency of 12.5 kHz, a 29Si non-selective (π/2) pulse width of 5.5 μs, an initial 1H non-selective (π/2) pulse width of 2.5 μs, a recycle delay of 1.25 s and Hartmann-Hahn contact periods of 2.0 ms. A nominal 1H decoupling field strength of 80 kHz was employed during acquisition and 5120 scans were collected per experiment. All 29Si and 27Al spectra were referenced to pure tetramethylsilane (TMS) and 1.0 M aqueous Al(NO3)3, respectively, at 0 ppm.
Gaussian peak profiles were used to deconvolute the 29Si MAS and 1H–29Si CPMAS NMR spectra.25 The minimum number of peaks possible were fitted, and the isotropic chemical shift (δiso) and peak full width at half maximum (FWHM) of each resonance were required to be consistent in both the 29Si MAS NMR and 1H–29Si CP MAS NMR spectral deconvolutions. Peak intensities were required to be consistent with the structural constraints described by the thermodynamics of a statistical distribution of Si and Al sites within a Q4 aluminosilicate network for (N,K)–A–S–H gel products.26 Previous work utilising 29Si and 27Al MAS NMR and Fourier transform infrared spectroscopy has shown that these models best describe the environments in which Si and Al exist in (N,K)–A–S–H gels.23,26–29
2.4. Calculation of solubility constants of N–A–S–H gels
The activities of the dissolved ionic species measured by ICP-OES were calculated using the Gibbs energy minimisation software GEMS v3.3. The extended Debye–Hückel model21 was used to calculate the ionic activities, as shown in eqn (1), where γi is the activity coefficient, Zi is the charge of the ith aqueous species, and A (kg0.5 mol−0.5) and B (kg0.5 mol−0.5 cm−1) are the temperature and pressure dependent electrostatic parameters. | (1) |
It was assumed that the aqueous phase is NaOH dominant, where the average ion size and parameter for common short-range interactions of charged species (a and b as shown in eqn (1)) are 3.31 Å and 0.098 kg mol−1.21 The xiw value represents the molar quantity of water and the Xw represents the total molar amount of the aqueous phase. I is the total ionic strength of the aqueous solution, which was calculated using eqn (2), where Ci is the concentration of the ith ionic species.
 | (2) |
The activities of the ionic species were calculated using eqn (3), where [mi] represents the concentration of ionic species mi, and {mi} represents the activity of ionic species mi.
| {mi} = [mi]·γi | (3) |
3. Results and discussion
3.1. Characterisation of the solid phase
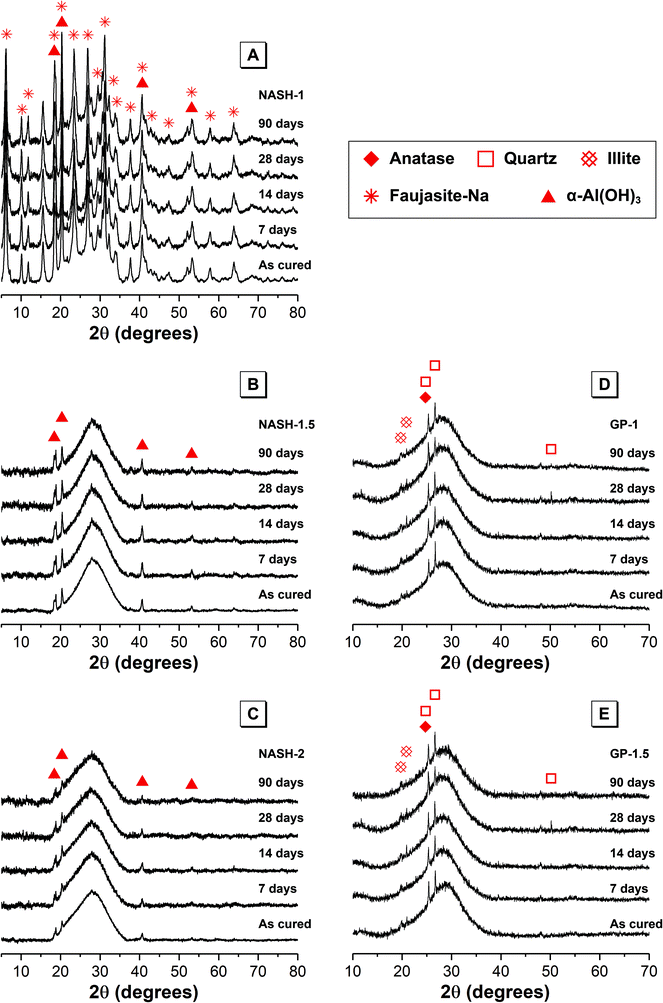 | ||
| Fig. 1 X-ray diffraction data for each synthetic alkali aluminosilicate gel (samples NASH-1, NASH-1.5 and NASH-2) and each geopolymer gel (samples GP-1 and GP-1.5) as marked. | ||
XRD data for the alkali aluminosilicate and geopolymer gels also displays a dominant broad feature due to diffuse scattering centred at approximately 29° 2θ, indicating the formation of an amorphous reaction product. The shape and intensity of this diffuse scattering is consistent with that previously observed for a N–A–S–H type gel formed during alkali-activation of metakaolin.3,5,30,31 Reflections due to anatase, quartz and hydroxylated muscovite are also visible in the XRD data for each geopolymer gel and indicate that these phases are present to at least some extent within unreacted anhydrous metakaolin in each of the geopolymer samples.
XRD data for each of the synthetic alkali aluminosilicate gels also exhibits reflections due to bayerite (α-Al(OH)3, monoclinic, PDF # 00-074-1119), while XRD data for the synthetic NASH-1 sample exhibits broadened reflections due to synthetic faujasite–Na (2Na·3.5[Al7Si17O48]·32(H2O), PDF # 38-0238). The formation of faujasite–Na is not unexpected due to the presence of a substantial amount of nanocrystalline zeolites within the amorphous gel matrix,31 and the broadened nature of the reflections due to faujasite–Na suggest that this phase exhibits some level of long range disorder. There are no observable changes in the XRD data for samples immersed in water for up to 90 days (marked 7, 14, 28 and 90 days in Fig. 1), indicating that any structural alteration of the N–A–S–H gel or crystalline phases that has occurred during dissolution has not affected the long range ordering to the extent that it is observable by XRD.
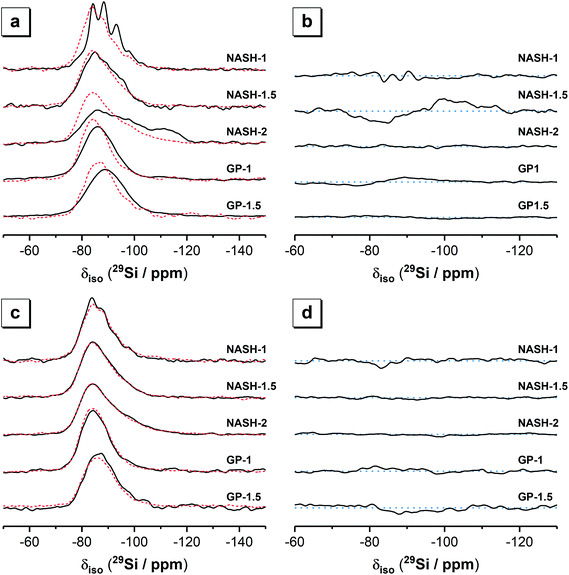
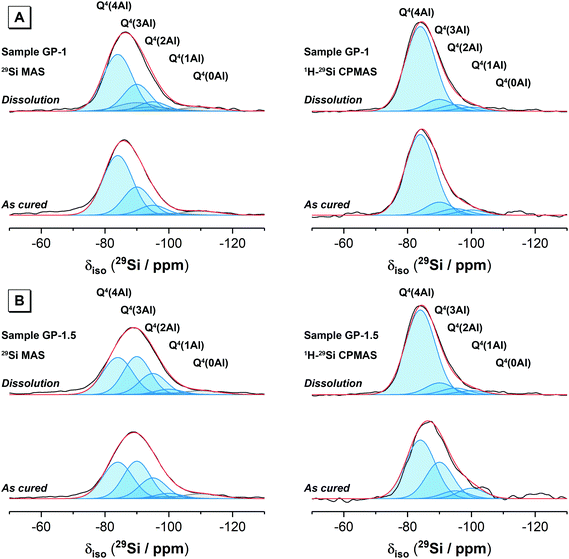
3.1.3.1. 29Si MAS and 1H–29Si CP MAS NMR. The 29Si MAS and 1H–29Si CP MAS NMR spectra for the synthetic alkali aluminosilicate and geopolymer gels are shown in Fig. 4. 29Si MAS NMR data for the synthetic aluminosilicate precursor has been published previously and exhibits a broad resonance δiso = −80.0 to −125.0 ppm with maximum intensity at δiso = −110.0 ppm containing contributions from Q4(4Al), Q4(3Al) Q4(2Al) Q4(1Al) and Q4(0Al) at δiso = −85.4 ppm, −88.8 ppm, −96.0 ppm, −101.0 ppm and −110.5 ppm, respectively.2229Si MAS NMR data for anhydrous metakaolin has also been published previously and also exhibits a single broad resonance at δiso = −80.0 to −125.0 ppm with maximum intensity at δiso = −107.0 ppm containing contributions from a distribution of Q4(mAl) environments (where 0 ≤ m ≤ 4), with the maximum intensity at δiso = −107.0 ppm indicating that this distribution is dominated by species with lower Al substitution (Q4(0Al) and Q4(1Al) sites).
The 29Si MAS NMR spectra of the synthetic alkali aluminosilicate and geopolymer gels each exhibit a broad resonance spanning from δiso = −75.0 to −110.0 ppm and centred between δiso = −85.0 ppm and −89.0 ppm (depending on the nominal Si/Al ratio). This broad resonance spanning from δiso = −75.0 to −110.0 ppm in all samples is attributed to a distribution of Q4(mAl) environments within a N–A–S–H gel, with the shift in the position of maximum intensity indicating that the data for samples with a higher nominal Si/Al ratio contain a greater contribution from low Al-substituted Si sites. The lineshape of the distribution of δiso is generally consistent across all samples with the exception of the NASH-1 sample, which also exhibits narrower resonances at δiso = −84.0, −88.2, −93.2, −98.0 and −107.0 ppm attributed to the faujasite–Na phase.34,35 The high intensity of 29Si MAS NMR resonances at −84.0 and −88.0 ppm resulting from the faujasite–Na phase formed in the NASH-1 sample indicate that this phase contains a relatively high amount of Al (Si/Al ≤ 1.25),34 consistent with the nominal composition of this sample (Si/Al = 1). Quartz (identified by XRD) will also contribute to the 29Si MAS NMR spectrum of the geopolymer gels GP-1 and GP-1.5 at approximately δiso = −110.0 (±3) ppm due to resonance of Q4(0Al) sites,36–38 however due to the extensive 29Si relaxation times (on the order of 1 hour)36,37 and the extensive disorder of Si sites in these samples the Q4(0Al) site in quartz cannot be resolved unambiguously in the spectra presented here. 29Si MAS NMR data for illite exhibits resonances within the region δiso = −85.0 to −95.0 ppm39 and therefore this phase will contribute to this region in the spectra presented here for geopolymer gel samples GP-1 and GP-1.5.
The 1H–29Si CP MAS NMR spectra of all samples (Fig. 4) exhibits a broad resonance spanning from δiso = −75.0 to −105.0 ppm with maximum intensity at δiso = −84.0 ppm to −86.0 ppm (depending on the nominal Si/Al ratio of the sample), again with a consistent lineshape of the distribution of δiso across all samples. The 1H–29Si CP MAS NMR signal is sensitive to the internuclear distance between the Si atoms and nearby protons, such that 1H–29Si CP MAS NMR signal of Si atoms in closest proximity to protons is preferentially enhanced40 and this data therefore indicates those Si species within the hydrated reaction product. Consequently, it is possible to differentiate between resonances resulting from hydrated Si species in the (N,K)–A–S–H gel and anhydrous Si species in remnant unreacted precursor particles. The maximum intensity at δiso = −84.0 ppm to −86.0 ppm in the 1H–29Si CP MAS NMR spectra of each sample indicates that the hydrated (N,K)–A–S–H gel contains primarily Q4(4Al) Si sites and that a significant amount of unreacted precursor particles are present in each sample.
The 29Si MAS and 1H–29Si CP MAS NMR spectra for each sample (Fig. 4) are nearly identical for each sample immersed in water for 28 days, indicating that all Si sites within the remaining material are hydrated to a similar extent. The synthetic alkali aluminosilicate gels NASH-1, NASH-1.5 and NASH-2 exhibit slightly more low Al-substituted Si sites than the geopolymer samples GP-1 and GP-1.5. There appears to be very little difference between the 1H–29Si CP MAS NMR spectra for each sample before and after dissolution, suggesting minimal structural changes to Si sites in the N–A–S–H gel after immersion in water for 28 days.
Difference 29Si MAS and 1H–29Si CP MAS NMR spectra for each sample (Fig. 4) provide information about the net consumption (indicated by regions of negative intensity) and net production (indicated by regions of positive intensity) of different Si species within the N–A–S–H gel and precursor phases during dissolution (immersion in water). Difference 1H–29Si CP MAS NMR spectra show minimal dissolution of the N–A–S–H gel has occurred after being immersed in water for 28 days, with an effectively flat line (within the spectral noise) being observed for each sample. Difference 29Si CP MAS NMR spectra show significant alteration of the relative amount of Si sites in synthetic alkali aluminosilicate gels NASH-1 and NASH-1.5 after being immersed in water for 28 days, with net consumption of Q4(4Al) and Q4(3Al) Si sites and net production of Q4(1Al) and Q4(0Al) Si sites, consistent with leaching of Al from the precursor phases. The synthetic alkali aluminosilicate gel C and geopolymer gels and GP-1.5 show negligible alteration of the relative amount of Si sites after immersion in water for 28 days, while geopolymer gel GP-1 shows a small net consumption of Q4(4Al) and Q4(3Al) Si sites and a small net production of Q4(1Al) and Q4(0Al) Si sites, again consistent with leaching of Al from the precursor phase. Together these results show that samples with lower nominal Si/Al ratio (i.e. higher Al content) are more susceptible to leaching of Al from the precursor phases, but the relative amount of Si sites in the N–A–S–H gel appears to be stable after immersion in water for 28 days.
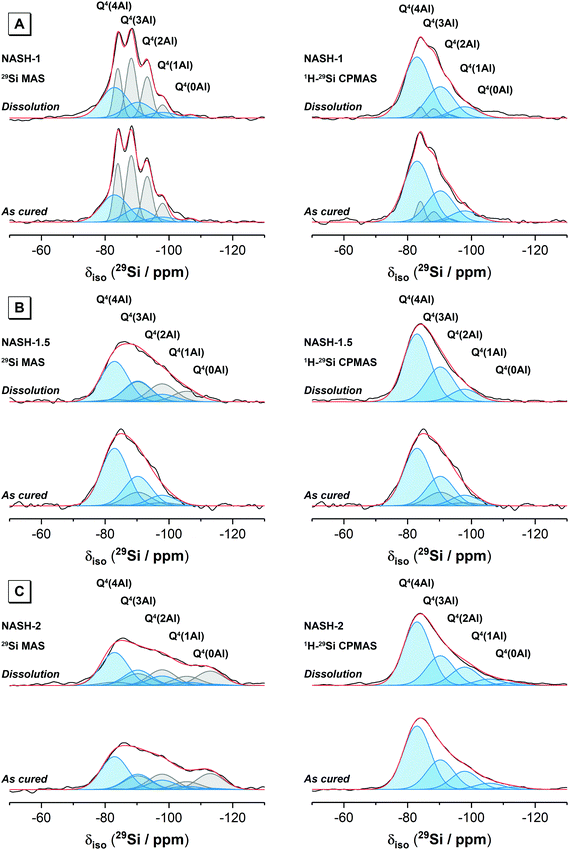
Deconvolution and quantification of the 29Si MAS and 1H–29Si CPMAS NMR data for the as-cured samples was performed by initially fitting individual peaks (Gaussian distributions) to simulate the 1H–29Si CPMAS NMR data for each as-cured samples. The contribution from the resonances observed in the 1H–29Si CPMAS NMR data were then accounted for in the single pulse 29Si MAS NMR data by fitting peaks at those positions observed in the 1H–29Si CPMAS NMR data, with the remaining intensity fitted with resonances due to Si sites in remnant precursor particles. A comparison of the 1H–29Si CPMAS NMR data for the as-cured sample and those immersed in water for 28 days showed negligible differences, indicating that the relative proportions of Q4(mAl) Si species are unaltered between these samples (and suggesting that if dissolution of Si sites in the N–A–S–H gel has occurred, it has been congruent). The ratio of the intensities of resonances of the Si sites in the N–A–S–H gel in the 29Si MAS NMR data for the as-cured samples and those immersed in water for 28 days will therefore be the same. The 29Si MAS NMR data for the samples immersed in water for 28 days were therefore fitted with a scaled component spectrum comprising the individual peaks observed in the 29Si MAS NMR data for the as-cured samples, with the remaining intensity fitted with resonances due to Si sites in precursor phases. The difference between the relative integral area of each resonance assigned to the precursor phases in the as-cured samples and those immersed in water for 28 days then indicates the changes in the amount of each Si site before and after dissolution.
Deconvolution and quantification of the 29Si MAS and 1H–29Si CPMAS NMR data (Fig. 5 and 6, Table 3 and Table S1, ESI†) identify the presence of Si environments in the synthetic alkali aluminosilicate gels resonating at δiso = −82.9, −90.6 ppm, −97.8 ppm, −105.6 ppm and −112 ppm, attributed to Q4(4Al), Q4(3Al), Q4(2Al), Q4(1Al) and Q4(0Al) sites, respectively, and the presence of Si environments in the geopolymer gels resonating at δiso = −84.0 ppm, −90.0 ppm, −95.0 ppm, −100.0 ppm and −110.0 ppm, again attributed to Q4(4Al), Q4(3Al), Q4(2Al), Q4(1Al) and Q4(0Al) sites, respectively. These sites are all assigned to a fully polymerised, Al-rich (Si/Al ≤ 1.3) N–A–S–H gel.26 The molar Si/Al ratio of the (N,K)–A–S–H gel may be calculated from the normalised relative integral areas, IA, of the resonances in the 29Si MAS NMR spectral deconvolutions of each Q4(mAl) site within the N–A–S–H gel (i.e. excluding resonances due to Q4(mAl) sites within remnant anhydrous precursor phases) using Engelhardt's formula41 (eqn (4)).
 | (4) |
| N–A–S–H sites | Precursor sites | ||||||||||
|---|---|---|---|---|---|---|---|---|---|---|---|
| Q4(4Al) | Q4(3Al) | Q4(2Al) | Q4(1Al) | Q4(0Al) | Q4(4Al) | Q4(3Al) | Q4(2Al) | Q4(1Al) | Q4(0Al) | ||
| NASH-1 | δ iso (ppm) | −82.9 | −90.6 | −97.9 | −105.6 | −112.9 | −84.0 | −88.2 | −93.2 | −98.0 | −107.0 |
| FWHM (ppm) | 10 | 10 | 10 | 10 | 10 | 3 | 4 | 4 | 4 | 4 | |
| NASH-1.5 | δ iso (ppm) | −82.9 | −90.6 | −97.9 | −105.6 | −112.9 | −82.9 | −90.6 | −97.9 | −105.6 | −112.9 |
| FWHM (ppm) | 10 | 10 | 10 | 10 | 10 | 10 | 10 | 10 | 10 | 10 | |
| NASH-2 | δ iso (ppm) | −82.9 | −90.6 | −97.9 | −105.6 | −112.9 | −82.9 | −90.6 | −97.9 | −105.6 | −112.9 |
| FWHM (ppm) | 10 | 10 | 10 | 10 | 10 | 10 | 10 | 10 | 10 | 10 | |
| GP-1 | δ iso (ppm) | −84.0 | −90.0 | −95.0 | −100.0 | −110.0 | −85.0 | −90.0 | −95.0 | −100.0 | −110.0 |
| FWHM (ppm) | 11 | 10 | 10 | 10 | 10 | 14 | 14 | 14 | 14 | 14 | |
| GP-1.5 | δ iso (ppm) | −84.0 | −90.0 | −95.0 | −100.0 | −110.0 | −85.00 | −90.0 | −95.0 | −100.0 | −110.0 |
| FWHM (ppm) | 11 | 10 | 10 | 10 | 10 | 14 | 14 | 14 | 14 | 14 | |
Eqn (4) requires that Loewenstein's rule is obeyed such that there are no Al–O–Al bonds present (or their content is negligible). This assumption has been shown to be valid by application of 17O 3QMAS NMR spectroscopy to synthetic alkali aluminosilicate gels with Si/Al > 1,24 and can therefore be safely assumed here where the nominal Si/Al ratio is such that 2.0 ≥ Si/Al ≥ 1.0 for each alkali aluminosilicate gel. Each N–A–S–H gel exhibits a Si/Al = 1.13 to 1.30. The calculated Si/Al ratio for each sample is higher than that of the initial reaction mixtures for samples NASH-1 and GP-1, and lower than that of the initial reaction mixtures for samples NASH-1.5, NASH-2 and GP-1.5. This indicates that all samples exhibit a tendency to form an Al-rich N–A–S–H gel of similar composition, with Si/Al = 1.13 to 1.30, despite different initial reaction mixture compositions. The Si/Al ratio of each sample after immersion in water for 28 days remains unchanged from that of the as-cured samples, indicating no significant alteration in relative Si and Al content of the gel has occurred, consistent with the difference 29Si MAS and 1H–29Si CPMAS NMR data discussed above.
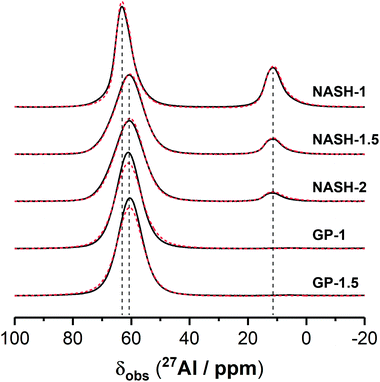
3.1.3.2. 27Al MAS NMR. Previously published work has shown that the 27Al MAS NMR spectrum for the synthetic aluminosilicate precursors exhibits broad resonances due to disordered tetrahedral Al environments as well as pentahedral and octahedral coordination within mullite-like environments,42 while the 27Al MAS NMR spectrum for the synthetic anhydrous metakaolin displays three broad resonances exhibiting distributions of δobs with maximum intensity at δobs = 56, 33 and 8 ppm, respectively, attributed to Al in tetrahedral, pentahedral and octahedral coordination.5,43–45
The 27Al MAS NMR spectrum for the NASH-1 sample exhibits a broad tetrahedral Al resonance spanning from δobs = 70 to 55 ppm and centred at δobs = 63.0 ppm while that for each of the synthetic alkali aluminosilicate gels NASH-1.5 and NASH-2 and geopolymer gels GP-1 and GP-1.5 each exhibits a broad tetrahedral Al resonance spanning from δobs = 70 to 50 ppm and centred at δobs = 60.5 ppm. This tetrahedral Al resonance in all samples is attributed to Al within a fully polymerised tetrahedral (q4) site in a N–A–S–H type gel,24,46 with the negative charge arising from the substitution of Al3+ for Si4+ balanced by Na+ ions. The lineshape and width of the distribution of δobs for this resonance are identical across samples NASH-1.5, NASH-2, GP-1 and GP-1.5. Al in tetrahedral sites within faujasite–Na will also contribute to the 27Al MAS NMR spectrum for sample NASH-1,35 resulting in the slightly different lineshape and maximum intensity towards higher δobs when compared with the other samples. The presence of Al in exclusively tetrahedral coordination for the samples GP-1 and GP-1.5 is expected due to the presence of excess alkali cations47 and indicates that all Al within metakaolin has reacted, suggesting preferential dissolution of Al during alkali activation.
The 27Al MAS NMR spectra for all synthetic alkali aluminosilicate gels exhibits a broad octahedral Al resonance spanning from δobs = 15 to 5 ppm and centred at δobs = 11.0 ppm and is attributed to Al within mullite-like environments within remnant precursor particles.23 The lineshape and width of the distribution of δobs for this resonance are identical across all synthetic alkali aluminosilicate gels. The intensity of this resonance is inversely proportional to the nominal Si/Al of the sample, consistent with the promotion of formation of mullite-likes sites by lower Si/Al in these precursors as observed previously.22 Octahedral resonances due to Al in bayerite (α-Al(OH)3, observed in the XRD data for the NASH-1) will also contribute to this region of the 27Al MAS NMR spectrum of the NASH-1 sample.48,49
The 27Al MAS NMR spectra for all samples after immersion in water for 28 days is almost identical to that of the as-cured samples, indicating negligible alteration to the local environment surrounding Al within these samples.
3.2. Characterisation of the aqueous phase
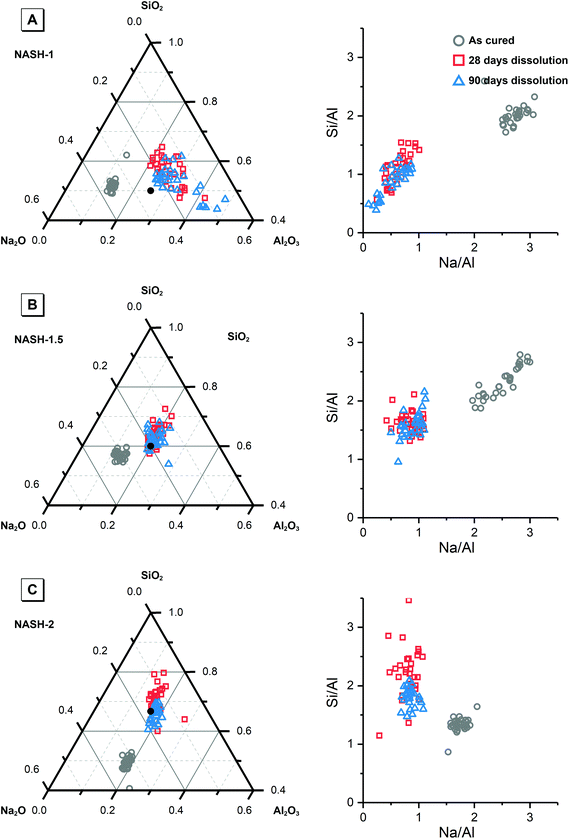
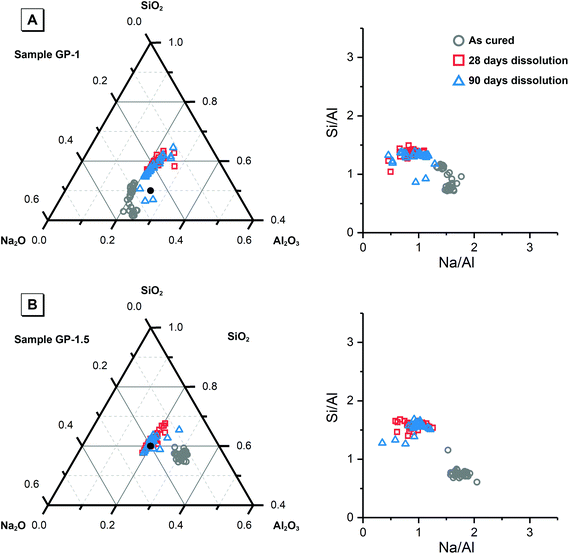
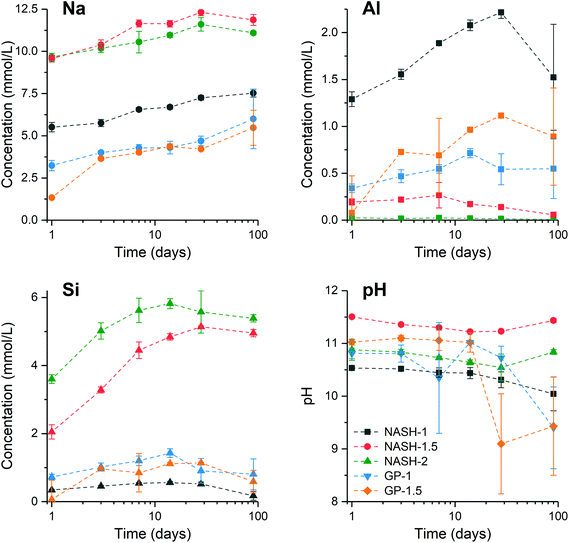
Fig. 8 shows the elemental concentration of Na, Al and Si in the aqueous solution at different times of dissolution, as determined by ICP-OES. The pH values of these supernatants at the same dissolution time were also recorded. The concentration of these dissolved elements increased slowly within the first 28 days, and reached dissolution equilibrium at 28 days of dissolution. However, a drop in the dissolved Al content was observed after 90 days dissolution of the synthetic NASH-1 sample, likely due to precipitation of aluminosilicate phases on the solid surface after extended dissolution time.Fig. 9 shows the Na/Al and Si/Al molar ratios in the remaining solid phases (determined from SEM-EDX) and the supernatant aqueous phases after 28 and 90 days of dissolution. The molar ratios in the aqueous phase are always positively correlated with the molar ratios in the solid phase. For both synthetic N–A–S–H and metakaolin-based geopolymer gels the dissolved Na/Al and dissolved Si/Al ratios are higher for samples with higher nominal bulk Si/Al ratios. However, overall the total dissolved Na/Al ratios in the synthetic N–A–S–H gels are higher than those of the metakaolin-based geopolymers. This is likely due to the greater amount of NaOH deposited in porous regions by drying of pore fluid, for the synthetic alkali aluminosilicate gels when compared with the metakaolin based geopolymer gels (Fig. 2 and 3) that is a result of the high porosity of the synthetic aluminosilicate precursors.22,23 With the exception of the NASH-1 gel which contains significant amounts of faujasite–Na and bayerite (α-Al(OH)3), the Si/Al ratios in the solution are either similar (GP-1 and GP-2) or higher (NASH-1.5 and NASH-2) than then the Si/Al ratio remaining in the solid phase. The different behaviour of NASH-1 gel is likely due to the presence of a significant amount of bayerite, which can contribute to the additional dissolved Al in the aqueous solutions. The Si/Al molar ratios of remaining solids after 28 days dissolution calculated from quantified 29Si MAS NMR spectral are also shown in Fig. 9B for comparison with that obtained from SEM-EDX analysis. Both characterisation methods are commonly used for determining the bulk Si/Al ratios of alkali aluminosilicate gels. However, as shown in Fig. 9B, with the exception of sample GP-1, the Si/Al ratios determined from SEM-EDX analysis are closer to the initial stoichiometric design of solid phase. Although the dissolved Si contents are much higher than that of Al element, it is still not clear whether the preferred dissolution of Si element would lead to such significant changes in the remaining solid phase. Therefore, in the following section, the solubilities of the tested solid phases were calculated according to solid Si/Al ratios obtained from SEM-EDX and quantified 29Si MAS NMR data, respectively, to provide some perspective of the impact of application of each characterisation technique on the final solubility results.
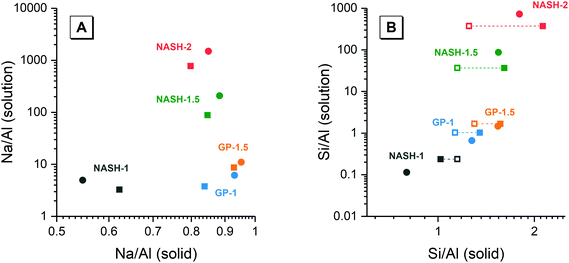 | ||
| Fig. 9 (A) Mean Na/Al molar ratios and (B) mean Si/Al molar ratios of the solution and solid phases from the dissolution tests for samples NASH-1 (black), NASH-1.5 (green), NASH-2 (red), GP-1 (blue), GP-1.5 (orange) as determined by ICP-OES (n = 3) and SEM-EDX (n = 10), respectively. Data are shown as mean ± standard deviation. Data are shown for samples immersed in water for 28 (filled square symbols) and 90 days (filled circle symbols). For comparison, bulk Si/Al molar ratios for all samples immersed in water for 28 days (calculated from quantification of the 29Si MAS NMR spectral deconvolutions, Table 4) are also shown in (b) as the open squares. | ||
Table S2, ESI,† summarises the ionic activity coefficients, ionic activities and total ionic strength of ionic species calculated according to eqn (1)–(3), using the experimentally measured concentration shown in Fig. 8 as input. Since the aqueous phases at equilibrium are all above pH = 8, it is assumed that any dissolved Al exists as AlO2− instead of Al3+.50
3.3. Calculation of solubility constants of N–A–S–H gels
The solubilities of the synthetic N–A–S–H and metakaolin-based geopolymer gels were calculated assuming that the alkali aluminosilicate gel was the only phase that contributed to the dissolved elements in the aqueous phase in each sample. Both 28 days and 90 days dissolution data were used for the calculations by assuming that dissolution equilibrium has been reached at each respective time of dissolution.Eqn (5) shows the generalised dissolution equation for alkali aluminosilicate gels with different Na/Al and Si/Al ratios. For each sample tested, the dissolution constant (Ksp) and the standard Gibbs energy of reaction can be calculated from eqn (6) and (7). The results are summarised in Table 4, together with the ionic activities used for calculation and the calculated dissolution constants. Since the exact hydration number for each solid sample tested was not available, and the activity of water deviated from ideality by less than 0.0004 units, the activity of water was assumed to be 1.00 for all calculations. In eqn (5)–(7), R is the gas constant (8.314 J K−1 mol−1), and T is the temperature in kelvin.
 | (5) |
 | (6) |
 | (7) |
| Sample ID | Duration | Si/Alc (solid phase) | x | y | {Na+} mmol kg−1 H2O | {AlO2−}mmol kg−1 H2O | {SiO2@} mmol kg−1 H2O | {OH−} mmol kg−1 H2O | {H2O} mol kg−1 H2O | K sp | log![[thin space (1/6-em)]](https://www.rsc.org/images/entities/char_2009.gif) Ksp Ksp |
(kJ mol−1) |
|---|---|---|---|---|---|---|---|---|---|---|---|---|
| a The pure alkali aluminosilicate gel follows Loewenstein's rule, where the Si/Al would be no less than 1. The low Si/Al ratio (0.8) in this sample was significantly caused by the coexistence of Al(OH)3. b Si/Al ratio in the remaining solid phases calculated from quantified 29Si MAS NMR spectra, with an estimated experimental error of ±2%. c Where not specified, the Si/Al ratio values were calculated from the SEM-EDX analysis, with a calculated experimental standard error of ±3%. | ||||||||||||
| NASH-1 | 28 | 1.02 | 1.61 | 3.28 | 6.72 | 2.05 | 0.52 | 0.19 | 1.00 | 6.05 × 10⁻²⁰ | −19.22 | 109.71 |
| 90 | 0.80a | 1.83 | 2.92 | 6.99 | 1.41 | 0.17 | 0.11 | 1.00 | 7.71 × 10⁻²⁰ | −19.11 | 109.11 | |
| NASH-1.5 | 28 | 1.61 | 1.18 | 3.81 | 11.26 | 0.13 | 5.15 | 1.56 | 1.00 | 1.62 × 10⁻²¹ | −20.79 | 118.68 |
| 90 | 1.55 | 1.13 | 3.50 | 10.83 | 0.05 | 4.96 | 2.49 | 1.00 | 1.00 × 10⁻²¹ | −21.00 | 119.88 | |
| NASH-2 | 28 | 2.13 | 1.25 | 5.33 | 10.66 | 0.01 | 5.58 | 0.33 | 1.00 | 4.28 × 10⁻²⁷ | −26.37 | 150.53 |
| 90 | 1.80 | 1.18 | 4.23 | 10.22 | 0.01 | 5.39 | 0.64 | 1.00 | 2.43 × 10⁻²⁵ | −24.61 | 140.51 | |
| GP-1 | 28 | 1.35 | 1.19 | 3.23 | 3.97 | 1.05 | 1.14 | 0.50 | 1.00 | 7.36 × 10⁻²¹ | −20.13 | 114.94 |
| 90 | 1.28 | 1.07 | 2.74 | 5.13 | 0.83 | 0.59 | 0.03 | 1.00 | 4.18 × 10⁻²⁰ | −19.38 | 110.63 | |
| GP-1.5 | 28 | 1.57 | 1.08 | 3.37 | 4.43 | 0.51 | 0.91 | 0.01 | 1.00 | 5.03 × 10⁻²² | −21.30 | 121.59 |
| 90 | 1.54 | 1.05 | 3.23 | 5.64 | 0.51 | 0.81 | 0.03 | 1.00 | 1.12 × 10⁻²¹ | −20.95 | 119.60 | |
| NASH-1 | 28 | 1.15b | 1.61 | 3.70 | 6.72 | 2.05 | 0.52 | 0.19 | 1.00 | 2.39 × 10⁻²¹ | −20.62 | 117.72 |
| NASH-1.5 | 28 | 1.15b | 1.18 | 2.71 | 11.26 | 0.13 | 5.15 | 1.56 | 1.00 | 5.19 × 10⁻¹⁹ | −18.29 | 104.38 |
| NASH-2 | 28 | 1.25b | 1.25 | 3.13 | 10.66 | 0.01 | 5.58 | 0.33 | 1.00 | 3.96 × 10⁻²² | −21.40 | 122.18 |
| GP-1 | 28 | 1.13b | 1.19 | 2.69 | 3.97 | 1.05 | 1.14 | 0.50 | 1.00 | 2.78 × 10⁻¹⁹ | −18.56 | 105.93 |
| GP-1.5 | 28 | 1.30b | 1.08 | 2.81 | 4.43 | 0.51 | 0.91 | 0.01 | 1.00 | 2.62 × 10⁻²⁰ | −19.58 | 111.79 |
Fig. 10 compares the results obtained in this study with that of the synthetic N–A–S–H gels reported in literature and the FAU-type zeolite, the main zeolitic phase identified from sample NASH-1. The thermodynamic properties and the corresponding dissolution reaction of these minerals summarised from literature can be found in Table 5. With the exception of sample NASH-1, the solubility of the other synthetic N–A–S–H gels and the metakaolin-based geopolymer gels follow a very similar trend, decreasing as the bulk Si/Al ratio in the solid phase increases. The dissolution of sample NASH-1 was affected by the existence of significant amount of zeolite FAU and Al(OH)3, and therefore does not reflect the solubility of the amorphous sodium aluminosilicate phase within this sample. Comparing with the results obtained by Gomez-Zamorano et al.,17 where N–A–S–H gels were synthesised from super-saturation method, the results fall into the same range as obtained in this study, following a similar trend as the bulk Si/Al ratio varies in the solid phase. Comparing the amorphous gels with the crystallised framework aluminosilicate, the solubilities of zeolite FAU with Si/Al ratio 1.25 and 2 are very close to that of the synthetic N–A–S–H gels with similar Si/Al ratios, and slightly lower than that of the metakaolin-based geopolymer. Fig. 10 shows that the solubilities of these amorphous sodium aluminosilicate gels are strongly correlated to the bulk Si/Al ratio of the solid phase. However, the log![[thin space (1/6-em)]](https://www.rsc.org/images/entities/char_2009.gif) Ksp data reported in the literature correspond to solid phases with different Si/Al ratios, and consequently comparison with the result in this study is not trivial. One way to compare this is to plot the Gibbs energy of formation of these results against the bulk Si/Al ratio, which is normally used in evaluating the solubility of zeolites with similar framework structure but varying Si/Al ratios. Since an exact quantification of the hydration of each sample is not available and extremely difficult to measure accurately, the Gibbs energy of formation of the non-hydrated forms of these N–A–S–H gels was calculated for comparison.
Ksp data reported in the literature correspond to solid phases with different Si/Al ratios, and consequently comparison with the result in this study is not trivial. One way to compare this is to plot the Gibbs energy of formation of these results against the bulk Si/Al ratio, which is normally used in evaluating the solubility of zeolites with similar framework structure but varying Si/Al ratios. Since an exact quantification of the hydration of each sample is not available and extremely difficult to measure accurately, the Gibbs energy of formation of the non-hydrated forms of these N–A–S–H gels was calculated for comparison.
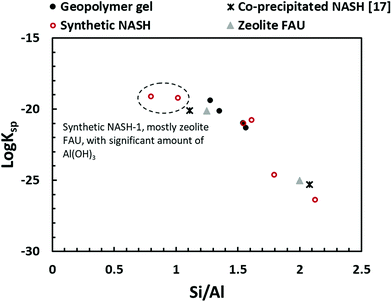 | ||
Fig. 10 Comparison of solubility products of geopolymer gel (this study), synthetic N–A–S–H gels (this study), co-precipitated N–A–S–H gels reported in ref. 17, FAU-type zeolite.51 The log![[thin space (1/6-em)]](https://www.rsc.org/images/entities/char_2009.gif) Ksp values were plotted to Si/Al ratios of the solid phase. Ksp values were plotted to Si/Al ratios of the solid phase. | ||
| Sample | Reaction used for calculation thermodynamic properties | Si/Al | log![[thin space (1/6-em)]](https://www.rsc.org/images/entities/char_2009.gif) Ksp Ksp |
(kJ mol−1) | (kJ mol−1) | (kJ mol−1) | (kJ mol−1) |
|---|---|---|---|---|---|---|---|
| N–A–S–H 117 | Na2O·Al2O3·2.22SiO2·5.51H2O = 2Na+ + 2 AlO2− + 2.22SiO2(aq) + 5.51H2O | 1.11 | −20.11 | 114.79 | 60.52 | −5452.71 | −5940.75 |
| N–A–S–H 217 | Na2O·0.92Al2O3·3.85SiO2·7.23H2O = 2Na+ + 1.84 AlO2− + 3.69SiO2(aq) + 0.15HSiO3− + 7.13H2O | 2.08 | −25.31 | 144.46 | 102.72 | −7107.69 | −7791.52 |
| Zeolite X (FAU)51 | Na2O·Al2O3·2.5SiO2·6.2H2O = 2Na+ + 2 AlO2− + 2.5SiO2(aq) + 6.2H2O | 1.25 | −20.10 | 114.73 | 122.77 | −5847.51 | −6446.58 |
| Zeolite Y (FAU)51 | Na2O·Al2O3·4SiO2·8H2O = 2Na+ + 2 AlO2− + 4SiO2(aq) + 8H2O | 2.00 | −25.00 | 142.70 | 156.61 | −7552.53 | −8326.78 |
| Al(OH)3 (gibbsite)52 | Al(OH)3(gibbsite) = Al(OH)4–OH− | — | −1.12 | 6.39 | — | −1150.99 | −1288.72 |
The dissolution reaction of the non-hydrated form of N–A–S–H gel can be expressed as eqn (8), and the Gibbs energy of formation of the non-hydrated N–A–S–H gel can be calculated using eqn (9). Since the activity of H2O can be treated as 1.00 mol L−1, the Gibbs energy of reaction of eqn (8) would result in the same value as that of the eqn (5). The results are shown in Fig. 11.
| Na2O·xAl2O3·ySiO2 [non-hydrated] + 2(x − 1)OH− = 2Na+ + 2xAlO2− + ySiO2(aq) + (x − 1)H2O | (8) |
 | (9) |
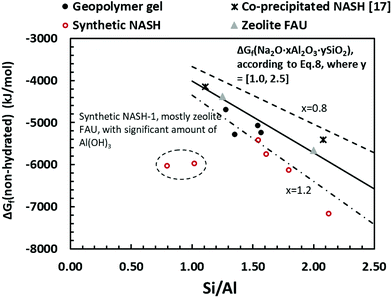 | ||
| Fig. 11 Gibbs energy of formation of non-hydrated alkali aluminosilicate phase calculated from eqn (9), plotted to the bulk Si/Al ratio in the solid phase. The guidelines represent the estimated Gibbs energy of formation of Na2O·xAl2O3·ySiO2 from the sum of polyhedral contributions using eqn (10): dash-line (x = 0.8), solid line (x = 1.0), dash-dot-dash line (x = 1.2). The data show a comparison of geopolymer gel (this study), synthetic N–A–S–H gels (this study), co-precipitated N–A–S–H gels reported in ref. 17 and FAU-type zeolite.51 | ||
The guidelines shown in Fig. 11 were calculated using eqn (10), where the Gibbs energy of formation of silicate minerals were estimated from the sum of polyhedral contributions,53 and ni and gi are the number of moles of the oxides (i) per formula and the respective molar free energy.
 | (10) |
Therefore, the Gibbs free energy of formation of non-hydrated N–A–S–H gel can be estimated as eqn (11), where gNa2O = −672.50 kJ mol−1, gAl2O3 = −1631.32 kJ mol−1, gSiO2 = −853.95 kJ mol−1, gH2O = −239.91 kJ mol−1.21
 | (11) |
The guideline shown in Fig. 11 is consistent with the experimentally measured Al2O3/Na2O values (indicated as x in Na2O·xAl2O3·ySiO2 and Fig. 11) of each sample point (as summarised in Table 4). The results shown here suggest that for solids with similar Na/Al ratios, their measured thermodynamic properties of synthetic N–A–S–H gels and geopolymer gels are inherently consistent with varying bulk Si/Al ratios. And since the solubility and thermodynamic properties of zeolite FAU are similar to that of the amorphous gels with similar bulk chemical composition, the solubility of NASH-1 gel is strongly influenced by the co-existence of Al(OH)3. Apart from the Al(OH)3, there are also other small fraction of impurities identified in all samples from this study, as shown in section 3.1.1. Smaller amounts of Al(OH)3 are also present in NASH-1.5 and NASH-2 gels. As for the metakaolin-based geopolymers, a small fraction of TiO2 and quartz, and traces of illite, have also been identified in these samples. The dissolution of TiO2 is not likely to affect the calculations in this section as Ti does not interact with the N–A–S–H gel. Dissolution of quartz is very slow in pure water and/or low alkalinity solution.54 Given the very small fraction of quartz identified in the metakaolin used to produce the geopolymers, the dissolution of quartz in pure water and/or low alkalinity solution is not considered to be significant, and the effect of the presence of the quartz impurity on the calculations in this section can be considered negligible. Al in pure illite exists in an octahedral Al site.55 However, as shown in the 27Al MAS NMR data (Fig. 7), no octahedral Al is observed in the metakaolin-based geopolymers, in contrast with the significant amount of octahedral Al observed from the synthetic N–A–S–H gels (contributed by Al(OH)3). This suggests that the amount of illite in the metakaolin-based geopolymers is below the detection limit of the 27Al MAS NMR spectroscopy (<1 mol%). Therefore, with the exception of sample NASH-1, the solubilities obtained from both synthetic N–A–S–H gels and metakaolin-based geopolymers can all be considered as reliable reflections of the thermodynamic properties of pure alkali aluminosilicate gels. The “close to linear” correlation between the measured solubility and the bulk Si/Al ratio in the solid phase of these alkali aluminosilicate gels may relate to the binding energy between Si–O and Al–O bonds. The results summarised in Fig. 10 and Fig. 11 will provide essential knowledge for future related studies focusing on the thermodynamic properties of alkali aluminosilicate gels.
4. Conclusions
The thermodynamic properties of sodium aluminosilicate hydrate (N–A–S–H) phases with bulk Si/Al ratios between 1.0 and 2.1 have been measured from dissolution experiments, using both pure synthetic N–A–S–H gels and metakaolin-based geopolymers. The results show that, for both synthetic N–A–S–H gels and the metakaolin-based geopolymers, the measured solubility is higher for phases with lower Si/Al ratios, between log10![[thin space (1/6-em)]](https://www.rsc.org/images/entities/char_2009.gif) Ksp 19.2 and log10
Ksp 19.2 and log10![[thin space (1/6-em)]](https://www.rsc.org/images/entities/char_2009.gif) Ksp 26.4 for Si/Al ratios between 1.0 and 2.1. A close to linear correlation has been identified between the measured solubility and the bulk Si/Al ratios, where both the synthetic pure N–A–S–H gel and the metakaolin-based geopolymers follow a similar trend. The characterisation results of the solid phase before and after dissolution experiments showed similar results between the synthetic N–A–S–H gel and the metakaolin geopolymer. The outcomes of this study provide fundamental understanding of the physiochemical and thermodynamic properties of geopolymers, insight that is essential for predicting their long-term stability and durability.
Ksp 26.4 for Si/Al ratios between 1.0 and 2.1. A close to linear correlation has been identified between the measured solubility and the bulk Si/Al ratios, where both the synthetic pure N–A–S–H gel and the metakaolin-based geopolymers follow a similar trend. The characterisation results of the solid phase before and after dissolution experiments showed similar results between the synthetic N–A–S–H gel and the metakaolin geopolymer. The outcomes of this study provide fundamental understanding of the physiochemical and thermodynamic properties of geopolymers, insight that is essential for predicting their long-term stability and durability.
Conflicts of interest
There are no conflicts to declare.Acknowledgements
This work has been funded by the Engineering and Physical Sciences Research Council (EPSRC), UK, through grant EP/P013171/1. The participation of XK was partly sponsored by a University of Bath Prize Fellowship. We wish to thank and acknowledge Professor Susan Bernal, School of Civil Engineering, The University of Leeds, for insightful discussions related to this work. We also wish to thank and acknowledge Dr Sandra van Meurs, Department of Chemistry, The University of Sheffield, for assistance in acquiring the NMR data and insightful discussions related to this work. We are also very grateful to the PQ Corporation for the provision of alkali silicate solutions for this experimental programme.References
- J. L. Provis and S. A. Bernal, Annu. Rev. Mater. Res., 2014, 44, 299–327 CrossRef CAS.
- M. G. Blackford, J. V. Hanna, K. J. Pike, E. R. Vance and D. S. Perera, J. Am. Ceram. Soc., 2007, 90, 1193–1199 CrossRef CAS.
- X. Ke, S. A. Bernal, T. Sato and J. L. Provis, Dalton Trans., 2019, 48, 12116–12126 RSC.
- Z. Zhang, J. L. Provis, A. Reid and H. Wang, Constr. Build. Mater., 2014, 56, 113–127 CrossRef.
- B. Walkley, X. Ke, O. H. Hussein, S. A. Bernal and J. L. Provis, J. Hazard. Mater., 2020, 382, 121015 CrossRef CAS PubMed.
- Q. Wan, F. Rao, S. Song, R. E. García, R. M. Estrella, C. L. Patiño and Y. Zhang, Cem. Concr. Compos., 2017, 79, 45–52 CrossRef CAS.
- P. Duxson, J. L. Provis, G. C. Lukey, S. W. Mallicoat, W. M. Kriven and J. S. J. van Deventer, Colloids Surf., A, 2005, 269, 47–58 CrossRef CAS.
- P. Duxson, G. C. Lukey and J. S. J. van Deventer, Ind. Eng. Chem. Res., 2006, 45, 7781–7788 CrossRef CAS.
- D. S. Perera, E. R. Vance, Z. Aly, J. Davis and C. L. Nicholson, in Environmental Issues and Waste Management Technologies in the Ceramic and Nuclear Industries XI, John Wiley & Sons, Inc., 2006, pp. 91–96, DOI:10.1002/9781118407950.ch10.
- J. Zhang, J. L. Provis, D. Feng and J. S. J. van Deventer, J. Hazard. Mater., 2008, 157, 587–598 CrossRef CAS PubMed.
- L. G. Benning, R. T. Wilkin and H. L. Barnes, Am. Mineral., 2000, 85, 495–508 CrossRef CAS.
- R. T. Wilkin and H. L. Barnes, Am. Mineral., 1998, 83, 746–761 CrossRef CAS.
- K. B. Rozov, U. Berner, D. A. Kulik and L. W. Diamond, Clays Clay Miner., 2011, 59, 215–232 CrossRef CAS.
- J. J. Chen, J. J. Thomas, H. F. W. Taylor and H. M. Jennings, Cem. Concr. Res., 2004, 34, 1499–1519 CrossRef CAS.
- B. Z. Dilnesa, B. Lothenbach, G. Le Saout, G. Renaudin, A. Mesbah, Y. Filinchuk, A. Wichser and E. Wieland, Cem. Concr. Res., 2011, 41, 311–323 CrossRef CAS.
- D. Nied, K. Enemark-Rasmussen, E. L'Hopital, J. Skibsted and B. Lothenbach, Cem. Concr. Res., 2016, 79, 323–332 CrossRef CAS.
- L. Gomez-Zamorano, M. Balonis, B. Erdemli, N. Neithalath and G. Sant, J. Am. Ceram. Soc., 2017, 100, 2700–2711 CrossRef CAS.
- T. Williamson, J. Han, L. Katz, G. Sant and M. Juenger, RILEM Tech. Lett., 2019, 3, 104–113 CrossRef.
- R. M. Barrer and D. E. Mainwaring, J. Chem. Soc., Dalton Trans., 1972, 1254–1259 RSC.
- Z. Zhang, H. Wang, J. L. Provis, F. Bullen, A. Reid and Y. Zhu, Thermochim. Acta, 2012, 539, 23–33 CrossRef CAS.
- H. C. Helgeson, D. H. Kirkham and G. C. Flowers, Am. J. Sci., 1981, 281, 1249–1516 CrossRef CAS.
- B. Walkley, R. San Nicolas, M.-A. Sani, J. D. Gehman, J. S. J. van Deventer and J. L. Provis, Powder Technol., 2016, 297, 17–33 CrossRef CAS.
- B. Walkley, R. San Nicolas, M. A. Sani, J. D. Gehman, J. S. van Deventer and J. L. Provis, Dalton Trans., 2016, 45, 5521–5535 RSC.
- B. Walkley, G. J. Rees, R. San Nicolas, J. S. J. van Deventer, J. V. Hanna and J. L. Provis, J. Phys. Chem. C, 2018, 122, 5673–5685 CrossRef CAS.
- D. Massiot, F. Fayon, M. Capron, I. King, S. Le Calvé, B. Alonso, J.-O. Durand, B. Bujoli, Z. Gan and G. Hoatson, Magn. Reson. Chem., 2002, 40, 70–76 CrossRef CAS.
- J. L. Provis, P. Duxson, G. C. Lukey and J. S. J. van Deventer, Chem. Mater., 2005, 17, 2976–2986 CrossRef CAS.
- A. Fernández-Jiménez, A. Palomo, I. Sobrados and J. Sanz, Microporous Mesoporous Mater., 2006, 91, 111–119 CrossRef.
- I. Lecomte, C. Henrist, M. Liégeois, F. Maseri, A. Rulmont and R. Cloots, J. Eur. Ceram. Soc., 2006, 26, 3789–3797 CrossRef CAS.
- M. Criado, A. Fernández-Jiménez, A. Palomo, I. Sobrados and J. Sanz, Microporous Mesoporous Mater., 2008, 109, 525–534 CrossRef CAS.
- P. Duxson, G. C. Lukey and J. S. J. van Deventer, Langmuir, 2006, 22, 8750–8757 CrossRef CAS PubMed.
- J. L. Provis, G. C. Lukey and J. S. J. van Deventer, Chem. Mater., 2005, 17, 3075–3085 CrossRef CAS.
- F. Winnefeld, A. Leemann, M. Lucuk, P. Svoboda and M. Neuroth, Constr. Build. Mater., 2010, 24, 1086–1093 CrossRef.
- A. Fernández-Jiménez and A. Palomo, Cem. Concr. Res., 2005, 35, 1984–1992 CrossRef.
- M. T. Melchior, D. E. W. Vaughan and C. F. Pictroski, J. Phys. Chem., 1995, 99, 6128–6144 CrossRef CAS.
- G. J. Ray, B. L. Meyers and C. L. Marshall, Zeolites, 1987, 7, 307–310 CrossRef CAS.
- G. Kowalczyk and J. E. Roberts, Anal. Chim. Acta, 1994, 286, 25–35 CrossRef CAS.
- S. Myers, R. Cygan, R. Assink and M. Boslough, Phys. Chem. Miner., 1998, 25, 313–317 CrossRef CAS.
- S. A. Bernal, J. L. Provis, B. Walkley, R. San Nicolas, J. D. Gehman, D. G. Brice, A. R. Kilcullen, P. Duxson and J. S. J. van Deventer, Cem. Concr. Res., 2013, 53, 127–144 CrossRef CAS.
- S. K. Lausen, H. Lindgreen, H. J. Jakobsen and N. C. Nielsen, Am. Mineral., 1999, 84, 1433–1438 CrossRef CAS.
- W. Kolodziejski and J. Klinowski, Chem. Rev., 2002, 102, 613–628 CrossRef CAS PubMed.
- G. Engelhardt, U. Lohse, E. Lippmaa, M. Tarmak and M. Mägi, Z. Anorg. Allg. Chem., 1981, 482, 49–64 CrossRef CAS.
- B. Dong, J. Yan, B. Walkley, K. K. Inglis, F. Blanc, S. Hull and A. R. West, Solid State Ionics, 2018, 327, 64–70 CrossRef CAS.
- L. Kobera, J. Brus, P. Klein, J. Dedecek and M. Urbanova, Solid State Nucl. Magn. Reson., 2014, 57–58, 29–38 CrossRef CAS PubMed.
- R. J. Kirkpatrick and B. L. Phillips, Appl. Magn. Reson., 1993, 4, 213–236 CrossRef CAS.
- S. E. Ashbrook and D. M. Dawson, NMR spectroscopy of minerals and allied materials, in Nuclear Magnetic Resonance, ed. V. Ramesh, RSC Publishing, 2016, vol. 45 Search PubMed.
- P. Duxson, G. C. Lukey, F. Separovic and J. S. J. van Deventer, Ind. Eng. Chem. Res., 2005, 44, 832–839 CrossRef CAS.
- J. F. Stebbins, S. Kroeker, S. K. Lee and T. J. Kiczenski, J. Non-Cryst. Solids, 2000, 275, 1–6 CrossRef CAS.
- J. Skibsted, E. Henderson and H. J. Jakobsen, Inorg. Chem., 1993, 32, 1013–1027 CrossRef CAS.
- T. Isobe, T. Watanabe, J.-B. d'Espinose de la Caillerie, A. Legrand and D. Massiot, J. Colloid Interface Sci., 2003, 261, 320–324 CrossRef CAS PubMed.
- D. J. Wesolowski, Geochim. Cosmochim. Acta, 1992, 56, 1065–1091 CrossRef CAS.
- B. Lothenbach, E. Bernard and U. Mäder, Phys. Chem. Earth, Parts A/B/C, 2017, 99, 77–94 CrossRef.
- B. Lothenbach, D. A. Kulik, T. Matschei, M. Balonis, L. Baquerizo, B. Dilnesa, G. D. Miron and R. J. Myers, Cem. Concr. Res., 2018, 115, 472–506 CrossRef.
- J. A. Chermak and J. D. Rimstidt, Am. Mineral., 1989, 74, 1023–1031 CAS.
- W. A. House and D. R. Orr, J. Chem. Soc., Faraday Trans., 1992, 88, 233–241 RSC.
- S. P. Altaner, C. A. Weiss and R. J. Kirkpatrick, Nature, 1988, 331, 699–702 CrossRef CAS.
Footnotes |
| † Electronic supplementary information (ESI) available. See DOI: 10.1039/d1dt02202d |
| ‡ These authors contributed equally to this work. |
| This journal is © The Royal Society of Chemistry 2021 |

