
 Open Access Article
 This Open Access Article is licensed under a Creative Commons Attribution-Non Commercial 3.0 Unported Licence
Experimental investigations into the irregular synthesis of iron(III) terephthalate metal–organic frameworks MOF-235 and MIL-101†
Isabelle
Simonsson
 *a,
Philip
Gärdhagen
a,
Moira
Andrén
a,
Pui Lam
Tam
b and
Zareen
Abbas
a
*a,
Philip
Gärdhagen
a,
Moira
Andrén
a,
Pui Lam
Tam
b and
Zareen
Abbas
a
aDepartment of Chemistry and Molecular Biology, University of Gothenburg, Gothenburg, Sweden. E-mail: isabelle.simonsson@gu.se
bDepartment of Industrial and Materials Science, Chalmers University of Technology, Gothenburg, Sweden
First published on 12th March 2021
Abstract
MOF-235(Fe) and MIL-101(Fe) are two well-studied metal–organic frameworks (MOFs) with dissimilar crystal structures and topologies. Previously reported syntheses of the former show that it has greatly varying surface areas, indicating a lack of phase purity of the products, i.e. the possible presence of both MOFs in the same sample. To find the reason for this, we have tested and modified the commonly used synthesis protocol of MOF-235(Fe), where a 3![[thin space (1/6-em)]](https://www.rsc.org/images/entities/char_2009.gif) :5 molar ratio of iron(III) ions and a terephthalic acid linker is heated in a 1:1 DMF:ethanol solvent at 80 °C for 24 h. Using XRD and BET surface area (SABET) measurements, we found that it is difficult to obtain a pure phase of MOF-235, as MIL-101 also appears to form during the solvothermal treatment. Comparison of the XRD peak height ratios of the synthesis products revealed a direct correlation between the MOF-235/MIL-101 content and surface area; more MOF-235 yields a lower surface area and vice versa. In general, using a larger (3:1) DMF:ethanol ratio than that reported in the literature and a stoichiometric (4:3) Fe(III):TPA ratio yields a nearly pure MOF-235 product (SABET = 295 m2 g−1, 67% yield). An optimized synthesis procedure was developed to obtain high-surface area MIL-101(Fe) (SABET > 2400 m2 g−1) in a large yield and at a previously unreported temperature (80 °C vs. previously used 110–150 °C). In situ X-ray scattering was utilized to investigate the crystallization of MOF-235 and MIL-101. At 80 °C, only MOF-235 formed and at 85 and 90 °C, only MIL-101 formed.
:5 molar ratio of iron(III) ions and a terephthalic acid linker is heated in a 1:1 DMF:ethanol solvent at 80 °C for 24 h. Using XRD and BET surface area (SABET) measurements, we found that it is difficult to obtain a pure phase of MOF-235, as MIL-101 also appears to form during the solvothermal treatment. Comparison of the XRD peak height ratios of the synthesis products revealed a direct correlation between the MOF-235/MIL-101 content and surface area; more MOF-235 yields a lower surface area and vice versa. In general, using a larger (3:1) DMF:ethanol ratio than that reported in the literature and a stoichiometric (4:3) Fe(III):TPA ratio yields a nearly pure MOF-235 product (SABET = 295 m2 g−1, 67% yield). An optimized synthesis procedure was developed to obtain high-surface area MIL-101(Fe) (SABET > 2400 m2 g−1) in a large yield and at a previously unreported temperature (80 °C vs. previously used 110–150 °C). In situ X-ray scattering was utilized to investigate the crystallization of MOF-235 and MIL-101. At 80 °C, only MOF-235 formed and at 85 and 90 °C, only MIL-101 formed.
Introduction
There is currently a quest for finding materials with outstanding chemical and physical properties while still being economically and environmentally friendly. During the last two decades metal–organic frameworks (MOFs) have been intensively studied due to their unusually high surface areas and porosities. This enables their applications in many different important areas, e.g. in the areas of gas adsorption,3–5 water purification,7 molecular sensing,8–10 catalysis11,12 and drug delivery.13–15 MOFs consist of metal centres connected to organic ligands, forming extensive porous networks with potentially active sites in both the metal ions and ligands. The high degree of porosity enables large surface areas and to date, the MOF with the highest experimentally obtained surface area has been DUT-60 with a BET (after Brunauer–Emmett–Teller) surface area of 7839 m2 g−1.16One of the environmentally friendly MOF contenders is MOF-235(Fe), an iron(III) terephthalate MOF with the chemical formula [Fe3O(1,4-BDC)3(DMF)3][FeCl4] (1,4-BDC: 1,4-benzenedioic acid/terephthalic acid; DMF: N,N-dimethylformamide). It was first synthesized by Sudik et al. (2005),2 and since then several articles have been published where the exact same synthesis procedure has been utilized. In these publications, both determined XRD patterns and measured surface areas have differed at varying degrees. For example, the reported SABET ranges from 9.6 to 540 m2 g−1,17,18 yet no explanations for these deviations have been provided in the literature, to our knowledge.
Another well-known iron(III) terephthalate MOF is MIL-101(Fe) with the molecular formula [Fe3O(OH)(H2O)2(1,4-BDC)3]. Both MOF-235 and MIL-101 are composed of non-toxic iron(III) oxo clusters connected via terephthalic acid (TPA) linker molecules. The main differences between these two MOFs are their topologies and pore structures; MIL-101 contains two different-sized nanocages (d = 29 and 34 Å (ref. 6)) connected by windows (d = 12 and 16 Å) forming a three-dimensional porous structure (Fig. 1(A)), while MOF-235 consists of one-dimensional hexagonal channels with a diameter of 6.7 Å2 (Fig. 1(B)). The SABET of the reported MIL-101(Fe) lies in the range of 1000–3000 m2 g−1, making it a promising candidate for applications such as adsorption,20–23 catalysis19,24–28 and medicine.29
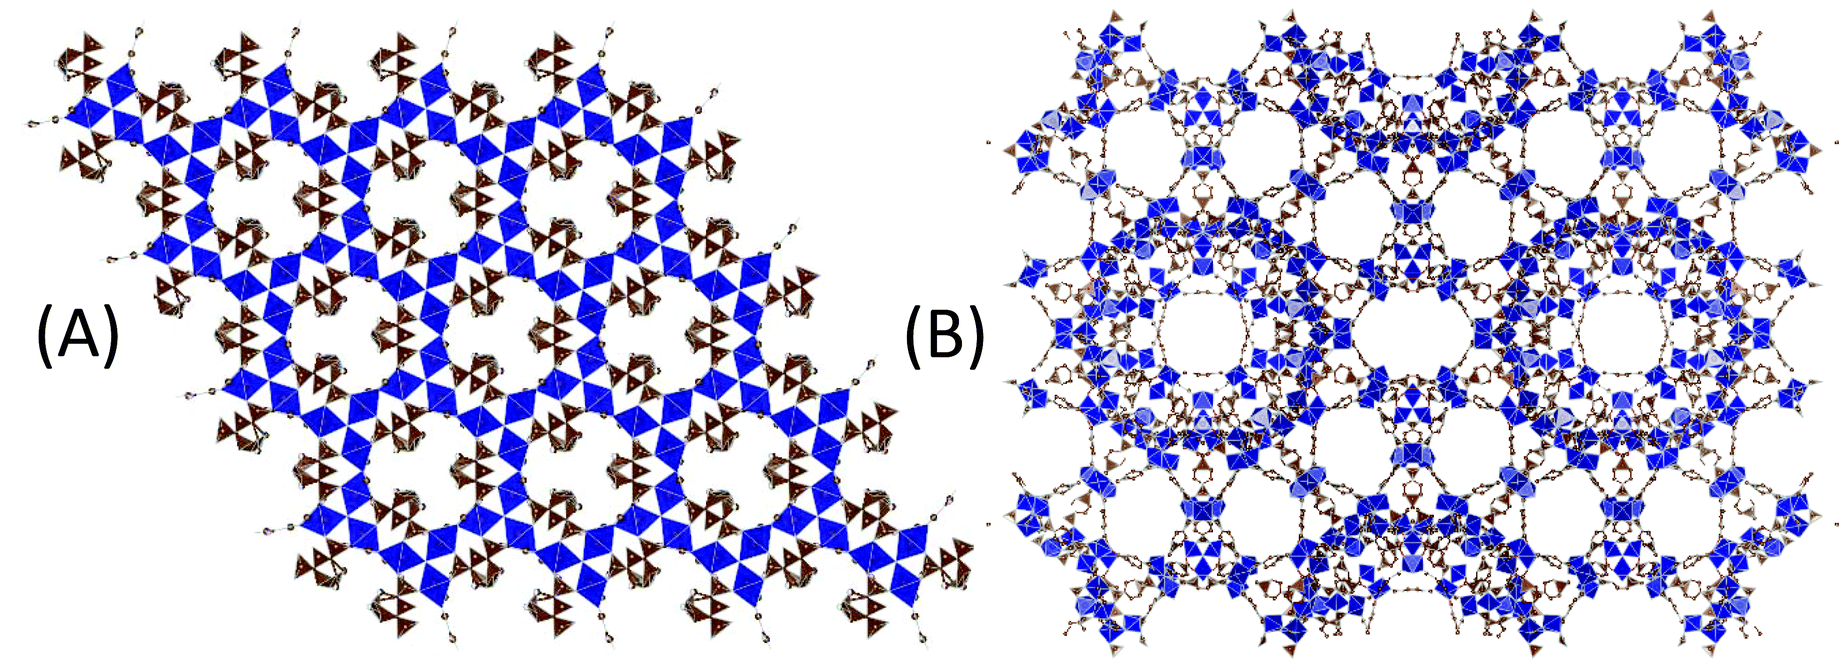 | ||
| Fig. 1 Illustrations of (A) MOF-235 and (B) MIL-101 displaying their different porosities. Images were obtained using VESTA1 with crystallographic information files from Sudik (2005)2 and Lebedev (2005).3 Some atoms are omitted for clarity. | ||
MIL-101(Fe) was first synthesized30 using microwave radiation (150 °C) and a 1:1 ratio of Fe(III):TPA in a pure DMF solvent, resulting in a product yield of 20%. This means that to synthesize 100 mg of MIL-101 (MW = 728.169 g mol−1), 90 mL of DMF, a toxic and potentially carcinogenic organic solvent, is required. Since DMF decomposes into dimethylamine and carbon monoxide during the solvothermal treatment,31 recycling of the solvent is not possible. In addition, a relatively high temperature of 110–150 °C is required for MIL-101 to form (see Table 4 for references). If it would be possible to use a lower amount of harmful solvent and decrease the synthesis temperature it would make the material more environmentally and economically sustainable for industrial and medical applications.
In this study we have tested and modified the most used synthesis protocol of MOF-235(Fe), where a 3:5 molar ratio of iron(III) ions and a terephthalic acid linker is heated in a 1:1 DMF:ethanol solvent at 80 °C for 24 h. We tested three different Fe(III):TPA and DMF:ethanol ratios and investigated the influence of equilibration time on the end product. To determine the obtained products’ phase purity, a combination of XRD and BET surface area measurements was used. X-ray photoelectron spectroscopy (XPS) was used as a complimentary technique. The crystal development during the solvothermal synthesis of MOF-235/MIL-101 was investigated using medium-angle X-ray scattering (MAXS). In addition, methylene blue adsorption efficiencies and zeta potentials were determined for the two most phase-pure products.
Experimental
Chemicals and instruments
All chemicals were commercially obtained and used without further purification. Solvothermal syntheses were conducted in a Memmert UF30 Plus convection oven. Powder X-ray diffraction (P-XRD) analyses were performed by using Bruker D8 Advance Diffractometer with a Cu Kα radiation source (λ = 1.54 Å) and a LYNXEYE PSD detector. Additional XRD analyses were performed with a Cr Kα radiation source (λ = 2.29 Å) using a Bruker D8 Advance Diffractometer. X-ray photoelectron spectroscopy (XPS) was performed using a PHI5000 VersaProbe III instrument with a monochromatic Al X-ray source (E = 1486.6 eV) with a beam size of 100 μm. BET surface areas were measured with a Micromeritics TriStar3000 instrument and the calculations were performed using data points in the 0.05–0.20 p/p0 range. Before the adsorption study and the surface area measurements, the samples were activated in a vacuum oven (70 °C, >12 h, <50 mbar). In addition, the samples were dried in two steps in their sample holders (90 °C for >1 h, and then 110 °C for >2 h, N2(g) atmosphere) immediately before starting the surface area measurements. All X-ray scattering analyses were performed with a Mat:Nordic instrument from SAXSLAB with a Rigaku 003 + Cu Kα source and a Pilatus (300 K/100 K) detector in a vacuum environment. SEM images were obtained with a FEI Quanta200 ESEM in a high vacuum mode and at a 10.0 kV operating voltage.Synthetic procedure
MOF-235 was first synthesized using a conventional solvothermal synthesis protocol.2 Terephthalic acid (1.23 mmol, C6H4(COOH)2) was dissolved in 30 mL of DMF in a 100 mL PTFE-lined stainless-steel autoclave. Iron(III) chloride hexahydrate (0.738 mmol, FeCl3*6H2O) was added during stirring together with 30 mL of ethanol (95%). The autoclave was tightly sealed and placed in a convection oven (80 °C, 24 h). The MOF dispersion was filtered and washed with 1:1 DMF:ethanol and pure ethanol, subsequently.
The original synthesis process reported in the literature did not yield a pure MOF-235 product; additional peaks were observed in the XRD spectrum, belonging to MIL-101 (Fig. 1). Several possible adjustments were tested: Only using completely dry solvents (drying agent: molecular sieve silica, 3 Å beads), using newly purchased chemicals, replicating the synthesis several times, conducting the thermal treatment in other types of vessels and drying the product at lower and higher temperatures. None of the above-mentioned changes appeared to make a difference. Eventually, it was found that either lowering the synthesis temperature to 70 °C (Fig. S1†) or increasing the amount of DMF resulted in the formation of MOF-235.
To further investigate the factors affecting whether MOF-235 or MIL-101 is formed, different synthesis conditions were tested, i.e. different Fe(III):TPA ratios, different DMF:ethanol solvent ratios and different equilibration times (teq). The latter resembles the time between the solvothermal synthesis and the filtration of the product dispersion, which was found to affect both the product yield and phase. To simplify the whole procedure, all new syntheses were conducted in 100 mL glass bottles and a PTFE tape was used to keep the system sealed during the heat treatment. Before and after the synthesis, the pH of the solutions was measured using a combined pH electrode (Metrohm Unitrode easyClean). The details of the syntheses are shown in Table 1. The ns1.X syntheses used an equimolar ratio of Fe(III):TPA (1:1, 0.615:0.615 mmol), the ns 2.X syntheses used a stoichiometric ratio (4:3, 0.820:0.615 mmol) and the ns3.X syntheses used the ratio found in the literature to synthesize MOF-2352,17,32–35 (3:5, 0.369:0.615 mmol). In addition, performing the synthesis in a pure DMF solvent at the same temperature was tested, but this yielded no solid product within 24 h at 80 °C.
| Synthesis | Fe(III):TPA ratio |
DMF:EtOH ratio |
t eq (days) |
|---|---|---|---|
| ns1.1 | 1.0 | 1:1 |
1 |
| ns2.1 | 1.3 | 1:1 |
1 |
| ns3.1 | 0.6 | 1:1 |
1 |
| ns1.2 | 1.0 | 1:1 |
0 |
| ns2.2 | 1.3 | 1:1 |
0 |
| ns3.2 | 0.6 | 1:1 |
0 |
| ns1.3 | 1.0 | 2:1 |
1 |
| ns2.3 | 1.3 | 2:1 |
1 |
| ns3.3 | 0.6 | 2:1 |
1 |
| ns1.4 | 1.0 | 2:1 |
0 |
| ns2.4 | 1.3 | 2:1 |
0 |
| ns3.4 | 0.6 | 2:1 |
0 |
| ns1.5 | 1.0 | 3:1 |
1 |
| ns2.5 | 1.3 | 3:1 |
1 |
| ns3.5 | 0.6 | 3:1 |
1 |
| ns1.6 | 1.0 | 3:1 |
0 |
| ns2.6 | 1.3 | 3:1 |
0 |
| ns3.6 | 0.6 | 3:1 |
0 |
| ns1.7 | 1.0 | 1:1 |
2 |
| ns2.7 | 1.3 | 1:1 |
2 |
| ns3.7 | 0.6 | 1:1 |
2 |
The product yields were calculated after the vacuum treatment with respect to TPA and the molar weights used were adjusted from the respective products’ MOF-235:MIL-101 ratios obtained from the XRD analyses, as they differ (1093.16 g mol−1vs. 728.17 g mol−1).
Characterization techniques
:1 DMF:ethanol ratio and stoichiometric 4:3 Fe(III):TPA ratio). Every 15 minutes, the sample was scanned in the q range of 0–10 Å−1. A small volume of the reagent solution was added to a narrow glass capillary which was sealed with glue. During the analysis, the temperature was kept constant, and heating was carried out only with a small volume where the X-ray beam passed through. The diameter of the beam was 1 μm. A reference sample, containing only the solvent, was analysed and the resulting spectrum was used for background correction.
A reoccurring problem was phase separation in the glass capillary holding the reaction mixture (Fig. S2(A)†); we had to change the experimental setup for the subsequent analyses to obtain scattering data. Instead of focusing the X-ray beam on the middle of the capillary, it was now focused on the bottom (Fig. S2(B) and (C)†).
:1 and 3:1 DMF:EtOH ratios were performed. The starting volume of each synthesis was 150 mL and at times 6, 12 and 24 h, aliquots of 50 mL were taken from each batch. The aliquots were immediately filtered, washed and vacuum dried in the same way as regular solvothermal syntheses. The products were characterized with XRD and BET surface area measurements.
Results and discussion
XRD
During the initial standard synthesis of MOF-235(Fe), XRD data showed that a pure MOF-235 product was difficult to obtain. Instead of obtaining a product having a single large peak at 9.4°, which is the main (1 0 1) peak of MOF-235, several additional peaks were found in the 5–10° region (Fig. 2). A literature search revealed that these peaks belong to MIL-101(Fe),21,25,30 which has diffraction peaks at 2θ values of 5.1, 5.8, 8.4 and 9.0° in the 5–10° region, as well as a minor peak at 16.5°. Reference diffractograms obtained from crystallographic information files can be found in the ESI, Fig. S4 and 5.†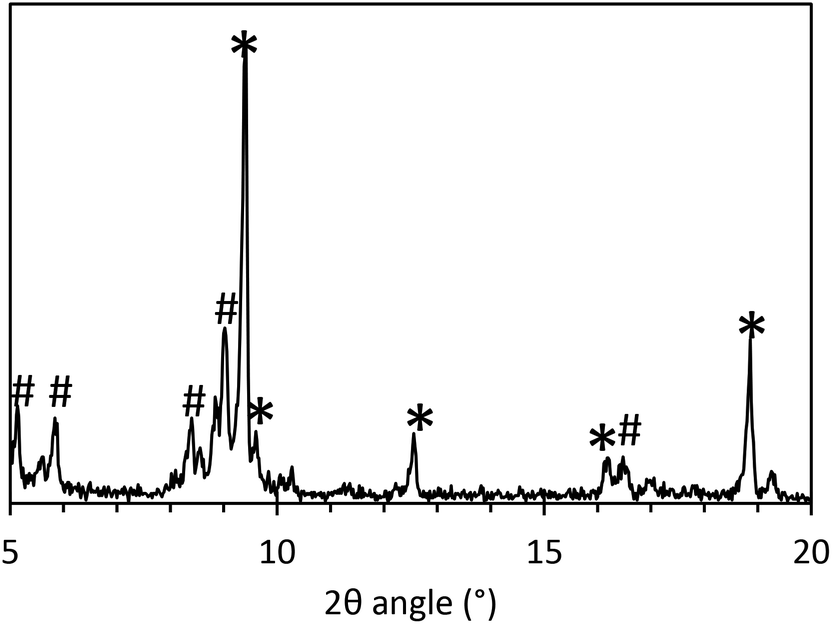 | ||
| Fig. 2 XRD of the product of the original MOF-235 synthesis process performed in a 100 mL PTFE lined steel autoclave at 80 °C for 24 h. MOF-235 peaks are marked with ✱ and MIL-101 peaks are marked with #. | ||
The new synthesis schemes yielded products containing both phases of MOF-235 and MIL-101 at varying degrees. For all 5–10° XRD scans, see Fig. S6 and 7.† To examine the influence of the solvent composition and reagent ratio, a bar chart of the relative XRD peak heights of the 9.0° (main peak of MIL-101 in this range) and 9.4° peaks is shown in Fig. 2. A dominantly black bar shows that mainly MIL-101 has formed, while a dominantly green bar means that mainly MOF-235 has formed. Note that the actual value of the ratio can seem to be misleading, as the MOF-235 peak is inherently stronger in intensity than the MIL-101 peak. The synthesis that gives the most pure MOF-235 appears to be the ns2.5 synthesis, where a 3:1 DMF:ethanol ratio and a stoichiometric 4:3 Fe(III):TPA ratio were used with an equilibration time of 1 day. This also resulted in a product yield of 65% with respect to TPA (146 mg of the solid product after drying). With no equilibration time (ns2.6), a smaller amount of MOF-235 was formed with a lower yield (52%, 116 mg). It is clear that using a larger DMF:ethanol ratio yields a more pure MOF-235 product under the given synthesis conditions. In the 2:1 DMF:ethanol syntheses (nsX.3 and nsX.4), a longer teq seems to favor the MIL-101 formation. On the other hand, the 3:1 DMF:ethanol syntheses (nsX.5 and nsX.6) show the opposite trend, except for when a 3:5 Fe(III):TPA ratio is used (ns3.5 and ns3.6).
A few studies have reported the formation of both MOF-235 and MIL-101 in the same system. Goesten et al.36–38 discovered that during the solvothermal synthesis of NH2-MIL-101(Al), NH2-MOF-235(Al) was initially formed. From density functional theory (DFT) modelling,39 it was found that DMF has a stabilizing effect during the MOF-235 formation. NMR analyses by the same group revealed that DMF also promotes the transformation of NH2-MOF-235(Al) to NH2-MIL-101(Al). More specifically, by using chloride, DMF deprotonates one of the water molecules combined to Al3+ in MOF-235, facilitating its transformation to MIL-101 while creating a H-Cl-DMF complex. A large energy is required for this reaction (+272 kJ mol−1), but the favorable ligand exchange in the Al3+ complex, i.e. Cl− is exchanged for OH−, decreases the over-all reaction energy to +2 kJ mol−1.39 SAXS measurements37 during the NH2-MIL-101(Al) solvothermal synthesis in pure DMF at 130 °C showed that the MOF-235 phase starts to form after about 8 minutes and the MIL-101 phase is not seen until after 25 minutes. DFT and molecular dynamics have shown that DMF and other more hydrophobic solvents effectively solvate and stabilize the Al3O(BDC)6(DMF)3+ clusters formed during the MOF-235(Al) crystallization process.40
Looking at our results, it seems like the process of formation of MOF-235(Fe) and MIL-101(Fe) depends on several factors, not only on time. The most crucial factor appears to be the DMF:ethanol ratio of the solvent. In addition, the most phase-pure products (ns2.7 and ns2.5) were obtained using Fe(III):TPA at a 4:3 ratio, indicating that an excess of iron ions benefits the formation of both phases. Another benefit was an over-all increased yield (Table 2), which could be an effect of pH and solubility and/or due to a higher concentration of the metal clusters which are required for MOF formation. It appears as if given enough thermal energy and/or time to equilibrate, the final product will be MIL-101. The role of ethanol in the heat treatment is unclear; no product was observed in the absence of ethanol at 80 °C and the conventional synthesis method of MIL-101 in pure DMF requires at least 110 °C. The type of solvothermal vessel also appears to dictate the MOF-235:MIL-101 ratio (Fig. S8†); in the stainless-steel autoclave more pure MOF-235 was obtained (XRD peak ratio = 2.64 vs. 0.46) using the original synthesis procedure, i.e. ns3.2. This could be because the glass bottle has an overall higher heat-permeability than the autoclave, promoting the formation of MIL-101 over MOF-235.
:MIL-101 ratios were calculated from the peak height ratios of the 9.4° and 9.0° XRD peaks. The yields were calculated with respect to TPA
| Product | MOF-235:MIL-101 ratio |
SABET (m2 g−1) | Yield (%) |
|---|---|---|---|
| ns1.1 | 0.54 | 2430 | 74 |
| ns2.1 | 2.5 | 1080 | 80 |
| ns3.1 | 2.0 | 285 | 39 |
| ns1.2 | 0.98 | 1530 | 77 |
| ns2.2 | 0.45 | 2320 | 84 |
| ns3.2 | 0.26 | 1690 | 50 |
| ns1.3 | 2.3 | 1030 | 52 |
| ns2.3 | 1.8 | 1300 | 60 |
| ns3.3 | 1.3 | 1180 | 43 |
| ns1.4 | 9.2 | 313 | 44 |
| ns2.4 | 3.4 | 736 | 44 |
| ns3.4 | 2.8 | 937 | 32 |
| ns1.5 | 7.1 | 502 | 58 |
| ns2.5 | 26 | 295 | 67 |
| ns3.5 | 1.1 | 1480 | 47 |
| ns1.6 | 1.5 | 1160 | 49 |
| ns2.6 | 6.8 | 420 | 55 |
| ns3.6 | 3.8 | 530 | 30 |
| ns1.7 | 2.5 | 37.3 | 73 |
| ns2.7 | 0.35 | 2570 | 95 |
| ns3.7 | 0.42 | 2170 | 48 |
The ex situ XRD experiments gave results which are not matching the regular solvothermal results (Fig. S9 and S10†). MOF-235 was only obtained in small amounts in two of the products after 24 h; ns1.6 (1:1 Fe(III):TPA ratio) and ns2.6 (4:3 Fe(III):TPA ratio). Both these products were acquired using a 3:1 DMF:EtOH solvent ratio. All other products only exhibited MIL-101 peaks. It is worth noting that the BET surface areas of the two products acquired after 24 h using a 1:1 DMF:EtOH ratio are some of the largest ones reported so far for MIL-101(Fe) (almost 3300 m2 g−1). One reason for the lack of MOF-235 in the products is that when taking aliquots from the reagent bottles, involving cooling down of the solution and gas and pressure release upon opening the bottles, the MOF formation process is hindered. Another reason could be the larger reagent volume (150 mL).
The influence of the equilibration time on the formation of MOFs has not previously been investigated, to our knowledge. In Fig. S11,† the relationship between teq and the surface area is displayed for the syntheses, showing that a longer teq does not always favor a larger surface area. In some cases, it appears as if the crystallization/transformation of the MOF continues at room temperature after the synthesis has been completed. In other cases, a longer teq appears to yield a less crystalline product. The bond between the iron(III) and oxygen containing ligands in these kinds of complexes becomes unstable at lower pH as the solubility of iron increases with decreasing pH.
From the XRD analyses at different temperatures (Fig. S36 and 37†), it was discovered that the crystal structure of MOF-235(Fe) is stable up to 350 °C, while MIL-101(Fe) decomposes at 300 °C. Thermogravimetric analyses by others have indicated that MIL-101 exhibits a lower degree of thermal stability than MOF-235. While both start to decompose at 300 °C, the mass loss is 66.7% between 300 and 350 °C for MIL-10141 and 27.68% between 350 and 400 °C for MOF-235.18
The ambiguity of characterization of MOF-235 using only XRD and FTIR stems from several factors. One of the largest peaks of MIL-101 at 9.0° could be mistaken as noise and therefore becomes background subtracted and there is also the possibility of peak overlapping with the main peak of MOF-235 at 9.4°. Since the main diffraction peaks of MIL-101 lie below 5°, these peaks are easily missed. Fluorescence from iron when using a Cu Kα radiation source can be significant (Fig. S12†), which further complicates the XRD analysis.42 Results from the XRD analyses using Cr Kα radiation (λ = 2.29 Å), which eliminates the fluorescence signal, are shown in Fig. 4. Compared to the diffractograms with a Cu Kα source (Fig. S13†), the signal-to-noise ratio is significantly improved (2.3 ± 0.41 for Cu vs. 6.5 ± 2.6 for Cr). The MOF-235 peaks at 2θ angles of 14.1° and 28.3° are especially prominent. The MIL-101 peaks at 7.8° and 13.6° are weaker than those with Cu Kα radiation, yet visible. For example, from the SABET of ns1.4 and ns1.1, it can be concluded that the latter contains a large amount of MIL-101. Despite this, their diffractograms look similar, apart from the weak MIL-101 peak at 13.6°, present in ns1.1, but not in ns1.4.
In situ MAXS
In the time-resolved MAXS analyses at 80 °C (Fig. 3(A)), only MOF-235 has formed. It takes approximately 4 hours for the major peak (9.4°) to appear and the intensity increases almost linearly during the entire analysis. No MIL-101 peaks are visible. At 85 °C (Fig. 3(B)), MIL-101 peaks (3.3° and 9.0°) appear after 2 h. The peaks increase in intensity during the entire analysis. At 90 °C (Fig. S14†) the MIL-101 peaks reach an intensity maximum at 11 h, before starting to decrease. No MOF-235 peaks are visible in the diffractograms for the synthesis at 85 and 90 °C. These results, in combination with the ex situ XRD analyses, indicate that no transformation between MOF-235(Fe) and MIL-101(Fe) occurs during the solvothermal process. Instead, both phases appear to be formed independently of each other.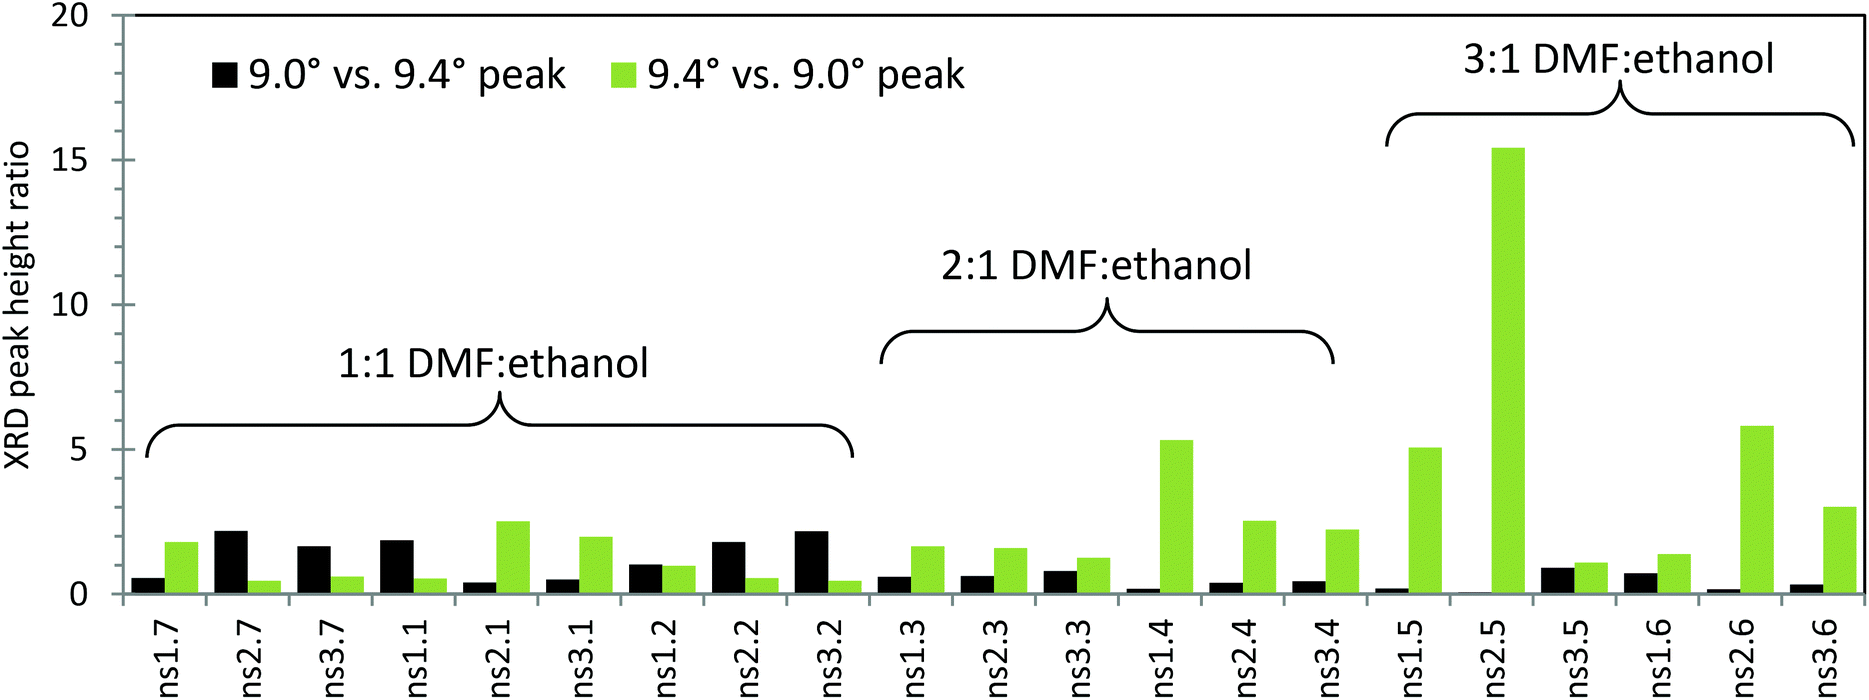 | ||
| Fig. 3 XRD peak ratios of the synthesis products indicating their crystal phase purity. The black bars represent the ratio of the 9.0° peak, belonging to the MIL-101 phase, vs. the 9.4° peak, belonging to the MOF-235 phase. The green bars represent the ratio of the 9.4° peak vs. the 9.0° peak. The Fe(III):TPA ratios of the different syntheses are as follows: ns1.X = 1:1; ns2.X = 4:3; ns3.X = 3:5. All the syntheses were performed at 80 °C for 24 h. | ||
BET surface area
The surface areas of the synthesis products in this study are displayed in Table 2 and the N2 isotherms are shown in Fig. S27–30.† The difference in the pore structure between MOF-235 and MIL-101 makes their respective surface areas differ substantially. MOF-235 has quite narrow hexagonal one-dimensional channels, which limit the surface area. On the other hand, the large nano-cages through which MIL-101 is made up of enable a substantially larger surface area. In addition, the MOF-235's channels are potentially more easily clogged, also affecting the measured effective surface area. The ns2.2 sample was synthesized exactly according to the literature yet exhibits a previously unreported large surface area in addition to the MIL-101 XRD peaks. Table 2 also shows the calculated yields with respect to TPA which are overall larger than earlier reports.By utilizing the BJH desorption isotherm method, the total volume of the pore size range was obtained for ns2.2–24 h (MIL-101, Fig. S31†) and ns2.6 (MOF-235, Fig. S32†). Not surprisingly, the pore volume of MIL-101 (2.11 cm3 g−1) is significantly larger than that of MOF-235 (0.169 cm3 g−1).
The BET surface areas of the synthesized products are plotted against their respective MOF-235:MIL-101 peak height ratios, as obtained by using the XRD peak height ratios, Fig. 6. The correlation between the MOF composition and surface area is clear; a higher MOF-235:MIL-101 ratio yields a lower surface area. The product with the largest MOF-235 content (ns2.5) also has the lowest surface area (295 m2 g−1). Both ns2.7 and ns3.2 have the lowest MOF-235 content and show similar diffraction patterns (Fig. S15†), yet their surface areas are different (2570 and 1690 m2 g−1). This could be due to a lower over-all amount of the crystalline product in the sample and/or the presence of impurities clogging the pores and decreasing the surface area. There is one clear outlier in Fig. 5, as the ns1.7 synthesis product's BET surface area was only 37.3 m2 g−1, which is due to its low degree of crystallinity. It appears that solely using XRD to determine the MOF purity and quality is insufficient, but it does give an indication of the obtained product's surface area. Reference surface areas of MIL-101(Fe) are given in Table 4.
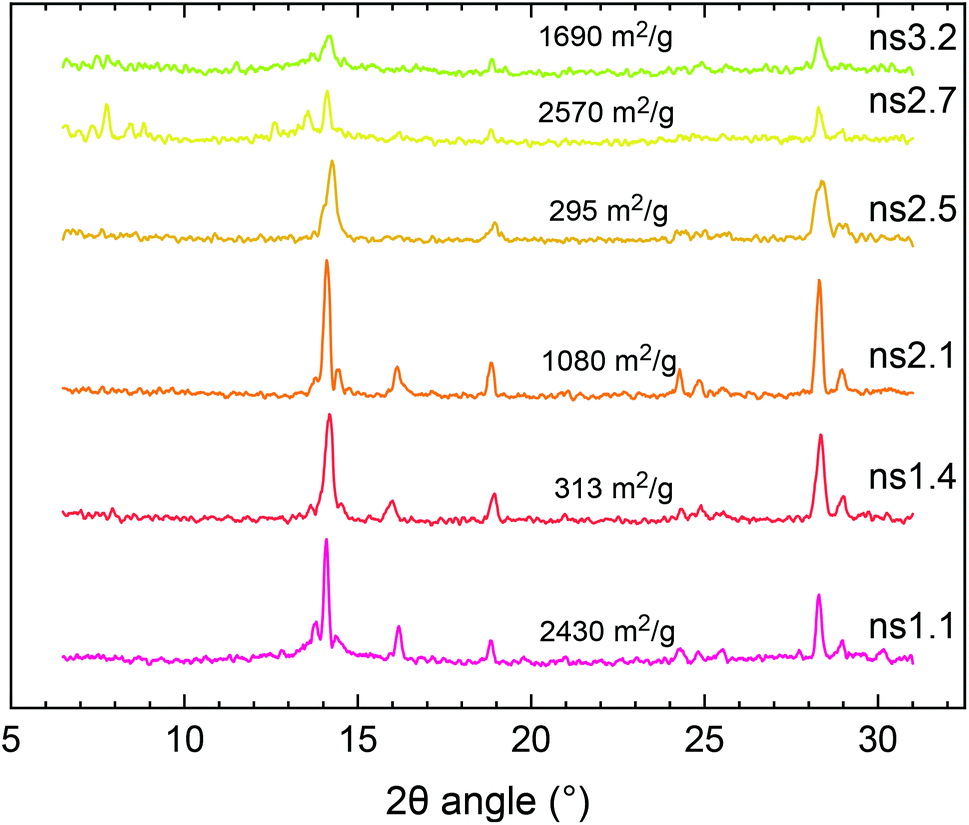 | ||
| Fig. 4 XRD patterns using Cr Kα radiation of the selected synthesis products in this study. Their respective BET surface areas are included in the plot. | ||
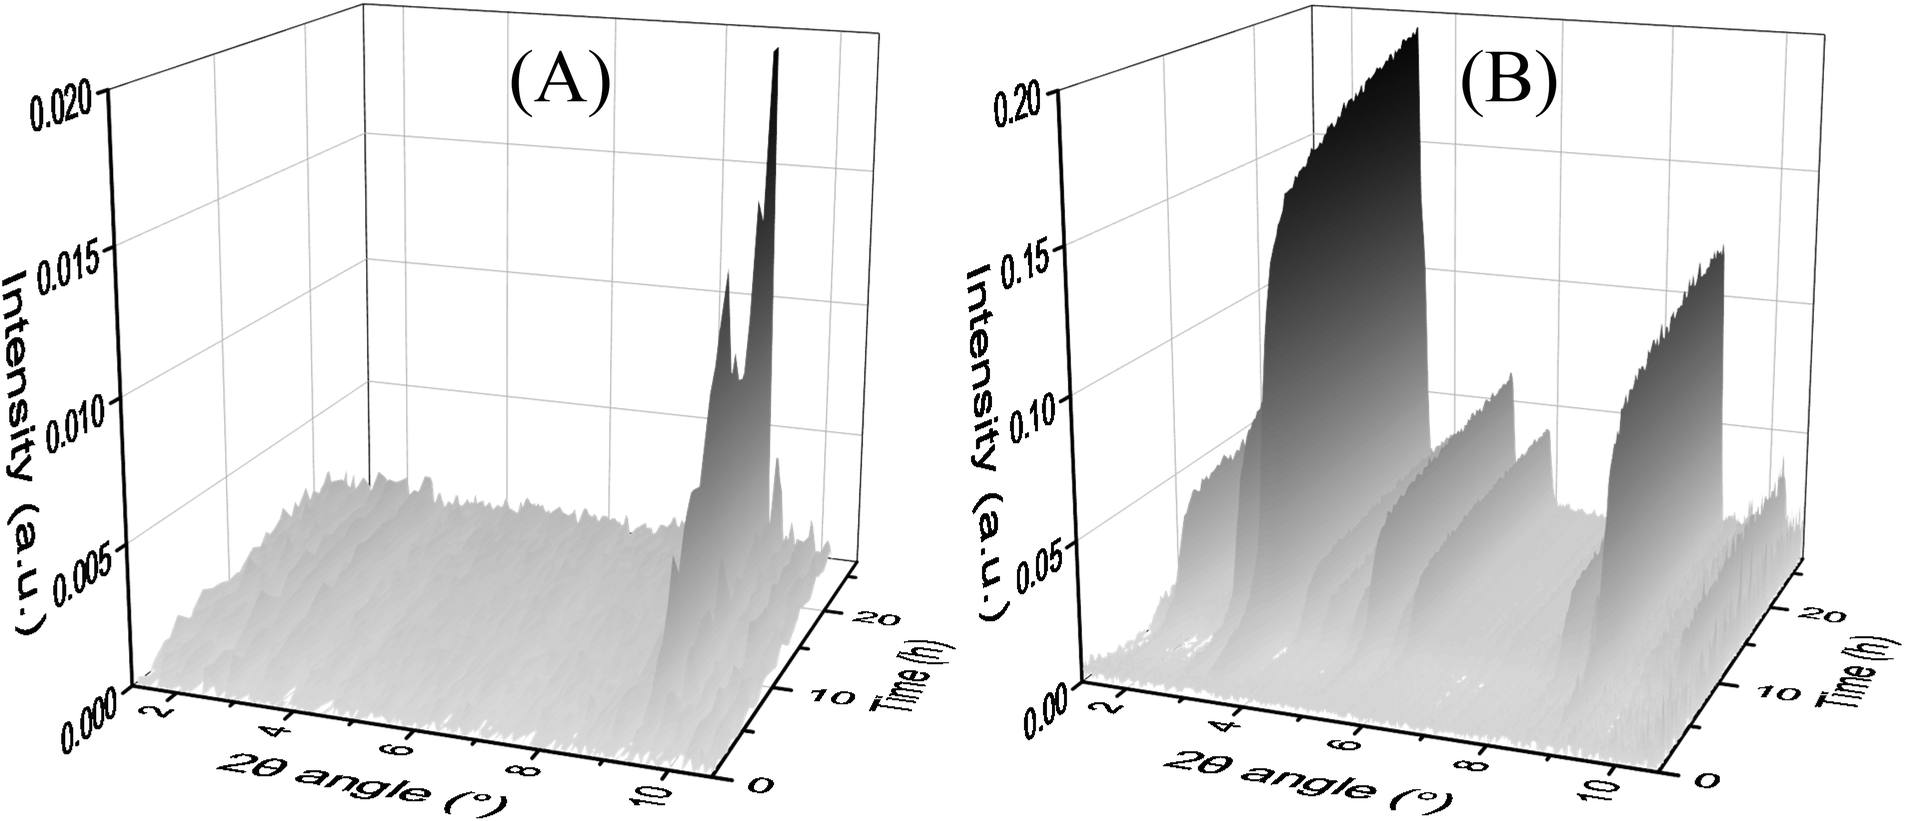 | ||
| Fig. 5 Time-resolved in situ MAXS measurements of the solvothermal synthesis at (A) 80 °C and (B) 85 °C. A 1:1 DMF:ethanol ratio and a 4:3 Fe(III):TPA ratio were used in both syntheses. | ||
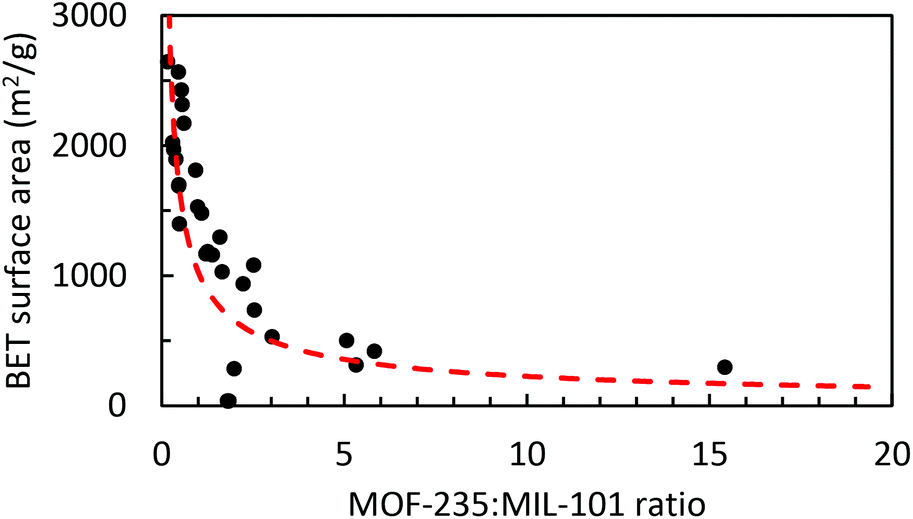 | ||
| Fig. 6 Graph showing the determined BET surface areas of the synthesis products plotted against their MOF-235:MIL-101 XRD peak height ratios. A power trendline (the red dashed line) shows the relationship between the MOF-235/MIL-101 content and surface area. | ||
Several studies found in the literature have reported the synthesis MOF-235(Fe) under similar synthesis conditions. However, the measured surface areas differ to a great extent (Table 3). The reason for this could be that, in some of the high-surface area reference studies, MIL-101 has formed simultaneously with the formation of MOF-235, contributing to an increased porosity and surface area. It is difficult to account for the very low surface areas determined in some of the published studies; it could be due to clogging by the species not removed from the narrow pores of MOF-235. Most references activated the MOFs in a vacuum, which should eliminate any trapped solvent. Another possibility is the presence of precipitated terephthalic acid or iron oxide, which at low concentrations would not be detectable by XRD/FTIR/XPS measurements. Insufficient washing with DMF and ethanol of the sample before drying could cause this to occur. In addition, the drying procedure can cause agglomeration and damage to the pore structure.44
:TPA and DMF:ethanol ratios used in the synthesis. A 1:1 DMF:ethanol ratio was used in all the references. V: vacuum oven
| Reference | Fe(III):TPA |
Activation | SABET (m2 g−1) |
|---|---|---|---|
| a Microwave-assisted synthesis. b Solvothermal synthesis. c Not explicitly stated, but their products were vacuum oven dried for other purposes. d Only the N2 adsorption isotherms were published, the given surface areas were calculated by us. e The calculation from the N2 isotherm to the BET surface area in the article was incorrect. The re-calculated value obtained using the data from the published isotherm is 147 m2 g−1. f FTIR was the only characterization method, i.e. no XRD data were presented in the reference. | |||
| Haque, 201132 | 0.60 | V: 100 °Cc |
24.5d |
| Sudik, 20052 | 0.60 | N/A | N/A |
| Duo, 201917 | 0.60 | V | 9.64 |
| Li, 201633a |
0.60 | V: 150 °C, 5 h | 148 |
| Li, 201633b |
0.60 | V: 150 °C, 5 h | 135 |
| Anbia, 201234 | 0.60 | V c | 147e |
| Le, 201618 | 1.00 | V: 150 °C, 3 h | 540 |
| De Smedt, 201535 | 0.60 | V: 150 °C | 8.09d |
| Wang, 201743 | 0.60 | V | 918f |
| Reference | Fe(III):TPA |
t (h) | SABET (m2 g−1) |
|---|---|---|---|
| a Microwave-assisted synthesis, T = 150 °C. b Using amino-terephthalic acid as a linker molecule, T = 150 °C. c Only the Langmuir surface area was given in the article, the BET surface area was calculated from the presented nitrogen adsorption isotherm. | |||
| Taylor-Pashow, 200930a |
1.0 | 0.17 | 2500c |
| Maksimchuk, 201224 | 2.0 | 20 | 3200 |
| Wu, 201348b |
1.3 | 24 | N/A |
| Barbosa, 201725 | 2.0 | 20 | N/A |
| Xie, 201720 | 2.0 | 20 | 2350 |
| Simsek, 201723 | 2.0 | 24 | N/A |
| He, 201927 | 1.0 | 20 | 601.3 |
| Gecgel, 201928 | 2.0 | 20 | 2865 |
| Li, 201921 | 2.0 | 20 | 1172.5 |
Another factor affecting the surface area and crystallinity is the material's stability over time. The SEM images taken a year after the synthesis revealed small amounts of sheet-like impurities in the ns2.5 sample (Fig. 9(A) and Fig. S35†), likely to be recrystallized TPA.45 BET analysis confirmed that the SA has decreased from 295 to 9.2 m2 g−1 (Fig. S33†).
XPS analyses
The chemical composition of the MOF samples via XPS measurements, on average, consists of 58 at% of carbon (C), 28 at% of oxygen(O), 11 at% of iron (Fe), <2 at% of chloride (Cl) and <1.0 at% of nitrogen (N) (Fig. S16†). The XPS spectra of the core level of iron, oxygen and carbon in the pure MOF-235 sample (ns2.5) are displayed in Fig. 8. In the core Fe 2p line, the binding energies of the spin-doublet Fe 2p3/2 and Fe 2p1/2 are located at 712.0 eV and 725.5 eV with the energy separation of 13.5 eV. These positions are higher than that in ferric oxide (Fe2O3, hematite), i.e. 711.0 eV.46 This shift is due to the polarization effect on the iron by the surrounding ligands which causes the de-shielding of the inner orbitals, i.e. the electron density decreases and the corresponding core electron-nucleus interaction increases. The associated shake-up satellites are strong (i.e. each area is 45% of the corresponding main peak) and +5.9 eV separated from each main line. The characteristic features of the spin-doublet refer to a ferric state (Fe3+) and those of the satellites refer to strong metal-to-ligand charge transfer and strong covalent bonding characteristics. Therefore, a paramagnetic ferric (Fe3+) ion complex is determined in both the MIL-101 and MOF-235 structures.47Carbon (Fig. 8(C)) in the form of C–C bonds (284.9 eV) and the carboxylic group (288.9 eV) are stemming from terephthalic acid (TPA). The N 1s signal (Fig. 7(B)) centered at 400.2 eV shows the presence of amine, most likely contributed from the DMF solvent. In the core O 1s and Cl 2p lines (Fig. 8(B) and Fig. 7(C) and (D)), there are Fe–O bonds (O 1s = 530.4 eV) and O–H bonding (O 1s = 533.1 eV) as well as chloride (Cl 2p3/2 = 198.1 eV). The large ratio of the C–O vs. C![[double bond, length as m-dash]](https://www.rsc.org/images/entities/char_e001.gif) O peak area (66.7/10.5 ≈ 6.4) indicates that the C…O– bond in the carboxylic group becomes the dominating feature, possibly due to the donation of electrons towards the Fe3+ ions in the clusters.
O peak area (66.7/10.5 ≈ 6.4) indicates that the C…O– bond in the carboxylic group becomes the dominating feature, possibly due to the donation of electrons towards the Fe3+ ions in the clusters.
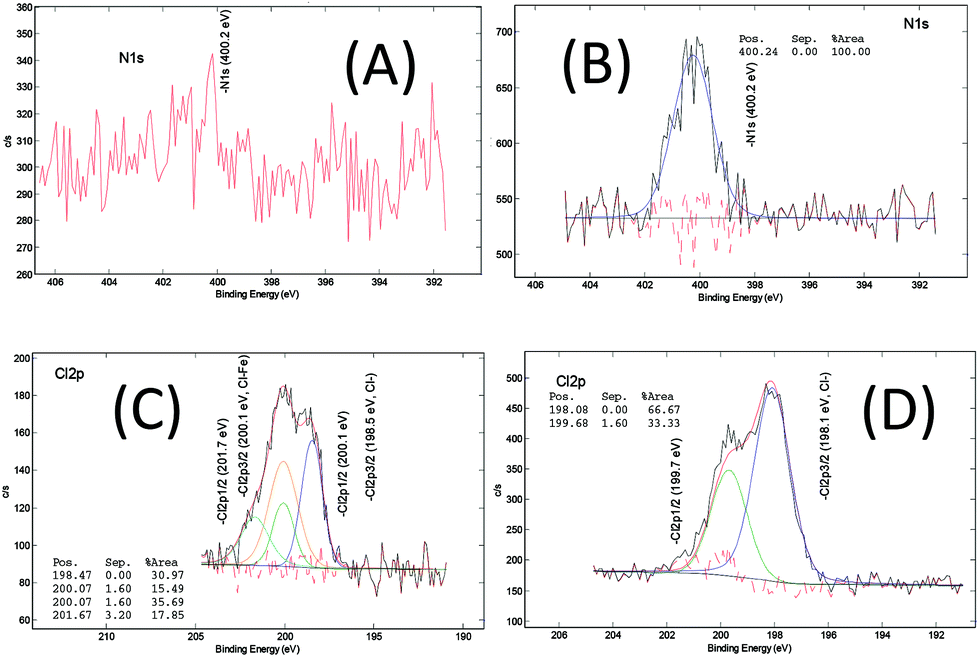 | ||
| Fig. 7 XPS core level spectra of N 1s of (A) ns2.7 (MIL-101) and (B) ns2.5 (MOF-235), and Cl 2p of (C) ns2.7 and (D) ns2.5. | ||
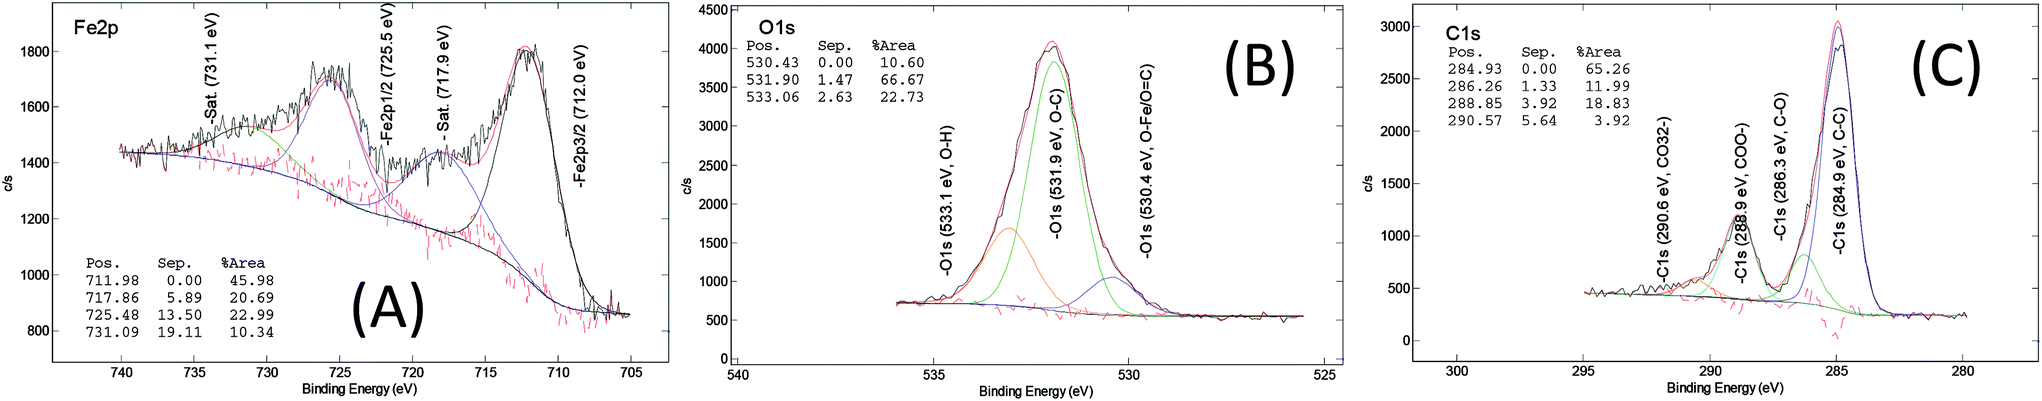 | ||
| Fig. 8 XPS core level spectra of (A) Fe 2p, (B) O 1s and (C) C 1s of the ns2.5 sample (MOF-235, [Fe3O(TPA)3(DMF)3][FeCl4]). | ||
After analyzing more samples, i.e. ns1.1, ns2.1, ns3.2, ns1.4, ns2.6, ns1.7, and ns3.7 (Fig. S17–26†), it can be concluded that the difference in the XPS spectra between the MOF-235 rich and MIL-101 rich products is minimal. The MIL-101 samples appear to contain less nitrogen and chlorine. We know from earlier studies that MOF-235(Al)39 requires DMF for structural stability. The framework of MOF-235 is positively charged, and therefore [FeCl4]− counter-ions are required to maintain the charge neutrality. This is not the case for MIL-101, as it is still highly porous without any occupying molecules. For the relatively low chlorine content in MIL-101, the two possible chemical states, i.e. the chloride ion (Cl 2p3/2: 198.5 eV) and iron chloride (Cl 2p3/2: 200.0 eV), after deconvolution, are close to the XPS detection limit, thus a clear distinction of the two states is difficult.
Dye adsorption study
The adsorption tests of ns2.7 and ns2.5 revealed that the MIL-101 phase exhibits a significantly larger adsorption capacity of methylene blue than the MOF-235 phase; 425 mg g−1vs. 276 mg g−1. The pH measured before and after adsorption showed that it increased from 3.9 and 3.8 to 4.8 and 4.6, respectively. In this pH range, both materials carry zeta potentials of approximately +20 mV (see Fig. 10). Since methylene blue is a positively charged molecule, there should be significant electrostatic repulsion forces between the adsorbent and adsorbate. Despite this, both materials show excellent adsorption capacities. Previous reports of these materials show lower adsorption efficiencies, e.g. 180 mg g−1 for MOF-235 (12 h, c0 = 180 ppm = 562 μM).32 The same study revealed that the capacity increased with increasing pH; from 110 mg g−1 at pH 5.0 to 220 mg g−1 at pH 10.5 (c0 = 30 ppm). Considering the molecular size of MB (17 × 7.6 × 3.3 Å3 (ref. 49)) and the previously reported channel diameter of MOF-235 (6.7 Å2), it is remarkable that MOF-235 exhibits such a high adsorption capacity. MIL-101(Cr) showed relatively low adsorption capacities for MB; 6.78 mg g−1.50 Doping MIL-101(Cr) with iron oxide (Fe3O4) resulted in a higher adsorption efficiency: 80 mg g−1 (c0 = 60 ppm).51 This indicates that the presence of iron(III) enhances the adsorption of MB in water. Chromium(III) is considered a hard Lewis acid in HSAB (hard and soft acids and bases) theory, while iron(III) is considered as an intermediate one. This could explain the difference in their adsorption capacities. However, amino-functionalized MIL-101(Al) showed an even greater adsorption capacity of 762 mg g−1 (c0 = 40 ppm, 30 °C, 0.05 mg mL−1 solid concentration).52 Since Al3+ is a hard acid, the enhanced adsorption could be due to some other factors.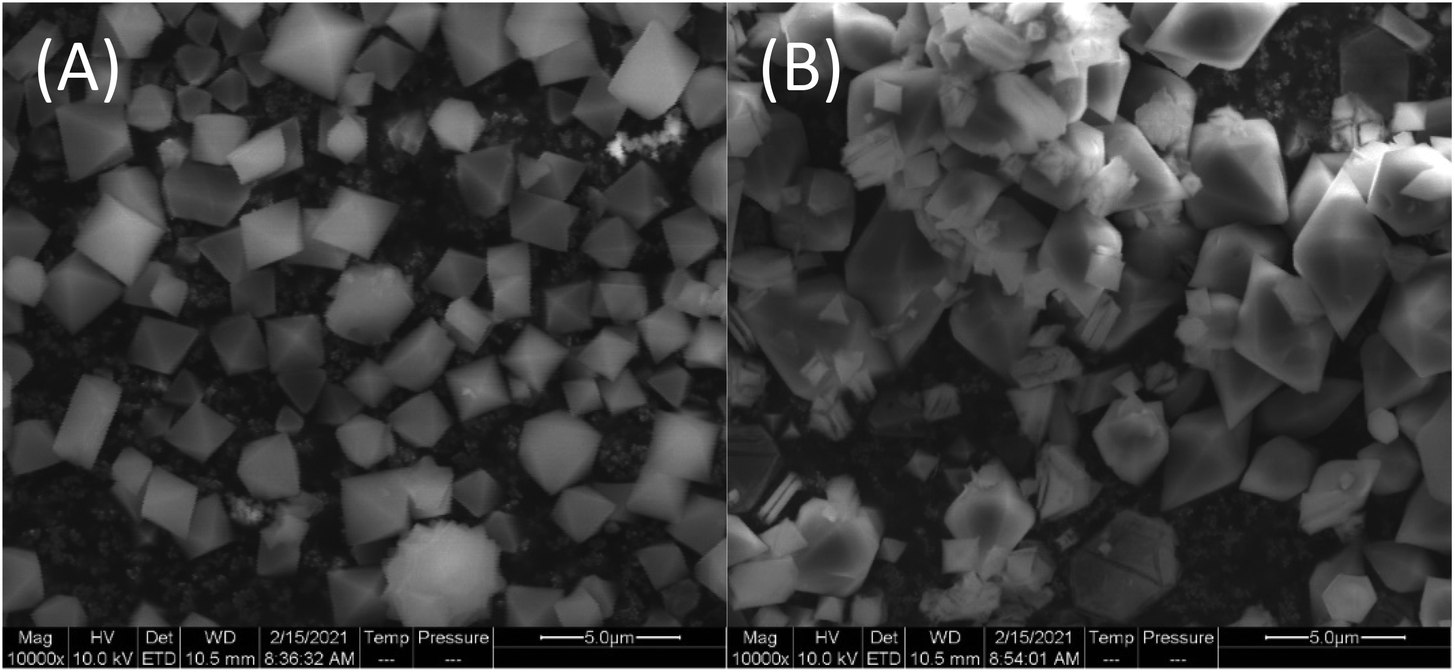 | ||
| Fig. 9 SEM images of (A) ns2.2–24 h (MIL-101(Fe), synthesis date: September 2020) and (B) ns2.5 (MOF-235(Fe), synthesis date: January 2020) at a magnification of 104. | ||
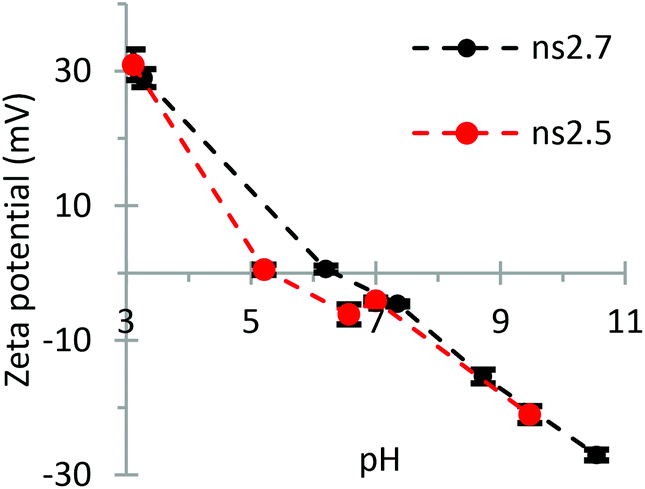 | ||
| Fig. 10 Zeta potentials at different pH values of ns2.7 (MIL-101) and ns2.5 (MOF-235). Each sample was analyzed six times and the error bars represent the calculated standard deviations. | ||
The zeta potential measurements in Fig. 10 show that there is little difference between the surface charge behaviors of MOF-235 and MIL-101. The ZP measurements of the particles carrying little or no charge, i.e. when pH approaches the isoelectric point (pHIEP), are often inaccurate as a low particle charge inhibits the particle movement during the analysis. This could explain the small difference in the ZP of the two materials around their IEP.
Conclusions
Despite obvious differences in the reported surface areas of MOF-235 in the literature, no-one has previously investigated the possibility of the simultaneous formation of MOF-235(Fe) and MIL-101(Fe) during the synthesis of MOF-235. We have shown, using extensive experimental methods such as XRD and in situ MAXS, that it appears to be difficult to obtain a pure phase of both MOFs. The formation of the respective phase depends on several factors. A larger DMF solvent fraction and lower temperature appear to favor MOF-235. Using a non-insulated vessel like a glass bottle facilitates more MIL-101, the more thermodynamically favored phase.To our knowledge, no one before has used non-synchrotron X-ray scattering for the in situ investigations of the crystallization of MOFs. In this study we have shown that the acquisition of time-resolved data is possible with an in-house Mat:Nordic device. In situ MAXS at different temperatures (80, 85, and 90 °C) showed no phase transformation during the solvothermal synthesis. At 80 °C only MOF-235 was formed, while the syntheses at 85 and 90 °C yielded only MIL-101.
With the combination of the afore-mentioned techniques, we concluded that the primary decisive factors through which the iron(III) TPA MOF product is formed are the synthesis temperature and DMF:ethanol solvent ratio. The Fe(III):TPA reagent ratio also plays a role in the synthesis; a higher ratio gives a larger yield and better crystallinity. More specifically, a near-pure MIL-101 phase with a BET surface area of 2600 m2 g−1 and a yield of 95% was obtained by using a 4:3 ratio of Fe(III):TPA, a 1:1 ratio of DMF:ethanol, and an equilibration time of 2 days (“ns2.7”). To obtain MOF-235, the DMF solvent content has to be increased, resulting in a product with a lower degree of porosity and subsequently a lower surface area: 295 m2 g−1, in a 67% yield (“ns2.5”). XPS analysis revealed that MIL-101 contained smaller amounts of nitrogen and chlorine than MOF-235. Both products showed enhanced adsorption efficiencies of methylene blue: 425 and 276 mg g−1 for MIL-101 and MOF-235, respectively.
To our knowledge, the synthesis of MIL-101 has never previously been performed in an ethanol:DMF solvent mixture at a temperature as low as 80 °C. The possibility of creating a high-surface area MOF with a smaller amount of DMF and at a lower temperature provides further applicability to these kinds of materials.
Conflicts of interest
There are no conflicts to declare.Acknowledgements
This work was funded by the Bo Rydin Foundation for Scientific Research.References
- K. Momma and F. Izumi, J. Appl. Crystallogr., 2011, 44, 1272–1276 CrossRef CAS.
- A. C. Sudik, A. P. Côté and O. M. Yaghi, Inorg. Chem., 2005, 44, 2998–3000 CrossRef CAS PubMed.
- S. Han, Y. Huang, T. Watanabe, S. Nair, K. S. Walton, D. S. Sholl and J. C. Meredith, Microporous Mesoporous Mater., 2013, 173, 86–91 CrossRef CAS.
- S. Kumar, A. Arora, J. Kaushal, P. Oswal, A. Kumar and K. Tomar, New J. Chem., 2019, 43, 4338–4341 RSC.
- J. A. Mason, K. Sumida, Z. R. Herm, R. Krishna and J. R. Long, Energy Environ. Sci., 2011, 4, 3030–3040 RSC.
- O. Lebedev, F. Millange, C. Serre, G. Van Tendeloo and G. Férey, Chem. Mater., 2005, 17, 6525–6527 CrossRef CAS.
- S. Li, Y. Chen, X. Pei, S. Zhang, X. Feng, J. Zhou and B. Wang, Chin. J. Chem., 2016, 34, 175–185 CrossRef CAS.
- V. Chernikova, O. Yassine, O. Shekhah, M. Eddaoudi and K. N. Salama, J. Mater. Chem. A, 2018, 6, 5550–5554 RSC.
- E.-X. Chen, H.-R. Fu, R. Lin, Y.-X. Tan and J. Zhang, ACS Appl. Mater. Interfaces, 2014, 6, 22871–22875 CrossRef CAS PubMed.
- S. Homayoonnia and S. Zeinali, Sens. Actuators, B, 2016, 237, 776–786 CrossRef CAS.
- V. Stavila, R. Parthasarathi, R. W. Davis, F. El Gabaly, K. L. Sale, B. A. Simmons, S. Singh and M. D. Allendorf, ACS Catal., 2016, 6, 55–59 CrossRef CAS.
- H. Zhao, Y. Chen, Q. Peng, Q. Wang and G. Zhao, Appl. Catal., B, 2017, 203, 127–137 CrossRef CAS.
- X. Chen, R. Tong, Z. Shi, B. Yang, H. Liu, S. Ding, X. Wang, Q. Lei, J. Wu and W. Fang, ACS Appl. Mater. Interfaces, 2018, 10, 2328–2337 CrossRef CAS PubMed.
- K. Suresh and A. J. Matzger, Angew. Chem., 2019, 131, 16946–16950 CrossRef.
- I. Abánades Lázaro, C. J. Wells and R. S. Forgan, Angew. Chem., Int. Ed., 2020, 59, 5211–5217 CrossRef PubMed.
- I. M. Hönicke, I. Senkovska, V. Bon, I. A. Baburin, N. Bönisch, S. Raschke, J. D. Evans and S. Kaskel, Angew. Chem., Int. Ed., 2018, 57, 13780–13783 CrossRef.
- H. Duo, H. Tang, J. Ma, X. Lu, L. Wang and X. Liang, New J. Chem., 2019, 43, 15351–15358 RSC.
- T. D. Le, K. D. Nguyen, V. T. Nguyen, T. Truong and N. T. Phan, J. Catal., 2016, 333, 94–101 CrossRef CAS.
- J. Tang, M. Yang, M. Yang, J. Wang, W. Dong and G. Wang, New J. Chem., 2015, 39, 4919–4923 RSC.
- Q. Xie, Y. Li, Z. Lv, H. Zhou, X. Yang, J. Chen and H. Guo, Sci. Rep., 2017, 7, 1–15 CrossRef CAS.
- Z. Li, X. Liu, W. Jin, Q. Hu and Y. Zhao, J. Colloid Interface Sci., 2019, 554, 692–704 CrossRef CAS PubMed.
- Y. Chen, R. Babarao, S. Sandler and J. Jiang, Langmuir, 2010, 26, 8743–8750 CrossRef CAS PubMed.
- U. B. Simsek, C. Gecgel and M. Turabik, 2nd International Mediterranean Science and Engineering Congress (IMSEC 2017), 2017 Search PubMed.
- N. V. Maksimchuk, K. A. Kovalenko, V. P. Fedin and O. A. Kholdeeva, Chem. Commun., 2012, 48, 6812–6814 RSC.
- A. D. Barbosa, D. Julião, D. M. Fernandes, A. F. Peixoto, C. Freire, B. de Castro, C. M. Granadeiro, S. S. Balula and L. Cunha-Silva, Polyhedron, 2017, 127, 464–470 CrossRef CAS.
- A. M. Balu, C. S. K. Lin, H. Liu, Y. Li, C. Vargas and R. Luque, Appl. Catal., A, 2013, 455, 261–266 CrossRef CAS.
- L. He, Y. Dong, Y. Zheng, Q. Jia, S. Shan and Y. Zhang, J. Hazard. Mater., 2019, 361, 85–94 CrossRef CAS PubMed.
- C. Gecgel, U. B. Simsek, B. Gozmen and M. Turabik, J. Iran. Chem. Soc., 2019, 16, 1735–1748 CrossRef CAS.
- J. Wang, D. Chen, B. Li, J. He, D. Duan, D. Shao and M. Nie, Sci. Rep., 2016, 6, 26126 CrossRef CAS PubMed.
- K. M. Taylor-Pashow, J. Della Rocca, Z. Xie, S. Tran and W. Lin, J. Am. Chem. Soc., 2009, 131, 14261–14263 CrossRef CAS PubMed.
- J. A. Marsella, Kirk–Othmer Encyclopedia of Chemical Technology, 2000 Search PubMed.
- E. Haque, J. W. Jun and S. H. Jhung, J. Hazard. Mater., 2011, 185, 507–511 CrossRef CAS PubMed.
- Y. Li, G. Hou, J. Yang, J. Xie, X. Yuan, H. Yang and M. Wang, RSC Adv., 2016, 6, 16395–16403 RSC.
- M. Anbia, V. Hoseini and S. Sheykhi, J. Ind. Eng. Chem., 2012, 18, 1149–1152 CrossRef CAS.
- C. De Smedt, P. Spanoghe, S. Biswas, K. Leus and P. Van Der Voort, Adsorption, 2015, 21, 243–254 CrossRef CAS.
- M. G. Goesten, F. Kapteijn and J. Gascon, CrystEngComm, 2013, 15, 9249–9257 RSC.
- M. G. Goesten, E. Stavitski, J. Juan-Alcaniz, A. Martinez-Joaristi, A. V. Petukhov, F. Kapteijn and J. Gascon, Catal. Today, 2013, 205, 120–127 CrossRef CAS.
- E. Stavitski, M. Goesten, J. Juan-Alcañiz, A. Martinez–Joaristi, P. Serra-Crespo, A. V. Petukhov, J. Gascon and F. Kapteijn, Angew. Chem., 2011, 123, 9798–9802 CrossRef.
- M. G. Goesten, P. C. Magusin, E. A. Pidko, B. Mezari, E. J. Hensen, F. Kapteijn and J. Gascon, Inorg. Chem., 2014, 53, 882–887 CrossRef CAS PubMed.
- X. Yang and A. E. Clark, Inorg. Chem., 2014, 53, 8930–8940 CrossRef CAS.
- S.-H. Huo and X.-P. Yan, J. Mater. Chem., 2012, 22, 7449–7455 RSC.
- Y. M. Mos, A. C. Vermeulen, C. J. Buisman and J. Weijma, Geomicrobiol. J., 2018, 35, 511–517 CrossRef CAS.
- S. Wang, H. Niu, T. Zeng, X. Zhang, D. Cao and Y. Cai, Microporous Mesoporous Mater., 2017, 239, 390–395 CrossRef CAS.
- B. Wang, W. Zhang, W. Zhang, A. S. Mujumdar and L. Huang, Dry. Technol., 2005, 23, 7–32 CrossRef CAS.
- C. Liu, C. Gao, W. Xia and P. Cao, Research of Purifying Terephthalic Acid and Recycling PET, 2010 4th International Conference on Bioinformatics and Biomedical Engineering, 2010, pp. 1–4, IEEE Search PubMed.
- C. Wagner, W. Riggs, L. Davis, J. Moulder, G. Muilenberg and M. N. Eden Prairie, Handbook of X-Ray Photoelectron Spectroscopy, 1st edn, 1979, p. 38 Search PubMed.
- S. Srivastava, S. Badrinarayanan and A. Mukhedkar, Polyhedron, 1985, 4, 409–414 CrossRef CAS.
- X. Wu, Z. Bao, B. Yuan, J. Wang, Y. Sun, H. Luo and S. Deng, Microporous Mesoporous Mater., 2013, 180, 114–122 CrossRef CAS.
- M. Arias, E. López, A. Nuñez, D. Rubinos, B. Soto, M. Barral and F. Díaz-Fierros, in Effect of Mineral-Organic-Microorganism Interactions on Soil and Freshwater Environments, Springer, 1999, pp. 361–365 Search PubMed.
- T. Shen, J. Luo, S. Zhang and X. Luo, J. Environ. Chem. Eng., 2015, 3, 1372–1383 CrossRef CAS.
- Y.-F. Huang, Y.-Q. Wang, Q.-S. Zhao, Y. Li and J.-M. Zhang, RSC Adv., 2014, 4, 47921–47924 RSC.
- E. Haque, V. Lo, A. I. Minett, A. T. Harris and T. L. Church, J. Mater. Chem. A, 2014, 2, 193–203 RSC.
Footnote |
| † Electronic supplementary information (ESI) available. See DOI: 10.1039/d0dt04341a |
| This journal is © The Royal Society of Chemistry 2021 |