 Open Access Article
Creative Commons Attribution 3.0 Unported Licence
X-Ray and ultraviolet photoelectron spectroscopy studies of Uranium(IV),(V) and(VI) exposed to H2O-plasma under UHV conditions
Ghada
El Jamal
 *a,
Thomas
Gouder
b,
Rachel
Eloirdi
b and
Mats
Jonsson
 a
a
aKTH, School of Engineering Sciences in Chemistry, Biotechnology and Health (CBH), Department of Chemistry, Applied Physical Chemistry, Sweden. E-mail: ghadaej@kth.se
bEuropean Commission, Joint Research Centre, Directorate for Nuclear Safety and Security, Postfach 2340, DE-76215 Karlsruhe, Germany
First published on 9th December 2020
Abstract
Thin films of UO2, U2O5, and UO3 were prepared in situ and exposed to reactive gas plasmas of O2, H2 and H2O vapour produced with an ECR plasma source (electron cyclotron resonance) under UHV conditions. The plasma constituents were analysed using a residual gas analyser mass spectrometer. For comparison, the thin films were also exposed to the plasma precursor gases under comparable conditions. Surface analysis was conducted using X-Ray and ultraviolet photoelectron spectroscopy before and after exposure, by measuring the U 4f, O 1s core levels and the valence band region. The evolution of the peaks was monitored as a function of temperature and time of exposure. After interacting with water plasma at 400 °C, the surface of UO2 was oxidized to a higher oxidation state compared to when starting with U2O5 while the UO3 film displayed weak surface reduction. When exposed to water plasma at ambient temperature, the outermost surface layer is composed of hexavalent uranium in all three cases.
Introduction
The major route for matrix dissolution of uranium oxide based spent nuclear fuel and the subsequent release of radionuclides in a geological repository, is radiation-induced oxidation.1 Ionizing radiation emitted from the spent nuclear fuel will induce radiolysis of the surrounding groundwater in the event of a complete barrier failure. Radiolysis of water produces both oxidants (HO˙, H2O2 and ) and reductants (eaq−, H˙, H2) of which the oxidants display significantly higher reactivity towards the UO2 matrix. A large number of studies have been performed on radiation-induced oxidative dissolution of spent nuclear fuel. They varied from hot-cell studies on leaching of real spent nuclear fuel2–4 to lab experiments using UO2-powder,5 UO2-pellets doped with non-radioactive isotopes of fission products6–8 or alpha-emitters9 suspended in aqueous solutions with or without H2O2
![[thin space (1/6-em)]](https://www.rsc.org/images/entities/char_2009.gif) 5 or exposed to external gamma-fields in aqueous systems.10–13 Due to the complexity of even the simplest of the model systems, many mechanistic aspects have only been indirectly confirmed from experiments. The reaction between the molecular radiolysis product H2O2 and UO2 is one example. Studies have shown that H2O2 is the main oxidant responsible for oxidative dissolution of UO2 under conditions relevant in the safety assessment of a geological repository.14 H2O2 can also undergo catalytic decomposition on the UO2 surface.1 Both reactions have a common intermediate, the surface bound hydroxyl radical and occur on the same surface sites.15 Electrochemical studies have indicated that catalytic decomposition of H2O2 on UO2 requires the presence of uranium in higher oxidation state than +IV16 and recent studies of H2O2-induced leaching of UO2 have shown that the redox reactivity of UO2 (towards H2O2) decreases with H2O2 exposure and that this trend is accompanied by a change in the uranium oxidation state even under conditions where dissolution of U(VI) is favoured.17,18 To better understand these trends, alternative experimental methods are called for.
5 or exposed to external gamma-fields in aqueous systems.10–13 Due to the complexity of even the simplest of the model systems, many mechanistic aspects have only been indirectly confirmed from experiments. The reaction between the molecular radiolysis product H2O2 and UO2 is one example. Studies have shown that H2O2 is the main oxidant responsible for oxidative dissolution of UO2 under conditions relevant in the safety assessment of a geological repository.14 H2O2 can also undergo catalytic decomposition on the UO2 surface.1 Both reactions have a common intermediate, the surface bound hydroxyl radical and occur on the same surface sites.15 Electrochemical studies have indicated that catalytic decomposition of H2O2 on UO2 requires the presence of uranium in higher oxidation state than +IV16 and recent studies of H2O2-induced leaching of UO2 have shown that the redox reactivity of UO2 (towards H2O2) decreases with H2O2 exposure and that this trend is accompanied by a change in the uranium oxidation state even under conditions where dissolution of U(VI) is favoured.17,18 To better understand these trends, alternative experimental methods are called for.
An interesting approach with potential to provide additional mechanistic insights is to expose uranium oxide films of well controlled oxidation state to water plasma in vacuum systems. The plasma chemistry of water resembles the radiation chemistry of liquid water in the sense that many of the products are the same. In fact, the plasma chemistry of water is identical to the radiation chemistry of water vapor in terms of reactive species and reactions involved. A complete review of water vapour radiation chemistry was given by Dixon and later also by Willis and Boyd.19,20 In summary, only two modes of dissociation need to be accounted for:21
| H2O* → H2 + O | (1) |
| H2O* → H + OH | (2) |
The second process has been shown to be the dominant one (90%).21 When comparing liquid water radiolysis, to a water plasma, it is important to keep in mind that in a plasma exposure experiment the reactions do not occur in a condensed phase and therefore the influence of solvation on the reactivity of the constituents of the plasma as well as on the reactivity of the surface is not reproduced.
In most surface science studies the vacuum (UHV) conditions ensures that the surface is not altered by the laboratory atmosphere.
A large number of actinide surface characterization studies have been conducted.22 Cyclic voltammetry results showed that the dissolution mechanism found for UO2 pellets23 can also be applied to film electrodes.24,25 The surface oxidation of U and Pu with atomic oxygen show that UO2 is transformed to UO3, while PuO2 is only covered by chemisorbed oxygen, which is desorbed at 200 °C.25 The co-deposition with cesium produced uranium in higher valence states (up to U(VI))26,27 and electrochemical studies have shown a decrease in dissolution of the UO2 matrix with increasing Pd concentration.28
Idriss concluded that the dissociation of H2O vapor on polycrystalline UO2 is favored at defective surfaces and oxidation proceeds through oxygen diffusion.29 Surface chemistry studies were also conducted on the anoxic dissolution of a single-crystalline thin film of UO2.30,31 The authors concluded that dissolution and precipitation of uranium occurs via the tetravalent form instead of the hexavalent one. Another study revealed that the dissolution is initiated at surface grain boundaries and film cracks which was passivated with an oxidized layer via oxygen substitution into the central octahedral interstitial site into the UO2 lattice.32
The uranium oxide system is characterized by a wide range of different stoichiometries ranging from UO2 to UO3. There are different crystallographic structures in between: from fluorite-type for UO2 and up to higher stoichiometry with layered structures.33–37
In this work we have explored the possibility of using O2-, H2- and H2O-plasmas for controlled surface modification of uranium oxide films under UHV conditions. This enabled us to produce films consisting of pure UO2, U2O5 and UO3, containing uranium in the oxidation states +4, +5 and +6, respectively. These films were subsequently exposed to water plasma and the chemical changes observed using XPS and UPS were compared to the effects of O2- and H2-plasmas or gases, respectively.
Experimental
Sample preparation
Uranium oxide films were prepared in situ starting with a UO2 composition by direct current (DC) sputtering from a uranium metal target in a gas mixture of Ar (6N) and O2 (5N). The conditions were optimized to form pure 20 nm thick UO2.0 films. The Ar pressure was maintained at 5 × 10⁻³ mbar and the O2 partial pressure (10−6 mbar to 2 × 10⁻⁶ mbar). Composition is confirmed by the binding energy of the U 4f states (extremely sensitive to small changes in composition, because of the Fermi-energy) and by the adsorption of metallic Na, which on such treated surfaces stays metallic (it would react with surplus oxygen). The uranium target voltage was fixed at −700 V. The thin films were deposited at 400 °C on polycrystalline Au substrates, cleaned by annealing to 200 °C for 10 min. Gold was an ideal substrate because of its electrical conductivity, high melting point and low chemical reactivity. Chemical reactions are thus confined to the thin film and there is not diffusion of atoms (O, H, U) from the film into the substrate despite the elevated temperatures. The deposition time was 900 seconds. The plasma in the diode source was maintained by injection of electrons of 25–50 eV energy (triode setup), allowing working at low Ar pressure in the absence of stabilizing magnetic fields. UO3 films were prepared by exposing the UO2 films to the oxygen plasma.38 U2O5 was obtained by reducing UO3 when exposing it to a mixed gas plasma of H2O + H2 within the ratio 70–30% respectively, also produced by the ECR source.ECR plasma source
The electrons are excited by an ECR (Electron Cyclotron Resonance) discharge based on stochastic heating of electrons by microwave radiation launched into the plasma chamber, typically from a waveguide. Permanent magnets established an external magnetic field necessary for the resonant interaction between the electrons and the microwave electric field in which the electron gyro frequency ωCE matched the (angular) frequency of the microwaves ω:| ω = ωCE = eB/me | (3) |
If the resonance condition is fulfilled, the electrons gain sufficient energy to ionize the gas and sustain the plasma.33 In addition, they produce excited species, free radicals, and ions providing a reactive plasma environment. Ionization and chemical processes in such non-equilibrium plasmas are directly determined by electron temperature and, therefore, are not so sensitive to thermal processes and temperature of the gas.
The gas plasma was generated in a reactor Gen I from Tectra GmbH, Frankfurt/M, made of alumina (about 20 cm3) and placed about 20 mm above the sample. The front plate is a specially designed aperture plate that has a number of small holes (0.2 mm diameter) through which the plasma can diffuse to the sample. The aperture which showers the gas uniformly over the wafer surface, inhibits ions from escaping from the plasma, yet allows reactive neutrals to escape and to form the dominant beam fraction. It precludes fast diffusion of plasma out of the reactor and ensures thermalization of plasma particles by multiple scattering with the gas particles in the reactor. As a result, plasma radiation damage is avoided (sputter effect). In addition, this setup ensures a pressure gradient between plasma chamber and sample, so that the necessary threshold pressure for plasma stability (about 10−2 mbar) can be reached inside the reactor, while the chamber is kept at about 10−5 mbar. Three types of feed-gas were used to generate reactive plasmas: H2O, O2, and H2. A mixed H2O/H2 plasma was used a few times to prepare the U2O5 films (see above). The atom flux is specified to >1016 atoms per cm2 per s, corresponding to an exposure up to 20 s of roughly 10 Langmuir. In all of the experiments, the samples heated to 400 °C during the plasma exposure which lasted for ten minutes unless otherwise stated. We used an electron beam heater installed below the sample holder and measured the temperature at the surface of the film with a thermocouple. We set the desired temperature, waited for 5 minutes to allow the oxide film to reach the sample holder's temperature. The heating process is tuned automatically in order to keep the temperature constant during the exposure.
RGA mass spectrometer
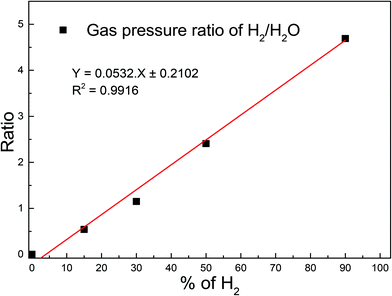
Before introducing any gas into the plasma chamber, mass spectrometer data was collected in order to check the cleanliness of the vacuum system. The real-time process gas analysis was carried out using a Residual Gas Analyser (RGA) based on the linear quadrupole mass filtering technique. The RGA was not placed in direct line of sight of the plasma chamber, so gas particles could only be detected after previous scattering with other gas particles or the chamber walls. This suppressed the signal of unstable species which react during the scattering events. To deduce partial pressure values from signal intensities calibration of the RGA was necessary. We did this calibration for a series of H2O/H2 mixtures to check the correctness of the quantification of gas phase composition made by RGA within a single measurement.To do that we measured the RGA intensity ratio of H2 (m/z = 2) to H2O (m/z = 18) for each mixture. Fig. 1 shows the plot of the ratio as function of H2 content corresponding to a linear relationship. Thus, we conclude that the relative intensity distribution of species measured by RGA is a true representation of the actual concentration of the primary fragments, because of the linear relationship. Gas pressures were kept constant by a flowmeter setup to ensure stable plasma conditions. This was especially important for mixed gases.
Surface characterisation
After each exposure, the sample was transferred immediately under UHV to the analysis chamber where compositional surface analysis was done using XPS and UPS (Specs Phoibos 150 hemispherical analyser). This is a non-destructive technique which gives a direct picture of surface composition, electronic structure and chemical state of U in the films. XPS was done using monochromatized Al Kα (1486.6 eV) radiation, produced by a SPECS μ-focus source. UPS spectra were taken with He II (40.81 eV) UV light, produced by a high intensity windowless discharge lamp.Results and discussion
Plasma characteristics
Given the design of the experimental set-up it is important to assess the impact of the different plasma constituents on the uranium oxide film. As pointed out above, mainly charge-neutral species can escape the plasma source to the sample chamber, where the pressure is around 10−5 mbar and reach the uranium oxide films placed at a certain distance from the plasma source. Particle collisions occur only at high pressures inside the plasma source, and have very low probability to occur at low pressures such as 10−5 mbar.39 However, gas particles may to some extent run into the walls scattering back before reaching the film. We will first study the one element plasmas (O, H) to assess the action of pure oxygen and hydrogen, and then the water plasma, presenting a mixture of both elements.When splitting molecular oxygen, O2, with electron collisions, atomic oxygen is the only product expected to be formed.40 The process of dissociative excitation is also a source of atomic oxygen in the ground state as well as in an excited state.41 Many studies investigated oxygen plasmas40,42–45 and results varied in terms of the role of atomic oxygen or molecular O2 in oxidation processes. Different techniques such as mass spectrometry, actinometry, laser induced fluorescence were used to follow the concentration of atomic oxygen in O2 radio-frequency (RF) diode and microwave discharges. Some used mass spectrometry to prove that O2 is the main chemical etching reagent in a reactive-ion-etching (RIE) discharge.42,43 Others followed ground-state atomic oxygen using laser-induced fluorescence spectroscopy (LIFS) and reported the atomic oxygen as the main etching reagent for an ECR reactor.40,44
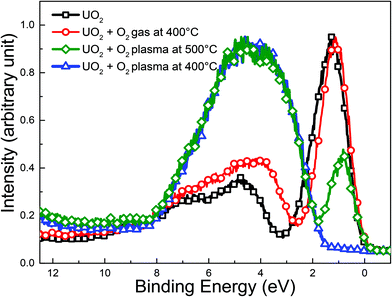
Formation of atomic oxygen is confirmed in the paper by Anton et al.,45 developers of the Tectra ECR plasma source. They reported an atom flux on the sample surface of 2 × 10¹⁶ atoms cm−2 s−1, corresponding to 4 Langmuir per s which would also be produced by a gas at 4 × 10⁻⁶ mbar. The atomic oxygen was monitored indirectly by following the oxidation of a freshly deposited Ag film, which does not react with molecular O2 (when the plasma source was switched off) at ambient temperature. A similar comparison using XPS to follow the oxidation of UO2 upon exposure to the O2 plasma was performed here. Four cases were analyzed: a reference UO2 film, a UO2 film exposed to oxygen gas at 400 °C and two UO2 films exposed to O2-plasma at 500 °C and 400 °C respectively. The results are displayed in Fig. 2. After ten minutes of exposure to the O2-plasma, the UO2 film is transformed into UO3. This was shown by the valence band spectra recorded with XPS in Fig. 2. The starting compound, UO2 (black squares) shows an intense symmetric U 5f peak around 1.25 eV and much less intense O 2p band between 2 and 11 eV. The occupation of 5f level gives direct information on uranium oxidation states. Uranium in UO2, U2O5 and UO3 films has the electronic configuration [Rn] 5f2, [Rn] 5f1 and [Rn] 5f0 respectively. Therefore UO2 has an intense U 5f peak while UO3 has no 5f emission.46 UO2 oxidation can thus directly be deduced from the height of the U 5f peak.
The peak should be compared to a reference line in order to exclude other sources of intensity variation such as modified uranium concentration, damping over layers, change in lamp intensity, etc. One simple way is to compare the U 5f to the O 2p, which can be done directly in Fig. 2. A more quantitative analysis of the oxidation state, provided by the U 5f/U 4f intensity ratio will be provided later in this paper. After exposure to oxygen gas (red circles), the U 5f band decreases in intensity while the O 2p band grows a little bit. This indicates a slight oxidation. The U 5f line narrows upon oxidation. This is attributed to the U 5f multiple structure, changing from the 5f1 final state doublet (5f5/21 and 5f7/21) associated with a U 5f2 initial state configuration to a final state 5f0 singlet, associated with a U 5f1 initial state.38 After O2-plasma exposure at 500 °C (green diamonds), the U 5f peak intensity diminishes markedly. This reflects a transition from U(IV) to U(V) and U(VI). The opposite change is observed for the O 2p band which gains intensity from bonding with uranium. Its shape changes during oxidation. In UO3 the O 2p is almost symmetrical, in contrast to UO2, where it has a shoulder on the high binding energy side. This reflects the different electronic structure of the two oxides. The oxidation of UO2 is even more enhanced after O2 plasma exposure at lower temperature (400 °C, blue triangles) which is confirmed by the absence of any U 5f band emission between 1 and 2 eV. The oxygen plasma exposure thus results in complete oxidation of the UO2 film to UO3 at 400 °C. The clear difference between the two types of exposures (gas vs. plasma) confirms that atomic oxygen is the oxidant of primary importance in the O2-plasma in the present experimental set-up. The significant difference in oxidation between the UO2 films exposed to the O2-plasma at 400 °C and 500 °C, respectively, can be attributed to the thermal instability of UO3. This has been demonstrated in a recent work on thin films of UO3 under UHV.47,48
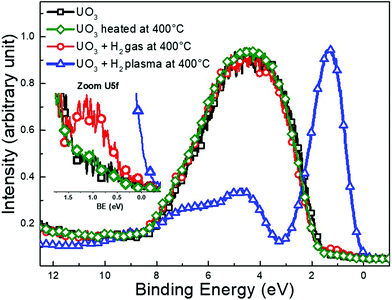
When splitting H2 with electron collisions atomic hydrogen is produced.40 In order to assess the impact of hydrogen atoms in our experimental set-up, we performed control experiments to compare the reduction of UO3 films by a H2-plasma to that by H2-gas. In both cases, the films were heated to 400 °C for ten minutes during exposure and the valence band was monitored with XPS. A fourth film of UO3 was annealed to 400 °C for 10 minutes as a background check of thermally induced decomposition.
Fig. 3 shows the valence band spectrum of the initial UO3 film (black squares) where only the O 2p band is visible and the U 5f intensity is zero. The spectrum of UO3 heated to 400 °C (green diamonds) is identical to pure UO3, reflecting perfect thermal stability of films under the present conditions. The exposure of UO3 to H2 only induces marginal changes to the valence band spectra (red circles). By zooming at the U 5f band a very slight increase in intensity is observed after H2 exposure which reflects a very weak reduction occurring at the surface.
After H2-plasma exposure the spectrum (blue triangles) exhibits an intense U 5f band at 1.3 eV and a weak O 2p band from 3 to 11 eV with special features. The spectrum is typical for UO2![[thin space (1/6-em)]](https://www.rsc.org/images/entities/char_2009.gif) 38 and reflects the complete reduction of UO3 upon exposure to the H2-plasma.
38 and reflects the complete reduction of UO3 upon exposure to the H2-plasma.
The clear difference between the H2 gas and the H2-plasma exposures indicates that atomic hydrogen is the main reductant originating from the H2-plasma in the present set-up.
The plasma chemistry of water is considerably more complex than that of the H2- and O2-plasmas. The splitting of water primarily produces H and OH which can recombine to form H2, H2O2 and H2O. At higher plasma temperatures, a water plasma also yields atomic oxygen. Consequently, the H2O-plasma will contain a mixture of strong oxidants and strong reductants.
Fig. 4(a) shows the mass spectrum of H2O in the absence of a plasma. The dominant peak (m/z = 18) is due to H2O. The cations corresponding to water molecule fragmentation by RGA-MS appear at mass 1 and in the mass range 16–20. The spectrum presented in Fig. 4(b) was acquired under the same conditions used to acquire the data in Fig. 4(a) after igniting the plasma.
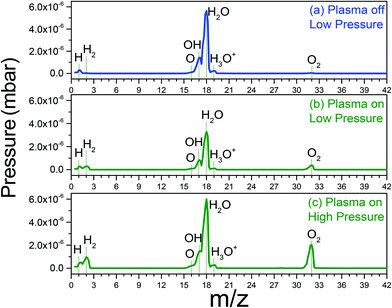 | ||
| Fig. 4 RGA data (a) low pressure of water vapour in main chamber, (b) low pressure of water vapor plasma on, (c) high pressure of water vapour plasma on. | ||
When the plasma is switched on, the intensities of the water related peaks immediately drops and two new peaks appear at m/z = 2 and 32 corresponding to H2 and O2 molecules, respectively. At higher water pressure and with the plasma switched on, the H2 and O2 peaks have higher intensities (Fig. 4(c)). This implies that significant amounts of atomic oxygen are formed in the H2O-plasma in the present set-up. This is important to bear in mind since atomic oxygen is not an aqueous radiolysis product.
Oxide behavior
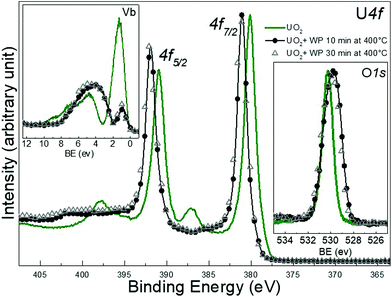
Three different types of uranium oxide thin films UO2, U2O5 and UO3 were exposed to water plasma at 400 °C for 10 and 30 minutes. The changes upon plasma exposure were followed by XPS by monitoring the U 4f and O 1s lines and the valence band region. The U 4f lines are the strongest and best resolved U peaks in the XPS spectrum.The oxidation state of U is directly connected to chemical shift in the U 4f peak position. Its binding energy increases as the oxidation state is increased from IV to V to VI.
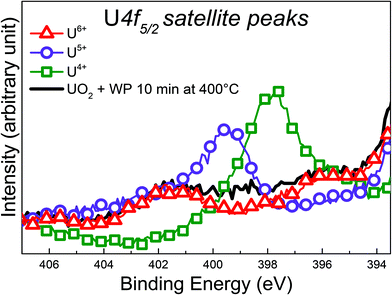
A characteristic feature in XPS spectra is shake-up satellites. During the photo absorption process, the valence electrons experience an electrostatic potential after expelling a core-level electron. As a result, they get excited to higher empty levels (like O 2p orbitals) and the core-electron kinetic energy is decreased to the same extent. Hence, to the higher BE side of each core level peak there appears a less intense satellite line. The O 2p binding energy changes with the oxidation state, which leads to different transition energy reflected by the satellite position appearing at a different BE. Thus, satellite peaks carry information on the valence band and are good probes to identify the U oxidation state. In the present work we interpret the satellites of U 4f5/2 because the satellites belonging to U 4f7/2 overlap with the intense U 4f5/2 line and do not appear as separate lines but instead contribute to its broadening. The same reason made us analyse the FWHM of U 4f7/2.
More quantitative information on the uranium oxidation state is obtained from the (U 5f)/(U 4f) intensity ratio. The U 5f intensity decreases with increasing oxidation state because the occupation number n5f decreases. However, as mentioned above, there are other factors contributing to the U 5f intensity, such as the U concentration, impurity overlayer damping the signal, lamp intensity, etc. These factors are removed by using the (U 5f)/(U 4f) intensity ratio. The occupation number n in U 4f is always 14 and therefore the U 4f line is a perfect reference. In addition, both U 5f and U 4f sensitivity factors stay constant for the different oxidation states, because neither of them are hybridized (both states are localized). Therefore, the (U 5f)/(U 4f) intensity ratio solely depends on the U 5f occupation number:
| IU 5f/IU 4f = k × nU 5f/nU 4f = k1 × nU 5f |
Applying the formula to UO2 (nU 5f = 2)k1 can be determined. With that information all other (partial) oxidation states can quantitatively be determined. We find e.g., after UO3 exposure to H2 gas (Fig. 3), a nU 5f of 1.8, corresponding to an oxidation state of 5.98 and a composition of UO2.99 within the region probed by XPS (i.e. about 5 monolayers).
This is indicative of a mixed valence composition state with coexistence of U(V) and U(VI). Note that it is not possible to depict which satellite has the highest intensity. Comparing the U 4f spectrum of UO2 + WP with the one obtained on U3O8, it is interesting to note that the BE reported are close (difference of 0.4 eV) and the satellite peaks present some similarities. However, Senanayake et al. fit their spectrum with U(IV) and U(VI).51 Our study, using high-resolution photoemission spectroscopy, demonstrates that U(IV) can be clearly excluded, keeping only the U(V) and U(VI) components.
Looking at the BE of the U 4f main lines, one would assume a transformation into UO3 upon exposure, however, the satellite region provides a different conclusion: the oxidation product is a mixture. It has been discussed before, that BE shifts, despite being a clear manifestation of changes in covalency, do not correlate perfectly to changes in U oxidation states. In contrast, the satellite structure is independent of the absolute BE and thus provides direct and more reliable information on oxidation states of uranium.49 The shape and intensity of the UO2 valence band changed completely after the exposure as shown in Fig. 5. The U 5f band exhibits a strong decrease in intensity, which is consistent with a decrease of nU 5f levels. Also the 5f line narrows significantly. This is due to the different PE final state multiple structures of the 5f2 (U4+) and 5f1 (U5+) initial state. For U4+, a 5f1 final state is obtained with a doublet structure (5f5/2 and 5f7/2), while for U5+ a 5f0 a singlet structure is observed, which is narrower than the multiplet.
The residual U 5f intensity confirms that UO2 is not completely oxidized to UO3, but that some U(V) is present. The O 2p band gains some intensity and changes its shape, reflecting the different band structure for the different oxides. The O 1s main line of the initial UO2 surface is located at 530.2 eV, following the exposure it shifts to lower BE and broadens. All these observations show that the reaction with water plasma is less oxidizing than with oxygen plasma. When extending exposure time to 30 minutes, no drastic spectral changes are detectable, however the peak area ratio O 1s to of U 4f increases as shown in Table 1.
| Oxide type | Clean oxide | After WP for 10 min at ambient T° | After WP for 10 min at 400 °C | After WP for 30 min at 400 °C |
|---|---|---|---|---|
| UO2 | 9.81 | 15.4 | 13.76 | 15.29 |
| U2O5 | 12.76 | — | 13.34 | 14.05 |
| UO3 | 15.15 | 17.52 | 15.12 | 14.43 |
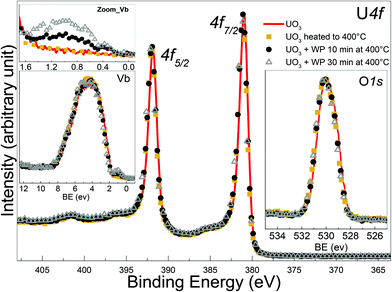
![[thin space (1/6-em)]](https://www.rsc.org/images/entities/char_2009.gif) .29 No major difference is observed after 10 min exposure to the water plasma (black circles) neither for the film kept at 400 °C for 10 minutes but not exposed to the plasma (yellow squares). In the valence band spectra, a slight increase in the intensity of the U 5f band is observe d after zooming, pointing to a weak reduction occurring in the very top layers of the film. This increase is more enhanced after 30 min of exposure (red triangles). From IU 5f/IU 4f we deduce an average surface composition of UO2.98 and UO2.95 after 10 and 30 minutes water plasma respectively. The O 1s peak of UO3 is located at 529.85 eV and appears broad. When superimposed, the four different O 1s lines (UO3, UO3 heated, UO3 + 10 and 30 min water plasma) overlap and no difference can be seen.
.29 No major difference is observed after 10 min exposure to the water plasma (black circles) neither for the film kept at 400 °C for 10 minutes but not exposed to the plasma (yellow squares). In the valence band spectra, a slight increase in the intensity of the U 5f band is observe d after zooming, pointing to a weak reduction occurring in the very top layers of the film. This increase is more enhanced after 30 min of exposure (red triangles). From IU 5f/IU 4f we deduce an average surface composition of UO2.98 and UO2.95 after 10 and 30 minutes water plasma respectively. The O 1s peak of UO3 is located at 529.85 eV and appears broad. When superimposed, the four different O 1s lines (UO3, UO3 heated, UO3 + 10 and 30 min water plasma) overlap and no difference can be seen.
However, the peak area ratio of U 4f to O 1s decreases a little bit after 30 minutes of water plasma. The reduction, despite being weak, is significant of the presence of reducing species among the water plasma products and is exposure time dependent.
![[thin space (1/6-em)]](https://www.rsc.org/images/entities/char_2009.gif) 52 (UO2+x, U3O7, U2O5, and U3O8). Another interpretation of cyclic voltammograms concluded the formation and reduction of the intermediate U(V) species.53
52 (UO2+x, U3O7, U2O5, and U3O8). Another interpretation of cyclic voltammograms concluded the formation and reduction of the intermediate U(V) species.53
In a previous paper, the differences in the fingerprints of the three oxides when it comes to the U 4f main line BE, FWHM and satellites peak position have been identified.38
Before U2O5 was produced by exposing UO3 to atomic hydrogen. In this paper, U2O5 has been produced by exposing homogeneous UO3 films to a mixture of water and hydrogen plasma. The elaboration method follows a similar concept as before, reducing UO3 under controlled plasma conditions. More details will be given in a forthcoming paper concerning the adopted procedure of mixed gas plasma (Fig. 8).
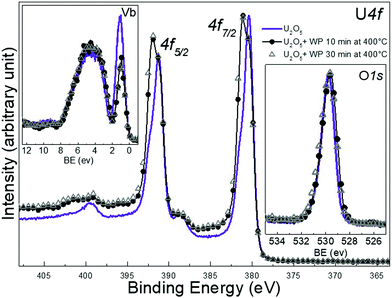
Again, high temperature was adopted to produce homogeneous films. The U 4f main peaks of the freshly prepared U2O5 are located at 380.4 and 391.3 eV with a spin orbit splitting of 10.9 eV (FWHM of 1.46 eV). After the exposure to water plasma the peaks are broadened by developing a component at higher BE, attributed to U(VI). Because of the very small BE difference between U(V) and (VI) lines, the two photoemission peaks overlap forming a line with broad FWHM. We attribute the features of the U 4f main lines to the growth of the U(VI) main line while the U(V) line is still present. The satellite peak characteristic of U2O5 which are located at 8.1 eV higher BE from the main U(V) line decreases in intensity. An extra spectral feature develops at 9.6 eV above the U 4f5/2 doublet line which corresponds to the U6+ satellite peak (it should be related to the U(VI) main line, i.e. ΔE = 9 eV). The U 5f peak of U2O5 located at 1.1 eV in the valence band spectra decreases in intensity due to oxidation after water plasma exposure. The O 2p peak in the valence band does not change in shape or intensity upon treatment. The pure U2O5 has the O 1s line at 529.7 eV which slightly broadens after the exposure. The U 5f/U 4f intensity ratio indicates a composition of UO2.8. All of these observations reflect an increase in the oxidation state of uranium in the binary system U–O. This implies that the product after plasma exposure is bivalent and corresponds to a mixed oxide of U5+ and U6+, possibly U2O5/UO3. No pronounced spectral changes were detected for longer exposure times (30 minutes).
After the exposure to water plasma the peaks are broadened by developing a component at higher BE, attributed to U(VI). Because of the very small BE difference between U(V) and(VI) lines, the two photoemission peaks overlap forming a line with broad FWHM. We attribute the features of the U 4f main lines to the growth of the U(VI) main line while the U(V) line is still present. The satellite peak characteristic of U2O5 which are located at 8.1 eV higher BE from the main U(V) line decreases in intensity. An extra spectral feature develops at 9.6 eV above the U 4f5/2 doublet line which corresponds to the U6+ satellite peak (it should be related to the U(VI) main line, i.e. ΔE = 9 eV). The U 5f peak of U2O5 located at 1.1 eV in the valence band spectra decreases in intensity due to oxidation after water plasma exposure. The O 2p peak in the valence band does not change in shape or intensity upon treatment. The pure U2O5 has the O 1s line at 529.7 eV which slightly broadens after the exposure. The U 5f/U 4f intensity ratio indicates a composition of UO2.8. All of these observations reflect an increase in the oxidation state of uranium in the binary system U–O. This implies that the product after plasma exposure is bivalent and corresponds to a mixed oxide of U5+ and U6+, possibly U2O5/UO3. No pronounced spectral changes were detected for longer exposure times (30 minutes). After exposure to water plasma, the FWHM of U 4f main line is much higher for U2O5 (1.99) than for UO2 (1.34) upon oxidation. Plus, the U 5f band in the valence band spectra of U2O5 has higher intensity than the one corresponding to UO2 after exposure. These two spectral features indicate a higher concentration of U5+ in U2O5 films after interaction with water plasma which reflects a weaker oxidation of deeper layers of U2O5 compared to UO2 despite the high temperature which is expected to overcome diffusion barriers. Such difference is related to how easily the oxide lattice can accommodate significant amounts of oxygen and the ease by which those local uranium atoms can rearrange to take up a UO3 structure. This is consistent with the peak area ratio of O 1s to U 4f presented in Table 1 using Shirely background subtraction. During the exposure, more oxygen is incorporated into the lattice so that uranium can bind to it. The ratio values are higher for UO2 films than for U2O5 after 10 and 30 min of exposure at 400 °C. It seems that after water plasma, the number of uranium atoms in +6 valence state is higher in U2O5 film compared to UO2.
Preferential top surface oxidation
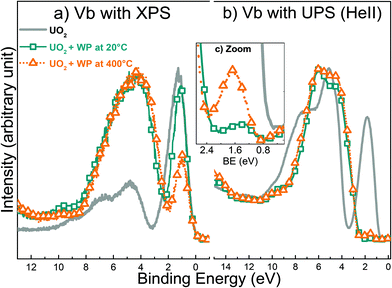
Although very useful in general, a minor drawback with XPS is that the analysis depth is significantly larger than only the top layer. In other words, the spectral information could be the average of an affected top layer and a thicker layer of unaffected or partly affected material below the top layer. Hence, the mechanism of the surface reaction may be wrongly interpreted on the basis of only XPS data. To avoid this potential problem, even more surface specific techniques should be used. One obvious candidate is UV Photoelectron Spectroscopy (UPS), which has an information depth of 1 monolayer in contrast to XPS (5 monolayers).54 As shown above, the near-surface composition of single phase uranium oxides changes to multiple-components as a result of interaction with water plasma at 400 °C. The following experiments provide useful basis for isolating the chemical changes at the surface of the uranium oxide films. Fig. 9 shows the valence band spectra registered with XPS and UPS (HeII) for a freshly prepared UO2 and two other UO2 films exposed to water plasma at 20 °C and 400 °C, respectively. The U 5f and O 2p lines have different cross-sections in UPS and XPS, which explains the different spectra for the same compound or treatment. However, the evolution of a given line (intensity growth or decrease) for different compounds can be well followed. XPS valence band measurement includes the contribution of atoms in lower layers.In Fig. 9a, the oxidation appears to be more advanced at 400 °C than at 20 °C. This is clear from the narrower and less intense U 5f band (orange triangles). This is no surprise since at higher temperature the transport of atoms into the bulk of the sample is facilitated and a larger fraction of the reactants have sufficient energy to overcome any possible activation barrier.
In contrast, when the valence bands of the same films are analyzed with UPS, the U 5f band intensity is almost completely suppressed for both temperatures (Fig. 9b). This implies that oxidation is complete and that the final product is UO3. Thus, these data provide irrefutable evidence that surface atoms have a higher valence state compared to the bulk atoms. The fact that the XPS data (valence band) reveal more substantial oxidation at the higher temperature while UPS data show that surface oxidation is complete already at ambient temperature demonstrates the impact of temperature on the solid-state diffusion.
Moreover, the XPS fingerprint of U 4f for UO2 after water plasma exposure at 400 °C (Fig. 5) shows main lines related only to U6+ and satellite peaks belonging to U5+ and U6+. This implies that the outermost atoms and other atoms from layers below all contribute to the XPS signal.
Interestingly, after zooming at the region between 0 and 2.5 eV of the UPS valence band in Fig. 9c, we noticed that the U 5f band has higher intensity at 400 °C than at ambient temperature. This is in line with the XPS data for UO3 films shown in Fig. 7. It would appear that the reducing species of the water plasma are activated thermally which results in the partial reduction observed in Fig. 7 and the incomplete oxidation observed in Fig. 9b.
From a strictly thermodynamic point of view, we would expect the final oxidation state to be the same for UO2, U2O5 and UO3 after exposure to a water plasma for a sufficiently long time. To test this hypothesis, all oxides were exposed to water plasma at ambient temperature for 10 minutes and analyzed using UPS. Fig. 10 represents the valence band spectra registered with UPS for UO2, U2O5, and UO3 before and after treatment for 10 minutes. The UPS results suggest no difference between the three oxides in the top surface composition after exposure to water plasma. The surface composition displays identical fingerprints in all three cases corresponding to UO3.
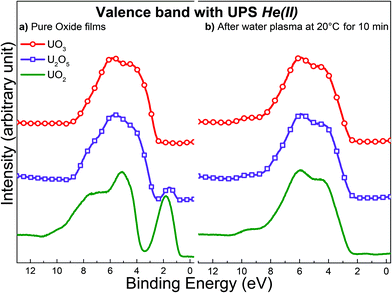 | ||
| Fig. 10 Valence band spectra acquired with UPS for: (a) freshly prepared films of UO2, U2O5 and UO3 (b) same oxide films after exposure to water plasma at 20 °C for 10 minutes. | ||
Conclusions
We report surface characteristics of UO2, U2O5 and UO3 thin films after exposure to gas plasmas. This is a new approach of the oxidative dissolution problem, where water plasma proved a good model of water radiolysis in terms of species formed. Also, the comparison of well-defined uranium oxidation states, +4, +5 and +6 is new and became possible only because U+5 could be prepared as a pure compound (and not as mixed oxide). UPS shows that the top surface of all three oxides is quantitatively converted to U(VI) with water plasma at RT. This implies that the water plasma is primarily oxidizing under these conditions. While O2 plasma leads to full oxidation also of bulk layers, the composition of deep layers detected with XPS display an incomplete oxidation of UO2 after exposure to water plasma at 20 °C. At higher temperature, exposure to water plasma appears less oxidizing. This can be attributed to increased susceptibility to the reducing species present in the plasma as evidenced by the partial reduction of UO3. Notably when thicker layers are analyzed (XPS) the chemical change is partly disguised by the spectral contribution of sub-surface layers due to mass transport limitations. It is interesting to note that, at 400 °C, UO2 is oxidized to a higher oxidation state by water plasma than is U2O5. This method of tracking the changes in oxidation states with reactive species is a novel in the field, since it combines the effect of both oxidizing and reducing species on pure oxide surface under UHV conditions at different temperatures. The outlook is highly promising specially when it comes to the type material to be exposed, for instance doped oxides and the possibility of introducing reducing gases to the original water vapor feed gas. In the future, time dependent studies of the surface oxidation will shed further light on the oxidation kinetics. Surface exposure to mixed water plasmas (H2O + H2, H2O + O2) will be carried out to mimic the influence of oxidizing/reducing radiolytic species in the aqueous environment. Also, a systematic study of the valence levels (0 to 12 eV BE) is under way with the aim to further identify the surface species (OH, O, …) involved in UOx oxidation.Conflicts of interest
There are no conflicts to declare.Acknowledgements
The Swedish Nuclear and Fuel Waste Management Company(SKB) is gratefully acknowledged for financial support.This work has been partially supported by the ENEN + project that has received funding from the Euratom research and training Work Programme 2016–2017 – 1#755576.
Notes and references
- D. W. Shoesmith, J. Nucl. Mater., 2000, 282, 1–31 CrossRef CAS.
- O. Roth, D. Cui, C. Askeljung, A. Puranen, L. Z. Evins and K. Spahiu, J. Nucl. Mater., 2019, 527, 151789 CrossRef.
- E. Ekeroth, D. Cui, J. Low, M. Granfors, H.-U. Zwicky, K. Spahiu and L. Zetterström Evins, MRS Proceedings, 2012, vol. 1475, imrc11-1475-nw1435-o1436.
- L. Johnson, I. Günther-Leopold, J. Kobler Waldis, H. P. Linder, J. Low, D. Cui, E. Ekeroth, K. Spahiu and L. Z. Evins, J. Nucl. Mater., 2012, 420, 54–62 CrossRef CAS.
- E. Ekeroth and M. Jonsson, J. Nucl. Mater., 2003, 322, 242–248 CrossRef CAS.
- S. Nilsson and M. Jonsson, J. Nucl. Mater., 2011, 410, 89–93 CrossRef CAS.
- J. Garcia-Serrano, J. A. Serrano, P. P. Diaz-Arocas, J. Quiñones and J. L. R. Almazan, MRS Proceedings, 1995, vol. 412, 83.
- J. A. Serrano, J. Quiñones, J. Cobos, P. Diaz Arocas, V. V. Rondinella, J. P. Glatz, H. Matzke, A. Martinez and J. A. Esteban, ICEM2001, Bruges, Belgium, 2001 Search PubMed.
- K. Ollila, Influence of radiolysis on UO2 fuel matrix dissolution under disposal conditions Literature Study, Finland, 2011 Search PubMed.
- M. Trummer, S. Nilsson and M. Jonsson, J. Nucl. Mater., 2008, 378, 55–59 CrossRef CAS.
- A. Barreiro Fidalgo and M. Jonsson, J. Nucl. Mater., 2019, 514, 216–223 CrossRef CAS.
- Y. Kumagai, A. Barreiro Fidalgo and M. Jonsson, J. Phys. Chem. C, 2019, 123, 9919–9925 CrossRef CAS.
- V. M. Oversby, Uranium dioxide, SIMFUEL, and spent fuel dissolution rates - a review of published data, Report 1404-0344, Sweden, 1999 Search PubMed.
- E. Ekeroth, O. Roth and M. Jonsson, J. Nucl. Mater., 2006, 355, 38–46 CrossRef CAS.
- A. Barreiro Fidalgo, Y. Kumagai and M. Jonsson, J. Coord. Chem., 2018, 71, 1799–1807 CrossRef CAS.
- L. Wu and D. W. Shoesmith, Electrochim. Acta, 2014, 137, 83–90 CrossRef CAS.
- A. C. Maier, P. Kegler, M. Klinkenberg, A. Baena, S. Finkeldei, F. Brandt and M. Jonsson, Dalton Trans., 2020, 49, 1241–1248 RSC.
- A. C. Maier, A. Barreiro Fidalgo and M. Jonsson, Eur. J. Inorg. Chem., 2020, 2020, 1946–1950 CrossRef CAS.
- R. S. Dixon, Radiat. Res. Rev., 1970, 2, 237 CAS.
- C. Willis and A. W. Boyd, Int. J. Radiat. Phys. Chem., 1976, 8, 71–111 CrossRef CAS.
- A. Mozumder, in Fundamentals of Radiation Chemistry, ed. A. Mozumder, Academic Press, San Diego, 1999, pp. 121–143 Search PubMed.
- T. Gouder, J. Alloys Compd., 1998, 271–273, 841–845 CrossRef CAS.
- D. W. Shoesmith and S. Sunder, An electrochemistry-based model for the dissolution of UO2, Sweden, 1991 Search PubMed.
- F. Miserque, T. Gouder, D. H. Wegen and P. D. W. Bottomley, J. Nucl. Mater., 2001, 298, 280–290 CrossRef CAS.
- T. Gouder, A. Seibert, L. Havela and J. Rebizant, Surf. Sci., 2007, 601, L77–L80 CrossRef CAS.
- S. Van den Berghe, F. Miserque, T. Gouder, B. Gaudreau and M. Verwerft, J. Nucl. Mater., 2001, 294, 168–174 CrossRef CAS.
- S. Stumpf, A. Seibert, T. Gouder, F. Huber, T. Wiss, J. Römer and M. A. Denecke, J. Nucl. Mater., 2010, 397, 19–26 CrossRef CAS.
- S. Stumpf, A. Seibert, T. Gouder, F. Huber, T. Wiss and J. Römer, J. Nucl. Mater., 2009, 385, 208–211 CrossRef CAS.
- H. Idriss, Surf. Sci. Rep., 2010, 65, 67–109 CrossRef CAS.
- A. J. Popel, B. T. Tan, T. Gouder, G. I. Lampronti, J. Day, R. Eloirdi, A. Seibert and I. Farnan, Appl. Surf. Sci., 2019, 464, 376–379 CrossRef CAS.
- B. T. Tan, A. J. Popel, R. J. Wilbraham, J. Day, G. I. Lampronti, C. Boxall and I. Farnan, J. Nucl. Mater., 2019, 520, 41–55 CrossRef CAS.
- A. J. Popel, S. R. Spurgeon, B. Matthews, M. J. Olszta, B. T. Tan, T. Gouder, R. Eloirdi, E. C. Buck and I. Farnan, ACS Appl. Mater. Interfaces, 2020, 12, 39781–39786 CrossRef CAS PubMed.
- G. C. Allen and P. A. Tempest, J. Chem. Soc., Dalton Trans., 1982, 2169–2173 RSC.
- C. A. Colmenares, Prog. Solid State Chem., 1984, 15, 257–364 CrossRef CAS.
- F. Garrido, A. C. Hannon, R. M. Ibberson, L. Nowicki and B. T. M. Willis, Inorg. Chem., 2006, 45, 8408–8413 CrossRef CAS PubMed.
- L. Desgranges, G. Baldinozzi, G. Rousseau, J.-C. Nièpce and G. Calvarin, Inorg. Chem., 2009, 48, 7585–7592 CrossRef CAS PubMed.
- R. J. McEachern and P. Taylor, J. Nucl. Mater., 1998, 254, 87–121 CrossRef CAS.
- T. Gouder, R. Eloirdi and R. Caciuffo, Sci. Rep., 2018, 8, 8306 CrossRef CAS PubMed.
- H. Frey and H. R. Khan, Handbook of Thin Film Technology, Springer Berlin Heidelberg, Berlin, Heidelberg, Springer, Imprint, 1 edn, 2015 Search PubMed.
- A. Fridman, Plasma Chemistry, Cambridge University Press, 2008 Search PubMed.
- E. J. H. Collart, J. A. G. Baggerman and R. J. Visser, J. Appl. Phys., 1991, 70, 5278–5281 CrossRef CAS.
- E. J. H. Collart, J. A. G. Baggerman and R. J. Visser, J. Appl. Phys., 1995, 78, 47–54 CrossRef CAS.
- G. S. Selwyn, J. Appl. Phys., 1986, 60, 2771–2774 CrossRef CAS.
- O. Joubert, J. Pelletier and Y. Arnal, J. Appl. Phys., 1989, 65, 5096–5100 CrossRef.
- R. Anton, T. Wiegner, W. Naumann, M. Liebmann, C. Klein and C. Bradley, Rev. Sci. Instrum., 2000, 71, 1177–1180 CrossRef CAS.
- Y. A. Teterin, V. M. Kulakov, A. S. Baev, N. B. Nevzorov, I. V. Melnikov, V. A. Streltsov, L. G. Mashirov, D. N. Suglobov and A. G. Zelenkov, Phys. Chem. Miner., 1981, 7, 151–158 CrossRef CAS.
- S. R. Qiu, C. Amrhein, M. L. Hunt, R. Pfeffer, B. Yakshinskiy, L. Zhang, T. E. Madey and J. A. Yarmoff, Appl. Surf. Sci., 2001, 181, 211–224 CrossRef CAS.
- C. Andrello, L. Favergeon, L. Desgranges, E. Tereshina-Chitrova, L. Havela, R. J. M. Konings, R. Eloirdi and T. Gouder, J. Nucl. Mater., 2020 DOI:10.1016/j.jnucmat.2020.152646.
- E. S. Ilton and P. S. Bagus, Surf. Interface Anal., 2011, 43, 1549–1560 CrossRef CAS.
- C. Steinbruchel, B. J. Curtis, H. W. Lehmann and R. Widmer, IEEE Trans. Plasma Sci., 1986, 14, 137–144 CrossRef.
- S. D. Senanayake, R. Rousseau, D. Colegrave and H. Idriss, J. Nucl. Mater., 2005, 342, 179–187 CrossRef CAS.
- S. Sunder, D. W. Shoesmith, M. G. Bailey, F. W. Stanchell and N. S. McIntyre, J. Electroanal. Chem. Interfacial Electrochem., 1981, 130, 163–179 CrossRef CAS.
- M. J. Nicol and C. R. S. Needes, Electrochim. Acta, 1975, 20, 585–589 CrossRef CAS.
- S. Hüfner, Photoelectron spectroscopy: principles and applications, Springer, New York, 3. rev. and enlarged edn, 2003 Search PubMed.
| This journal is © The Royal Society of Chemistry 2021 |

