
 Open Access Article
 This Open Access Article is licensed under a Creative Commons Attribution-Non Commercial 3.0 Unported Licence
First-principles-informed energy span and microkinetic analysis of ethanol catalytic conversion to 1,3-butadiene on MgO†
Astrid
Boje
 a,
William E.
Taifan
b,
Henrik
Ström
c,
Tomáš
Bučko
de,
Jonas
Baltrusaitis
b and
Anders
Hellman
*af
a,
William E.
Taifan
b,
Henrik
Ström
c,
Tomáš
Bučko
de,
Jonas
Baltrusaitis
b and
Anders
Hellman
*af
aDepartment of Physics, Chalmers University of Technology, 412 96 Göteborg, Sweden. E-mail: anders.hellman@chalmers.se
bDepartment of Chemical and Biomolecular Engineering, Lehigh University, B336 Iacocca Hall, 111 Research Drive, Bethlehem, PA 18015, USA
cDepartment of Mechanics and Maritime Sciences, Chalmers University of Technology, 412 96 Göteborg, Sweden
dDepartment of Physical and Theoretical Chemistry, Faculty of Natural Sciences, Comenius University in Bratislava, Ilkovičova 6, SK-84215, Bratislava, Slovak Republic
eInstitute of Inorganic Chemistry, Slovak Academy of Sciences, Dúbravská cesta 9, SK-84236 Bratislava, Slovak Republic
fCompetence Centre for Catalysis, Chalmers University of Technology, 412 96 Göteborg, Sweden
First published on 9th August 2021
Abstract
Kinetic modeling of single-step catalytic conversion of ethanol to 1,3-butadiene is necessary to inform accurate process design. This paper uses first-principles-informed energy span and microkinetic analysis to explore the reaction free energy landscapes and kinetic limitations of competing reaction pathways on a MgO (100) step-edge. Previous studies suggested mechanisms proceeding via both dehydrogenation and dehydration of ethanol, and highlighted sensitivity to conditions and catalyst composition. Here, we use the energy span concept to characterize the theoretical maximum turnover and degree of turnover frequency control for states in each reaction pathway, finding the dehydration route to be less active for 1,3-butadiene, and suggesting rate-determining states in the dehydrogenation, dehydration, and condensation steps. The influence of temperature on the relative rate contribution of each state is quantified and explained through the varying temperature sensitivity of the free energy landscape. A microkinetic model is developed to explore competition between pathways, interaction with gas-phase species, and surface coverage limitations. This suggests that the turnover may be significantly lower than predicted solely based on energetics. Turnover frequency determining states found to have high surface coverage include adsorbed ethanol and two longer, oxygenated hydrocarbons. The combined energy span and microkinetic analysis permits investigation of a complex system from two perspectives and helps elucidate conflicting observations of rate determining steps and product distribution by considering both energetic and kinetic limitations. The impact of uncertainty in the energy landscape is quantified using a correlated error model. While the range of predictions is large, the average performance and trends are similar.
1 Introduction
Persistent and detrimental gas emissions from fossil fuel combustion stem from a range of societal drivers, including population and gross domestic product growth and the need for continuous energy and commodity chemical supply.1 As a result, recent research efforts on developing renewable and sustainable alternatives to petroleum for energy and commodity chemical production have been under rapid development.2 (Bio)ethanol has been seen as an emerging platform molecule3 to yield high-value chemicals and fuels4,5 from cellulosic feedstock6 that does not interfere with the food chain. Among the high-value chemicals obtained by catalytic transformation of (bio)ethanol is 1,3-butadiene (further in the text referred to as butadiene),7 which has an established and widespread application in polymer synthesis and as an organic chemistry intermediate.8 The conventional butadiene synthesis methods rely on steam cracking of naphtha or gas oil feedstocks.9 However, butadiene can also be recovered from olefinic refinery gases from the fluid catalytic cracker or, more recently, so called on-purpose butadiene synthesis from n-butane. For this reason, interest in the catalytic conversion of non-fossil fuel derived ethanol to butadiene via a single catalytic step, introduced in the 1930s by Lebedev,10 has been revived and has focused on the development of selective catalysts to minimize the need for high-cost separations. The main components of the catalyst for this system are MgO and SiO2.11 Additionally, pure MgO and very high MgO content catalysts were also shown to be rather selective towards butadiene synthesis using specific preparation routes.12,13 Noteworthy is that selectivity of the overall process has long been the limiting link as any improvements chiefly focused on the promotional effects of transition metals.The lack of kinetic control over the single-step butadiene catalytic synthesis from ethanol and inadequate understanding of the fundamental mechanistic steps involved have hindered the development of catalysts with reasonable performance. The generally accepted one-step catalytic mechanism recently summarized by Pomalaza et al.9 involves dehydrogenation of ethanol to acetaldehyde, which then undergoes C–C coupling via an aldol condensation mechanism to yield crotonaldehyde. Crotonaldehyde is further hydrogenated via MPV (Meerwein–Ponndorf–Verley) reduction with ethanol, and the resulting crotyl alcohol is dehydrated to form butadiene.14,15 In addition, Fripiat and coworkers and Ostromislensky proposed two other possible reaction pathways.16,17 Fripiat suggested a Prins-like mechanism involving both dehydration and dehydrogenation reactions producing ethylene and acetaldehyde. The C![[double bond, length as m-dash]](https://www.rsc.org/images/entities/char_e001.gif) O group is hydroxylated in the presence of Brønsted acid and reacts with ethylene opening the double bond. The resulting 3-buten-2-ol is then dehydrated to yield butadiene.17 Ostromislensky's version of the reaction mechanism involves the hemiacetal rearrangement between ethanol and acetaldehyde to yield 1-ethoxyethanol that later converts to butane-1,3-diol.4
O group is hydroxylated in the presence of Brønsted acid and reacts with ethylene opening the double bond. The resulting 3-buten-2-ol is then dehydrated to yield butadiene.17 Ostromislensky's version of the reaction mechanism involves the hemiacetal rearrangement between ethanol and acetaldehyde to yield 1-ethoxyethanol that later converts to butane-1,3-diol.4
Initial computational attempts using density functional theory under the generalized gradient approximation (GGA) by Zhang et al. focused on the dehydrogenation of the alcohol.18 A stepped MgO surface was predicted to have a lower barrier than the flat surface for this reaction. Chieregato et al., on the other hand, proposed an entirely different mechanism using cluster type calculations and Gaussian basis sets.19 They ruled out crotonaldehyde and crotyl alcohol as possible intermediates and concluded that acetaldehyde would react with a carbanion resulting from ethanol C–H cleavage. The first comprehensive theoretical mechanism elucidation on MgO of ethanol catalytic coupling to butadiene used a kink Mg atom at a step-edge MgO (100) as a model catalyst surface in accordance with recent works20–23 that suggest MgO as a bifunctional catalyst.24–26 Another effort to elucidate the critical step in the C–C bond formation, i.e., aldol condensation, was undertaken on a metal-promoted surface and hydroxylated MgO surface,27,28 with increased reactivity of hydroxylated MgO linked to modification of the basic properties of nearby active sites.29 The surface proton back-transfer to 3-hydroxybutanal was shown to be more prominent when MgO is hydroxylated by ambient water vapor. Lower energy barriers on the various aldol steps, i.e., enolization and C–C bond formation, were observed as well when the surface was promoted using Cu and Zr. These changes brought about by water and transition metal promotion were attributed to the change in acidity and basicity of the MgO sites responsible in the reaction.27,28 Souza et al. recently presented a first-principles and experimental study for the related problem of butanol formation from ethanol on the MgO step edge.30
Despite its importance, the number of kinetic studies focusing on the reaction is limited. Da Ros et al. took a statistical approach by decoupling both measurement and catalytic reaction fluctuations on the microkinetic analysis of the system.31 Surprisingly, the covariance matrix of the composition measurements showed that the molar fraction variances were intercorrelated, and that the correlation patterns change with temperature. Microkinetic analysis of the correlation patterns led to the revelation that at 300–400 °C, acetaldehyde condensation was the rate-determining step, while at 450 °C, ethanol dehydrogenation to acetaldehyde was shown to be the slowest step in the reaction. Although higher activity and selectivity may be achievable by incorporation of other elements,12,32,33 the pure MgO catalyst is still experimentally and theoretically relevant,19,34,35 and is the only system for which extensive mechanistic data is available, enabling in-depth kinetic analysis. Such analysis can then help to target modification of the active sites to reduce high barriers and favorability of side-reactions.
The aim of the present study is to explore the contribution of competing pathways and the impact of conditions on the activity and selectivity of ethanol conversion to butadiene on the MgO (100) step-edge using energy span (ES) and microkinetic (MK) analysis informed by first-principles calculations to obtain different perspectives on the dynamics. The reaction framework is based on the computational work of Taifan et al., where the low-coordinated MgO sites are used as the model catalyst.24 Experimental studies on pure MgO have observed intermediates along the proposed reaction pathways and formation of butadiene, albeit in low quantities, which suggests that this mechanism is viable.19,34,36 The energy span model37,38‡ is utilized to assess the efficiency of the catalyst cycles in terms of maximum turnover frequency (TOF) and to identify rate-determining states, using free energies derived from the first-principles calculations and accounting for temperature sensitivity in the entropic and enthalpic contributions to the free energy landscape. A microkinetic model is proposed to study the competing pathways simultaneously and investigate how kinetic limitations, surface poisoning, and competing reactions hinder the TOF achievable over realistic time-scales. The sensitivity of the predicted behavior from both models to underlying uncertainty in the first-principles data is explored by sampling from a correlated error model.
2 Computational methods
2.1 Electronic structure and free energy calculations
Most of the electronic energies used in this paper were taken from the first-principles study of Taifan et al.;24 however, we added several additional states to support the analysis in the current work, and these were computed using the same surface and level of theory. DFT calculations were performed using VASP40–43 where the projector augmented wave method44 was employed to reduce the number of basis functions necessary to describe the wave function. The Kohn-Sham orbitals were represented in a plane-wave basis set with a cutoff of 400 eV. The PBE generalized gradient approximation45 was used to represent the exchange-correlation potential. Brillouin-zone sampling was performed with a 2 × 2 × 1 k-point mesh. The self-consistent field convergence criterion was set to 10−6 eV per cell total energy change. The transition states reported by Taifan and coworkers were located using the improved version46 of the dimer method.47 We computed two further transition states in this work using the nudged elastic band method.48,49 Atomic positions were relaxed until the forces on all atoms were less than 0.005 eV Å−1. The correctness of vibrational spectra of all stationary points (in particular, the number of zero and imaginary frequencies) was verified.Surface computations were performed using a periodic, three layer magnesium oxide (MgO) slab consisting of 8 × 6 × 3 primitive cells with the atoms in the bottom layer fixed in position while the other layers were allowed to relax. The PBE lattice parameter was calculated to be 4.255 Å. The Mg3C coordinated with O4C stepped kink sites were taken to be the active sites for reaction. Isolated gas computations were performed using a 10 × 10 × 10 Å3 cell. The free energies were computed using the rigid-rotor harmonic-oscillator approximation,50 with electronic energies from DFT and temperature-dependent translational, rotational, and vibrational contributions described by eqn (S2)–(S4) (ESI†). Relative energies were referenced to the sum of the relaxed MgO slab and three non-interacting gas-phase molecules of ethanol.
2.2 Energy span calculations
The energy span model presented by Kozuch and Shaik37 was used to assess the theoretical efficiency of the catalytic cycles using state energies derived from the first-principles calculations. The reaction energy landscape is characterized using the energy differences between intermediate–transition state pairs, and the reaction driving force, i.e., the energy change across one catalytic cycle. The TOF is given by the summation of the pairwise energy differences, | (1) |
 | (2) |
Similar to the degree of rate control51,52 typically used to identify rate determining steps, the energy span model uses the pairwise energy differences between states to investigate the degree of TOF control of transition states,
 | (3) |
 | (4) |
The degree of TOF control identifies a turnover-determining transition state (TDTS) and a turnover-determining intermediate (TDI), which are not necessarily the highest and lowest points on the free energy landscape, or adjacent states, but represent the largest energy difference across successive catalytic cycles. The energy span model was implemented using the Python Catalysis Kinetics (PyCatKin) toolset.53
2.3 Microkinetic model
A microkinetic model (Table S9, ESI†) was constructed based on the mechanism presented by Taifan and coworkers.24 Reaction steps were formulated using the law of mass action, neglecting spectator surface species that are unlikely to participate in the reaction but including species that may catalyze certain steps. Proton diffusion steps were neglected. We supplemented the butadiene mechanism with adsorption/desorption chemistry for hydrogen, water, acetaldehyde and crotonaldehyde. We studied a system at atmospheric pressure over a period of 24 h, with fixed partial pressures (no mass transport model) of 2 kPa ethanol, 0.02 kPa hydrogen and ethylene, and 2 × 10⁻⁸ kPa all other gas species.The rate constants for all reaction steps were assumed to have Arrhenius form, with the pre-factor determined from the transition state theory expression,50
 | (5) |
 | (6) |
The adsorption rate constants were computed from collision theory,54
 | (7) |
The microkinetic model was developed in PyCatKin.53 The differential equations were solved using the SciPy solve_ivp solver with backwards difference formulas (BDF),55 and relative and absolute tolerances of 10−6 and 10−8, respectively. An analytic expression was derived for the Jacobian and provided to the solver. Steady-states were checked using the SciPy least_squares minimizer with the trust region reflective method,56 a function tolerance of 10−8, and a maximum of 104 function evaluations.
2.4 Quantification of first-principles uncertainty
In order to investigate the impact of uncertainty in the free energies arising from uncertainty in the electronic energies computed with DFT,57 and in the entropic contributions approximated with the rigid-rotor harmonic-oscillator approximation,58 an ensemble of 100 noisy samples was generated by drawing one random number from a Gaussian distribution with mean zero and standard deviation 2 kcal mol−1, and adding this to the relative free energy of each intermediate state. Transition states were modified by adding a uniformly distributed random number times this noise term as a scaling-relation-type correlation between the states. This approach was taken as errors arising from DFT calculations for steps in the process are expected to be correlated.59 The magnitude of the standard deviation for the noise term was chosen to be representative of typical DFT uncertainties. Increasing the noise naturally increases the range of predictions obtained.For each noisy sample, the following steps were taken:
1. Sample a normally distributed random number: x ∼ N (0,2).
2. Update the relative free energies of all intermediates, Ij: ΔGIj = ΔGIj + x.
3. Sample uniformly distributed random numbers for each transition state, TSi: ui ∼ U (0,1).
4. Update the relative free energies of all transition states, TSi: ΔGTSi = ΔGTSi + xui.
3 Results and discussion
3.1 Butadiene mechanism
In this paper, we considered formation of butadiene from ethanol by four possible sequences of reaction steps (Fig. 1) based on the mechanism proposed by Taifan and coworkers.24 All sequences involve the initial dehydrogenation of ethanol to acetaldehyde (path 1). Following acetaldehyde formation, C–C bonds can be formed by aldol condensation to yield 3-hydroxybutanal, with proton transfer resulting in crotonaldehyde (path 2) and then MPV reduction resulting in 1,3-butadiene (path 3). Alternatively, 1,3-butadiene can be formed by MPV reduction of the 3-hydroxybutanal formed in path 2, resulting in adsorbed 1,3-butanediol, followed by proton transfer (path 4). A competing sequence involves formation of acetaldehyde and dehydration of ethanol to ethylene (path 5), followed by C–C bond formation by Prins condensation and proton transfer (path 6). Finally, a combination of acetaldehyde and adsorbed ethanol can form 1-ethoxyethanol by nucleophilic addition, and then subsequent molecular rearrangement can also yield adsorbed 1,3-butanediol (path 7). Thus, four combinations of paths can produce butadiene in this mechanism – paths 1, 2 and 3 (p123); paths 1, 2 and 4 (p124); paths 1, 5 and 6 (p156); or paths 1, 7 and 4 (p174). Several stable byproducts, such as acetaldehyde, crotonaldehyde, and ethylene, can also be formed.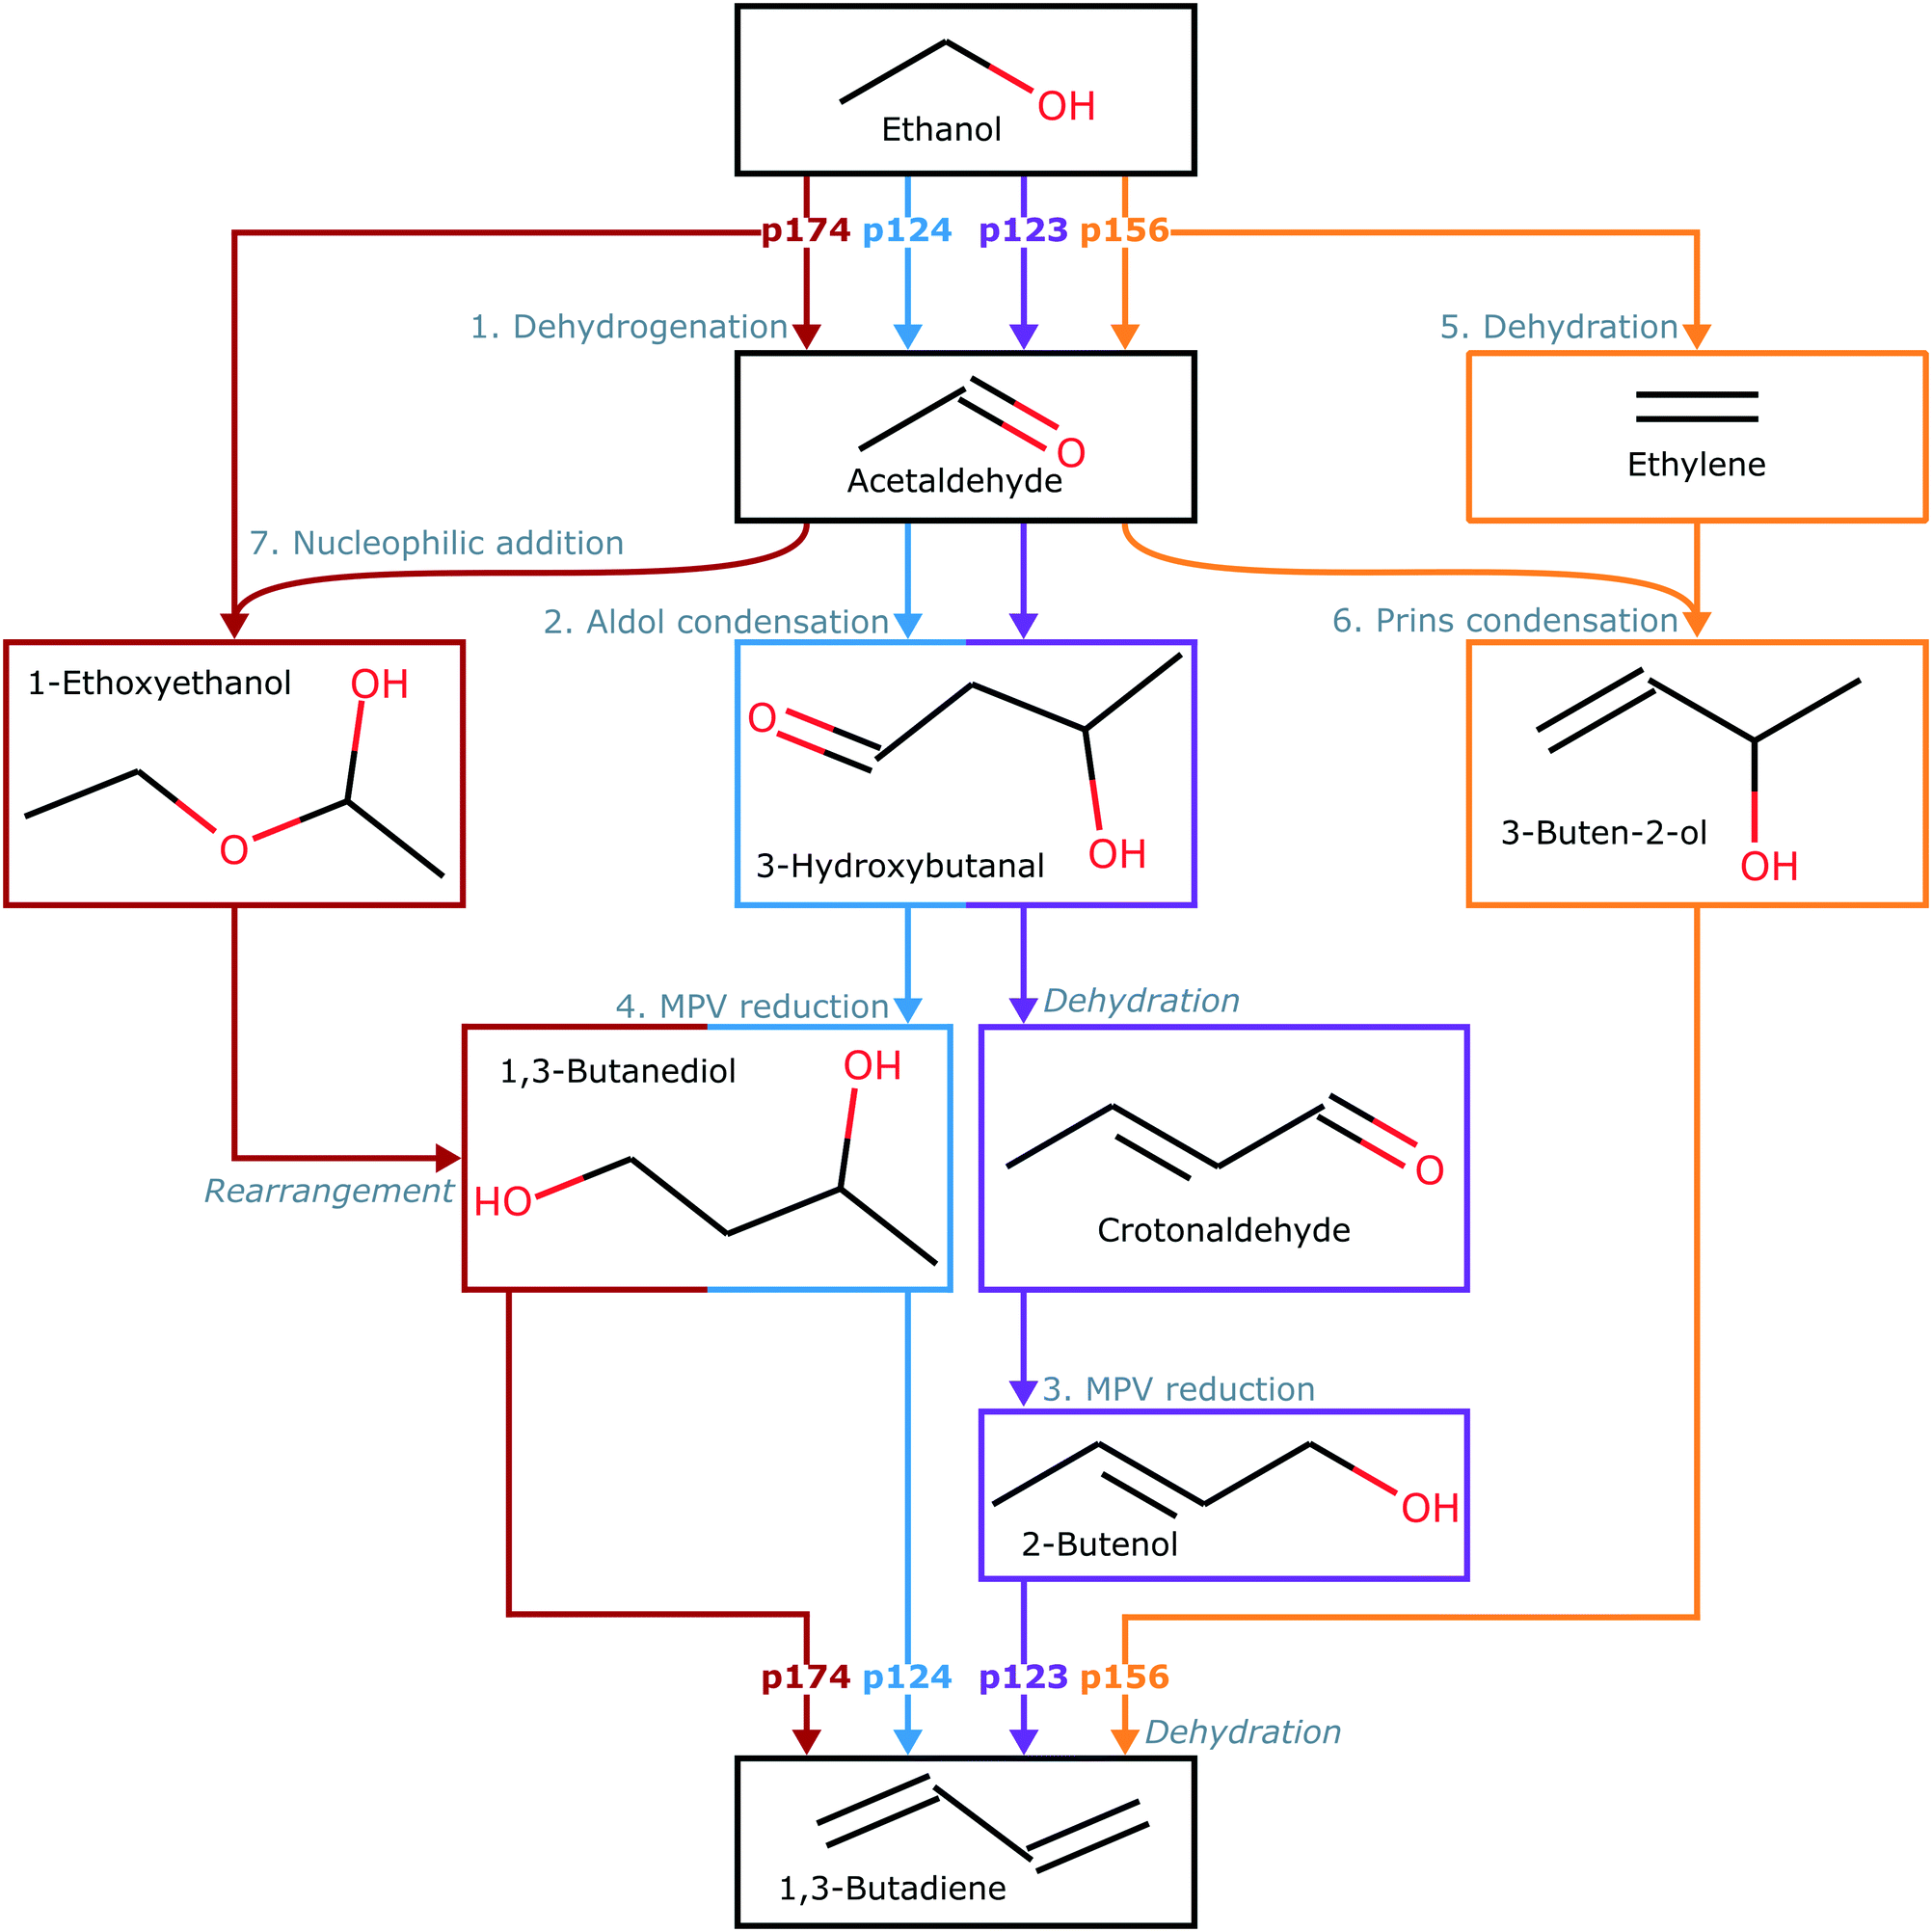 | ||
| Fig. 1 Key steps in each sequence of reactions leading from ethanol to 1,3-butadiene. Paths are labeled 1–7 and described in more detail by the structures in Table S1 (ESI†). Arrows and intermediate blocks are colored by sequence. Sequences are labeled according to constituent paths: i.e., p123, p124, p156, and p174. | ||
The structures of all surface states along the pathways described here are provided in Table S1 (ESI†). For consistency, we have used the same state labels for states proposed by Taifan and coworkers. We supplemented their calculations with additional transition states for desorption of butadiene from C4H6O chemisorbed via the terminal CH2 and the CH groups. These steps are illustrated Fig. S1 and S2 (ESI†). Here, we also included dissociative absorption of hydrogen, adsorption of water with dissociation of hydroxide, and adsorption of acetaldehyde. The surface and gas-phase molecules present in each state are provided in Tables S2–S4 (ESI†). The electronic and free energies of states added in this work are given in Table S6 (ESI†). The free energy barriers and reaction energies of all steps are provided in Table S8 (ESI†).
3.2 Free energy landscapes and energy span analysis
The free energy landscapes for each reaction sequence (Fig. 2(a)–(c), also S7(a) in the ESI†) were assembled from the free energies of each state and show varying degrees of sensitivity to temperature in the range 623–823 K. Temperature effects are introduced mainly via entropic contributions to the free energy arising from translational, rotational, and vibrational degrees of freedom, with adsorbates having only vibrational contributions. Increasing temperature typically corresponds to higher (or less negative) relative free energies of each state; however, in several states (i.e., 3D–G, 4I–K, 6A), increasing temperature reduces the relative free energy thanks to the translational entropic contributions of the reference free gas species. This is shown in Fig. S6 (ESI†) for two pairs of adjacent states for which the energy changes in opposing directions with temperature. The extent of the change in free energy of different states with increasing temperature is not uniform, which has implications for how the modeling predictions are influenced by the chosen temperature.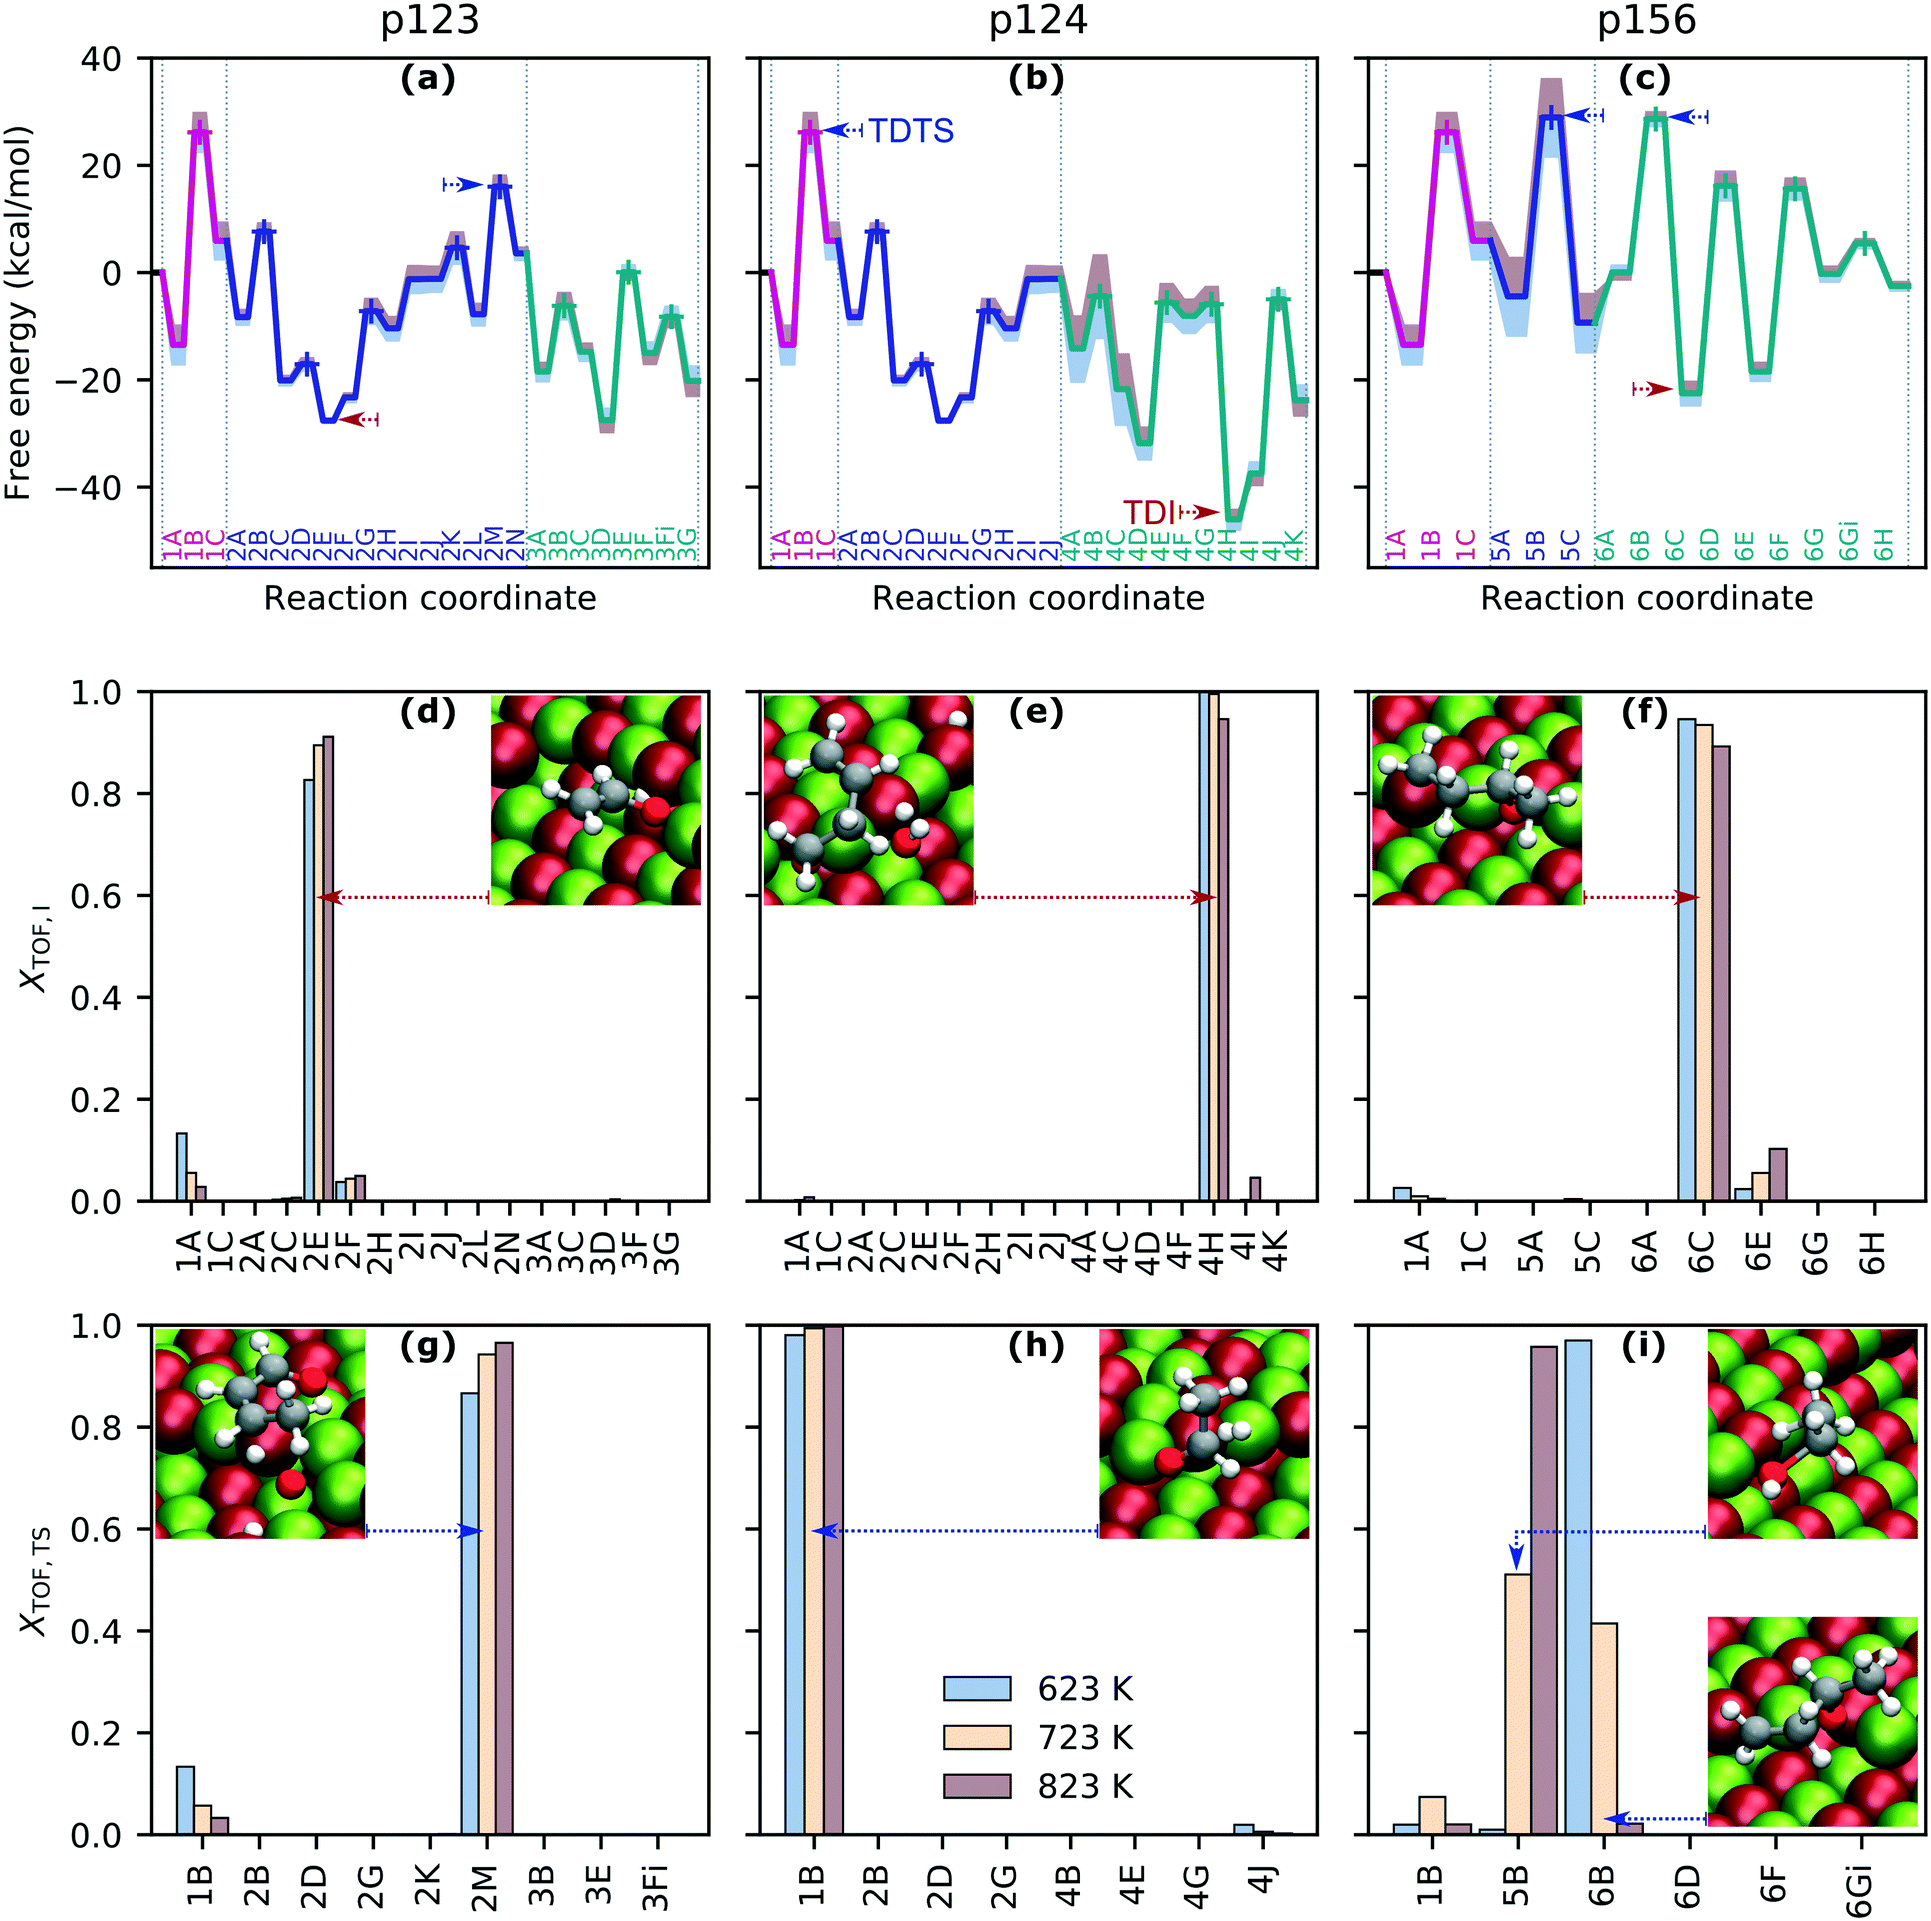 | ||
| Fig. 2 Pathway energy landscapes and TOF-controlling states. Panels (a)–(c): free energy profiles for pathways p123, p124 and p156 at 723 K. Transition states labeled with + symbols. Effect of increasing (red) and decreasing (blue) temperature by 100 K indicated by filled regions. Molecules associated with each state are given in Tables S2 and S3.† TDI and TDTS marked with red and blue dashed arrows. Panels (d)–(i): energy span assessment of relative TOF contributions of intermediates and transition states with insets showing states with maximum contributions. | ||
We assessed the theoretical performance of the catalytic cycles on the MgO (100) step-edge using the energy span model of Kozuch and Shaik,37 with the energy information obtained from the first-principles calculations. The utility of the energy span model was recently demonstrated by Shylesh et al. studying ketonization of carboxylic acids and aldol condensation of propan-2-one over silica-supported zirconia, where C–C bond formation was found to be rate-limiting and reasonable agreement with experimental results was shown to be possible.58 Garay-Ruiz and Bo presented a reaction-network-based implementation, applied to cobalt-catalyzed propene hydroformylation and copper-catalyzed hydrogenation of CO2.60
The degree of TOF control, XTOF, for each transition state and intermediate (eqn (3) and (4)) was computed for each sequence at operationally relevant temperatures of 623 K, 723 K and 823 K, highlighting rate-determining intermediates (Fig. 2(d)–(f), also Fig. S7(b) in the ESI†) and transition states (Fig. 2(g)–(i), also Fig. S7(c) in the ESI†) for each sequence. Interestingly, the degree to which a state is rate-controlling varies with temperature, which agrees with the findings of Da Ros et al.31 States 1A and 1B, which correspond to the initial and transition states for acetaldehyde formation from dissociatively adsorbed ethanol in the dehydrogenation path, are of greater importance to determining the TOF for p123 at 623 K than at 723 K and above, whereas states in the aldol condensation path become more significant with increasing temperature (Fig. 2(d) and (g)). Temperature effects are even more significant for rate-determining transition states in p156, where transition state 5B, associated with the formation of ethylene from dissociatively adsorbed ethanol in the dehydration path, and transition state 6B, associated with the formation of C4H8O from acetaldehyde and ethylene in the Prins condensation path, are jointly TOF-controlling at 723 K but have almost no contribution at 623 K and 823 K, respectively (Fig. 2(i)). Transition state 1B from the ethanol dehydrogenation path is strongly rate-controlling at all relevant temperatures for p124 and p174, and is also slightly TOF-controlling for p123 and p156, for which the dominant transition states are 2M, associated with removal of atomic oxygen from C4H6O2 in the aldol condensation path, and 5B/6B, respectively. Intermediate state 4H, including surface C4H7O, hydrogen, and hydroxide, from MPV reduction of 3-hydroxybutanal is rate-controlling for p124 and p174 (with a small contribution from 4I at high temperatures). For p123, the dominant intermediate is 2E (C2H3O), with small contributions from 1A (especially at low temperatures) and 2F (C2H3O and acetaldehyde). 6C (C4H8O) and, to a much smaller extent, 6E (C4H7O) and 1A are identified as rate-controlling intermediates for p156. To summarize, the results for p123 suggest that ethanol dehydrogenation becomes less TOF-controlling with increasing temperature, while aldol condensation and formation of crotonaldehyde become more significant. The final dehydration to form butadiene is important in p124. Ethanol dehydration and Prins condensation are jointly TOF-controlling for p156, with reduced influence of dehydration at lower temperatures. Significant states in the most active pathway can be expected to be most noticeable overall.
Because the contribution of energy differences to the rate is exponential, there is often only one significant energy difference between a stable intermediate and a hard-to-reach transition state. For exergonic cycles, the TOF expression (eqn (1)) then simplifies to an Arrhenius-type formulation, where the activation energy is given by the energy span, δE, between the TDTS and TDI.37 The catalytic cycle ends at an energy displacement equal to the reaction energy, ΔGr, so all states in subsequent cycles are altered by this quantity. The “energy span approximation” can be depicted visually, finding the “largest hill to climb” between intermediates and transition states across multiple catalyst cycles (e.g., Fig. S9, in the ESI†). The reaction energies and energy spans for each free energy landscape are summarized in Table 1.
| Sequence | ΔGr (kcal mol−1) | δE (kcal mol−1) | ||||
|---|---|---|---|---|---|---|
| 623 K | 723 K | 823 K | 623 K | 723 K | 823 K | |
| p123 | −17.7 | −20.2 | −22.9 | 41.9 | 43.6 | 45.3 |
| p124 | −21.2 | −23.8 | −26.5 | 49.2 | 48.4 | 47.5 |
| p156 | −3.21 | −2.51 | −1.91 | 48.9 | 49.0 | 54.5 |
| p174 | −18.6 | −18.0 | −17.6 | 49.2 | 48.4 | 47.5 |
In the range 623–823 K, the sequence with the smallest energy span is the dehydrogenation pathway with aldol condensation and MPV reduction of crotonaldehyde (p123). At 623 K, the largest is the dehydrogenation path instead culminating in reduction of 3-hydroxybutanal (p124) and, at 723 K and above, it is the ethanol dehydration pathway (p156). The predicted energy spans are 10–20 kcal mol−1 larger than the apparent activation energy for butadiene production on silica-supported MgO reported by Taifan and coworkers under similar conditions.61 The difference between the energy spans of the extreme sequences is 7.3 kcal mol−1 at 623 K, 5.4 kcal mol−1 at 723 K and 9.2 kcal mol−1 at 823 K. The complete TOF expression (eqn (1)) was used to extend this analysis across a wider temperature range (Fig. 3). The sequence p123 was found to be most active over the whole temperature range, with a TOF one order of magnitude higher than the other sequences at most temperatures in the range 523–923 K. It is the only sequence with a predicted TOF near 1 s−1 at 723 K. Only at a temperature of around 823 K was the TOF from p124 also in this activity region. The TOF predicted for p156 was less than 0.1 s−1 for all temperatures investigated; thus, we find that ethanol dehydrogenation should be more active in producing butadiene than dehydration.
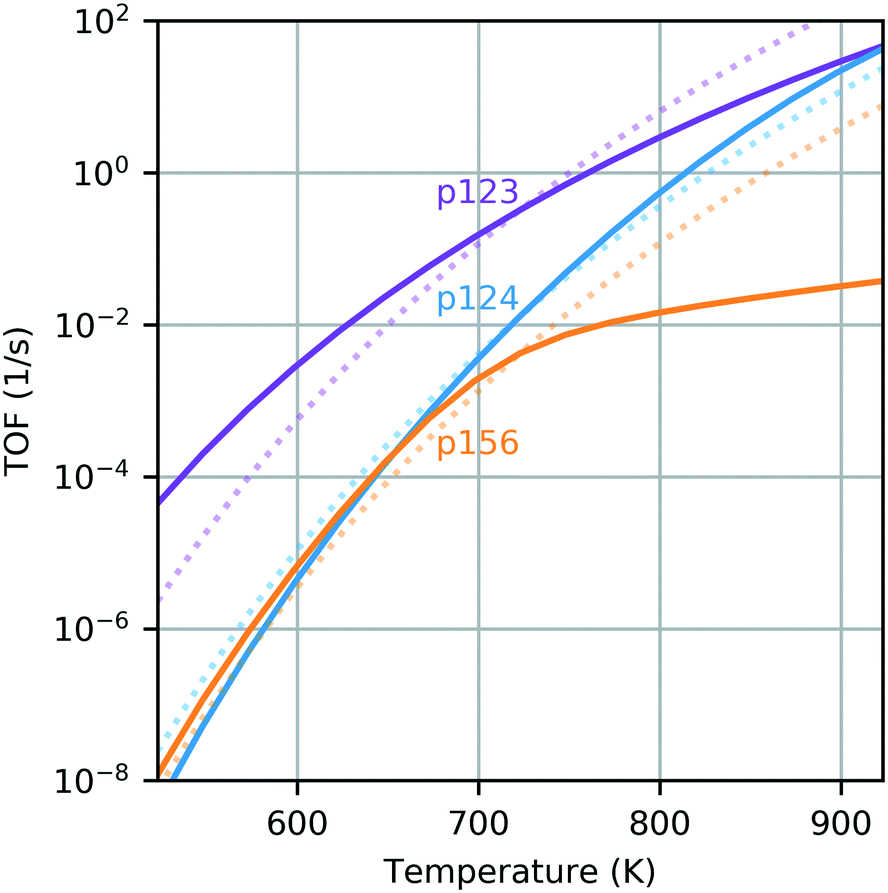 | ||
| Fig. 3 Energy span predicted TOF for each pathway as a function of temperature. State free energies were calculated accounting for temperature dependence of the entropic and enthalpic contributions, resulting in leveling off at high temperatures. Dotted lines show TOFs calculated with state free energies calculated at 723 K. | ||
It is also interesting to compare the TOF profiles with the profiles obtained using constant free energies – those computed at 723 K (dotted lines on Fig. 3). This clearly illustrates the impact of temperature dependence due to the entropic and enthalpic contributions to the free energy landscape. Particularly for the dehydration pathway (p156), it is observed that there is a significant change in behavior when temperature dependence is accounted for, resulting in a greatly reduced TOF at temperatures above 723 K when compared with the temperature-independent case. This can be attributed to the relatively large increase in the free energy of the TDTS with temperature (state 5B, see panel (c) of Fig. 2). In principle, the energy span analysis can be extended to consider multiple pathways and the influence of concentrations;37,38 however, given the complexity of the pathways considered here, we will instead utilize microkinetic modeling to study these effects.
3.3 Microkinetic analysis
We turn to microkinetic modeling to investigate kinetic limitations imposed by competing reaction steps, surface-gas dynamics and coverage limitations. Under most conditions, the TOF realized by the microkinetic model was found to be significantly lower than the theoretical maximum predicted by energy span theory for the individual pathways (Fig. 4), suggesting that kinetic limitations hinder performance to a large extent.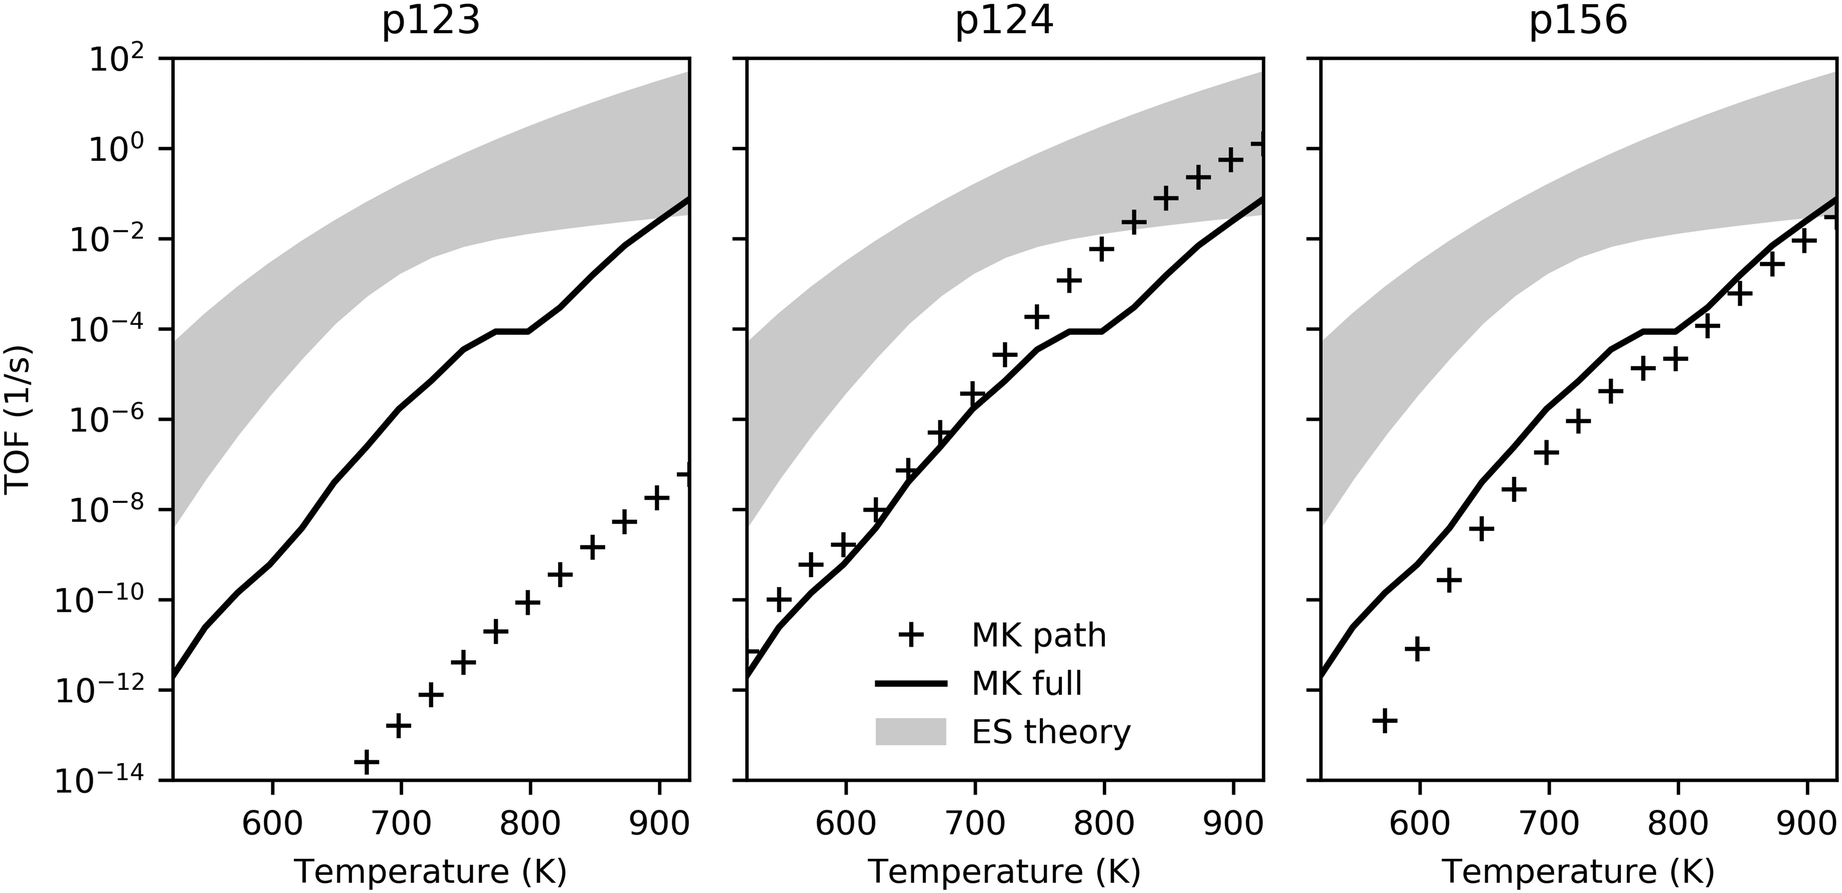 | ||
| Fig. 4 TOF comparison for energy span theory and microkinetic model as a function of temperature. Filled regions illustrate turnover range predicted by ES theory for each pathway; solid lines show TOF achieved by MK model with all pathways active; and markers indicate TOF achieved by MK model considering only individual pathways. The partial pressures of ethanol, hydrogen and ethylene were 2 kPa, 0.02 kPa and 0.02 kPa with trace amounts (2 × 10⁻⁸ kPa) of other gases, and a total pressure of 101.3 kPa. The long-term TOFs for the MK model were computed at the end of 24 h. Transient behavior is illustrated in Fig. S12 (ESI†). | ||
High surface coverage rapidly developed with transient dominance of several species indicating the influence of the different pathways. Initially, adsorbed ethanol and hydrogen were the most prevalent species across the temperature range (Fig. 5); however, surface coverage rapidly evolved in favor of two four-carbon species – C4H9O2, formed in the dehydrogenation pathway (p124), and C4H8O, formed in the dehydration pathway (p156). Similar coverage fractions of both species were obtained at 723 K. At the lower and higher temperatures, more significant fractions of the p124 and p156 intermediates were observed, respectively. The long-term convergence and steady-state comparison are illustrated in Fig. 5 and S12 (ESI†), and recorded Table S12 (ESI†) respectively, indicating that the gradients in the solution are sufficiently small after 24 h to consider this the steady-state behavior. The presence of strongly-bound intermediates has been observed experimentally under similar conditions, for example by Abdulrazzaq et al. who also found that the apparent activation energy for dehydrogenation was lower than that for dehydration and suggested the low apparent barrier for dehydrogenation was linked to the abundance of a stable surface species.62 Strongly-bound surface species were also observed with in situ spectroscopy by Taifan et al., with identified species including adsorbed ethanol/ethyoxy, acetaldehyde, aldol condensation and polymerization products, and C4 species such as butanol and crotyl alcohol.25,61 Hayashi et al. reported significant quantities of oxygenates and longer hydrocarbons on MgO.12
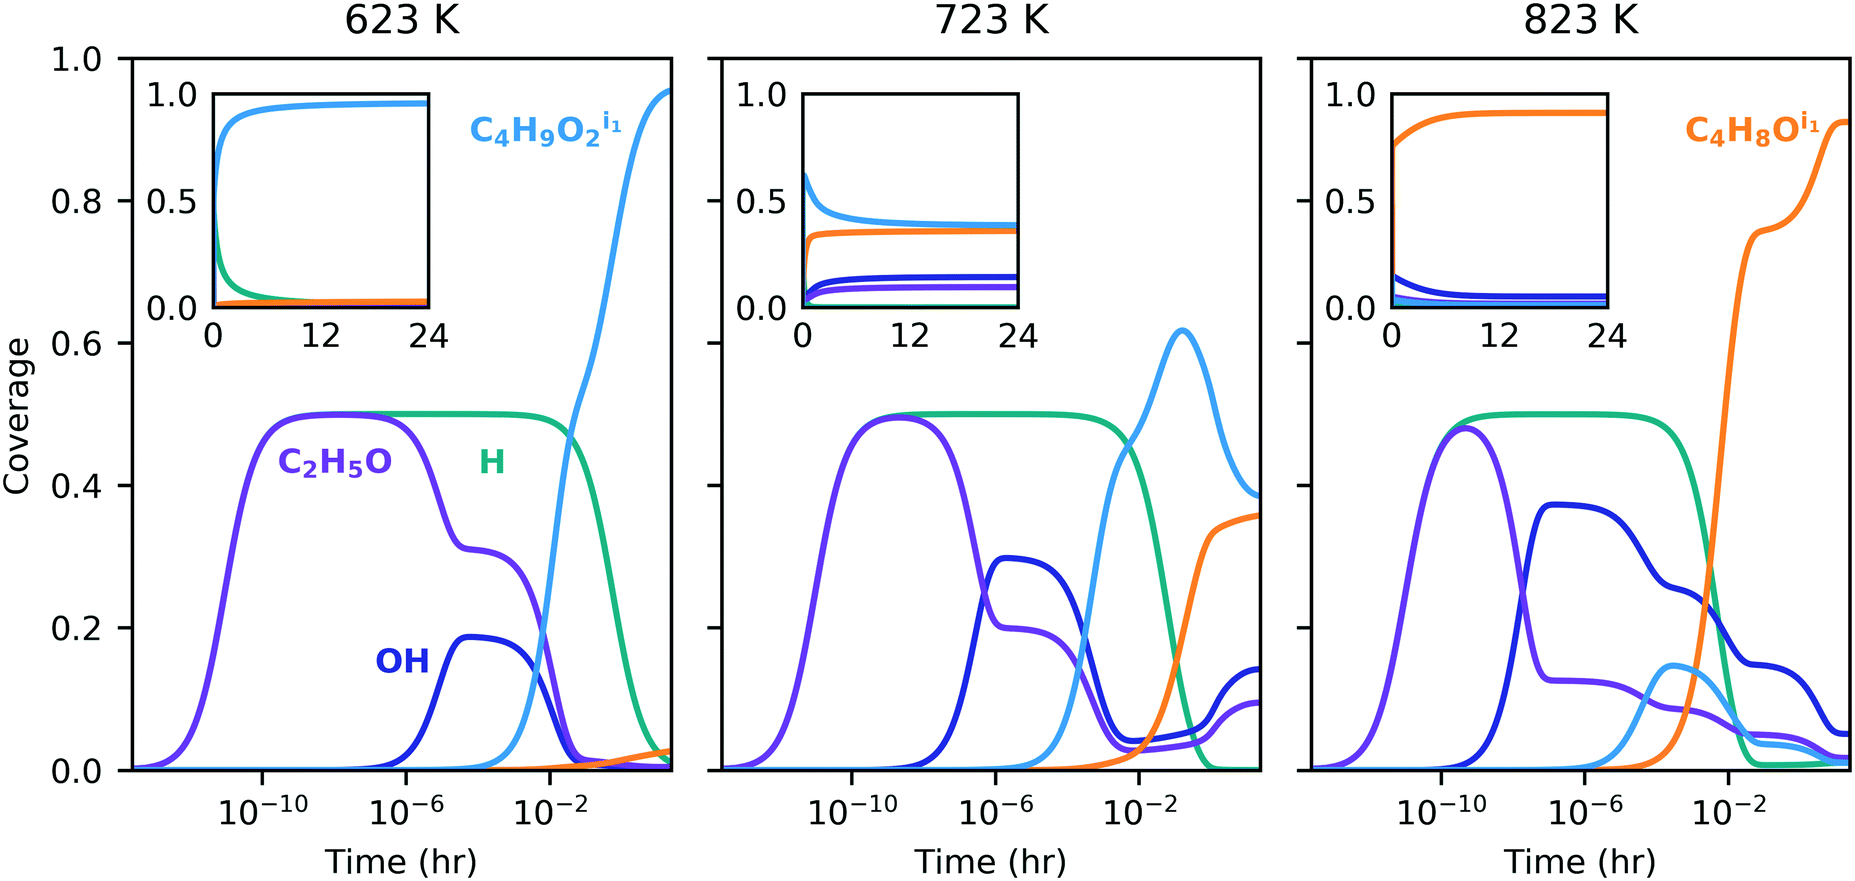 | ||
| Fig. 5 Transient surface coverage of dominant species. Inset shows the same time period with a linear x-axis scale. Only species with maximum coverage greater than 2% drawn. The partial pressures of ethanol, hydrogen and ethylene were 2 kPa, 0.02 kPa and 0.02 kPa with trace amounts (2 × 10⁻⁸ kPa) of other gases, and a total pressure of 101.3 kPa. | ||
Ethanol dehydrogenation followed by aldol condensation and MPV reduction of crotonaldehyde (p123) was predicted by the energy span theory to be somewhat limited by the initial acetaldehyde formation (due to stability of adsorbed ethanol – state 1A) but the TOF was expected to be primarily determined by the stable intermediate state 2E (C2H3O) and the transition state 2M (C4H6O2). Interestingly, under the conditions investigated here, we observed desorption of acetaldehyde instead, and the turnover obtained for p123 was consequently much lower than predicted by the ES analysis (Fig. 4, markers in left panel versus top of filled region). Surface coverage for p123 only (Fig. S13, ESI†) was found to be dominated by adsorbed ethanol, with a flux of ethanol to acetaldehyde, a trace amount of crotonaldehyde, and hydrogen (Fig. 6). By comparison, ethanol dehydration followed by aldol condensation and MPV reduction of 3-hydroxybutanal (p124) was found to be a relatively active pathway, with turnover in the ES-predicted region at high temperatures (Fig. 4, center panel). For p124, the energy span theory predicted that state 4H (C4H7O) would be rate limiting. However, this state is preceded by another highly stable state, 4D (C4H9O2), and this species was found to dominate surface coverage (Fig. S14, ESI†), possibly owing to the low concentration of free sites needed to deprotonate it via the reaction step 4D–F. Again, most ethanol was converted to acetaldehyde; however, around ten percent of the adsorbing carbon was converted to butadiene. High acetaldehyde selectivity relative to ethylene – greater than 80% at 723 K with ethanol partial pressure less than 10 kPa – has also been observed experimentally for a model MgO/SBA-15 catalyst.62 The TOF for ethanol dehydration and Prins condensation (p156) was predicted by the ES analysis to be determined by the stability of state 6C (C4H8O) and the barriers to reach transition states 5B and 6B (depending on temperature). With the microkinetic model, we found surface coverage to be mostly C4H8O, with early presence of adsorbed ethanol as well as hydroxide (Fig. S15, ESI†). As with the other pathways, the TOF was lower than predicted by the ES theory (Fig. 4, right panel) and ethanol was predominantly converted to acetaldehyde with approximately 2% ethylene and 2% butadiene.
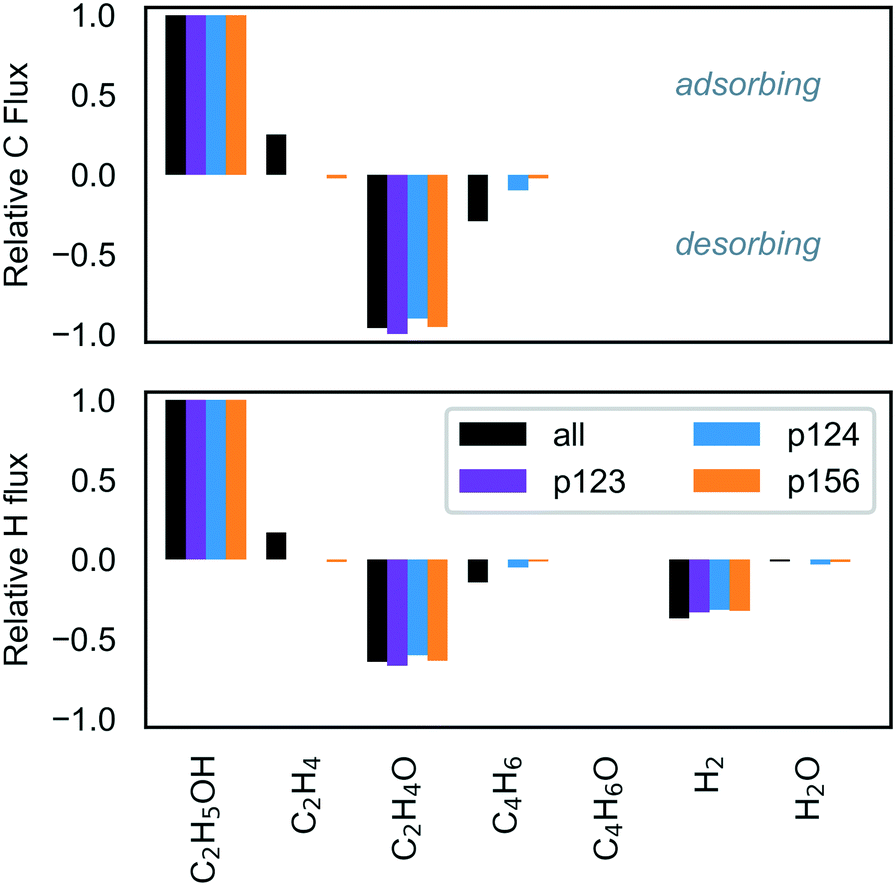 | ||
| Fig. 6 Elemental flux after 24 h operation. The partial pressures of ethanol, hydrogen and ethylene were 2 kPa, 0.02 kPa and 0.02 kPa, respectively, with trace amounts of other products (2 × 10⁻⁸ kPa), and a total pressure of 101.3 kPa. | ||
Because the pathways compete, the overall TOF obtained by the microkinetic model was found to be lower than the maximum TOF predicted for a single pathway (p124), although it was higher than the individual TOFs of the pathways predicted to be less active (p123 and p156). Also noteworthy is the relative impact of the pathways as a function of temperature – the kink in the TOF profile for the full MK model at around 800 K (Fig. 4) corresponds to changing surface coverage in favor of p156 intermediate C4H8O from p124 intermediate C4H9O2 (Fig. 5), and more significant influence of p156 compared to p124.
The studies discussed above highlight the challenge of improving selectivity for ethanol conversion to butadiene due to the competitive formation of other products – here, acetaldehyde and crotonaldehyde (Fig. 6), but experiments have found significant quantities of butanol,19,34,36 ethylene61 and lesser quantities of other species such as crotyl alcohol, butenes and longer hydrocarbons.12,31 On pure MgO, the main product has been reported to be acetaldehyde, with smaller yields of butanol and ethylene, and only trace amounts of crotonaldehyde.19,34,36 Under the conditions in the current study, selectivity towards crotonaldehyde was found to be low due to more favorable consumption of the acetaldehyde by aldol condensation in p124, and its desorption from the surface before p123 can progress to the crotonaldehyde formation stage. We found that the 2 kPa ethanol partial pressure at 723 K was a reasonably selective setting for butadiene formation with butadiene selectivity of almost 25% in a predominantly acetaldehyde-containing mixture (Fig. 7, byproduct selectivity is mapped in Fig. S16 in the ESI†). To consider the effect of other byproducts not represented in the butadiene mechanism, we expanded the model to allow formation of butanol by successive protonation of crotyl alkoxide (state 3C), and formation of ethyl acetate by dehydrogenation of hemiacetal (state 7E).9 The additional steps are listed in Table S10 (ESI†). Neither byproduct route had a significant impact on the results owing to the preferential desorption of crotonaldehyde relative to its reduction to crotyl alkoxide in the first case, and the unfavorability of the hemiacetal pathway in the latter. The low activity of the butanol route has the same stem as that of p123, and suggests that the current model is incomplete. We also note that other byproducts, such as methyl vinyl ketone and butenes, have been observed experimentally on pure MgO,19 and are not considered in the current model.
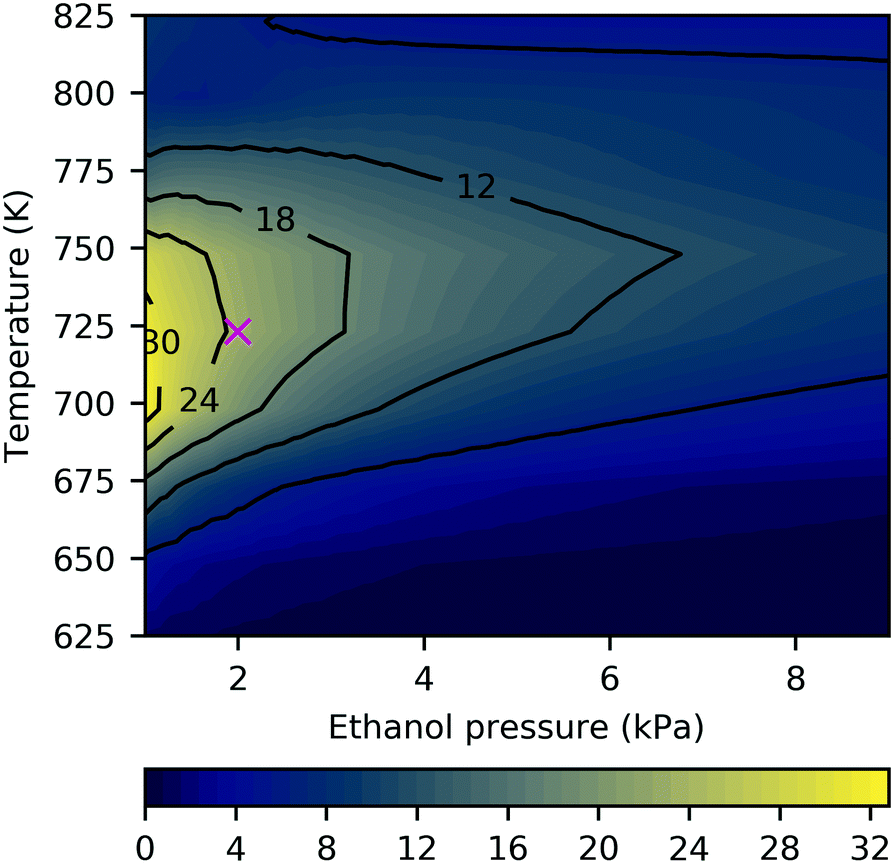 | ||
| Fig. 7 Butadiene selectivity as a function of ethanol partial pressure and temperature after 24 h operation. Marker indicates conditions used in other results figures. The partial pressures of hydrogen and ethylene were 0.02 kPa with trace amounts of other products (2 × 10⁻⁸ kPa), and a total pressure of 101.3 kPa. Selectivity is defined as the flux from all adsorbing carbon to desorbing butadiene. | ||
Reducing the ethanol partial pressure appeared to increase the selectivity, which has been observed previously.9 Da Ros et al.31 obtained a butadiene yield of around 20% at 723 K on 95![[thin space (1/6-em)]](https://www.rsc.org/images/entities/char_2009.gif) :5 MgO–SiO2 and Taifan et al.26 reported up to 30% selectivity for butadiene under similar conditions, but with significantly more ethylene formation. At temperatures exceeding 800 K, ethylene selectivity increased to several percent (Fig. S16, ESI†). Zhu et al. also observed increasing ethylene with temperature and maximal butadiene selectivity at 723 K.63 Water formation has been observed experimentally,25 and was found to occur to a small extent in the current study (Fig. 6).
:5 MgO–SiO2 and Taifan et al.26 reported up to 30% selectivity for butadiene under similar conditions, but with significantly more ethylene formation. At temperatures exceeding 800 K, ethylene selectivity increased to several percent (Fig. S16, ESI†). Zhu et al. also observed increasing ethylene with temperature and maximal butadiene selectivity at 723 K.63 Water formation has been observed experimentally,25 and was found to occur to a small extent in the current study (Fig. 6).
4 Impact of uncertainty
To assess the sensitivity of the kinetic predictions to underlying uncertainty in the energy landscape, we studied the impact of perturbing the free energies with a noise term chosen to represent correlated error. We found that individual predictions arising from the noisy data differed significantly, which is not surprising since the energies occur in the exponent in the rates; however, consistent trends were observed with temperature. While the energy span model could obtain similar turnover frequencies in the median and mean, the microkinetic model results were more broadly scattered and the average behavior was more different as shown in Fig. 8 (see also Fig. S18–S23 and related discussion in section 8 of the ESI†).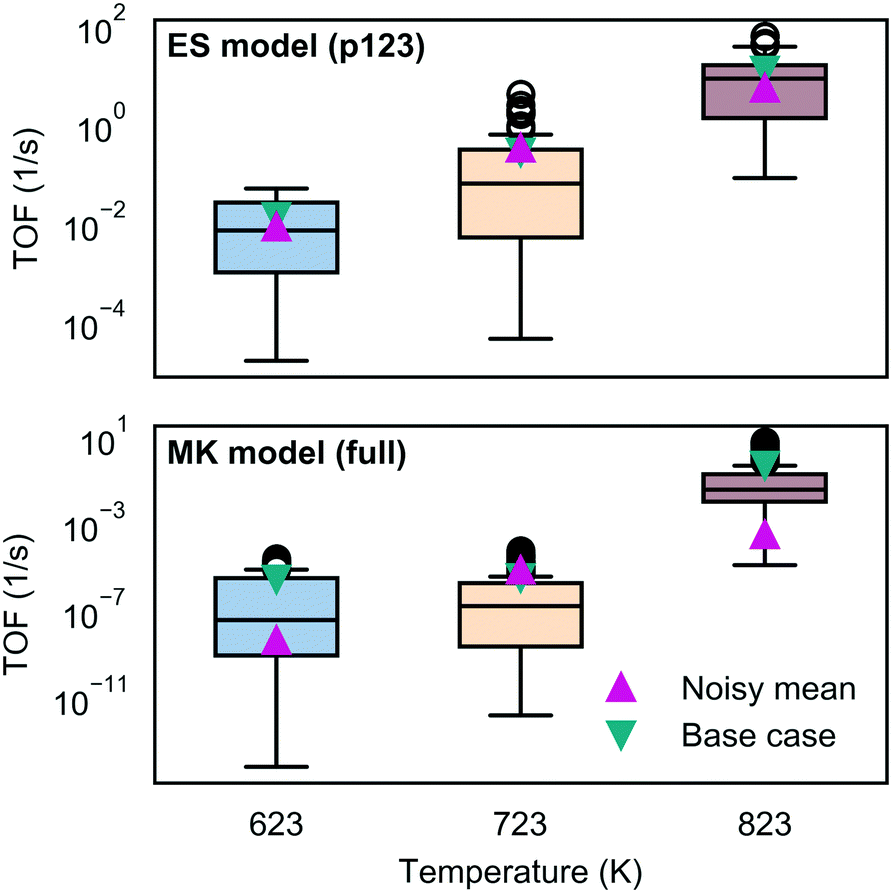 | ||
| Fig. 8 Impact of perturbing the free energy landscape on the TOF predicted by the energy span and microkinetic models. ES results are shown for the most active pathway (p123). Box-whisker plots were drawn from 100 samples. The box reflects the lower to upper quartiles with the median shown as a horizontal line. The whiskers reflect the range and the circles the outliers. Pink triangular markers give the noise-free, base case predictions and cyan markers give the mean of the noisysamples. | ||
5 Conclusions
Two theoretical methods were compared to study the activity and selectivity of ethanol conversion to butadiene. Application of the energy span model to each pathway predicted that ethanol dehydrogenation and aldol condensation will achieve a higher turnover than ethanol dehydration, followed by Prins condensation. Even so, the predicted turnover was found to be less than 1 s−1 at 723 K for all pathways, in line with experimental observations that pure MgO surfaces are weakly active towards butadiene production. The energy span analysis further indicated that the TOF would be determined by intermediate states involving adsorbed ethanol, and oxygenated hydrocarbons with chemical formulas C2H3O, C4H7O, and C4H8O, as well as transition states associated with acetaldehyde and crotonaldehyde formation.Temperature was found to have a significant effect on the entropic contributions of some states, especially those with associated gas molecules, as their translational contributions can change significantly. The variation in the energy landscape with temperature was consequently non-uniform because some binding energies (and thus barriers) changed more than others. This led to varying significance of different states at high or low temperatures; for example, in the ethanol dehydration pathway, different transition states were found to be rate-determining at 623 K and 823 K, with a combination of the two being important at 723 K. Another consequence was that the predicted TOFs did not all follow the same trajectory with increasing temperature, resulting in varying importance of the entire pathway's contribution when the pathways were viewed together and hence suggesting a possible justification for different rate limiting steps being implicated in previous studies.
The microkinetic modeling study predicted that kinetic limitations would have a significant impact on performance, with the TOF found to be significantly lower than the energy span predictions. Availability of reaction intermediates was hindered by competition between reaction steps, surface poisoning, and surface-gas dynamics, which suggests that these are important optimization targets for future catalyst design. Surface coverage for each pathway was found to be high, with TOF-determining states from the energy span predictions observed to be prevalent in some cases. The temperature-TOF profile and effect of temperature on the surface coverage of adsorbates point to changing dominance of the different pathways with temperature. Two oxygenated hydrocarbons – C4H9O2 and C4H8O – from competing pathways dominated the surface coverage under the tested conditions, with high coverage of C4H9O2 shifting in favor of C4H8O with increasing temperature. A corresponding shift was observed in the TOF at elevated temperatures. A maximum selectivity of just under 25% was predicted at an ethanol partial pressure of around 2 kPa, with the remainder of the adsorbing carbon primarily desorbing as acetaldehyde. Ethylene flux leaving the surface was only observed at temperatures approaching 800 K, associated with the increasing influence of the ethanol dehydration pathway.
The turnover and selectivity were thus found to be sensitive to both temperature and ethanol partial pressure. In general, performance is expected to vary with conditions as well as the preparation and composition of the catalyst,12 which can alter the ratio and strength of acidic and basic sites.64 MgO is often supported by silica, and doped to improve performance. It is worth noting that the MgO (100) step-edge model catalyst cannot resolve variations in performance arising from the quantity of other elements added, or the synthesis conditions. It is naturally anticipated that inclusion of dopant atoms such as copper or zinc in the energy calculations would result in a higher turnover prediction.4 Models for the undoped system have utility in that they can point to the highest barriers or most stable states that would ideally be targeted when dopant atoms, or site-type changes, are considered. For instance, this analysis suggests that the TOF might be improved by destabilizing the adsorbed 1,3-butandiol and 3-buten-2-ol intermediates, or by reducing the barriers for ethanol dehydrogenation and dehydration, at low/high temperatures respectively. Future work could also extend this analysis to model acid and base sites separately, and allow further polymerization, which has been postulated in some studies.12,25 Nonetheless, the present models allow useful characterization of the kinetic and thermodynamic limiting behavior of a complex catalytic system, and can suggest directions for rational catalyst enhancement.
Conflicts of interest
There are no conflicts to declare.Acknowledgements
This work was supported by the Knut and Alice Wallenberg Foundation (Project 2015.0057), the Swedish Research Council (Project 2015-03773) and the National Science Foundation under Grant No. CHE 1710120. T.B. acknowledges support from Slovak Research and Development Agency under contracts No. APVV-20-0127 and VEGA-1/0777/19. This work used the Extreme Science and Engineering Discovery Environment (XSEDE),65 which is supported by the National Science Foundation grant number ACI-1053575. Computational resources were provided by the Swedish National Infrastructure for Computing (SNIC) at C3SE (Gothenburg) and NSC (Linköping).References
- G. Luderer, Z. Vrontisi, C. Bertram, O. Y. Edelenbosch, R. C. Pietzcker, J. Rogelj, H. S. De Boer, L. Drouet, J. Emmerling, O. Fricko, S. Fujimori, P. Havlík, G. Iyer, K. Keramidas, A. Kitous, M. Pehl, V. Krey, K. Riahi, B. Saveyn, M. Tavoni, D. P. Van Vuuren and E. Kriegler, Nat. Clim. Change, 2018, 8, 626–633 CrossRef CAS.
- A. J. Ragauskas, C. K. Williams, B. H. Davison, G. Britovsek, J. Cairney, C. A. Eckert, W. J. Frederick, J. P. Hallett, D. J. Leak, C. L. Liotta, J. R. Mielenz, R. Murphy, R. Templer and T. Tschaplinski, Science, 2006, 311, 484–489 CrossRef CAS PubMed.
- J. A. Posada, A. D. Patel, A. Roes, K. Blok, A. P. Faaij and M. K. Patel, Bioresour. Technol., 2013, 135, 490–499 CrossRef CAS PubMed.
- C. Angelici, B. M. Weckhuysen and P. C. A. Bruijnincx, ChemSusChem, 2013, 6, 1595–1614 CrossRef CAS PubMed.
- J. Sun and Y. Wang, ACS Catal., 2014, 4, 1078–1090 CrossRef CAS.
- G. P. Robertson, S. K. Hamilton, B. L. Barham, B. E. Dale, R. C. Izaurralde, R. D. Jackson, D. A. Landis, S. M. Swinton, K. D. Thelen and J. M. Tiedje, Science, 2017, 356, eaal2324 CrossRef PubMed.
- G. Pomalaza, M. Capron, V. Ordomsky and F. Dumeignil, Catalysts, 2016, 6, 203 CrossRef.
- V. K. Srivastava, S. S. P. Sarkar, G. S. Rao and R. V. Jasra, Recent Adv. Petrochem. Sci., 2018, 6, 555698 Search PubMed.
- G. Pomalaza, P. Arango Ponton, M. Capron and F. Dumeignil, Catal. Sci. Technol., 2020, 10, 4860–4911 RSC.
- S. V. Lebedev, Zh. Obshch. Khim., 1933, 698–717 CAS.
- E. V. Makshina, M. Dusselier, W. Janssens, J. Degrève, P. A. Jacobs and B. F. Sels, Chem. Soc. Rev., 2014, 43, 7917–7953 RSC.
- Y. Hayashi, S. Akiyama, A. Miyaji, Y. Sekiguchi, Y. Sakamoto, A. Shiga, T.-r. Koyama, K. Motokura and T. Baba, Phys. Chem. Chem. Phys., 2016, 18, 25191–25209 RSC.
- W. Reschetilowski, M. Hauser, F. Alscher, M. Klauck and G. Kalies, Catalysts, 2020, 10, 854 CrossRef CAS.
- W. M. Quattlebaum, W. J. Toussaint and J. T. Dunn, J. Am. Chem. Soc., 1947, 69, 593–599 CrossRef CAS.
- W. J. Toussaint, J. T. Dunn and D. R. Jachson, Ind. Eng. Chem., 1947, 39, 120–125 CrossRef CAS.
- I. I. Ostromuisslenskii, Zh. Russ. Fiz.-Khim. O-va., 1915, 47, 1472–1494 CAS.
- V. Gruver, A. Sun and J. J. Fripiat, Catal. Lett., 1995, 34, 359–364 CrossRef CAS.
- M. Zhang, M. Gao, J. Chen and Y. Yu, RSC Adv., 2015, 5, 25959–25966 RSC.
- A. Chieregato, J. Velasquez Ochoa, C. Bandinelli, G. Fornasari, F. Cavani and M. Mella, ChemSusChem, 2015, 8, 377–388 CrossRef CAS PubMed.
- M. Bailly, C. Chizallet, G. Costentin, J. Kraft, H. Lauronpernot and M. Che, J. Catal., 2005, 235, 413–422 CrossRef CAS.
- C. Chizallet, G. Costentin, M. Che, F. Delbecq and P. Sautet, J. Phys. Chem. B, 2006, 110, 15878–15886 CrossRef CAS PubMed.
- M. M. Branda, A. H. Rodríguez, P. G. Belelli and N. J. Castellani, Surf. Sci., 2009, 603, 1093–1098 CrossRef CAS.
- D. Cornu, H. Guesmi, J.-M. Krafft and H. Lauron-Pernot, J. Phys. Chem. C, 2012, 116, 6645–6654 CrossRef CAS.
- W. E. Taifan, T. Bučko and J. Baltrusaitis, J. Catal., 2017, 346, 78–91 CrossRef CAS.
- W. E. Taifan, G. X. Yan and J. Baltrusaitis, Catal. Sci. Technol., 2017, 7, 4648–4668 RSC.
- W. E. Taifan and J. Baltrusaitis, J. Phys. Chem. C, 2018, 122, 20894–20906 CrossRef CAS.
- D. Fan, X. Dong, Y. Yu and M. Zhang, Phys. Chem. Chem. Phys., 2017, 19, 25671–25682 RSC.
- X. Dong, C. Liu, D. Fan, Y. Yu and M. Zhang, Appl. Surf. Sci., 2019, 481, 576–587 CrossRef CAS.
- H. Petitjean, H. Guesmi, H. Lauron-Pernot, G. Costentin, D. Loffreda, P. Sautet and F. Delbecq, ACS Catal., 2014, 4, 4004–4014 CrossRef CAS.
- E. F. de Souza, H. P. Pacheco, N. Miyake, R. J. Davis and F. S. Toniolo, ACS Catal., 2020, 10, 15162–15177 CrossRef CAS.
- S. Da Ros, M. D. Jones, D. Mattia, M. Schwaab, E. Barbosa-Coutinho, R. C. Rabelo-Neto, F. B. Noronha and J. C. Pinto, Chem. Eng. J., 2017, 308, 988–1000 CrossRef CAS.
- S. Kvisle, A. Aguero and R. Sneeden, Appl. Catal., 1988, 43, 117–131 CrossRef CAS.
- S.-H. Chung, C. Angelici, S. O. Hinterding, M. Weingarth, M. Baldus, K. Houben, B. M. Weckhuysen and P. C. Bruijnincx, ACS Catal., 2016, 6, 4034–4045 CrossRef CAS.
- S. Hanspal, Z. D. Young, H. Shou and R. J. Davis, ACS Catal., 2015, 5, 1737–1746 CrossRef CAS.
- A. Miyaji, M. Hiza, Y. Sekiguchi, S. Akiyama, A. Shiga and T. Baba, J. Jpn. Pet. Inst., 2018, 61, 171–181 CrossRef CAS.
- T. W. Birky, J. T. Kozlowski and R. J. Davis, J. Catal., 2013, 298, 130–137 CrossRef CAS.
- S. Kozuch and S. Shaik, Acc. Chem. Res., 2011, 44, 101–110 CrossRef CAS PubMed.
- A. Uhe, S. Kozuch and S. Shaik, J. Comput. Chem., 2011, 32, 978–985 CrossRef CAS PubMed.
- E. Solel, N. Tarannam and S. Kozuch, Chem. Commun., 2019, 55, 5306–5322 RSC.
- G. Kresse and J. Hafner, Phys. Rev. B: Condens. Matter Mater. Phys., 1993, 48, 13115–13118 CrossRef CAS PubMed.
- G. Kresse and J. Hafner, Phys. Rev. B: Condens. Matter Mater. Phys., 1994, 49, 14251–14269 CrossRef CAS PubMed.
- G. Kresse and J. Furthmüller, Comput. Mater. Sci., 1996, 6, 15–50 CrossRef CAS.
- G. Kresse and J. Furthmüller, Phys. Rev. B: Condens. Matter Mater. Phys., 1996, 54, 11169–11186 CrossRef CAS PubMed.
- P. E. Blöchl, Phys. Rev. B: Condens. Matter Mater. Phys., 1994, 50, 17953–17979 CrossRef PubMed.
- J. P. Perdew, K. Burke and M. Ernzerhof, Phys. Rev. Lett., 1996, 77, 3865–3868 CrossRef CAS PubMed.
- A. Heyden, A. T. Bell and F. J. Keil, J. Chem. Phys., 2005, 123, 224101 CrossRef PubMed.
- G. Henkelman and H. Jónsson, J. Chem. Phys., 1999, 111, 7010–7022 CrossRef CAS.
- G. Mills, H. Jónsson and G. K. Schenter, Surf. Sci., 1995, 324, 305–337 CrossRef CAS.
- H. Jónsson, G. Mills and K. W. Jacobsen, Classical and Quantum Dynamics in Condensed Phase Simulations, 1998, pp. 385–404 Search PubMed.
- F. Jensen, Introduction to Computational Chemistry, John Wiley & Sons, 3rd edn, 2017 Search PubMed.
- C. T. Campbell, Top. Catal., 1994, 1, 353–366 CrossRef CAS.
- C. T. Campbell, ACS Catal., 2017, 7, 2770–2779 CrossRef CAS.
- A. Boje, H. Ström and A. Hellman, PyCatKin, https://github.com/aab64/PyCatKin, 2021.
- I. Chorkendorff and J. W. Niemantsverdriet, Concepts of Modern Catalysis and Kinetics, John Wiley & Sons, 2003 Search PubMed.
- P. Virtanen, R. Gommers, T. E. Oliphant, M. Haberland, T. Reddy, D. Cournapeau, E. Burovski, P. Peterson, W. Weckesser, J. Bright, S. J. van der Walt, M. Brett, J. Wilson, K. J. Millman, N. Mayorov, A. R. J. Nelson, E. Jones, R. Kern, E. Larson, C. J. Carey, İ. Polat, Y. Feng, E. W. Moore, J. VanderPlas, D. Laxalde, J. Perktold, R. Cimrman, I. Henriksen, E. A. Quintero, C. R. Harris, A. M. Archibald, A. H. Ribeiro, F. Pedregosa, P. van Mulbregt and SciPy 1.0 Contributors, Nat. Methods, 2020, 17, 261–272 CrossRef CAS PubMed.
- C. Voglis and I. Lagaris, WSEAS International Conference on Applied Mathematics, 2004 Search PubMed.
- S. Döpking, C. P. Plaisance, D. Strobusch, K. Reuter, C. Scheurer and S. Matera, J. Chem. Phys., 2018, 148, 034102 CrossRef PubMed.
- S. Shylesh, L. A. Bettinson, A. Aljahri, M. Head-Gordon and A. T. Bell, ACS Catal., 2020, 10, 4566–4579 CrossRef CAS.
- A. J. Medford, J. Wellendorff, A. Vojvodic, F. Studt, F. Abild-Pedersen, K. W. Jacobsen, T. Bligaard and J. K. Norskov, Science, 2014, 345, 197–200 CrossRef CAS PubMed.
- D. Garay-Ruiz and C. Bo, ACS Catal., 2020, 10, 12627–12635 CrossRef CAS.
- W. E. Taifan, Y. Li, J. P. Baltrus, L. Zhang, A. I. Frenkel and J. Baltrusaitis, ACS Catal., 2019, 9, 269–285 CrossRef CAS.
- H. T. Abdulrazzaq, A. Rahmani Chokanlu, B. G. Frederick and T. J. Schwartz, ACS Catal., 2020, 10, 6318–6331 CrossRef CAS.
- Q. Zhu, B. Wang and T. Tan, ACS Sustainable Chem. Eng., 2017, 5, 722–733 CrossRef CAS.
- C. Angelici, M. E. Z. Velthoen, B. M. Weckhuysen and P. C. A. Bruijnincx, Catal. Sci. Technol., 2015, 5, 2869–2879 RSC.
- J. Towns, T. Cockerill, M. Dahan, I. Foster, K. Gaither, A. Grimshaw, V. Hazlewood, S. Lathrop, D. Lifka, G. D. Peterson, R. Roskies, J. R. Scott and N. Wilkins-Diehr, Comput. Sci. Eng., 2014, 16, 62–74 Search PubMed.
Footnotes |
| † Electronic supplementary information (ESI) available: Structures of all surface states; molecular composition of all states; energies of states introduced in this work; free energy calculations; energy span model; microkinetic model; impact of uncertainty. See DOI: 10.1039/d1cy00419k |
| ‡ We note that the energy span model is also often called the energetic span model. Here we will use energy span, consistent with Kozuch's recent work.39 |
| This journal is © The Royal Society of Chemistry 2021 |