 Open Access Article
CO2 conversion over Cu–Mo2C catalysts: effect of the Cu promoter and preparation method†
Eleni
Heracleous
 *ab,
Vasiliki
Koidi
ab and
Angelos A.
Lappas
a
aChemical Process & Energy Resources Institute (CPERI), Centre for Research and Technology Hellas (CERTH), 6th km Charilaou – Thermi Road, P.O. Box 361, 57001 Thessaloniki, Greece. E-mail: eheracle@cperi.certh.gr
bSchool of Science and Technology, International Hellenic University, Greece
First published on 9th December 2020
Abstract
Mo2C-Based catalysts constitute a promising class of materials for CO2 hydrogenation to high added-value products. In this work, we show that methanol formation can be significantly enhanced by the addition of Cu. Moreover, the preparation method of the Cu–Mo2C catalysts can significantly affect the catalytic performance. Synthesis via the sol–gel auto-combustion route leads not only to the most active material, achieving 30 mol% CO2 conversion at 325 °C and 45 bar, but also to the most selective towards methanol (∼50 C-mol% at 5 mol% conversion). This performance is slightly inferior for the catalyst prepared with the solvothermal method. Conversely, the catalyst synthesized with the solid state route presents by a long way the worst activity and selectivity in the reaction. We show with spectroscopy and temperature programed studies that Cu addition and the synthesis method modify the population, type and strength of the sites available for CO2 and H2 activation on the surface and hence the catalytic performance. The results suggest that strong interaction between the Cu and Mo2C phases and formation of Mo2C–Cu+ interfaces are required for the efficient hydrogenation of CO2 to methanol.
1. Introduction
Global warming, caused by anthropogenic emissions of CO2 from the combustion of fossil fuels in industry, transport and energy production, is one of the most serious challenges of the 21st century.1 Despite the implementation of several climate change mitigation policies, CO2 emissions grew at an annual rate of 2.6% in the period of 2000–2014.2 In 2016, the atmospheric concentration of CO2 surpassed 400 ppm for the first time in several million years. Recent data indicate that global warming is happening faster than initially expected, due to a combination of rising emissions, increasing air pollution and natural climate cycles.3 The urgent need to stabilize anthropogenic CO2 emissions has led to the development of several technologies that are currently in the research and demonstration phase. Among those, the capture of CO2 and its re-utilization as a carbon feedstock to produce new fuels and chemicals presents great promise.4–6 A substantial part of this research has been devoted to the catalytic hydrogenation of CO2 to methanol,7–9 a molecule that can serve both as a fuel and as a platform chemical for the production of numerous other useful products.Progress in the development of heterogeneous catalysts for the reduction of CO2 by H2 has been reported in recent reviews.6,10–13 In general, metallic copper constitutes the active component in the most active and selective catalysts.10,14–18 However, Cu catalysts tend to deactivate under working conditions due to segregation of the Cu particles at high temperature19 and poor hydrothermal stability.20 Molybdenum carbide-based catalysts represent an interesting alternative and have received considerable attention in the last few years as they are inexpensive, non-toxic and non-hazardous with noble metal-like behavior.21 Mo2C was found to be very effective in low-temperature CO2 reduction due to its dual functionality for H2 dissociation and C![[double bond, length as m-dash]](https://www.rsc.org/images/entities/char_e001.gif) O bond scission.22,23 It was also shown that its performance can be tuned by controlling the carbide structure and through promotion with other metals.
O bond scission.22,23 It was also shown that its performance can be tuned by controlling the carbide structure and through promotion with other metals.
Posada-Pérez et al. investigated the performance of molybdenum carbides with different crystal structures and found that although both α-MoC1−x and β-MoCy are active in CO2 hydrogenation, the overall activity and selectivity towards CO, CH4 and CH3OH are strongly affected by the Mo/C ratio.24 They showed that the lower the Mo/C ratio, the weaker the interaction with the CO2 molecule. Thus, β-MoCy is more active, but mainly produces CH4 as it promotes full CO2 dissociation, whereas α-MoC1−x favors CH3OH production. The above were also corroborated by Xu et al.25 The surface termination was also shown to affect the strength of interaction with CO2 and thus the product spectrum. The β-Mo2C(001) plane has metal and carbon surface terminations. DFT studies showed that on the Mo-terminated surface, the exposed Mo atoms can fully dissociate CO2 into C and O atoms, resulting in the production of CO, CH4 and CH3OH as reaction products. On the other hand, the C-terminated surface is less reactive, therefore yielding a different CO/CH4/CH3OH ratio in the products.24 With regard to the CO2 activation mechanism, it has been claimed, on the basis of ambient pressure XPS, temperature-programmed surface reaction experiments and DFT studies, that Mo2C reduces CO2 to CO, forming an oxycarbide.22,23,26 The oxycarbide is subsequently reduced by H2 to H2O and Mo2C, completing the catalytic cycle.22 The oxygen binding energy (OBE) of transition metal carbides (TMCs) has thus been claimed to be an appropriate descriptor for predicting the activity of carbides in the reaction. Porosoff et al. showed that TMCs with low OBE, like Mo2C, present higher CO2 conversion as they allow both the adsorption and subsequent removal of oxygen from CO2 that is necessary to complete the catalytic cycle.23
Promotion of transition metal carbides with other metals also significantly modifies the products of CO2 hydrogenation. Metal addition was shown to lead to higher catalytic activity and stability in the forward and reverse water-gas shift reaction,22,27–29 the hydrogenation of CO2 to methanol,7,30,31 and the CO2 methanation reaction.30–32 The promotion of TiC with Au, Cu and Ni led to active catalysts for CO production.30 On Au/TiC and Cu/TiC, a substantial amount of methanol was also produced, while Ni/TiC favored methane formation. The activity of Cu/TiC in methanol synthesis was higher than that of a model Cu/ZnO industrial catalyst. Based on DFT studies, the carbide enhances the ability of transition metals to adsorb and activate CO2.30 Dubois et al. reported that the addition of Cu to Mo2C and Fe3C increases the selectivity to methanol by more than 50%.33 Cu/Mo2C was also found to be very effective for CO production. Detailed characterization demonstrated that the strong interaction between Cu and β-Mo2C effectively promotes Cu dispersion and prevents agglomeration, thus leading to extraordinary activity and stability.29 Promotion of Mo2C with Co increased substantially the CO selectivity over CH4, cobalt's CH4 dissociation ability being most likely responsible for this effect.22 In another work, multicomponent Cs-doped catalysts (Cs–Mo2C, Cu–Cs–Mo2C) showed high CO selectivity.32 It was argued that the electropositive character of Cs facilitates electron transfer from Cs to Mo and leads to an electronically-rich surface which favors CO production.
In view of the above, it becomes clear that the performance of Mo2C is tunable and strongly depends on the structure, the Mo/C ratio, the termination of the exposed surface planes and the presence of promoting metals. These characteristics can be modified by applying appropriate synthesis methods. In this work, we investigate the effect of Cu-promotion and the preparation method on the physicochemical properties and performance of a series of Mo2C-based catalysts in the CO2 hydrogenation reaction. The catalysts are synthesized with three different methods, i.e. solid state synthesis, solvothermal synthesis and sol–gel auto-combustion, and are characterized to understand the influence of the synthesis route and Cu addition on the properties of the oxidic and carbidic materials, the carburization mechanism and the CO2 hydrogenation performance. X-ray photoelectron spectroscopy and temperature-programmed studies are also undertaken to probe the number and nature of active sites on the surface. We show that both Cu addition and the synthesis route modify the population, the type and the strength of the sites available for CO2 and H2 activation. Optimum results are obtained with the Cu–Mo2C catalyst prepared with the sol–gel auto-combustion method, which shows the highest activity, and at the same time the highest selectivity to methanol in the temperature range of interest.
2. Experimental
2.1 Catalyst preparation
A series of Mo2C and Cu–Mo2C catalysts with constant Cu content (20 wt%) were prepared via the direct carburization of MoOx and CuMoOx oxide precursors synthesized with three different methods: solid state synthesis, solvothermal synthesis and sol–gel auto-combustion. Ammonium heptamolybdate [(NH4)6Mo7O24·4H2O (ChemLab)] and copper nitrate [Cu(NO3)2·2.5H2O (ChemLab)] were used as precursor salts. In the solid state (SS) synthesis, the appropriate amounts of the precursors were mechanically mixed and calcined at 500 °C for 6 h in air. For the solvothermal (SV) preparation, the precursors were first dissolved in water and the solution was heated to 70 °C and stirred for 1 h in a rotary evaporator. The solvent was then removed by evaporation under reduced pressure. The resulting solid was dried and calcined at 500 °C for 6 h in air. In the sol–gel auto-combustion (SG) method, the precursors were dissolved in water with citric acid [C6H8O7·H2O (PanReac)] as a combustion agent (CA/Mo molar ratio 1.3). The solution was stirred at 90 °C on a hot plate until gelation occurred. The formed gel was transferred to a pre-heated furnace at 400 °C, where the gel auto-combusted after a few minutes in a self-propagating combustion manner, leading to the formation of a voluminous fluffy powder. The powder was calcined at 500 °C for 6 h in air. The as-prepared MoOx and CuMoOx precursors are denoted as MoOx-SV and CuMoOx-(SS, SV, SG) depending on the synthesis method. In all cases, carburization was carried out under atmospheric pressure in a flow of 20% CH4/H2. The temperature was linearly increased at a rate of 1 °C min−1 from room temperature to 750 °C where it was maintained for 3 h. Prior to air exposure, passivation was performed at room temperature in a 1.5% O2/He flow for 3 h. The Mo2C and Cu–Mo2C catalysts are denoted as Mo2C-SV and Cu-Mo2C-(SS, SV, SG) depending on the synthesis method.2.2 Catalyst characterization
The catalysts were subjected to physicochemical characterization both in their oxide and final carbide form. For the determination of the surface area (BET method) and pore volume, N2 adsorption/desorption experiments were conducted at −196 °C using an automatic volumetric sorption analyzer (Autosorb-1MP, Quantachrome). Prior to the measurements, the samples were dehydrated under vacuum at 250 °C overnight.X-ray diffraction (XRD) measurements were performed using a SIEMENS D-500 diffractometer employing CuKα1 radiation (λ = 0.15405 nm) and operating at 40 kV and 30 mA. The XRD patterns were accumulated in the 2θ range of 5–85° with a 0.02° step size and a counting time of 2 s per step.
The Mo and Cu contents were measured by inductively coupled plasma-atomic emission spectroscopy (ICP-AES) on a spectrophotometer Optima 4300 DV (PerkinElmer). The C content was determined with CHN elemental analysis on a CHN-800 elemental analyzer (LECO Corporation) according to the UOP 703 method, measured as CO2 by a selective infrared cell (detector).
X-ray photoelectron spectroscopy (XPS) measurements were performed on a Kratos Analytical AXIS UltraDLD spectrometer equipped with a monochromatic Al Kα excitation source (λKa = 1486.6 eV), under ultra-high vacuum conditions (10−9 Torr). Binding energy (BE) referencing was employed using the adventitious carbon peak at 284.8 eV. Survey scans were recorded for surface elemental analysis (pass energy 160 eV), with high resolution spectra recorded at 20 eV pass energy with a step of 0.1 eV and an X-ray power of 150 W. Deconvolution of the peaks was performed with Kratos Vision software (version 2.2.1) using Shirley background subtraction and mixed Gaussian (70%)–Lorentzian (30%) functions. Auger electron spectroscopy (AES) was performed both via X-ray excitation under the same conditions as described above and via electron beam accelerated with a voltage of 10 kV.
Electron microscopy was performed on a JEOL 2011 high-resolution transmission electron microscope operating at 200 kV, with a point resolution of 0.23 nm and Cs = 1.0 mm. Processing of the spectra was accomplished using the INCA Microanalysis Suite software.
2.3 Catalytic activity testing
The catalytic performance in CO2 hydrogenation was evaluated in a continuous high-pressure dual fixed-bed reactor unit (Microactivity Effi-PID) with an electronic feed control system for both gaseous and liquid feeds. The unit's feeding system consists of three gas lines, each equipped with high accuracy mass flow controllers, and one liquid feed line, using a high precision pump. The stainless steel reactors (ID: 9.1 mm) are fitted with porous plates to ensure that the catalyst bed is located in the furnace's isothermal temperature zone. The reaction temperature is monitored with a thermocouple inserted in the catalytic bed. The exit stream of the reactors is sent to a liquid–gas separator for separation and collection of the liquid and gaseous products.In a typical experiment, the required catalyst amount, previously crushed to a particle size of 150–335 μm, was diluted with an equal amount of SiC and was introduced into the reactor. The catalyst was pre-reduced in situ in 20% H2/N2 at 300 °C for 1.5 h. The reaction was conducted at temperatures of 200–400 °C, a pressure of 45 bar, W/F = 0.3 g s cm−3 and a H2/CO2 molar ratio of 3. Steady-state activity data were obtained after 1 h of time-on-stream. Both liquid and gaseous products were analyzed with a GC 7890 gas chromatograph (Agilent Technologies) equipped with a dual FID/TCD detector. Mass and carbon balances typically closed to within 5%. All the gases used (H2, N2, and CO2) were of purity above 99.999%.
2.4 Temperature-programmed studies
A series of temperature-programmed experiments was conducted in a home-made gas flow system equipped with a quadrupole mass analyzer (Omnistar, Balzers). The carburization mechanism was examined via temperature-programmed carburization (TPC) of the oxide precursors. The sample (200 mg) was placed in a quartz reactor and was pretreated in flowing He for 0.5 h at 200 °C, followed by cooling at room temperature. The temperature was then raised to 750 °C with a heating rate of 5 °C min−1 in a 20% CH4/H2 flow and was maintained constant at 750 °C for 1 h. The main (m/z) fragments registered were CO2 = 44, CO = 28, H2O = 18, CH4 = 16 and H2 = 2.Temperature-programmed reduction (TPR-H2) was performed to study catalyst reducibility. The sample (200 mg) was pretreated in flowing He for 0.5 h at 200 °C, followed by cooling at room temperature. The temperature was then raised to 750 °C with a heating rate of 5 °C min−1 in 5% H2/He flow and was maintained constant at 750 °C for 1 h. The main (m/z) fragments registered were CO2 = 44, CO = 28, H2O = 18, CH4 = 16, He = 4 and H2 = 2.
Metal dispersion was determined via H2 chemisorption followed by temperature-programmed desorption (TPD-H2). The sample (100 mg) was pretreated in flowing He for 0.5 h at 200 °C, followed by cooling at room temperature. To ensure full catalyst reduction, the temperature was increased to 350 °C in pure H2 and hydrogen chemisorption was then performed at 250 °C for 1 h. The sample was cooled to room temperature under constant hydrogen flow. The flow was switched to He and the sample was purged for 2 h. TPD was performed by heating the sample from room temperature to 750 °C at a rate of 10 °C min−1 in He. Dispersion was calculated from the quantification of the desorbed hydrogen (m/z = 2), assuming a H/Me stoichiometry of 1.34
CO2 temperature-programmed desorption (TPD-CO2) was performed on the same apparatus. The sample (100 mg) was pretreated in flowing He for 0.5 h at 200 °C, followed by cooling at room temperature. To ensure full catalyst reduction, the temperature was increased to 350 °C in 5% H2/He flow and the system was cooled down to 100 °C under He. CO2 sorption was performed at 100 °C for 1 h in 10% CO2/He flow. The sample was cooled to room temperature under 10% CO2/He flow and the flow was then switched to He for purging for 2 h. TPD was performed by heating the sample from room temperature to 750 °C at a rate of 10 °C min−1 in He. The amount of CO2 desorbed was quantified using the m/z signal 44.
3. Results and discussion
3.1 Characterization of the oxide precursors
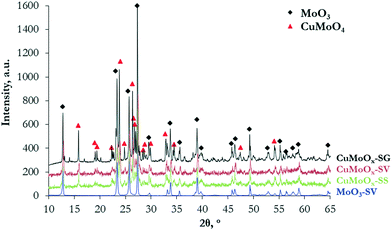
The materials were characterized prior to carburization, to study whether promotion with Cu and/or the synthesis method affect the physicochemical properties of the oxide precursors. The Cu and Mo contents measured by ICP are sufficiently close to the nominal values in all materials, indicating successful preparation. The samples demonstrate low surface areas, in the range of 1.3–2.9 m2 g−1 (Table 1). The XRD diffractograms (Fig. 1) reveal the formation of a well-crystallized orthorhombic MoO3 phase (JCPDS 00-005-0508) in pure MoOx. When Cu is added, MoO3 co-exists with a mixed CuMoO4 triclinic phase (JCPDS 01-073-0488). No formation of crystalline CuO is observed. The intensity and sharpness of the X-ray diffractions suggest that the addition of Cu slightly reduces crystallinity. Among the Cu-promoted samples, the oxide precursor prepared via the sol–gel auto-combustion method is more crystalline, as opposed to the solid state CuMoOx that presents broader XRD peaks.| Sample | Cu ICP (nominal), wt% | Mo ICP (nominal), wt% | Surface area, m2 g−1 |
|---|---|---|---|
| MoOx-SV | — | 73.4 (66.7) | 2.9 |
| CuMoOx-SG | 16.2 (14.5) | 59.4 (54.6) | 1.3 |
| CuMoOx-SV | 16.1 (14.5) | 58.9 (54.6) | 2.4 |
| CuMoOx-SS | 13.7 (14.5) | 61.4 (54.6) | 2.1 |
3.2 Carburization mechanism
The MoOx and CuMoOx precursors were subjected to temperature-programmed carburization (TPC) in 20% CH4/H2 flow. The profiles of the different gases (Fig. 2) clearly demonstrate the great impact of the Cu promoter on the carburization mechanism.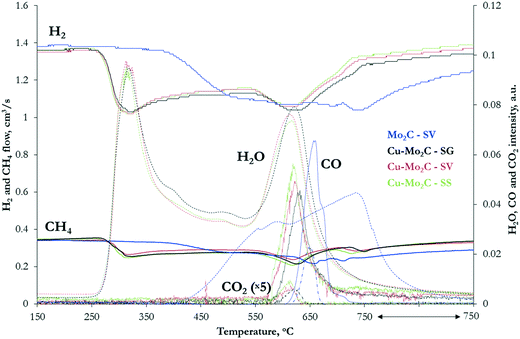 | ||
| Fig. 2 Temperature-programmed carburization profiles of the MoOx and CuMoOx oxide precursors in 20% CH4/H2 flow (heating rate: 5 °C min−1). | ||
Carburization of pure MoOx begins at ∼375 °C. The H2 and CH4 consumption peaks are broad and extend to 750 °C, with two weak maxima at 530 °C and 740 °C suggesting a multi-step process. In the first stage, both H2 and CH4 are consumed simultaneously with concurrent formation only of H2O. At this step, hydrogen acts as a reductant, reducing molybdenum oxide. The consumption of methane, with no contemporaneous formation of carbon-containing products, suggests that the carburization process is initiated with the formation of MoOxCy as an intermediate. Oxycarbides have been shown to form at ∼550 °C during the carburization of MoO3 with 20% CH4/H2.35 The second stage of carburization occurs at 600–750 °C. The consumption of H2 and CH4 is now accompanied by large evolution of CO and H2O, with some desorption of CO2 as well. The production of carbon oxides shows that complete dissociation of CH4 to carbon and hydrogen species takes place. Part of the carbon is incorporated in the intermediate MoOxCy phase, forming the desired Mo2C, while the rest, together with hydrogen, react with the oxides' lattice oxygen, forming COx and H2O. These results are in agreement with TPR-GC-MS profiles of MoO3 carburization in 20% CH4/H2 presented in previous studies.35
The temperature-programmed profiles of the CuMoOx oxides are distinctly different, with a great shift of carburization to much lower temperature and a clearer separation of the two main reaction steps. The formation of the oxycarbide drops by more than 200 °C (from 530 °C to 310 °C) and spans from 260 to 380 °C. Such an effect has been previously observed in the presence of promoters. In particular, Ni was reported to enhance the dissociation of the carbon source and/or the reaction of the active carbon species with the lattice oxygen.36 A similar role could be envisaged for Cu. The second carburization step also moves to lower temperature, occurring at 580–680 °C with the maximum at 620 °C. At 725 °C, a third smaller CH4 consumption peak can be observed, associated with carbon deposition on the catalyst surface, as no other products are formed. The TPC profiles of the CuMoOx precursors prepared with different synthesis routes do not present appreciable differences, suggesting that the preparation method does not significantly alter the carburization mechanism. The only variation worth mentioning is the shift of the maximum temperature of CO formation, from 618 °C for the SS-prepared sample to 622 °C for Cu–Mo2C-SV and 630 °C for the SG sample.
3.3 Characterization of the metal carbides
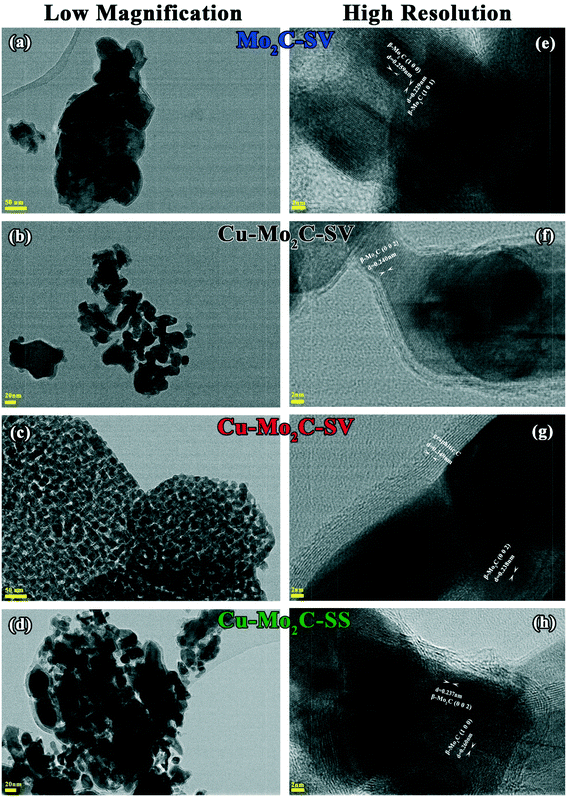
The final solids, obtained after the carburization process, were characterized thoroughly with various methods. Fig. 3 presents low (a–d) and high (e–h) magnification images obtained by transmission electron microscopy. The low magnification images reveal that only Cu–Mo2C prepared via the solvothermal route is homogeneous, with a crystallite size ranging from 25 to 35 nm, while the rest of the samples present heterogeneity. Concerning the metal content, it was not possible to measure the Mo concentration with ICP due to the poor solubilization of Mo2C. The Cu content of the Cu–Mo2C catalysts is close to nominal (20 wt%) for all materials (Table 2). The surface area increases by an order of magnitude compared to the oxide precursors, probably due to the generation of pores during the carburization process. Small pores or channels have been previously evidenced by HR-TEM on the surface of β-Mo2C prepared with similar methods.35 Still, the surface area remains low (in the range of 17.5–20.4 m2 g−1) and independent of the presence of Cu or the synthesis route, restricted by the high carburization temperature (750 °C) which causes segregation and carbon deposition on the catalyst surface that clogs the pores. The latter is confirmed by both elemental and XPS analysis results (see Tables 2 and 3) that show that the amount of carbon on the catalysts is much higher than that theoretically contained in Mo2C (4.7 wt%). Coke deposition is consistently higher in the Cu-promoted samples compared to pure Mo2C. It appears that Cu particles on the surface act as nuclei, catalyzing the complete dissociation of CH4. This agrees with the third small CH4 consumption peak at 725 °C that appears only in the temperature programmed carburization profiles of the Cu-containing mixed oxide precursors. The negative effect of Cu on coke deposition is also evidenced by HR-TEM images (Fig. 3e–h). On pure Mo2C, only ∼4 layers of elemental carbon, identified by the characteristic interatomic d-spacing of amorphous carbon (d = 0.349 nm), surround the catalyst's active phase. On the Cu-containing samples, external carbon deposition varies between 5 and 10 layers.| Sample | Cu ICP (nominal), wt% | C (nominal), wt% | Surface area, m2 g−1 | Dispersiona, % |
|---|---|---|---|---|
| a Dispersion refers to the total dispersion of both Mo and Cu. | ||||
| Mo2C-SV | — | 7.2 (5.9) | 17.5 | 2.8 |
| Cu–Mo2C-SG | 20.3 (20.0) | 11.8 (4.7) | 20.4 | 1.7 |
| Cu–Mo2C-SV | 20.8 (20.0) | 11.0 (4.7) | 18.4 | 1.6 |
| Cu–Mo2C-SS | 21.1 (20.0) | 14.7 (4.7) | 18.7 | 2.5 |
| Sample | Cu, wt% | Mo, wt% | C, wt% | O, wt% |
|---|---|---|---|---|
| Mo2C-SV | — | 46.6 | 30.8 | 22.6 |
| Cu–Mo2C-SG | 8.0 | 46.6 | 39.0 | 6.4 |
| Cu–Mo2C-SV | 8.0 | 53.9 | 35.2 | 2.9 |
| Cu–Mo2C-SS | 5.8 | 34.2 | 57.6 | 2.4 |
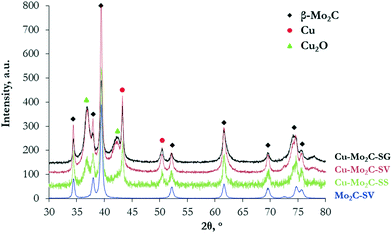
The XRD diffractograms (Fig. 4) show the formation of a well-defined β-Mo2C crystal phase (2θ = 34.4°, 38.0°, 39.4°, 52.1°, 61.5°, 69.6°, 74.6°, and 75.6°) with a hexagonal close packed structure (JCPDS 00-035-0787) in all the catalysts. The characteristic interatomic d-spacings of hexagonal β-Mo2C can also be viewed in the high resolution HR-TEM images (Fig. 3e–h). The XRD diffractions are sharper and larger for pure Mo2C, signifying better crystallinity, as also in the case of the oxidic precursors. None of the samples display MoOx diffractions. In addition to the β-Mo2C phase, the Cu-containing carbides demonstrate clear reflections at 43.3° and 50.8°, corresponding to the (111) and (200) lattice planes of face-centered cubic metallic Cu crystals (JCPDS 00-004-0836), as well as a distorted, more amorphous-like Cu2O phase at 37° and 42° (JCPDS 03-065-3288). Cu2O could be formed as a result of the passivation treatment.
To further investigate the formed phases, the interaction between the different components and the surface elemental states, the carbide catalysts were characterized with X-ray photoelectron spectroscopy (XPS). Table 3 shows the surface composition of the four samples. The surface carbon exceeds by far both the nominal value, corresponding to the carbidic carbon, and the actual bulk content determined with elemental analysis (Table 2). The C 1s XPS spectra presented in Fig. 5a demonstrate three main components: a peak centered at 286–287 eV due to oxygen in C–O–C and O–C![[double bond, length as m-dash]](https://www.rsc.org/images/entities/char_e001.gif) O bonds (contamination), a peak at 284.8 eV attributed to graphitic-like carbon,37,38 and a peak at 283.7 eV ascribed to carbidic carbon in the Mo2C structure.32,37 The graphitic carbon is clearly dominant, evidencing the extensive coke deposition that takes place primarily on the catalyst surface. The Cu-containing samples consistently demonstrate much higher surface carbon content than pure Mo2C, confirming the undesirable effect of Cu on coke formation. More than 57 wt% of the surface of the catalyst prepared by the solid state route (Cu–Mo2C-SS) is covered by carbon, with the other two Cu-containing materials exhibiting similar coke coverage in the range of 35–39 wt%. In consequence, a large percentage of the Cu sites is probably covered by these surface carbonaceous deposits, as the exposure of Cu in the upper surface layers is lower than the respective amount in the bulk. Similar observations can be made for the Mo sites (nominal Mo content based on stoichiometry: 75.2 wt%).
O bonds (contamination), a peak at 284.8 eV attributed to graphitic-like carbon,37,38 and a peak at 283.7 eV ascribed to carbidic carbon in the Mo2C structure.32,37 The graphitic carbon is clearly dominant, evidencing the extensive coke deposition that takes place primarily on the catalyst surface. The Cu-containing samples consistently demonstrate much higher surface carbon content than pure Mo2C, confirming the undesirable effect of Cu on coke formation. More than 57 wt% of the surface of the catalyst prepared by the solid state route (Cu–Mo2C-SS) is covered by carbon, with the other two Cu-containing materials exhibiting similar coke coverage in the range of 35–39 wt%. In consequence, a large percentage of the Cu sites is probably covered by these surface carbonaceous deposits, as the exposure of Cu in the upper surface layers is lower than the respective amount in the bulk. Similar observations can be made for the Mo sites (nominal Mo content based on stoichiometry: 75.2 wt%).
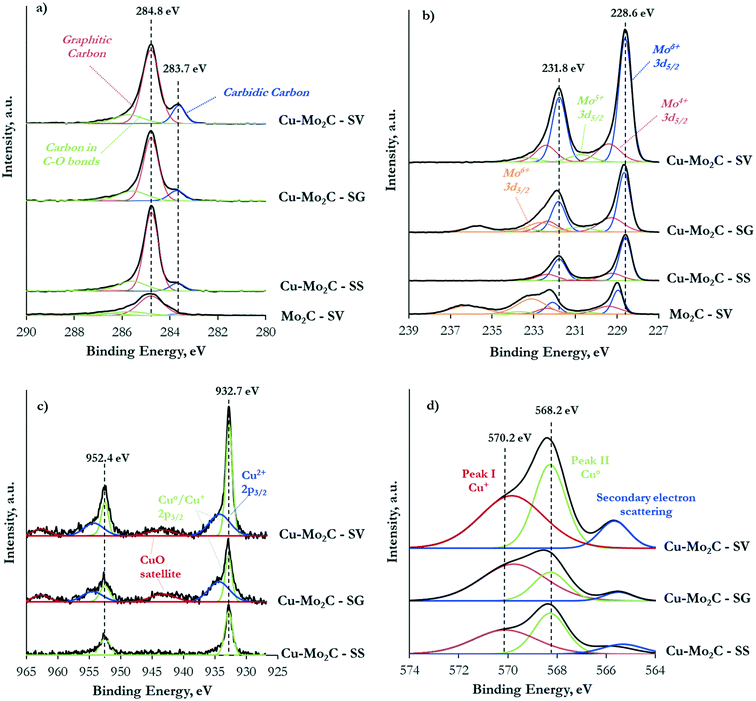 | ||
| Fig. 5 C 1s XP (a), Mo 3d XP (b), Cu 2p XP (c) and Cu LMM AES (d) spectra of the Mo2C and Cu–Mo2C catalysts. | ||
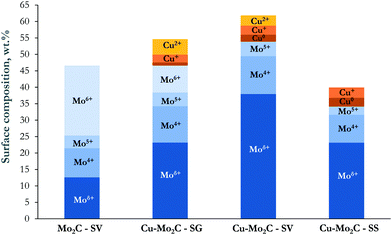
It is also of interest to note the appreciable amount of oxygen on the top surface layers, especially in the case of the un-promoted Mo2C. This oxygen could arise from the oxide layer that forms on the catalyst surface during passivation, remaining oxide phases and/or oxygen incorporated in the Mo2C structure due to air exposure.37 Indeed, the Mo 3d XPS spectra (Fig. 5b) evidence the presence of Mo in several oxidation states, ranging from Mo6+ to Moδ+ (1 < δ < 4). In the Cu-containing catalysts, the main peaks are located at 231.8 eV and 228.6 eV attributed to the 3d3/2 and 3d5/2 transitions of Mo atoms in the molybdenum carbide phase.32,39 The corresponding peaks are blue-shifted by ∼0.3 eV in pure Mo2C. This Cu-induced decrease in the binding energy of the Mo 3d transitions signifies the strong interaction between the carbide and copper. Electrons are transferred from Cu to Mo, increasing the electron density of molybdenum.37,38 Deconvolution of the XPS spectra allowed the quantification of the Mo oxidation state distribution on the catalytic surface (Fig. 6). The Moδ+ species, which are regarded as the active sites for non-dissociative CO2 adsorption and alcohol formation,40,41 are dominant in Cu–Mo2C-SV. On the other hand, the majority of molybdenum is in its highest oxidation state (Mo6+) in pure Mo2C, consistent with the highest surface oxygen coverage of this sample and the reductive effect of Cu.
The Cu 2p XPS spectra (Fig. 5c) demonstrate two well-resolved peaks centered at 952.4 eV and 932.7 eV, corresponding to Cu+/Cu° 2p1/2 and 2p3/2 transitions.42 In addition, satellite peaks at ∼943.4 eV and ∼962.7 eV in the spectra of Cu–Mo2C-SG and Cu–Mo2C-SV (albeit less prominent) evidence the presence of Cu2+ species.43 Indeed, spectral deconvolution reveals Cu 2p transitions corresponding to Cu2+ (∼934.3 eV) and Cu+/Cu° (932.8 eV)29,42,43 in these two materials. The identification of Cu+ and Cu0 species is difficult from XPS analysis alone, as the binding energy of the Cu 2p3/2 core-level emission is essentially the same. This distinction is however possible with Auger electron spectroscopy (AES). Spectral fitting and deconvolution of the Cu LMM Auger spectra (Fig. 5d) shows peaks at 569.7–570.1 eV attributed to Cu+ species, at 568.2 eV corresponding to metallic Cu,32,38 and at 565.5 eV due to the secondary electron scattering. The calculated Auger parameters confirm these assignments. Table 4 summarizes the measured Cu 2p3/2 XP binding energy, the Cu LMM Auger kinetic energies and the respective calculated Auger parameters. Literature studies report the Auger parameters for Cu0 and Cu+ at 1851.2 eV and ∼1849.2 eV, respectively.42 Thus, our calculations reveal and corroborate the co-existence of Cu° and Cu+ species on the catalyst surface. Based on the combined XPS and AES information, the surface concentration of the different Cu oxidation states was determined and is shown in Fig. 6. In the Cu–Mo2C samples prepared by the solvothermal and sol–gel auto-combustion routes, Cu mainly exists in the +1 and +2 valence states, while it is more reduced in Cu–Mo2C-SS. The presence of Cu in a higher oxidation state is consistent with the shift of the Mo 3d binding energy to lower values in the Cu-promoted Mo2C samples and the electron transfer from Cu to Mo. As however aforementioned, CuOx could also be formed as a result of the passivation treatment during preparation.
| Sample | Cu 2p3/2 XP BE, eV | Cu LMM Auger KE, eV | Calculated Auger parameter, eV | ||
|---|---|---|---|---|---|
| Peak I | Peak II | Peak I | Peak II | ||
| Cu–Mo2C-SG | 932.9 | 917.0 | 918.4 | 1849.9 | 1851.3 |
| Cu–Mo2C-SV | 932.8 | 916.8 | 918.4 | 1849.6 | 1851.2 |
| Cu–Mo2C-SS | 932.8 | 916.5 | 918.4 | 1849.3 | 1851.2 |
To remove the oxide layer that forms on the catalyst surface during passivation and eliminate the remaining oxide traces and/or any oxygen incorporated in the Mo2C structure due to air exposure,44 it is necessary to pretreat the catalysts in hydrogen prior to the reaction. Temperature-programmed reduction was thus performed to determine an appropriate pretreatment temperature. In all cases, hydrogen consumption remains at low levels (Fig. S1†), confirming the successful carburization of the precursors. Pure Mo2C demonstrates a broad H2 consumption peak extending from 220 to 600 °C. The corresponding peaks for the Cu–Mo2C samples are comparatively much smaller, narrower and shifted to lower temperatures (200–280 °C). The higher hydrogen consumption for unpromoted Mo2C is consistent with the XPS observations that show the highest concentration of O species and Mo5+/Mo6+ on its surface. Cu addition seems to suppress the incorporation of oxygen in the carbidic structure as a result of air exposure. We observed similar results in a previous work on transition metal promoted K/Mo2C catalysts for higher alcohols synthesis from syngas.37 In analogous TPR experiments, H2 consumption of K/Mo2C was almost twice that of the Cu-promoted Cu/K/Mo2C catalyst.
Metal dispersion was determined by hydrogen chemisorption and subsequent temperature programmed desorption. As shown in Table 2, dispersion is low for Mo2C and decreases further upon Cu addition. The latter can be associated with the high Cu loading (∼20 wt%). Recently, Zhang et al. prepared a series of Cu-doped β-Mo2C catalysts and demonstrated that the higher the Cu loading, the lower the Cu dispersion. At large loadings, Cu tends to aggregate into larger particles.29 Comparatively, the total dispersion of Cu and Mo appears higher in the catalyst prepared via the solid state route (Cu–Mo2C-SS), while it is practically the same for the other two samples. This can be linked to the larger concentration of metallic Cu on the surface of Cu–Mo2C-SS (as evidenced by XPS), known for its hydrogen dissociation activity.
3.4 Catalytic performance in CO2 hydrogenation
The hydrogenation of CO2 at 45 bar using H2/CO2 with a molar ratio of 3 as the feed in the 200–400 °C temperature range over the carbide-based catalysts leads to the production of CO, CH3OH, CH4, C2H6 and H2O. The conversion of CO2 and the selectivity to all carbon-containing products are shown in Fig. 7 and 8(a–d), respectively. The corresponding data for H2 conversion are presented in Fig. S2.† Pure Mo2C demonstrates considerable reactivity, with ∼30 mol% CO2 conversion at 325 °C. Comparison with the corresponding Cu-containing material (Cu–Mo2C-SV) shows that the addition of Cu suppresses the reactivity by 10–15%. Similar studies in the literature report controversial results. Xu et al.,31 Zhang et al.32 and Dubois et al.33 all reported a small decrease in the total conversion of CO2 upon promotion of Mo2C with Cu. On the other hand, Chen et al.45 and Xiong et al.38 showed enhanced CO2 hydrogenation reaction rates on Cu-containing carbides. These discrepancies could stem from the use of different Cu loadings, preparation methods, experimental conditions, etc. However, the positive effect of Cu on methanol selectivity is unanimous in all studies. We also observe a substantial increase in methanol selectivity over Cu–Mo2C-SV compared to pure Mo2C in the 200–250 °C range (Fig. 8a). The product spectrum of Mo2C is dominated by CO (Fig. 8b), produced via the reverse water gas shift (RWGS) reaction, and CH4 (Fig. 8c), produced from CO2 methanation. The production of CO decreases with temperature in favor of CH4 formation. Over the 275–300 °C temperature range, the formation of C2H6 also becomes significant (Fig. 8d). The selectivity to methanol does not surpass 7 C-mol% under any operating conditions. The Cu-promoted carbide on the other hand produces substantial quantities of methanol at low temperature (highest CH3OH selectivity ∼54 C-mol%), which decreases quickly with temperature, as expected, due to the highly exothermic nature of the methanol synthesis reaction. At higher temperatures, the product composition is very similar to that of pure Mo2C, with mainly formation of CO and CH4.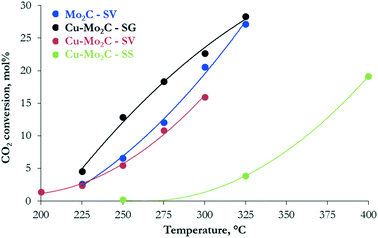 | ||
| Fig. 7 Conversion of CO2versus temperature over the Mo2C and Cu–Mo2C catalysts (reaction conditions: P = 45 bar, H2/CO2 ratio = 3, W/F = 0.3 g s cm−3). | ||
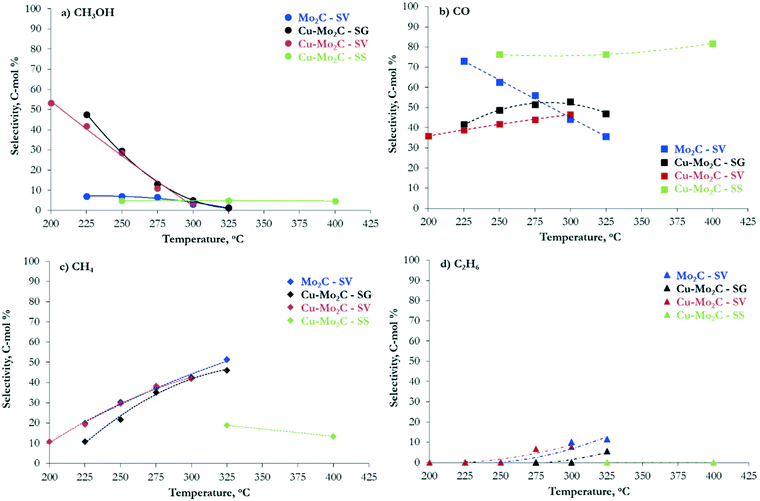 | ||
| Fig. 8 Selectivity to (a) CH3OH, (b) CO, (c) CH4 and (d) C2H6versus temperature over the Mo2C and Cu–Mo2C catalysts (reaction conditions: P = 45 bar, H2/CO2 ratio = 3, W/F = 0.3 g s cm−3). | ||
Despite the similarity in the physicochemical properties and structure of the copper–molybdenum carbides prepared with different synthesis methods, the materials exhibit appreciable variation in the reaction performance. The catalyst synthesized with sol–gel auto-combustion (Cu–Mo2C-SG) presents the highest reactivity that even surpasses that of pure Mo2C-SV (Fig. 7). The performance drops by about 30–40% for the solvothermally-prepared material (Cu–Mo2C-SV). Both catalysts exhibit high methanol selectivity at low temperature (Fig. 8a), which decreases in favor of CO and CH4 formation at temperatures higher than 250 °C (Fig. 8b and c). Comparison at iso-conversion (Fig. S3†) shows that Cu–Mo2C-SG is more selective to methanol; the sol–gel auto-combustion synthesis route leads therefore not only to the most active, but also the most selective catalyst. The preparation of Cu–Mo2C with the solid state method (Cu–Mo2C-SS) clearly yields a catalyst with much worse performance; significant conversion is recorded only at temperature exceeding 325 °C. This material is also very different in terms of the product composition. As it is active at the high end of the temperature spectrum, it produces primarily CO, with CH4 as a side product. The selectivity of both remains largely constant with increasing temperature (and conversion).
3.5 Temperature-programmed studies
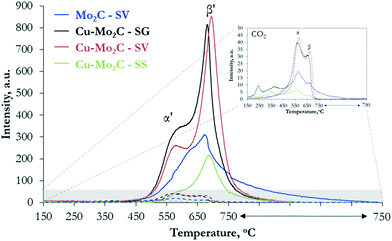
To probe further the nature of the active sites and understand the variations in the catalytic performance, we studied the interaction of the two reactants, CO2 and H2, with the catalytic surface with temperature-programmed desorption (TPD). The results of TPD after CO2 sorption confirm the ability of the molybdenum carbides to catalyze the dissociation of the carbon dioxide molecule, as the main gaseous species desorbed from the surface is in all cases CO (Fig. 9). Based on the literature,22,24 CO2 binds to the surface of Mo2C in a bent configuration and the C![[double bond, length as m-dash]](https://www.rsc.org/images/entities/char_e001.gif) O bond spontaneously breaks, leading to the formation of adsorbed CO and O. CO desorbs in the gas phase, while O oxidizes the catalyst forming an oxy-carbide phase. The CO desorption profile (Fig. 9) of pure Mo2C consists of a broad asymmetric peak, extending from 450 °C to 750 °C, with the maximum at 680 °C (species β′). This peak appears also in the profiles of the Cu–Mo2C catalysts, albeit sharper and narrower, with the maximum shifted to higher temperatures (690–700 °C). In addition, a second low-temperature, well-defined shoulder emerges at 570–580 °C (species α′). Desorption of non-dissociated CO2 is much lower on all the samples, with however a more complicated TPD profile (see the inset of Fig. 9). Multiple small peaks can be observed at temperatures <400 °C, corresponding to CO2 interacting weakly with the surface, while two main CO2 desorption peaks are detected at 560 °C (species α) and 670 °C (species β). These temperatures match closely those of CO desorption, with however the low-temperature peak being the larger one for CO2. To accurately calculate the surface concentration of the different species, we performed deconvolution and quantification of the individual CO and CO2 peaks (Table 5). The deconvoluted profiles for CO and CO2 are shown in Fig. S4 and S5,† respectively. The quantified results show that the total amount of desorbed CO is one order of magnitude larger than CO2, fully in line with the ability of the carbides to activate and dissociate CO2.
O bond spontaneously breaks, leading to the formation of adsorbed CO and O. CO desorbs in the gas phase, while O oxidizes the catalyst forming an oxy-carbide phase. The CO desorption profile (Fig. 9) of pure Mo2C consists of a broad asymmetric peak, extending from 450 °C to 750 °C, with the maximum at 680 °C (species β′). This peak appears also in the profiles of the Cu–Mo2C catalysts, albeit sharper and narrower, with the maximum shifted to higher temperatures (690–700 °C). In addition, a second low-temperature, well-defined shoulder emerges at 570–580 °C (species α′). Desorption of non-dissociated CO2 is much lower on all the samples, with however a more complicated TPD profile (see the inset of Fig. 9). Multiple small peaks can be observed at temperatures <400 °C, corresponding to CO2 interacting weakly with the surface, while two main CO2 desorption peaks are detected at 560 °C (species α) and 670 °C (species β). These temperatures match closely those of CO desorption, with however the low-temperature peak being the larger one for CO2. To accurately calculate the surface concentration of the different species, we performed deconvolution and quantification of the individual CO and CO2 peaks (Table 5). The deconvoluted profiles for CO and CO2 are shown in Fig. S4 and S5,† respectively. The quantified results show that the total amount of desorbed CO is one order of magnitude larger than CO2, fully in line with the ability of the carbides to activate and dissociate CO2.
| Catalyst | Desorbed CO2 (μmol g−1) | Desorbed CO (μmol g−1) | ||||||
|---|---|---|---|---|---|---|---|---|
| <400 °C | α | β | Total | <400 °C | α′ | β′ | Total | |
| Mo2C-SV | — | 45.3 | 17.6 | 62.9 | — | — | 810.4 | 810.4 |
| Cu–Mo2C-SG | 41.0 | 59.4 | 21.4 | 121.8 | — | 401.0 | 768.2 | 1169.2 |
| Cu–Mo2C-SV | 19.9 | 54.1 | 30.4 | 104.4 | — | 322.5 | 805.4 | 1127.9 |
| Cu–Mo2C-SS | 12.5 | 15.9 | 1.3 | 29.7 | — | 32.2 | 312.3 | 344.5 |
The presence of several peaks in the CO and CO2 desorption profiles suggests the existence of multiple adsorption and reaction sites on the catalyst surface. Xu et al.25 showed that CO2 interacts strongly with pure Mo2C and undergoes sequential dissociation first to CO and then to C, which in the presence of H2 is hydrogenated to CH4. Moreover, theoretical DFT calculations showed that the Mo-terminated surface of β-Mo2C is much more reactive towards CO2 dissociation than the C-terminated one.46 In view of these insights, the single peak associated with the dissociative adsorption of CO2 to CO in the TPD spectrum of pure Mo2C could be assigned to the activation and dissociation of CO2 on unmodified Mo-terminated Mo2C sites (species β′). Addition of Cu leads to the appearance of a new CO desorption peak at lower temperature. Considering that pure metallic Cu0 is inactive for CO2 adsorption due to its completely occupied d-orbitals,47 species α′ can be tentatively assigned to the strongly interacting Mo2C–Cu+ interfaces detected by XPS and Auger spectroscopy. In these sites, electrons are transferred from Cu to Mo, as evidenced by the decreased binding energy of the Mo 3d transition (see Fig. 5b) and the presence of monovalent copper (see Fig. 6). The low CO desorption temperature suggests that these moieties bind CO2 more weakly and thus promote methanol over methane formation. This inference is in line with the results of Xiong et al.38 who reported the formation of similar sites (MoOxCy–Cu+ species) and claimed that Cu addition inhibits the full dissociation of CO2 and promotes the formation of CH3OH via the hydrogenation of CO* species on the surface. The limited amount of non-dissociated CO2 species released in the gas phase (species α and β) can be ascribed to CO2 adsorbed on C-terminated Mo2C surfaces and unmodified Cu0 particles on the surface that are inactive for CO2 dissociation. The peaks at T < 400 °C can be related to different very weakly physisorbed CO2 species.
The CO2 hydrogenation reaction requires also the adsorption and activation of H2. This was probed by subjecting the catalysts to H2 adsorption, followed by TPD in helium. The H2 desorption profiles (Fig. 10) display multiple peaks, evidencing the presence of different active sites also for hydrogen activation. The quantified results, after deconvolution, are presented in Table 6, while the corresponding deconvoluted profiles are shown in Fig. S6.† Overall, hydrogen activation occurs at lower temperatures than CO2, suggesting that the active sites are not completely occupied by adsorbed H2 and can be easily released to participate in the subsequent adsorption and activation of CO2. Mo2C demonstrates one large broad peak extending from 50 °C to 750 °C and centered at 700 °C (species β′′), with a small low-temperature shoulder at ∼250 °C (species α′′), confirming that the pure Mo2C surface alone has the ability to adsorb and dissociate the hydrogen molecule. Wang et al. performed DFT studies on Mo-terminated, C-terminated and mixed Mo/C-terminated planes of the hexagonal Mo2C phase and showed that the strongest dissociative H2 adsorption is found on the Mo-terminated (001) surface.48 The intensity of the high-temperature peak drops considerably in the Cu-promoted materials, with its maximum shifting ∼50 °C lower. The peak at 250 °C becomes the dominant one, being considerably larger and sharper, suggesting that it corresponds to Cu-containing sites. Similar TPD-H2 experiments performed on Mo2C and Cu/Mo2C catalysts also demonstrated two H2 desorption peaks in the temperature range of 100–700 °C.38 Liu et al. observed that the addition of Cu to Mo2C increases and shifts the H2 desorption peaks to lower temperature, indicating that Cu improves H2 activation and enhances the generation of active surface H-species.49 This is consistent with the well-known hydrogen dissociative activity of Cu0.50 Considering the above, the two H2 desorption peaks can be ascribed to H2 activation on metallic copper (species α′′) and Mo2C facets (species β′′) on the surface of the catalysts.
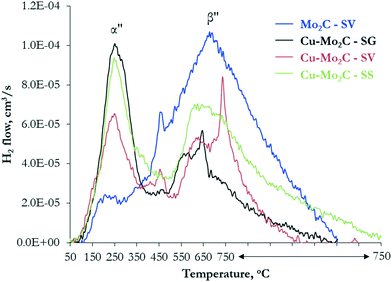 | ||
| Fig. 10 Desorption profiles of H2 as a function of temperature following H2 adsorption on the Mo2C and Cu–Mo2C catalysts. | ||
| Catalyst | Desorbed H2 (μmol g−1) | ||
|---|---|---|---|
| α′′ | β′′ | Total | |
| Mo2C-SV | 5.2 | 142.2 | 147.4 |
| Cu–Mo2C-SG | 36.5 | 48.7 | 85.2 |
| Cu–Mo2C-SV | 26.2 | 57.2 | 83.4 |
| Cu–Mo2C-SS | 34.3 | 92.1 | 126.5 |
Although all carbides contain multiple sites for non-dissociative and dissociative CO2 and H2 activation, the absolute and relative amounts vary considerably depending on the presence of Cu and the synthesis route. The results presented in Tables 5 and 6 show that pure Mo2C contains a high number of exposed Mo2C facets (probably Mo-terminated) that have the ability to both dissociate CO2 and activate H2. On the basis of DFT calculations,46 Mo-terminated Mo2C strongly binds CO2, dissociating it sequentially, first to CO* and then to C* species. This, in combination with the high H-availability, explains the high activity, but low methanol selectivity of pure Mo2C. The addition of Cu in Mo2C with the sol–gel auto-combustion and solvothermal synthesis routes generates a high population of Mo2C–Cu+ moieties (species α′) that promote the sequential hydrogenation of CO* to HCOO* and H2COO*,46 ultimately leading to CH3OH formation. This is in agreement with the high XPS-derived concentration of Cu with valence states ≥+1 on the surface of these two catalysts. There is also creation of new low-temperature H2 activation sites, related to metallic Cu clusters on the surface, that further contribute to the enhanced methanol productivity. Among the sol–gel auto-combustion and solvothermally-prepared catalysts, Cu–Mo2C-SG has the highest absolute number of CO2 and H2 activation sites, in line with its higher activity, and the higher α′ to β′ species ratio (0.5, compared to 0.4 for Cu–Mo2C-SV), justifying its higher methanol selectivity. This confirms the notion that strong interaction between the metal and the carbide and formation of Mo2C–Cu interfaces is required for the efficient hydrogenation of CO2 to methanol. The underperformance of Cu–Mo2C-SS can be clearly related to the limited number of sites available for CO2 activation (see Table 5), which in turn can be linked to the very high amount of surface carbon and the lower exposure of Mo and Cu on the surface (see Table 3). The coverage of the active sites by carbonaceous deposits limits CO2 adsorption and further dissociation, restricting the catalytic activity of Cu–Mo2C-SS.
4. Conclusions
Pure Mo2C is an active catalyst for the hydrogenation of CO2 to CO, via the reverse water gas shift (RWGS) reaction, and CH4, via CO2 methanation at higher temperatures. Addition of 20 wt% Cu decreases the reactivity by 10–15%, but significantly enhances the methanol selectivity in the 200–250 °C range. The performance of the 20 wt% Cu–Mo2C catalyst also depends strongly on the synthesis method. Preparation with three different routes – solid state synthesis, solvothermal synthesis and sol–gel auto-combustion – leads to materials with substantial differences in reactivity. Despite the similarities in the carburization mechanism and the basic physicochemical properties, the catalyst synthesized with sol–gel auto-combustion presents the highest CO2 conversion, equal to ∼30 mol% at 325 °C and 45 bar, closely followed by the catalyst prepared solvothermally. The selectivity to methanol is also highest over the sol–gel material. Cu–Mo2C synthesized via the solid state route clearly yields a catalyst with much worse performance, both in terms of conversion and methanol selectivity.We were able to explain these differences in performance by studying the population, type and strength of sites available for CO2 and H2 activation on the catalysts' surface via physicochemical characterization and temperature programmed desorption. All the Mo2C-based catalysts contain multiple sites for non-dissociative and dissociative CO2 and H2 activation, the absolute and relative amounts of which vary considerably depending on Cu promotion and the synthesis route. Pure Mo2C presents a high number of Mo-terminated Mo2C facets that have the ability to both dissociate CO2 and activate H2. These sites bind CO2 strongly and favor its full dissociation to C* species that are eventually hydrogenated to CH4. The addition of Cu via the sol–gel auto-combustion method and the solvothermal method promotes the close interaction between Cu and Mo2C and generates Mo2C–Cu+ moieties that bind CO2 more weakly and promote its hydrogenation to CH3OH. The solid state catalyst has a limited number of such sites; this is due to extensive carbon deposition on the surface and the coverage of a large amount of these active centers.
Conflicts of interest
There are no conflicts to declare.Acknowledgements
This research has been co-financed by the European Union and Greek national funds through the Operational Program Competitiveness, Entrepreneurship and Innovation, under the call RESEARCH – CREATE – INNOVATE (project code:T1EDK-01532).References
- P. M. Cox, R. A. Betts, C. D. Jones, S. A. Spall and I. J. Totterdell, Acceleration of global warming due to carbon-cycle feedbacks in a coupled climate model, Nature, 2000, 408, 184–187 CrossRef CAS.
- N. M. Dowell, P. S. Fennell, N. Shah and G. C. Maitland, The role of CO2 capture and utilization in mitigating climate change, Nat. Clim. Change, 2017, 7, 243–249 CrossRef.
- Y. Xu, V. Ramanathan and D. G. Victor, Global warming will happen faster than we think, Nature, 2018, 564, 30–32 CrossRef CAS.
- M. B. Ansari, B. H. Min, Y. H. Mo and S. E. Park, CO2 activation and promotional effect in the oxidation of cyclic olefins over mesoporous carbon nitrides, Green Chem., 2011, 13, 1416–1421 RSC.
- M. Behrens, F. Studt, I. Kasatkin, S. Kühl, M. Hävecker, F. Abild-Pedersen, S. Zander, F. Girgsdies, P. Kurr, B. L. Kniep, M. Tovar, R. W. Fischer, J. K. Nerskov and R. Schlögl, The active site of methanol synthesis over Cu/ZnO/Al2O3 industrial catalysts, Science, 2012, 336, 893–897 CrossRef CAS.
- E. V. Kondratenko, G. Mul, J. Baltrusaitis, G. O. Larrazábal and J. Pérez-Ramírez, Status and perspectives of CO2 conversion into fuels and chemicals by catalytic, photocatalytic and electrocatalytic processes, Energy Environ. Sci., 2013, 6, 3112–3135 RSC.
- A. B. Vidal, L. Feria, J. Evans, Y. Takahashi, P. Liu, K. Nakamura, F. Illas and J. A. Rodriguez, CO2 activation and methanol synthesis on novel Au/TiC and Cu/TiC catalysts, J. Phys. Chem. Lett., 2012, 3, 2275–2280 CrossRef CAS.
- M. Bowker, Methanol Synthesis from CO2 Hydrogenation, ChemCatChem, 2019, 11, 1–10 CrossRef.
- X. Fang, Y. Men, F. Wu, Q. Zhao, R. Singh, P. Xiao, T. Du and P. A. Webley, Promoting CO2 hydrogenation to methanol by incorporating adsorbents into catalysts: Effects of hydrotalcite, Chem. Eng. J., 2019, 378, 122052–122063 CrossRef CAS.
- M. D. Porosoff, B. Yan and J. G. Chen, Catalytic reduction of CO2 by H2 for synthesis of CO, methanol and hydrocarbons: Challenges and opportunities, Energy Environ. Sci., 2016, 9, 62–73 RSC.
- A. Álvarez, A. Bansode, A. Urakawa, A. V. Bavykina, T. A. Wezendonk, M. Makkee, J. Gascon and F. Kapteijn, Challenges in the Greener Production of Formates/Formic Acid, Methanol, and DME by Heterogeneously Catalyzed CO2 Hydrogenation Processes, Chem. Rev., 2017, 117, 9804–9838 CrossRef.
- S. G. Jadhav, P. D. Vaidya, B. M. Bhanage and J. B. Joshi, Catalytic carbon dioxide hydrogenation to methanol: A review of recent studies, Chem. Eng. Res. Des., 2014, 92, 2557–2567 CrossRef CAS.
- M. Liu, Y. Yi, L. Wang, H. Guo and A. Bogaerts, Hydrogenation of Carbon Dioxide to Value-Added Chemicals by Heterogeneous Catalysis and Plasma Catalysis, Catalysts, 2019, 9, 275–312 CrossRef.
- F. Arena, G. Mezzatesta, G. Zafarana, G. Trunfio, F. Frusteri and L. Spadaro, Effects of oxide carriers on surface functionality and process performance of the Cu-ZnO system in the synthesis of methanol via CO2 hydrogenation, J. Catal., 2013, 300, 141–151 CrossRef CAS.
- P. Gao, F. Li, H. Zhan, N. Zhao, F. Xiao, W. Wei, L. Zhong, H. Wang and Y. Sun, Influence of Zr on the performance of Cu/Zn/Al/Zr catalysts via hydrotalcite-like precursors for CO2 hydrogenation to methanol, J. Catal., 2013, 298, 51–60 CrossRef CAS.
- F. Liao, Y. Huang, J. Ge, W. Zheng, K. Tedsree, P. Collier, X. Hong and S. C. Tsang, Morphology-dependent interactions of ZnO with Cu nanoparticles at the materials' interface in selective hydrogenation of CO2 to CH3OH, Angew. Chem., Int. Ed., 2011, 50, 2162–2165 CrossRef CAS.
- L. C. Grabow and M. Mavrikakis, Mechanism of Methanol Synthesis on Cu through CO2 and CO Hydrogenation, ACS Catal., 2011, 1, 365–384 CrossRef CAS.
- J. Graciani, K. Mudiyanselage, F. Xu, A. E. Baber, J. Evans, S. D. Senayake, D. J. Stacchiola, P. Liu, J. Hrbek, J. F. Sanz and J. A. Rodriguez, Highly active copper-ceria and copper-ceria-titania catalysts for methanol synthesis from CO2, Science, 2014, 345, 546–550 CrossRef CAS.
- H. Yue, Y. Zhao, S. Zhao, B. Wang, X. Ma and J. Gong, A copper-phyllosilicate core-sheath nanoreactor for carbon-oxygen hydrogenolysis reactions, Nat. Commun., 2013, 4, 1–7 Search PubMed.
- J. Wu, M. Saito, M. Takeuchi and T. Watanabe, The stability of Cu/ZnO-based catalysts in methanol synthesis from a CO2-rich feed and from a CO-rich feed, Appl. Catal., A, 2001, 218, 235–240 CrossRef CAS.
- R. B. Levy and M. Boudart, Platinum-like behavior of tungsten carbide in surface catalysis, Science, 1973, 181, 547–549 CrossRef CAS.
- M. D. Porosoff, X. Yang, J. A. Boscoboinik and J. G. Chen, Molybdenum Carbide as Alternative Catalysts to Precious Metals for Highly Selective Reduction of CO2 to CO, Am. Ethnol., 2014, 126, 6823–6827 Search PubMed.
- M. D. Porosoff, S. Kattel, W. Li, P. Liu and J. G. Chen, Identifying trends and descriptors for selective CO2 conversion to CO over transition metal carbides, Chem. Commun., 2015, 51, 6988–6991 RSC.
- S. Posada-Pérez, F. Viñes, P. J. Ramirez, A. B. Vidal, J. A. Rodriguez and F. Illas, The bending machine: CO2 activation and hydrogenation on δ-MoC(001) and β-Mo2C(001) surfaces, Phys. Chem. Chem. Phys., 2014, 16, 14912–14921 RSC.
- W. Xu, P. J. Ramirez, D. Stacchiola and J. A. Rodriguez, Synthesis of α-MoC1-x and β-MoCy catalysts for CO2 hydrogenation by thermal carburization of Mo-oxide in hydrocarbon and hydrogen mixtures, Catal. Lett., 2014, 144, 1418–1424 CrossRef CAS.
- F. Solymosi, A. Oszkó, T. Bánsági and P. Tolmacsov, Adsorption and reaction of CO2 on Mo2C catalyst, J. Phys. Chem. B, 2002, 106, 9613–9618 CrossRef CAS.
- N. M. Schweitzer, J. A. Schaidle, O. K. Ezekoye, X. Pan, S. Linic and L. T. Thompson, High activity carbide supported catalysts for water gas shift, J. Am. Chem. Soc., 2011, 133, 2378–2381 CrossRef CAS.
- J. A. Rodriguez, P. J. Ramirez, G. G. Asara, F. Viñes, J. Evans, P. Liu, J. M. Ricart and F. Illas, Charge Polarization at a Au-TiC Interface and the Generation of Highly Active and Selective Catalysts for the Low-Temperature Water-Gas Shift Reaction, Angew. Chem., Int. Ed., 2014, 53, 11270–11274 CrossRef CAS.
- X. Zhang, X. Zhu, L. Lin, S. Yao, M. Zhang, X. Liu, X. Wang, Y. Li, C. Shi and D. Ma, Highly Dispersed Copper over β-Mo2C as an Efficient and Stable Catalyst for the Reverse Water Gas Shift (RWGS) Reaction, ACS Catal., 2017, 7, 912–918 CrossRef CAS.
- J. A. Rodriguez, J. Evans, L. Feria, A. B. Vidal, P. Liu, K. Nakamura and F. Illas, CO2 hydrogenation on Au/TiC, Cu/TiC, and Ni/TiC catalysts: Production of CO, methanol, and methane, J. Catal., 2013, 307, 162–169 CrossRef CAS.
- W. Xu, P. J. Ramirez, D. Stacchiola, J. L. Brito and J. A. Rodriguez, The Carburization of Transition Metal Molybdates (MxMoO4, M= Cu, Ni or Co) and the Generation of Highly Active Metal / Carbide Catalysts for CO2 Hydrogenation, Catal. Lett., 2015, 145, 1365–1373 CrossRef CAS.
- Q. Zhang, L. Pastor-Pérez, W. Jin, S. Gu and T. R. Reina, Understanding the promoter effect of Cu and Cs over highly effective β-Mo2C catalysts for the reverse water-gas shift reaction, Appl. Catal., B, 2019, 244, 889–898 CrossRef CAS.
- J.-L. Dubois, K. Sayama and H. Arakawa, CO2 Hydrogenation over Carbide Catalysts, Chem. Lett., 1992, 21, 5–8 CrossRef.
- M. Fadoni and L. Lucarelli, Temperature programmed desorption, reduction, oxidation and flow chemisorption for the characterization of heterogenous catalysts. Theoretical aspects, instrumentation and applications, Stud. Surf. Sci. Catal., 1998, 120, 177–225 CrossRef.
- A. Hanif, T. Xiao, A. P. E. York, J. Sloan and M. L. H. Green, Study on the Structure and Formation Mechanism of Molybdenum Carbides, Chem. Mater., 2002, 14, 1009–1015 CrossRef CAS.
- A. Zhang, A. Zhu, B. Chen, S. Zhang, C. Au and C. Shi, In-situ synthesis of nickel modified molybdenum carbide catalyst for dry reforming of methane, Catal. Commun., 2011, 12, 803–807 CrossRef CAS.
- E. T. Liakakou and E. Heracleous, Transition metal promoted K/Mo2C as efficient catalyst for CO hydrogenation to higher alcohols, Catal. Sci. Technol., 2016, 6, 1106–1119 RSC.
- K. Xiong, G. Zhou, H. Zhang, Y. Shen, X. Zhang, Y. Zhang and J. Li, Bridging Mo2C-C and highly dispersed copper by incorporating N-functional groups to greatly enhance the catalytic activity and durability for carbon dioxide hydrogenation, J. Mater. Chem. A, 2018, 6, 15510–15516 RSC.
- J. G. Choi and L. T. Thompson, XPS study of as-prepared and reduced molybdenum oxides, Appl. Surf. Sci., 1996, 93, 143–149 CrossRef CAS.
- X. Li, L. Feng, L. Zhang, D. B. Dadyburjor and E. L. Kugler, Alcohol synthesis over pre-reduced activated carbon-supported molybdenum-based catalysts, Molecules, 2003, 8, 13–30 CrossRef CAS.
- M. Lv, W. Xie, S. Sun, G. Wu, L. Zheng, S. Chu, C. Gao and J. Bao, Activated-carbon-supported K-Co-Mo catalysts for synthesis of higher alcohols from syngas, Catal. Sci. Technol., 2015, 5, 2925–2934 RSC.
- J. F. Moulder, W. F. Stickle, P. E. Sobol and K. D. Bomben, Handbook of X-ray photoelectron spectroscopy: A reference book of standard spectra for identification and interpretation of XPS data, Physical Electronics Division, Perkin-Elmer Corp, Eden Prairie Minn, 1992 Search PubMed.
- E. T. Liakakou, M. A. Isaacs, K. Wilson, A. F. Lee and E. Heracleous, On the Mn promoted synthesis of higher alcohols over Cu derived ternary catalysts, Catal. Sci. Technol., 2017, 7, 988–999 RSC.
- K. J. Leary, J. N. Michaels and A. M. Stacy, Carbon and oxygen atom mobility during activation of Mo2C catalysts, J. Catal., 1986, 101, 301–313 CrossRef CAS.
- Y. Chen, S. Choi and L. T. Thomson, Low temperature CO2 hydrogenation to alcohols and hydrocarbons over Mo2C supported metal catalysts, J. Catal., 2016, 343, 147–156 CrossRef CAS.
- S. Posada-Pérez, P. J. Ramírez, R. A. Gutiérrez, D. J. Stacchiola, F. Viñes, P. Liu, F. Illas and J. A. Rodriguez, The conversion of CO2 to methanol on orthorhombic β-Mo2C and Cu/β-Mo2C catalysts: Mechanism for admetal induced change in the selectivity and activity, Catal. Sci. Technol., 2016, 6, 6766–6777 RSC.
- G. Zhou, B. Dai, H. Xie, G. Zhang, K. Xiong and X. Zheng, CeCu composite catalyst for CO synthesis by reverse water-gas shift reaction: Effect of Ce/Cu mole ratio, J. CO2 Util., 2017, 21, 292–301 CrossRef CAS.
- T. Wang, Y. W. Li, J. Wang, M. Beller and H. Jiao, Dissociative hydrogen adsorption on the hexagonal Mo2C phase at high coverage, J. Phys. Chem. C, 2014, 118, 8079–8089 CrossRef CAS.
- Y. Liu, J. Ding, J. Bi, Y. Sun, J. Zhang, K. Liu, F. Kong, H. Xiao and J. Chen, Effect of Cu-doping on the structure and performance of molybdenum carbide catalyst for low-temperature hydrogenation of dimethyl oxalate to ethanol, Appl. Catal., A, 2017, 529, 143–155 CrossRef CAS.
- L. Álvarez-Falcón, F. Viñes, A. Notario-Estévez and F. Illas, On the hydrogen adsorption and dissociation on Cu surfaces and nanorows, Surf. Sci., 2016, 646, 221–229 CrossRef.
Footnote |
| † Electronic supplementary information (ESI) available. See DOI: 10.1039/d0cy02021d |
| This journal is © The Royal Society of Chemistry 2021 |

